Abstract
Tires are important for the transmission of forces, good traction of the vehicle, and safety of the passengers. Tires also influence vehicle fuel consumption and cause tire and road wear pollution to the environment in the form of microplastics. In the United States, the Uniform Tire Quality Grading (UTQG) for tread wear is reported on the tire sidewall and is used as an indicator of the expected service life of a tire. In Europe, a similar approach that applies tread depth reduction measurements and projection to the minimum tread depth is under discussion. Tread depth measurements will be carried out in parallel with abrasion measurements over the recently introduced abrasion rate test in the United Nations regulation 117. Testing is carried out with an on-road convoy method accompanied by a vehicle fitted with reference tires to minimize the influence of external parameters. In this brief review, we start with a short historical overview of the methods that have been applied so far for the measurement of tire service life. Based on the limited publicly available data, we calculate the average tread depth reduction per distance driven for summer and winter tires fitted both in the front and rear axles of passenger cars (1–1.2 mm for front wheels and 0.5–0.6 mm for rear wheels per 10,000 km). We theoretically estimate the tread mass loss per mm of tread depth reduction (250 g per 1 mm tread depth reduction, depending on the tire size) and we compare the values to experimental data obtained in recent campaigns. We give estimations of the tire service life as a function of the tread wear UTQG (100 times the indicated tread wear rating). We also discuss the projected service life using tread depth reduction and mass loss.
Keywords:
tire; tread; abrasion rate; convoy method; reference tire; mileage; service life; durability; UTQG 1. Introduction
The tire supports the vertical load and develops longitudinal forces for acceleration and braking and lateral forces for cornering. The tread is the part of the tire in contact with the road and is expected to provide good traction, high fuel economy, good wear and damage resistance, and, thus, a long service life [1]. The tread plays a key role in the transmission of forces. The tread design is also very important for the dissipation of road water and consequently passengers’ safety [2,3]. Furthermore, the tread design has an impact on the noise generated. A long service life of tread means less need for substituting the tire and thus less waste generated [4,5,6]. Thus, for all the above mentioned reasons, it is of no surprise that tread is subject of research, both experimental and theoretical by means of simulations [7,8,9,10].
Tread depth is the vertical distance between the top of the tread rubber to the bottom of the tire’s grooves. Although no standardized method exists, it is typically measured in mm or 32nds of an inch in the main grooves with tire tread depth gauges. Passenger car tires are typically produced with an 8 mm (or 10/32″) original tread depth. Dedicated winter/snow tires and light truck tires are typically deeper. Maintaining proper tire tread depth is essential for maintaining good traction, braking performance, and cornering stability, especially with rain, snow and ice. Directive 89/449 [11] introduced a minimum depth in the main grooves of the tread surface of at least 1.6 mm. Practically, this means that the tire shall not be allowed to circulate when its depth reaches below this value. For winter tires, the limit is typically 3–4 mm, depending on the country [12]. Tread wear indicators (TWIs), spaced evenly through the main grooves in the tire tread and displayed with a small arrow on the sidewall of the tire and the letters “TWI”, indicate whether the tread has reached its minimum depth.
This mini narrative review summarizes studies from the 19th century until today on tread depth reduction. The main aim of this paper is to find correlations between tread depth reduction, tire mass loss, and distance traveled. How this information can be used to estimate a projected tire service life index is also discussed. Due to the limited amount of information regarding airborne particulate matter (PM), tread depth and PM associations are not covered here [13,14].
2. Background
2.1. The 19th Century
Pneumatic, i.e., air-filled, tires appeared at the second half of the 18th century for bicycles. At the end of the 18th century, they evolved to become suitable for vehicles, with key developments described in a review paper from 1932 [15]. Although safety was (and is) always a major concern, the “tire-life period”, as mentioned in that review (the term “service life” will be used from now on), was of importance mainly for trucks and rail cars. Nevertheless, already at the beginning of the 1900s, only a few passenger car tires could be sold with a service life guarantee of 6000 miles (9656 km). On-road tests in that era focused on electric consumption, using different tires on an electric vehicle following the same route [16]. Research in the 1930s already demonstrated the impact of tire material, ambient temperature, and road conditions (material and curves) on the tire service life period [15]. A paper in 1944 demonstrated that mass loss could be used to assess tire quality and the impact of various parameters (e.g., tires misalignment) on the tire or even to predict the service life of the tire [17]. In that study, a “reference” tire was also used. In the 1950s, research on factors influencing tire wear (material, axle, storage and aging, weather) further supported mass loss measurement versus tread depth reduction, especially for tires of different design [18]. It was found that while tires were losing weight at a constant rate, the tread grooves were decreasing at a declining rate [19]. Another study in the 1950s, based on results gathered during 2.5 years, demonstrated that the log-log graph of tread depth loss versus mileage was linear [20].
With the wide spread of automobiles from the middle of the 19th century onwards [21,22], the service life of tires regained attention. Experimental and/or theoretical research focused on tread depth reduction and mileage (i.e., service life) [23]. A survey in 1965 found that wear was the second most important factor in consumers’ tire selection (after good value) [24]. The possibility of carrying out service life tests in a laboratory (drum method) was intriguing, as it is independent of weather conditions and has better repeatability. However, the correlation with tire tread wear on the road was not satisfactory [24]. The debate continued in the next decades [25] and goes on until today [26]. Research with the on-road method further confirmed the influence of the weather, road material and its moisture (wetness), road profile, traffic, vehicle alignment, tire pressure, and driver behavior [24]. The same tires in different areas had average estimated service lives between 19,500 (31,382 km) and 29,000 miles (46,671 km) (an approximately 20% difference from the mean value) [24]. However, in the same area, the variability was even higher (by a factor of two). The basic principle of the proposed on-road methodology at the time [24] was quite similar to the one proposed 25 years earlier [17], and, more impressively, it was very similar to the one used today, 55 years later [27]: a convoy of vehicles including a “reference” tire (sometimes called “monitor” or “control” tire).
2.2. Uniform Tire Quality Grading (UTQG) for Tread Wear
Early in the 1970s, studies in the United States focused on the development of a tread wear classification test procedure [28,29,30]. The main factors impacting the tire wear were categorized depending on the (i) tire; (ii) vehicle; (iii) road; (iv) driver behavior; and (v) environment [25,28]. This categorization also applies today [27,31,32]. One concern about using control tires was that, depending on the test severity, the evaluated tire could have a better or worse wear service life than the control tire [33]. It was argued that tread wear can be theoretically predicted based on the tire force energy, road surface abrasiveness, tire force-slip characteristics, and tread compound wear characteristics [33]. At the end of the 1970s, the Department of Transportation (DOT) and National Highway Traffic Safety Administration (NHTSA) created the Uniform Tire Quality Grade (UTQG) ratings for tread wear, traction, and temperature resistance based on on-road testing [34,35].
Tire performance is evaluated on a specific roadway circuit (400 miles (644 km) in length) with a convoy. One vehicle is fitted with four “monitor” tires and the other(s) with four “candidate” tires. After a “break-in” distance of 800 miles (1287 km), the tread depths of each tire are measured. The circuit is repeated 16 times (6200 miles or 9978 km) and the tread depths are measured again. After every circuit, the tires are rotated and, optionally, the tread depths are measured. After every second circuit, the wheels are aligned and the last vehicle in the convoy moves to the lead position. After every fourth circuit, the complete set of four tires is fitted to the next vehicle. The wear rate of the candidate tires (slope of tread depth reduction) to the monitor tires gives the severity adjustment factor, which corrects the estimated projected mileage of the candidate tires. The tread wear grading is calculated from the projected mileage and the “monitor” tires’ wear rate from the last year.
After the introduction of the UTQG tread wear classification in procedures in the United States, the publicly available research on the topic decreased. The topic re-emerged at the beginning of the 2000s, with the scope of improving tire fuel efficiency. The analysis of tire ratings showed that tires with higher tread depth had higher tread wear rating, and tires rated for higher speeds tended to have lower tread wear grades [36]. Recent studies tried to correlate the rating of tread wear with mass loss (abrasion rate) or particulate matter (PM) mass < 10 μm and particle number (PN) emissions, but no clear correlation could be found, even for tires of the same size [37,38,39,40]. It should be added, though, that the tread wear rating should be a function of both tread mass loss and total available tread depth.
2.3. Tire Labeling
In the EU, Regulation (EU) 2020/740 on tire labeling includes rolling resistance, wet grip, and noise [41]. According to a 2019 study [42], after grip, tire service life, price, and fuel efficiency were in second place for consumer choice of tires, with similar percentages. The environmental aspect (abrasion) was of low priority for the consumers. These results are not surprising, as service life, rolling resistance, and price have a clear economic impact for the consumer. Thus, a rating indicator for the abrasion of tires would most likely have no influence on consumers’ purchase choice. On the other hand, a combined rating indicator with a weighted mix of service life and abrasion rate would better orient consumers towards tires that are more sustainable in both aspects. For this reason, Regulation (EU) 2020/740 on tire labeling includes a provision to include information on tire abrasion and service life on the tire label as soon as appropriate methods to determine them are available. The initial idea is to use tread depth reduction measurements carried out over regulated on-road tire abrasion rate tests (8000 km), and projections to the minimum legal depth will provide indications of the tire’s service life. Such an approach has already been used in the past and is currently used in the United States with the tread wear UTQG.
3. Correlation Results
3.1. Tread Wear UTQG and Mileage Warranty
Figure 1a plots tire manufacturers’ mileage warranties as a function of the tread wear index. The data are based on data published in 2003 [43], 2022 [44], and 2023 [45] and on our own compilation of mileage warranties from six tire manufacturers [46,47,48,49,50,51,52] and tread wear indices as reported on their web pages in 2022 [53]. A document with extensive ratings of many tire manufacturers was published by NHTSA in 2024 [54]. Although the scatter is high, the trend is relatively clear, and a rough approximation is that the service life in miles equals 100 times the tread wear rating. The exact slope of the linear regression of all data forcing through zero is 102, with R2 = 0.7. One standard deviation of the difference between the warranty and the approximation is 7600 miles (12,231 km) (or 14%).
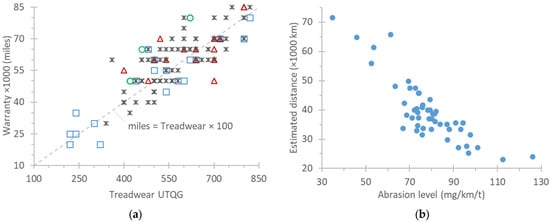
Figure 1.
Estimated tire service life (a) based on tread wear index and reported mileage warranties from tire manufacturers (green circles from [43], blue squares from [44], red triangles from [45], gray asterisks from our own compilation (see details in text); (b) based on reduction in tread depth of fifty 205/55 R16 summer tires tested by ADAC [55].
3.2. Tread Depth Reduction and Projected Service Life
Following a similar approach, a study from the General German Automobile Club (Allgemeiner Deutscher Automobil-Club, ADAC) on 50 205/55 R16 summer tires [55] estimated the expected tire mileage based on tread depth reduction at 15,000 km and extrapolating it to the minimum tread depth (1.6 mm) (Figure 1b). The route consisted of 55% rural and 40% motorway roads, with the remaining 5% mainly representing urban conditions. It is well known that the route and the driving style have an impact on the tire abrasion rate [32,56] and, consequently, on the service life of the tire. The average value of the 50 tires’ service life was 40,000 km, with one standard deviation of 10,000 km. Data collected between 2006 and 2011 from 5000 passenger car tires (205/55 R16) from four tire manufacturers fitted on front-wheel-drive vehicles of the same model gave an average service life of 37,000 ± 6000 km for front tires and 64,000 ± 8500 km for rear tires [57]. Experience shows that a typical passenger car tire usually lasts for 40,000 km; budget tires last 10,000 km less, while premium tires 5000 km more [58]. A study conducted at the end of 1990s with two tires found a median value of around 34,000 km, with the 10th and 90th percentiles ranging from 19,000 km to 55,000 km [31]. These values are of the same order as those reported in the 1950s (25,000 miles (40,234 km) to 50,000 miles (80,467 km) depending on the tire and the temperature) [20] or 1960s (mean around 25,000 miles (40,234 km) with a range from 10,000 miles (16,093 km) up to 70,000 miles (112,654 km)) [24]. In the United States, between 1981 and 2001, the service life of light-duty tires increased from about 28,000 miles (45,062 km) to 43,000 miles (69,202 km) [43]. In Figure 1a, the average tread wear UTQG is 560, which corresponds to 56,000 miles (90,123 km) manufacturers’ warranty. This is more than two times longer than the 40,000 km estimated for European tires. Although it is not known whether this average of a 56,000-mile service life is also the mean or median for tires in the United States, the addition of the tread wear index in the regulation might have resulted in more wear-resistant tires compared to other parts of the world.
3.3. Distance Traveled per mm Tread Depth Reduction
Table 1 summarizes studies that measured tread depth and/or mass loss as a function of distance traveled [59,60,61,62,63,64,65,66,67,68,69]. Only on-road studies were considered, i.e., no tests in proving ground or in the laboratory, in order to best represent real-life conditions to the greatest extent possible. The latest data (2019+) were converted to tread depth loss per distance and are plotted in Figure 2a. When data for both front (blue circles) and rear axles (green triangles) were available, they are also provided; in this case, their average is also plotted as “all wheels” value (red squares). Data from summer (middle) and a few winter tires (right side) are plotted separately. The “all wheels” averages (left side) are data from a few studies that reported the sum of mass loss and tread depth for all four wheels (i.e., a vehicle-based calculation without separating into axles). The three (red squares) all-wheel values range from 0.78 to 1.16 mm/10,000 km, with an overall average value of 1 mm tread depth reduction for every 10,000 km.

Table 1.
Tread depth reduction and tire mass loss from various on-road studies.
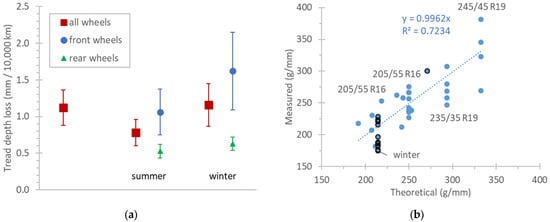
Figure 2.
Overview of Table 1 data (2019+): (a) tread depth reduction as a function of distance driven for front, rear, or all four wheels. Separate values for summer and winter tires are provided when available; (b) theoretical and experimental mass loss per mm of tread depth reduction.
A statistical analysis of 600,000 inspection records of vehicles that had at least three records (i.e., data for consecutive years) estimated a tread wear of 1.5–2 mm/10,000 km in Pennsylvania in the United States [2]. Another study on misaligned wheels found wear values of around 3 mm/10,000 km [59]; however, this value is not directly comparable since misalignment differs from one vehicle to another. Older studies from the 1980s reported values of around 0.8–1.0 mm per 10,000 km [61], but on many occasions, higher values were reported when the driving was more aggressive [60]. Another study reported that two routes had a ratio of 1.6 in wear rates [70]; higher wear was found for the route with a higher percentage of curves and hilly roads and an abrasive road material.
As Figure 2a plots, the wear rate is higher on the front axle (all studies were conducted with front-wheel drive vehicles). The average ratio of front-to-rear tread depth reduction was 2.0 (summer) and 2.6 (winter tires). This value is in agreement with the ratios of the mass loss of front and rear tires, which basically range from 1.5 to 3.0 [66,71,72].
The reduction in the tread depth of winter tires was 50% higher than that of summer tires for front wheels (20% for rear wheels). However, this ratio depends on the specific tires that were tested. A wide range of differences between summer and winter tires has been reported in the literature based on tire mass loss: winter tires had higher abrasion rates, ranging from 5% higher up to higher by a factor of 3 [68,71,73,74]. When considering most market tires, the differences between winter and summer tires tend to be small.
3.4. Mass Loss per mm of Tread Depth Reduction
Figure 2b plots the measured versus the expected mass loss per mm tread depth reduction. The tire categories are also indicated on the plot. The theoretical calculations and assumptions are described in Appendix A. On average, there is an acceptable agreement between theoretical and experimental results (slope > 0.99), considering that many of the assumed values were not available and fixed values were used for all tires. However, the scatter (11%; one standard deviation of the differences or R2 = 0.72) indicates that the tread depth reduction cannot be used as an alternative to the actual measurement of the mass loss of a tire.
A tread depth reduction of 1 mm has an uncertainty of ±10% (typical accuracy ±0.1 mm). For a larger tire, 1 mm would correspond to a higher mass loss (400 g) and lower uncertainty (0.5%). The tread depth uncertainty extrapolates to a large error for the tire service life. In Figure 3, a theoretical example is given: after 8000 km, the tread depth was reduced from 4.8 mm to 4 mm. Extrapolating the remaining tread depth to 1.6 mm (the minimum allowed), the service life is calculated to be 32,000 km. A ±0.1 mm measurement error resulted in approximately ±13% error (−3700 km or +4500 km) in the projected service life. The tread depth measurement uncertainty is even higher when the tread depth is irregular and an average value of many points needs to be calculated. It also becomes higher when four tires need to be taken into account, as the front and rear will have different wear rates. Finally, while the abrasion rate seems to stabilize after 8000 km, this is not necessarily the case for the tread depth reduction, where double distance might be needed [67]. The tread wear UTQG procedure prescribes 7200 miles (11,587 km) [35]. It should also be reiterated that the procedure uses the tread depth measurements after a break-in period of 800 miles (1287 km). In Figure 3, an example is given where the projected service life is calculated after a break-in period of 2000 km (red line). In this theoretical example, the tread wear was high in the first 2000 km (0.4 mm), resulting in a projected service life of 44,000 km using the measurements at 2000 km and 8000 km. For the calculations, usually, the average tread depth measured around the wheel and 3–4 grooves is used. However, as the regulation requires that all TWIs be >1.6 mm, the minimum of all measurements should be used when trying to estimate the service life. Furthermore, it must be reiterated that testing in parallel with a reference tire has the advantage that the impact of external influencing factors is minimized.
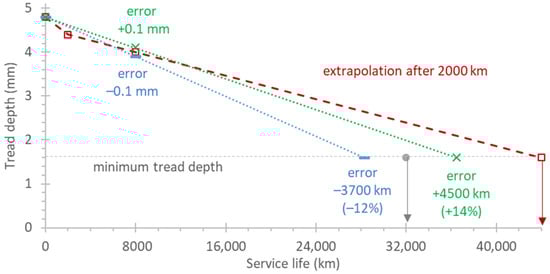
Figure 3.
Expected error of service life estimation based on ±0.1 mm uncertainty of tread depth measurement (green and blue lines) and measurements at 0 km and 8000 km. In this example, the service life is estimated using the measurements at 2000 km (after break-in) and 8000 km.
The measurement of 200 g has an uncertainty of ±1% (typical scale accuracy ±2 g); thus, mass loss may be better in predicting the tire service life, if such information is available. In this case, the extrapolation is performed with the theoretical maximum mass loss when reaching the minimum tread depth. The main assumption is that the total tread volume can be worn until the minimum tread depth. This might not be true if the wear is irregular. In such cases, one of the main grooves may reach the minimum tread depth value of 1.6 mm while the rest are still higher, and consequently, a prediction based on mass would not be accurate. The main difficulty with the mass method is the lack of data (initial mass of the tread) and the difficulty in verifying it, even if this information were available from the tire manufacturer. However, this study may trigger further investigation into how mass could be used for predicting tire service life. An older study from 1985 found differences of around 10–20% in estimating tire service life with groove or weight loss measurements [75].
4. Conclusions
The tire tread is designed to provide good traction, high fuel economy, low wear, high damage resistance, and a long service life. Price, fuel economy, and service life are the second most important tire selection parameters for the consumer after good traction (safety). In the United States, the tread wear rating gives an indication of the expected service life. In this review, we estimated that the service life (in miles) equals approximately 100 times the indicated tread wear rating. In Europe, work is ongoing to define a similar metric based on the method for measuring tire abrasion newly introduced in the United Nations regulation 117. The projected service life based on tread depth reduction has a higher uncertainty than that based on mass loss. The reason is that mass can be measured with higher accuracy than tread depth, and the progression of the two metrics is not always linear. Similar proposals were already discussed in the 1940s. Although tire mass loss is currently measured and regulated, there are practical difficulties in also applying this method for the prediction of tire service life. Thus, the methodology based on tread depth reduction seems the most plausible. The parallel use of a reference tire is necessary in order to minimize the impact of external influencing factors. The data found in the literature are not enough for the proposal of a methodology, and thus, dedicated studies are necessary. Furthermore, whether mass could be used for predicting tire service life needs further investigation. Nevertheless, the European method will most likely have similarities with the approach of the Uniform Tire Quality Grading (UTQG) developed in the United States. The abrasion index and service life index may be used in tire labeling in Europe in the future. The (normalized) classification of tires into categories is a better approach compared to an estimated service life in km, which depends on many parameters (road surface, vehicle weight, driving style, etc.) and will be different for each driver.
A European study of 50 tires indicated an average tire service life of 40,000 km with one standard deviation of 10,000 km. Based on studies in the literature, one mm of tread depth reduction corresponds to approximately a 10,000 km distance driven. The value is 1–1.2 mm for front wheels and 0.5–0.6 mm for rear wheels, for front-wheel-drive vehicles. These values are based on routes consisting mainly of rural and motorway driving and do not account for urban driving, which is more correlated to higher tire abrasion. The same tread depth reduction is expected to correspond to lower distance in urban driving and/or dynamic driving and misaligned vehicles. Finally, we estimated 250–350 g mass loss per 1 mm tread depth reduction, depending on the tire size.
Author Contributions
Conceptualization, B.G. and T.G.; formal analysis, B.G.; writing—original draft preparation, B.G.; writing—review and editing, C.F. and T.G. All authors have read and agreed to the published version of the manuscript.
Funding
This research received no external funding.
Data Availability Statement
Data are contained within the article.
Acknowledgments
The authors would like to acknowledge P. Le Lijour and J. M. Crochemore for the tread depth and weight measurements in our study.
Conflicts of Interest
The authors declare no conflicts of interest.
Appendix A
A tread pattern consists of grooves, ribs, and blocks (or lugs) (Figure A1a). For example (Figure A1b), 205/65 R16 means a tire with a design “section” width b = 205 mm, an aspect ratio (distance between the wheel and the edge of the tire to the tire design width) h = 65%, radial R construction, and a rim size (internal diameter of tire) d = 16 inches. The actual contact width c is smaller than the tire section width.

Figure A1.
Tire characteristics: (a) tread design characteristics; (b) tire nomenclature and symbols used in the text.
Figure A1.
Tire characteristics: (a) tread design characteristics; (b) tire nomenclature and symbols used in the text.

The tread mass loss Δm (g) can be calculated from the reduction in tread volume ΔV (cm3), taking into account the tread density ρ (g/cm3).
where the volume is calculated from the wheel diameter w (cm) and the contact width c (cm). Assuming a void area ratio v (%) and a tread depth reduction of t (mm), then, as a proxy for the void volume ratio [76],
Δm = ρ ΔV,
ΔV = Vstart − Vend = (1 − v) [1/4 π w2 c − 1/4 π (w − t/10)2 c]
ΔV = (1 − v) k b 1/4 π [2 w (t/10) − (t/10)2]
For the accurate determination of mass loss, information about density ρ, actual contact width c, and void ratio v is needed. The values we used are based on typical values in the literature.
Tread density: We assumed ρ = 1.15 g/cm3 based on values used in the literature: 1.1 [77] and 1.14–1.20 g/cm3 [39,40,78]. Values below 0.8 g/cm3 have also been reported [79].
Contact width: We assumed a ratio of actual contact width c and design “section” width b of k = 80% (i.e., c = 80% b) based on the following studies: For 205/55 R16, the contact width was approximately 170 mm (i.e., 75% of tire section width) [80]. For a 225/50 ZR17 tire, the contact width was approximately 180 mm (80% of tire section width) [64]. Another study reported a ratio of 90% (no measurements) [81]. Our measurements of seven tires found values between 72% and 86%. The average of all 10 values gave 80%. It should be added that the value depends on the load and the tire pressure, e.g., [82,83]. A commonly used equation for contact width is [84]
c = (1.075 − 0.005 h) b1.001
For a 205/55 tire, the contact width ratio is calculated as 80%.
Void area ratio: We assumed v = 30%. Based on the analysis of figures in studies, a value around 25% was calculated [85,86,87]. Only one study mentioned a lower value (15%) [81], while others have reported much higher values, at 30–40% [88]. Another study [66] found an average of 36% (range 23–46%), with no difference between summer and snow tires. We measured a value of around 25% based on our measurements of five tires. Two winter tires had 5–10% higher values. We also assumed that the void surface area ratio and the void volume ratio (which includes the tread depth) are equivalent.
References
- Rodgers, B. Tire Engineering: An Introduction; CRC Press: Boca Raton, FL, USA, 2020; ISBN 978-1-00-302296-1. [Google Scholar]
- Krishnappa, V.; Matthews, H.S.; Liu, Y. Data-Driven Analysis to Support Revised Tire Tread Inspection Standards. Transp. Res. Rec. 2019, 2673, 517–528. [Google Scholar] [CrossRef]
- Pomoni, M. Exploring Smart Tires as a Tool to Assist Safe Driving and Monitor Tire–Road Friction. Vehicles 2022, 4, 744–765. [Google Scholar] [CrossRef]
- Castañón, A.M.; Sanmiquel, L.; Bascompta, M.; Vega Y De La Fuente, A.; Contreras, V.; Gómez-Fernández, F. Used Tires as Fuel in Clinker Production: Economic and Environmental Implications. Sustainability 2021, 13, 10455. [Google Scholar] [CrossRef]
- Soprych, P.; Czerski, G.; Grzywacz, P. Studies on the Thermochemical Conversion of Waste Tyre Rubber—A Review. Energies 2023, 17, 14. [Google Scholar] [CrossRef]
- Giechaskiel, B.; Grigoratos, T.; Dilara, P.; Franco, V. Environmental and Health Benefits of Reducing Tyre Wear Emissions in Preparation for the New Euro 7 Standard. Sustainability 2024, 16, 10919. [Google Scholar] [CrossRef]
- Schütte, J.; Sextro, W. Tire Wear Reduction Based on an Extended Multibody Rear Axle Model. Vehicles 2021, 3, 233–256. [Google Scholar] [CrossRef]
- Löwer, J.; Wagner, P.; Unrau, H.-J.; Wies, B.; Gauterin, F. Model for the Pattern-Dependent Wet Grip Prediction of Tires. Vehicles 2021, 3, 84–110. [Google Scholar] [CrossRef]
- Ha, J.U.; Bae, S.H.; Choi, Y.J.; Lee, P.-C.; Jeoung, S.K.; Song, S.; Choi, C.; Lee, J.S.; Kim, J.; Han, I.S. Control of Tire Wear Particulate Matter Through Tire Tread Prescription. Polymers 2023, 15, 2795. [Google Scholar] [CrossRef]
- Iliopoulos, I.A.; Sakellariou, J.S. Remaining Useful Life Estimation of Hollow Worn Railway Vehicle Wheels via On-Board Random Vibration-Based Wheel Tread Depth Estimation. Sensors 2024, 24, 375. [Google Scholar] [CrossRef]
- Council Directive 89/459. On the Approximation of the Laws of the Member States Relating to the Tread Depth of Tyres of Certain Categories of Motor Vehicles and Their Trailers. Off. J. Eur. Union 1989, L226, 1. [Google Scholar]
- European Consumer Centres Network Winter Tires Within Europe, in Iceland and Norway. 2019. Available online: https://www.europe-consommateurs.eu/fileadmin/Media/PDF/publications/etudes_et_rapports/Etudes_EN/Winter_tires_within_Europe.pdf (accessed on 24 February 2025).
- Kunze, M.; Feißel, T.; Ivanov, V.; Bachmann, T.; Hesse, D.; Gramstat, S. Analysis of TRWP Particle Distribution in Urban and Suburban Landscapes, Connecting Real Road Measurements with Particle Distribution Simulation. Atmosphere 2022, 13, 1204. [Google Scholar] [CrossRef]
- Li, J.; Zhang, M.; Ge, Y.; Wen, Y.; Luo, J.; Yin, D.; Wang, C.; Wang, C. Emission Characteristics of Tyre Wear Particles from Light-Duty Vehicles. Atmosphere 2023, 14, 724. [Google Scholar] [CrossRef]
- Darrow, B. Pneumatic Tires-Old and New; SAE International: Warrendale, PA, USA, 1932; p. 320021. [Google Scholar]
- Pearson, H.C. Rubber Tires and All about Them: Pneumatic, Solid, Cushion, Combination, for Automobiles, Omnibuses, Cycles, and Vehicles of Every Description; The India Rubber Publishing Company: New York, NY, USA, 1906; ISBN 978-1-104-90134-9. [Google Scholar]
- Roth, F.; Holt, W. Measuring the Rate of Wear of Tire Treads. J. Res. Natl. Bur. Stand. 1944, 32, 61–65. [Google Scholar]
- Mandel, J.; Steel, M.N.; Stiehler, R.D. Tread Wear of Tires. Influence of Type of Rubber and Black. Ind. Eng. Chem. 1951, 43, 2901–2908. [Google Scholar] [CrossRef]
- Stiehler, R.D.; Steel, M.N.; Mandel, J. Some Factors Influencing the Road Wear of Tires. Rubber Chem. Technol. 1952, 25, 656–668. [Google Scholar] [CrossRef]
- Stechert, D.; Bolt, T. Evaluation of Tread Wear. Anal. Chem. 1951, 23, 1641–1646. [Google Scholar] [CrossRef]
- Rodrigue, J.-P. The Geography of Transport Systems, 5th ed.; Routledge: Abingdon, UK; New York, NY, USA, 2020; ISBN 978-0-429-34632-3. [Google Scholar]
- Williams, I.D.; Blyth, M. Autogeddon or Autoheaven: Environmental and Social Effects of the Automotive Industry from Launch to Present. Sci. Total Environ. 2023, 858, 159987. [Google Scholar] [CrossRef]
- Grosch, K.A.; Schallamach, A. Tyre Wear at Controlled Slip. Wear 1961, 4, 356–371. [Google Scholar] [CrossRef]
- Campbell, K.L. Determination of Passenger Car Tire Performance Levels—Treadwear; SAE International: Warrendale, PA, USA, 1969; p. 690507. [Google Scholar]
- Schuring, D. Rating Traction and Wear—A Review; SAE International: Warrendale, PA, USA, 1973; p. 730145. [Google Scholar]
- Hesse, D.; Feißel, T.; Kunze, M.; Bachmann, E.; Bachmann, T.; Gramstat, S. Comparison of Methods for Sampling Particulate Emissions from Tires Under Different Test Environments. Atmosphere 2022, 13, 1262. [Google Scholar] [CrossRef]
- Giechaskiel, B.; Grigoratos, T.; Mathissen, M.; Quik, J.; Tromp, P.; Gustafsson, M.; Franco, V.; Dilara, P. Contribution of Road Vehicle Tyre Wear to Microplastics and Ambient Air Pollution. Sustainability 2024, 16, 522. [Google Scholar] [CrossRef]
- Brenner, F.C.; Kondo, A. Research for a Uniform Quality Grading System for Tires. IV. Tread Wear. Rubber Chem. Technol. 1971, 44, 106–121. [Google Scholar] [CrossRef]
- Brenner, F.C.; Kondo, A.; Cohen, G.B. Research for a Uniform Quality Grading System for Tires V. Effect of Environment on Tread Wear Rate. Rubber Chem. Technol. 1971, 44, 952–959. [Google Scholar] [CrossRef]
- Kondo, A.; Brenner, F.C. Research for a Uniform Quality Grading System for Tires VI. Comparison of the Effect of Front and Rear Wheel Drive Vehicles on Projected Tread Wear of a Tire. Rubber Chem. Technol. 1971, 44, 960–961. [Google Scholar] [CrossRef]
- Maître, O.L.; Süssner, M.; Zarak, C. Evaluation of Tire Wear Performance; SAE International: Warrendale, PA, USA, 1998; p. 980256. [Google Scholar]
- Jekel, M. Scientific Report on Tyre and Road Wear Particles, TRWP, in the Aquatic Environment; European TRWP Platform: Berlin, Germany, 2019. [Google Scholar]
- Bergman, W.; Crum, W.B. New Concepts of Tire Wear Measurement and Analysis; SAE International: Warrendale, PA, USA, 1973; p. 730615. [Google Scholar]
- NHTSA. The Pneumatic Tire; Gent, A., Walter, J., Eds.; National Highway Traffic Safety Administration: Washington, DC, USA, 2006. [Google Scholar]
- CFR (Code of Federal Regulations) 49 CFR § 575.104—Uniform Tire Quality Grading Standards. 2023. Available online: https://www.law.cornell.edu/cfr/text/49/575.104 (accessed on 24 February 2025).
- National Research Council (U.S.) (Ed.) Tires and Passenger Vehicle Fuel Economy: Informing Consumers, Improving Performance. Special Report/Transportation Research Board of the National Academies; Transportation Research Board: Washington, DC, USA, 2006; ISBN 978-0-309-09421-4. [Google Scholar]
- Grigoratos, T.; Gustafsson, M.; Eriksson, O.; Martini, G. Experimental Investigation of Tread Wear and Particle Emission from Tyres with Different Treadwear Marking. Atmos. Environ. 2018, 182, 200–212. [Google Scholar] [CrossRef]
- Lee, S.; Lee, S.; Kim, Y.; Choi, Y.; Woo, S.H. Effect of Tire Treadwear Rate on the Physical Characterization of Tire Wear Particles in Laboratory Measurements. KOSAE 2019, 35, 741–756. [Google Scholar] [CrossRef]
- Chang, X.; Huang, H.; Jiao, R.; Liu, J. Experimental Investigation on the Characteristics of Tire Wear Particles Under Different Non-Vehicle Operating Parameters. Tribol. Int. 2020, 150, 106354. [Google Scholar] [CrossRef]
- Woo, S.-H.; Jang, H.; Mun, S.-H.; Lim, Y.; Lee, S. Effect of Treadwear Grade on the Generation of Tire PM Emissions in Laboratory and Real-World Driving Conditions. Sci. Total Environ. 2022, 838, 156548. [Google Scholar] [CrossRef] [PubMed]
- European Parliament. European Commission Regulation (EU) 2020/740 of the European Parliament and of the Council of 25 May 2020 on the Labelling of Tyres with Respect to Fuel Efficiency and Other Parameters, Amending Regulation (EU) 2017/1369 and Repealing Regulation (EC) No 1222/2009. Off. J. Eur. Union 2020, L177, 1–31. [Google Scholar]
- van Giesen, R.; van den Akker, K.; Elsen, M. Study Assessing Consumer Understanding of Tyre Labels; Centerdata: Tiburg, The Netherlands, 2019. [Google Scholar]
- Weissman, S.; Sackman, J.; Gillen, D.; Monismith, C. Extending the Lifespan of Tires: Final Report; Symplectic Engineering Corporation: Berkeley, CA, USA, 2003; Available online: https://www.researchgate.net/profile/david_gillen2/publication/265357843_extending_the_lifespan_of_tires_final_report/links/54ad65720cf2828b29fc7a02/extending-the-lifespan-of-tires-final-report.pdf (accessed on 24 February 2025).
- Pang, E. Is There a Relationship Between Mileage Warranty vs. UTQG Tread Wear? Article at TopTire Review. 2022. Available online: https://toptirereview.com/is-there-a-relationship-between-mileage-warranty-vs-utqg-tread-wear/ (accessed on 24 February 2025).
- Pang, E. Best All Season Tires for High Mileage. Article at TopTire Review. 2023. Available online: https://toptirereview.com/best-all-season-tires-for-high-mileage/ (accessed on 24 February 2025).
- Continental Mileage Warranty. 2022. Available online: https://continentaltire.custhelp.com/app/answers/detail/a_id/789/~/mileage-warranty (accessed on 24 February 2025).
- Hankook. 2023 Hankook Warranty Booklet. Passenger and Light Truck Tires. 2023. Available online: https://www.hankooktire.com/content/dam/hankooktire/ca/help_support/2023_Hankook_Tire_Warranty_EN.pdf (accessed on 24 February 2025).
- Yokohama Treadwear Warranty. 2023. Available online: https://tire.yokohama.ca/customer-care/warranty/treadwear-warranty (accessed on 24 February 2025).
- Firestone Warranty Manual. 2022. Available online: https://www.firestonetire.com/support/tire-warranties/full-warranty/ (accessed on 24 February 2025).
- Bridgestone Warranty Manual. Replacement Market Passenger and Light Truck Tires. 2023. Available online: https://www.bridgestonetire.com/content/dam/consumer/bst/na/warranties/bs_fs_associated_%20brands_warranty_manual_us_en.pdf (accessed on 24 February 2025).
- Goodyear Tread Life Limited Warranty. 2023. Available online: https://www.goodyear.com/en_us/support/tire-warranty/tread-life.html (accessed on 24 February 2025).
- Pirelli Tire Warranty. 2023. Available online: https://www.pirelli.com/tires/en-us/car/tire-use-guide-warranty/tire-warranty (accessed on 24 February 2025).
- Pang, E. The Ultimate UTQG Table. Article at TopTire Review. 2022. Available online: https://toptirereview.com/the-ultimate-utqg-table-free-download/ (accessed on 24 February 2025).
- NHTSA. Consumer Guide to Uniform Tire Quality Grading; U.S. Department of Transportation, National Highway Traffic Safety Administration: Washington, DC, USA, 2016. Available online: https://www.nhtsa.gov/sites/nhtsa.gov/files/documents/812325_2016-uniformtirequalitygrading.pdf (accessed on 24 February 2025).
- Silvestro, D. ADAC Tyre Test. Tyre Abrasion vs. Safety Performance. Presented at the Task Force on Tyre Abrasion. Document: TA-13-02 Study_ADAC_tyre_abrasion_safety. 2023. Available online: https://wiki.unece.org/display/trans/tf+ta+session+13 (accessed on 24 February 2025).
- Schläfle, S.; Unrau, H.-J.; Gauterin, F. Influence of Longitudinal and Lateral Forces on the Emission of Tire–Road Particulate Matter and Its Size Distribution. Atmosphere 2023, 14, 1780. [Google Scholar] [CrossRef]
- Michelin Six Years of Data Reveals True Tyre Mileage. C9273112 2012. Available online: https://news.cision.com/michelin-fleet/r/six-years-of-data-reveals-true-tyre-mileage,c9273112 (accessed on 24 February 2025).
- Anadón, R. Study on Tyres Abrasion Test Method Durability Investigation. Document TA-01-05. 2022. Available online: https://wiki.unece.org/display/trans/TF+TA+session+1 (accessed on 24 February 2025).
- Leu, A.I.V.; Arghir, M. Lateral Force Variation Tire Testing. Acta Tech. Napoc. 2013, 56, 497–508. [Google Scholar]
- Veith, A.G. The Driving Severity Number (DSN)—A Step Toward Quantifying Treadwear Test Conditions. Tire Sci. Technol. 1986, 14, 139–159. [Google Scholar] [CrossRef]
- Veith, A.G. Tire Treadwear: The Joint Influence of Tg, Tread Composition and Environmental Factors. A Proposed ‘Two-Mechanism’ Theory of Treadwater. Polym. Test. 1987, 7, 177–207. [Google Scholar] [CrossRef]
- Torosian, L.; Chernyaev, I. Method of Creating Control Framework for Environmental Safety of Car Tires. Transp. Res. Procedia 2020, 50, 689–697. [Google Scholar] [CrossRef]
- Liang, R.; Wang, W.; Wang, G. Research on The Key Influencing Factors of Road Wear for Battery Electric Vehicles Tyres. In Proceedings of the 2021 9th International Conference on Traffic and Logistic Engineering (ICTLE), Macau, China, 9–11 August 2021; IEEE: New York, NY, USA; pp. 93–101. [Google Scholar]
- Castriota, A.; De Giorgi, M.; Manco, F.; Morabito, A.; Nobile, R. A Semi-Automatic Methodology for Tire’s Wear Evaluation. Meas. Control 2023, 56, 1292–1307. [Google Scholar] [CrossRef]
- Zhang, S.; Liu, Y.; Zhou, H.; Zhang, W.; Chen, Y.; Zhu, H. Analysis of the Effect of Wear on Tire Cornering Characteristics Based on Grounding Characteristics. World Electr. Veh. J. 2023, 14, 166. [Google Scholar] [CrossRef]
- UTAC. ACEA Tyre Performance Study Report. Report AFFSAS1801813. GRBP-75-18; UTAC: Montlhéry, France, 2021. [Google Scholar]
- Dodu, M. Tyre Abrasion Study for ACEA. Presented at 19th TFTA Meeting. Document TA-19-03. 2023. Available online: https://wiki.unece.org/display/trans/tf+ta+session+19 (accessed on 24 February 2025).
- ETRTO Tyre Abrasion 2021 Tests Preliminary Report. 2022. Available online: https://wiki.unece.org/display/trans/tf+ta+session+3 (accessed on 24 February 2025).
- Giechaskiel, B.; Grigoratos, T.; Li, L.; Zang, S.; Lu, B.; Lopez, D.; García, J.J. Tyre Wear Under Urban, Rural, and Motorway Driving Conditions at Two Locations in Spain and China. Lubricants 2024, 12, 338. [Google Scholar] [CrossRef]
- Veith, A.G. Tire Treadwear—A Comprehensive Evaluation of the Factors: Generic Type, Aspect Ratio, Tread Pattern, and Tread Composition. Part II: Results of the Primary Treadwear Test Series. Tire Sci. Technol. 1986, 14, 219–234. [Google Scholar] [CrossRef]
- Liu, Y.; Chen, H.; Wu, S.; Gao, J.; Li, Y.; An, Z.; Mao, B.; Tu, R.; Li, T. Impact of Vehicle Type, Tyre Feature and Driving Behaviour on Tyre Wear Under Real-World Driving Conditions. Sci. Total Environ. 2022, 842, 156950. [Google Scholar] [CrossRef] [PubMed]
- IDIADA Study on Tyres Abrasion Test Method & Durability Investigation. Presented at the Task Force on Tyre Abrasion. Document: TA-02-02 Study_ADAC_tyre_abrasion_110522. 2022. Available online: https://wiki.unece.org/display/trans/tf+ta+session+4 (accessed on 24 February 2025).
- Schläfle, S.; Unrau, H.-J.; Gauterin, F. Influence of Load Condition, Tire Type, and Ambient Temperature on the Emission of Tire–Road Particulate Matter. Atmosphere 2023, 14, 1095. [Google Scholar] [CrossRef]
- Silvestro, D. ADAC Tyre Test: Tyre Abrasion—On Road Tests. Presented at the Task Force on Tyre Abrasion. Document: TA-02-02 Study_ADAC_tyre_abrasion_110522. 2022. Available online: https://wiki.unece.org/display/trans/tf+ta+session+2 (accessed on 24 February 2025).
- Pierce, R.N. Determination of 100% Tire Tread Loss by Weight. Final Report; Southwest Research Institute: San Antonio, TX, USA, 1985. [Google Scholar]
- Veith, A.G. Tire Treadwear—A Comprehensive Evaluation of the Factors: Generic Type, Aspect Ratio, Tread Pattern, and Tread Composition Part I: Introduction and Details on the Organization of the Program. Tire Sci. Technol. 1986, 14, 201–218. [Google Scholar] [CrossRef]
- Farroni, F.; Sakhnevych, A.; Timpone, F. Physical Modelling of Tire Wear for the Analysis of the Influence of Thermal and Frictional Effects on Vehicle Performance. Proc. Inst. Mech. Eng. Part L J. Mater. Des. Appl. 2017, 231, 151–161. [Google Scholar] [CrossRef]
- Degaffe, F.S.; Turner, A. Leaching of Zinc from Tire Wear Particles Under Simulated Estuarine Conditions. Chemosphere 2011, 85, 738–743. [Google Scholar] [CrossRef]
- Lorenčič, V. The Effect of Tire Age and Anti-Lock Braking System on the Coefficient of Friction and Braking Distance. Sustainability 2023, 15, 6945. [Google Scholar] [CrossRef]
- Lee, S.W.; Jeong, K.M.; Kim, K.W.; Kim, J.H. Numerical Estimation of the Uneven Wear of Passenger Car Tires. World J. Eng. Technol. 2018, 06, 780–793. [Google Scholar] [CrossRef][Green Version]
- Arabaci, E.; Kiliç, B.; Orman, R.Ç. Economic and Environmental Effects of Treadwear Index in Vehicle Tires. El Cezeri Fen Mühendislik Derg. 2020, 7, 581–591. [Google Scholar] [CrossRef]
- Liang, C.; Wang, G.; An, D.; Ma, Y. Tread Wear and Footprint Geometrical Characters of Truck Bus Radial Tires. Chin. J. Mech. Eng. 2013, 26, 506–511. [Google Scholar] [CrossRef]
- Fathi, H.; El-Sayegh, Z.; Ren, J.; El-Gindy, M. Modeling and Validation of a Passenger Car Tire Using Finite Element Analysis. Vehicles 2024, 6, 384–402. [Google Scholar] [CrossRef]
- Biesse, F.; Mahé, J.; Lévy, N. Average Worn Profile of Tires in Europe. Tire Sci. Technol. 2014, 42, 166–184. [Google Scholar] [CrossRef]
- Cho, J.C.; Jung, B.C. Prediction of Tread Pattern Wear by an Explicit Finite Element Model. Tire Sci. Technol. 2007, 35, 276–299. [Google Scholar] [CrossRef]
- Cabut, D.; Michard, M.; Simoens, S.; Mees, L.; Todoroff, V.; Hermange, C.; Le Chenadec, Y. Analysis of the Water Flow inside Tire Grooves of a Rolling Car Using Refraction Particle Image Velocimetry. Phys. Fluids 2021, 33, 032101. [Google Scholar] [CrossRef]
- Chen, B.; Ding, P.; Wei, G.; Xiong, C.; Wang, F.; Yu, J.; Yu, H.; Zou, Y. A Study on the Contact Characteristics of Tires–Roads Based on Pressure-Sensitive Film Technology. Materials 2023, 16, 6323. [Google Scholar] [CrossRef]
- Piras, G.; Pini, F.; Di Girolamo, P. PM10 Emissions from Tires: A Disruptive Estimate Questioning Present Pollution Mitigation Strategies. Atmos. Pollut. Res. 2024, 15, 101939. [Google Scholar] [CrossRef]


Disclaimer/Publisher’s Note: The statements, opinions and data contained in all publications are solely those of the individual author(s) and contributor(s) and not of MDPI and/or the editor(s). MDPI and/or the editor(s) disclaim responsibility for any injury to people or property resulting from any ideas, methods, instructions or products referred to in the content. |
© 2025 by the authors. Licensee MDPI, Basel, Switzerland. This article is an open access article distributed under the terms and conditions of the Creative Commons Attribution (CC BY) license (https://creativecommons.org/licenses/by/4.0/).