Article

Enhancing Thermo-Acoustic Waste Heat Recovery through Machine Learning: A Comparative Analysis of Artificial Neural Network–Particle Swarm Optimization, Adaptive Neuro Fuzzy Inference System, and Artificial Neural Network Models

by
Miniyenkosi Ngcukayitobi
1,
Lagouge Kwanda Tartibu
1,* and
Flávio Bannwart
2
1
Department of Mechanical and Industrial Engineering Technology, University of Johannesburg, Johannesburg 2028, South Africa
2
School of Mechanical Engineering, University of Campinas, Campinas 13083-860, Brazil
*
Author to whom correspondence should be addressed.
AI 2024, 5(1), 237-258; https://doi.org/10.3390/ai5010013
Submission received: 23 October 2023 / Revised: 26 December 2023 / Accepted: 12 January 2024 / Published: 19 January 2024

Abstract

:
Waste heat recovery stands out as a promising technique for tackling both energy shortages and environmental pollution. Currently, this valuable resource, generated through processes like fuel combustion or chemical reactions, is often dissipated into the environment, despite its potential to significantly contribute to the economy. To harness this untapped potential, a traveling-wave thermo-acoustic generator has been designed and subjected to comprehensive experimental analysis. Fifty-two data corresponding to different working conditions of the system were extracted to build ANN, ANFIS, and ANN-PSO models. Evaluation of performance metrics reveals that the ANN-PSO model demonstrates the highest predictive accuracy ( R 2 = 0.9959 ), particularly in relation to output voltage. This research demonstrates the potential of machine learning techniques for the analysis of thermo-acoustic systems. In doing so, it is possible to obtain an insight into nonlinearities inherent to thermo-acoustic systems. This advancement empowers researchers to forecast the performance characteristics of alternative configurations with a heightened level of precision.

1. Introduction

Artificial Intelligence (AI) has captivated researchers worldwide, particularly in various engineering disciplines and thermal science. It can be defined as the development of a computer system capable of performing tasks that traditionally required human intelligence, including decision-making, pattern recognition, and speed identification. AI encompasses a broad spectrum of technologies such as deep learning (DL), natural language processing (NLP), and machine learning (ML). In the realm of thermo-acoustic systems research, AI models have found applications in tasks ranging from parameter selection and optimization to output prediction [1].
An Artificial Neural Network (ANN) is a collection of interconnected components designed to process data and mimic the cognitive processes of the human brain. It comprises linked layers of neurons [1]. Data are transmitted through the network from layer to layer via connections or synapses, each characterized by its own strength or weight [1]. To establish the necessary correlation between the network’s output and input, values must be determined for both the activation function and connection weights. This entire process is referred to as supervised training [1]. When implemented in a computer, ANNs are not pre-programmed to perform specific tasks. Instead, they undergo training to learn patterns from provided inputs and associated data. Once the training phase is complete, new patterns can be presented for classification or prediction [1,2]. ANNs have the ability to learn patterns autonomously from various sources, including data from physical models, real-world systems, computer programs, and more. They are adept at handling numerous inputs and generating outputs suitable for further processing or analysis by designers. Developed as an extension of mathematical models of neural biology, ANNs operate on the premise that information processing takes place within elements known as neurons [2]. Signals are transmitted through neurons via connection links, and each neuron employs an activation function (typically nonlinear with respect to its net input) to determine its output signals [2]. One of the key strengths of ANNs lies in their ability to acquire knowledge from examples, making them proficient problem solvers with notable advantages, particularly when it comes to learning and discerning the underlying relationships between inputs and outputs without explicit consideration of physical principles [3].
In recent years, researchers have delved into various nature-inspired optimization approaches, including Bacteria Foraging Optimization, Genetic Algorithms, Artificial Bee Colony, Ant Colony Optimization, and Particle Swarm Optimization (PSO) [4]. Among these techniques, PSO has emerged as a particularly effective and promising method for tackling highly constrained nonconvex and nonlinear optimization problems [4]. Originally introduced by Eberhart and Kennedy, PSO draws inspiration from cooperative behaviors observed in nature, such as fish schooling and bird flocking [4]. In PSO, potential solutions to an optimization problem are represented by particles within the design space [4]. Each particle dynamically updates its location based on its own best position and the collective best position of the entire swarm at each generation [4]. Noteworthy advantages of PSO include its minimal parameter tuning compared to other competing techniques, its low computational time, and its ability to seamlessly integrate with other methods to form hybrid tools. Additionally, the PSO algorithm is independent of the initial solution, commencing its iteration process without relying on a specific starting point.
The essence of PSO lies in the dynamic interplay and communication among a group of interconnected particles or individuals. These entities interact, link, and communicate, utilizing gradients or search directions to enhance their collective exploration of the solution space [4]. Within the PSO algorithm, established particles traverse the search space in pursuit of the global optimum. Throughout the iterative process, each particle refines its position based on its past experiences, knowledge, and information gathered from the surrounding search context. The trajectory of particle movement is crucial, emphasizing the significance of effective communication in guiding the navigation process [4].
The Adaptive Neuro Fuzzy Inference System (ANFIS) is a sophisticated technique that seamlessly integrates neural networks (NN) and fuzzy systems [5]. Its versatile application has spanned various realms of time series research, including forecasting chaotic time series through the implementation of ANFIS based on singular spectrum analysis [5], as well as fuzzy time series forecasting, and the prediction of chaotic time series using an enhanced ANFIS approach [5]. Additionally, ANFIS has been instrumental in devising innovative methods for forecasting trends in oil prices, predicting financial volatility, and projecting stock returns [5]. Within the ANFIS framework, the neural network’s hidden nodes and the components of the fuzzy system are equally pivotal. The architecture comprises five fixed layers, encompassing fuzzification (Layer-1), the fuzzy inference system (Layer-2 and Layer-3), defuzzification (Layer-4), and aggregation (Layer-5) [5]. This structured approach harmoniously combines the strengths of both neural networks and fuzzy logic. Soft computing techniques play a crucial role in providing approximate solutions to intricate problems [6]. In contemporary times, these methods find widespread application across diverse disciplines, serving various objectives, including optimization, prediction, and design. Notably, soft computing methods have seen extensive utilization in the design and analysis of complex systems such as Stirling engines, traveling-wave thermo-acoustic generators, and thermo-acoustic refrigerators [6]. Among the dominant intelligent approaches applied to thermo-acoustic systems are ANFIS, Genetic Algorithms (GA), Particle Swarm Optimization, Fuzzy Logic, and Artificial Neural Networks (ANN) [6].
Thermo-acoustics is a field that investigates the interplay between heat transfer and acoustics [7]. In thermo-acoustic systems, there exists a dual functionality: they can either utilize acoustic work to facilitate the transfer of heat from a low-temperature medium to a high-temperature one, or they can harness thermal energy to generate acoustic work [7]. These systems are broadly categorized into two types: heat pumps, which function as refrigerators or coolers, and prime movers, which operate as heat engines. Specifically, a heat pump employs acoustic power to move heat from a lower temperature level to a higher one, while heat engines convert heat power into acoustic power. In practical terms, heat pumps are engineered to maintain the temperature of a designated space above that of its surroundings, while refrigerators are designed to keep the temperature of a given space below that of the surrounding environment [7]. Figure 1 provides a visual representation of the conversion processes intrinsic to thermo-acoustic engines and refrigerators.

2. Literature Review

In their study, Kisha et al. [8] proposed a thermo-acoustic engine designed to efficiently convert thermal energy into acoustic power, ultimately translating it into electricity. The working medium for this innovative system was air at atmospheric pressure. The researchers employed a looped tube thermo-acoustic engine featuring two heat exchangers. Moreover, they developed a comprehensive numerical model using DeltaEC software (DeltaEC 6.2), specifically for a looped-tube double-core thermo-acoustic engine. To ensure the accuracy of their simulations, the numerical model was rigorously validated against experimental data. The investigation focused on understanding the impact of various heat sources on the conversion of heat to acoustic energy. Key parameters such as pressure amplitude, volume flow rate, acoustic impedance, and onset temperature difference were systematically studied [8]. The findings revealed that these parameters were significantly influenced by the method of inputting thermal energy from heat-distribution sources. This influence, in turn, led to notable increases in both acoustic and electrical power output. In summary, these researchers shed light on the intricate interplay between heat distribution sources and the performance of thermo-acoustic engines, emphasizing the potential for enhanced energy conversion through careful consideration of input methodologies [8].
In 2017, Bi et al. [9] pioneered the development of a novel traveling-wave thermo-acoustic electric generator comprising a multi-stage traveling-wave thermo-acoustic heat engine equipped with linear alternators. The engines in their prototype are interlinked by slender resonance tubes, a crucial design element for generating an efficient traveling-wave within the regenerator [9]. At the terminus of each of these slim resonance tubes, an alternator was integrated as a bypass. Through rigorous testing of the prototype, they achieved impressive results: a peak electric power output of 4.69 KW, accompanied by a thermal-to-electric efficiency of 15.6%. Furthermore, they attained a maximum thermal-to-electric efficiency of 18.4%, producing an electric power output of 3.46 KW, all under 6 MPa of pressurized helium [9]. It is worth noting that they maintained consistent cooling and heating temperatures at 25 °C and 650 °C, respectively.
Wu et al. [10] designed and investigated a 1 kW traveling-wave thermo-acoustic electrical generator. In their initial trials, these researchers achieved a preliminary electric power output of 638 W at a frequency of 74 Hz. Through meticulous analysis, they unveiled a crucial acoustic impedance coupling relationship between the alternator and the engine using a numerical approach. Leveraging their numerical insights, they successfully reduced the operating frequency in their experiments from 74 Hz to 64 Hz by introducing a 4.5% mole fraction of argon gas into the system. This adjustment led to a remarkable improvement, resulting in a maximum electric power output of 1043 W with a thermal-to-electric efficiency of 17.7%. Additionally, they attained a peak thermal-to-electric efficiency of 19.8%, yielding an electric power output of 970 W.
Wu et al. [11] designed and constructed a solar-powered traveling-wave thermo-acoustic electricity generator. This innovative system comprised a solar dish for concentrating sunlight, coupled with a pool boiler-type heat receiver to effectively transfer solar energy to the engine. In their experimental setup, cartridge heaters were employed to provide the necessary heating energy. Through their efforts, they achieved notable results: a peak electric power output of 481 W and a maximum thermal-to-electric efficiency of 15% operating under 3.5 MPa of pressurized helium at a frequency of 74 Hz. In their solar-powered experiments, they achieved a maximum electric power output of approximately 200 W.
Alrwashdeh et al. [12] investigated the impact of the heat exchanger design on the heat transfer rate and temperature distribution. They focused on parallel and counter-flow heat exchangers, finding that increasing length improves efficiency due to an enhanced surface area and prolonged heat-exchange time. Counter-flow heat exchangers exhibited higher efficiency, which was attributed to a greater temperature difference between ends compared to parallel flow. Changing heat-exchanger design conditions positively affected efficiency. In a study by Hamood et al. [13], additive manufacturing was applied to heat exchangers for oscillatory flow at elevated pressure. Additive manufacturing proved advantageous in overcoming manufacturing challenges, and experimental results indicated its viability over conventional methods. Heat exchangers made from aluminum outperformed those made from stainless steel in thermal performance, confirming additive manufacturing as a valid technique for oscillatory-flow heat exchangers.
Rosle et al. [14] explored the impact of stack length on the performance of a thermo-acoustic generator using DeltaEC. Their findings suggest that longer porous medium lengths result in better temperature drop and enhanced generator efficiency. McGaughy et al. [15] designed a single-stage traveling-wave thermo-acoustic engine, achieving a maximum efficiency of 7.8%, corresponding to 14% Carnot efficiency. The simulation closely matched the experimental data. Xiao et al. [16] conducted acoustic–electrical analogy investigations on a 4-stage traveling-wave thermo-acoustic electric generator. Their study considered nonlinear effects, achieving agreement between experimental and simulated results. They highlighted the influence of electric resistance and heating temperature.
The integration of Artificial Intelligence (AI) techniques into research pertaining to thermo-acoustic systems has garnered significant attention. This AI-driven approach has found wide-ranging applications across various industrial sectors, renewable-energy challenges, and engineering disciplines. Machesa et al. [17] conducted a comprehensive study on a thermo-acoustic refrigerator employing Artificial Intelligence (AI) techniques. They employed different methodologies, including an Adaptive Neuro-Fuzzy Inference System (ANFIS), an Artificial Neural Network (ANN) trained using Particle Swarm Optimization (ANN-PSO), and a standalone Artificial Neural Network to predict the oscillatory-heat transfer coefficient within the heat exchangers of the thermo-acoustic system. Their evaluation criteria encompassed metrics such as Mean Square Error (MSE) and regression analysis to gauge the models’ performance and accuracy [17]. Their findings demonstrate that predicting the oscillatory heat-transfer coefficient holds promise for enhancing the performance of thermo-acoustic refrigeration systems. Furthermore, Toghyani et al. [18] introduced an Imperialist Competitive Algorithm and a hybrid ANN-PSO approach to investigate the nonlinear correlations between experimental input variables such as working medium temperature, fuel mass flow rate, speed, and output parameters, namely power and torque. The outcomes presented by these researchers indicated that the hybrid ANN-PSO method outperformed the ANN-ICA combination. Additionally, Toghyani et al. [18] identified key performance indicators, namely torque and output power, for evaluating Stirling engines. Duan et al. [19] conducted a multi-objective optimization study employing Particle Swarm Optimization (PSO) to enhance thermal efficiency, output power, and minimize cycle irreversibility parameters. Their efforts resulted in a remarkable 15% boost in output power.
Rahman et al. [20] used an ANN technique to predict temperature differences in a thermo-acoustic stack. The ANN model showed high accuracy, with a 0.2% average percentage error compared to experimental values, indicating its effectiveness for solving complex thermo-acoustic problems. Wildemans et al. [21] investigated the nonlinear dynamics of intrinsic thermo-acoustic modes through experimental bifurcation analysis. They emphasized the importance of understanding self-excited flame dynamics for accurate nonlinear modeling and effective control strategies. Alamir [22] successfully forecasted the cooling temperature and performance of a standing-wave thermo-acoustic refrigerator. His results demonstrated the efficacy of Artificial Neural Networks (ANN), achieving a high level of predictability with an R 2 value of 0.9. Subsequently, he leveraged the insights gained from his model to scrutinize the pivotal parameters influencing the performance of the thermo-acoustic refrigerator [22]. Machesa et al. [23] addressed nonlinearity in Stirling engine systems using soft computing techniques. Their study compared Fuzzy Mamdani, ANN, ANFIS, and ANN-PSO models, with Fuzzy Mamdani excelling in power prediction and ANN-PSO and ANFIS leading in torque prediction. Table 1 provides a comprehensive overview of the strengths and weaknesses associated with ANN, ANFIS, and ANN-PSO models.

3. Motivation of the Study

While considerable progress has been achieved in the advancement of efficient thermo-acoustic systems and in employing numerical simulations for performance prediction, the persistent challenge lies in addressing the nonlinearity inherent in the operation of these devices [23]. Nonlinearity in thermo-acoustic systems pertains to the nonlinear proportionality of relationships between various physical parameters, such as pressure, temperature, and velocity. This complexity makes it challenging to formulate mathematical models. Additionally, the temperature-dependent nature of medium properties like density, speed of sound, and thermal conductivity introduces further nonlinearities, as alterations in temperature lead to corresponding changes in these properties, subsequently influencing the behavior of acoustic waves. Comprehending and quantifying these nonlinearities is paramount for accurately modeling and controlling thermo-acoustic systems. Such an understanding can give rise to phenomena like hysteresis, limit cycles, and chaotic behavior, all of which have substantial practical implications in domains like combustion engines, thermo-acoustic refrigeration, and other heat-driven systems. This study makes a significant contribution to the modeling of traveling-wave thermo-acoustic systems by developing machine learning models capable of predicting configurations that were not explicitly measured during experimental investigations. This not only streamlines the experimental process, reducing time consumption, but also presents an alternative modeling approach for the thermo-acoustic research community.
This research study advocates for the adoption of soft computing techniques to forecast output voltages for both single-stage and multi-stage thermo-acoustic generators. The key input parameters considered are the temperature differential across each engine stage and the number of stages. In this context, the output voltage serves as the primary performance metric for both single-stage and multi-stage setups. The chosen techniques for output voltage prediction encompass Artificial Neural Networks (ANN), Adaptive Neuro-Fuzzy Inference Systems (ANFIS), and ANN optimized through Particle Swarm Optimization (PSO). Soft computing techniques are recommended for their proficiency in analyzing data and discerning intricate patterns that may elude human perception. Consequently, they promise more precise predictions compared to conventional rule-based systems.

4. Proposed Approaches

This section outlines the methodologies employed for data acquisition and the machine learning techniques utilized in forecasting the output voltage of the traveling-wave air-filled thermo-acoustic electric generator.

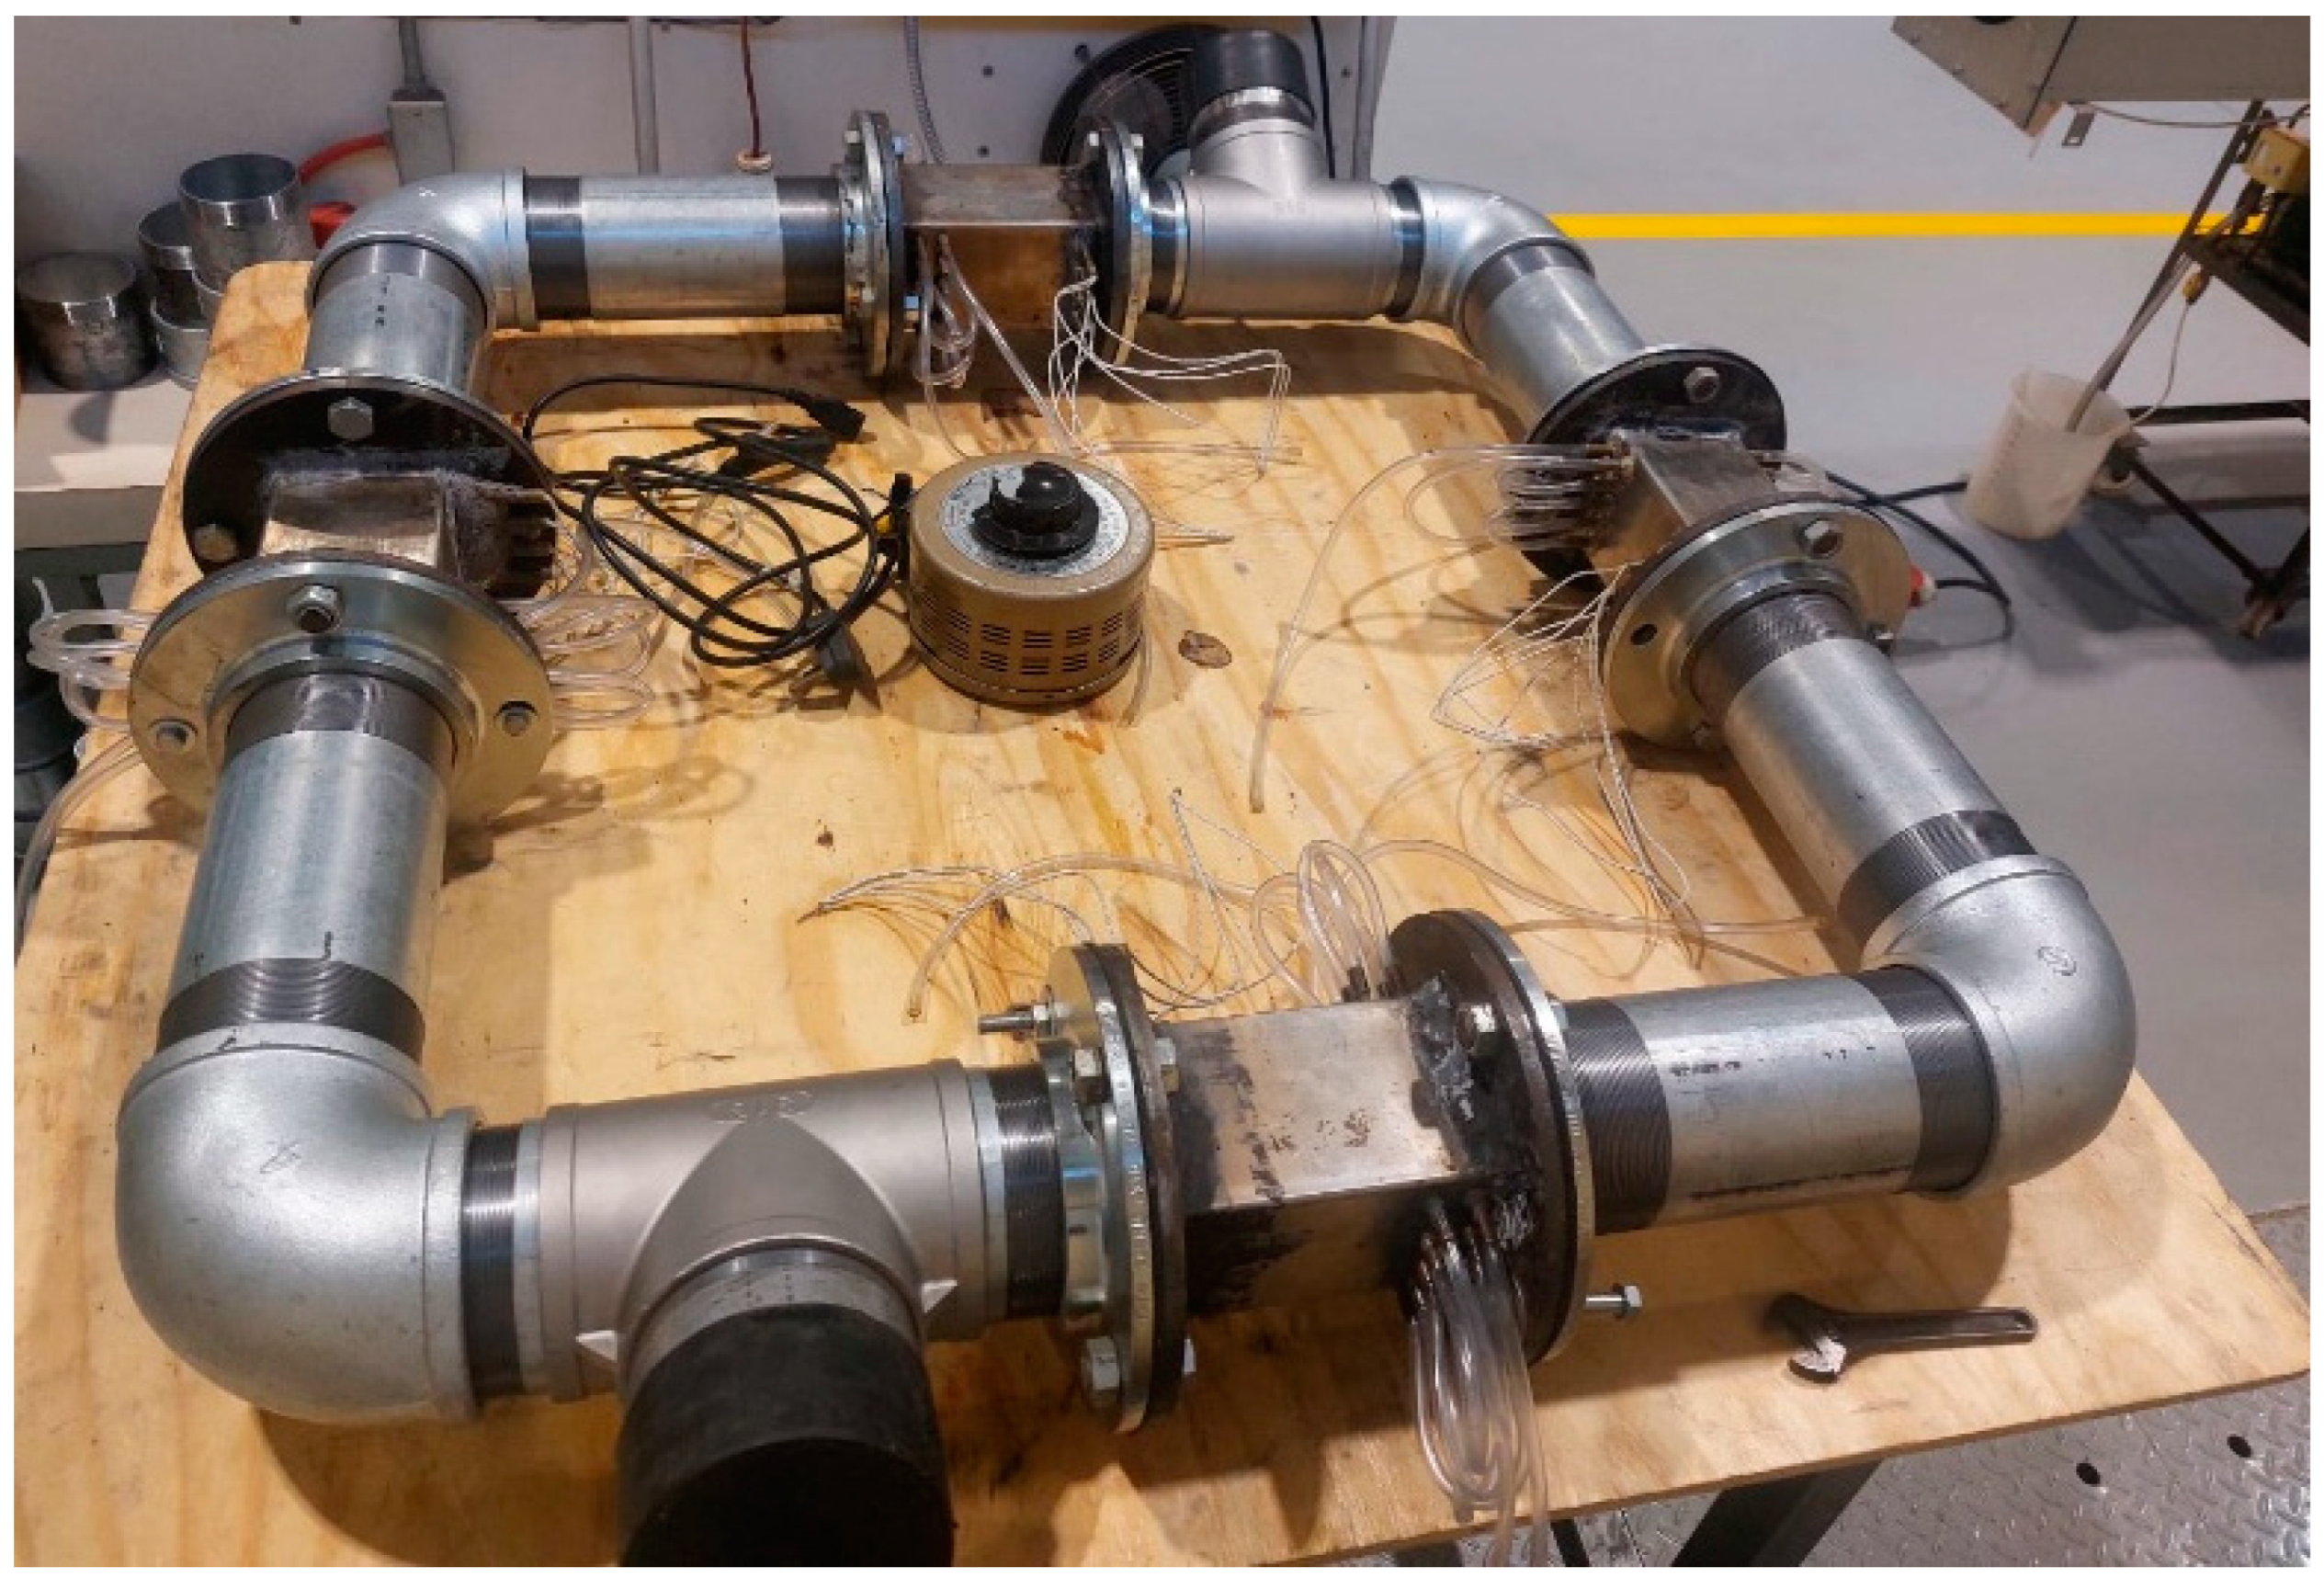
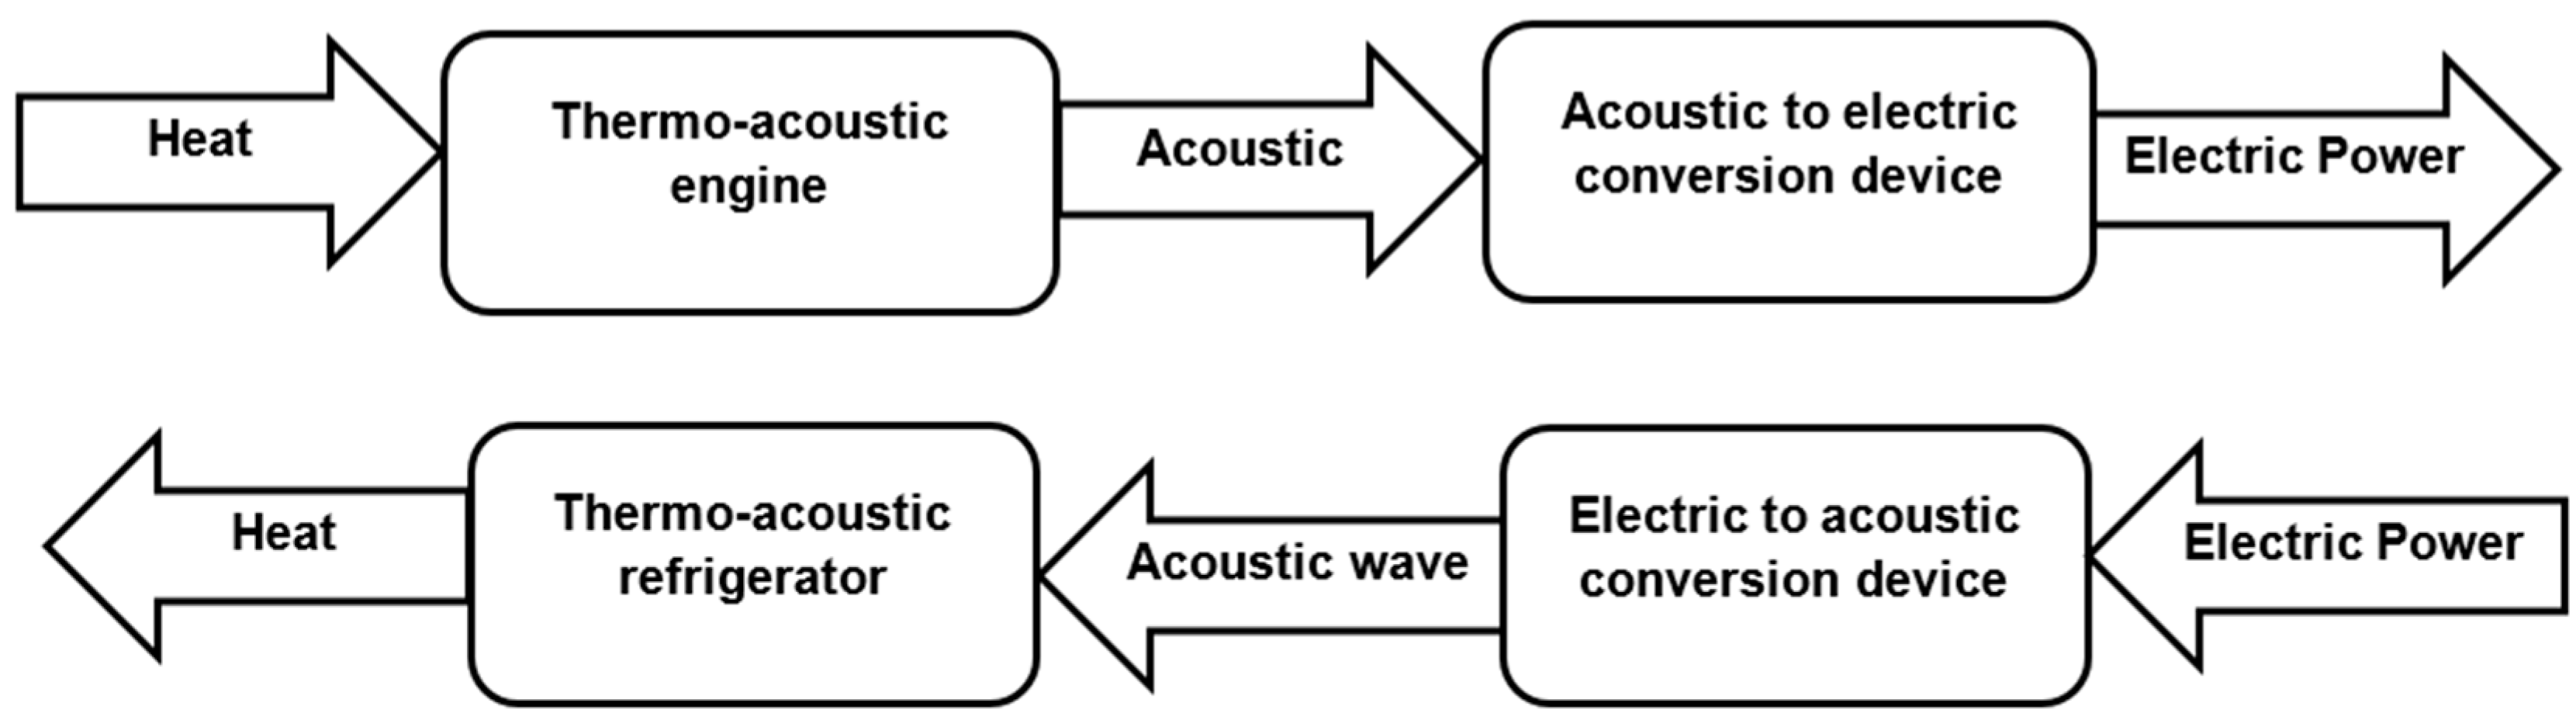
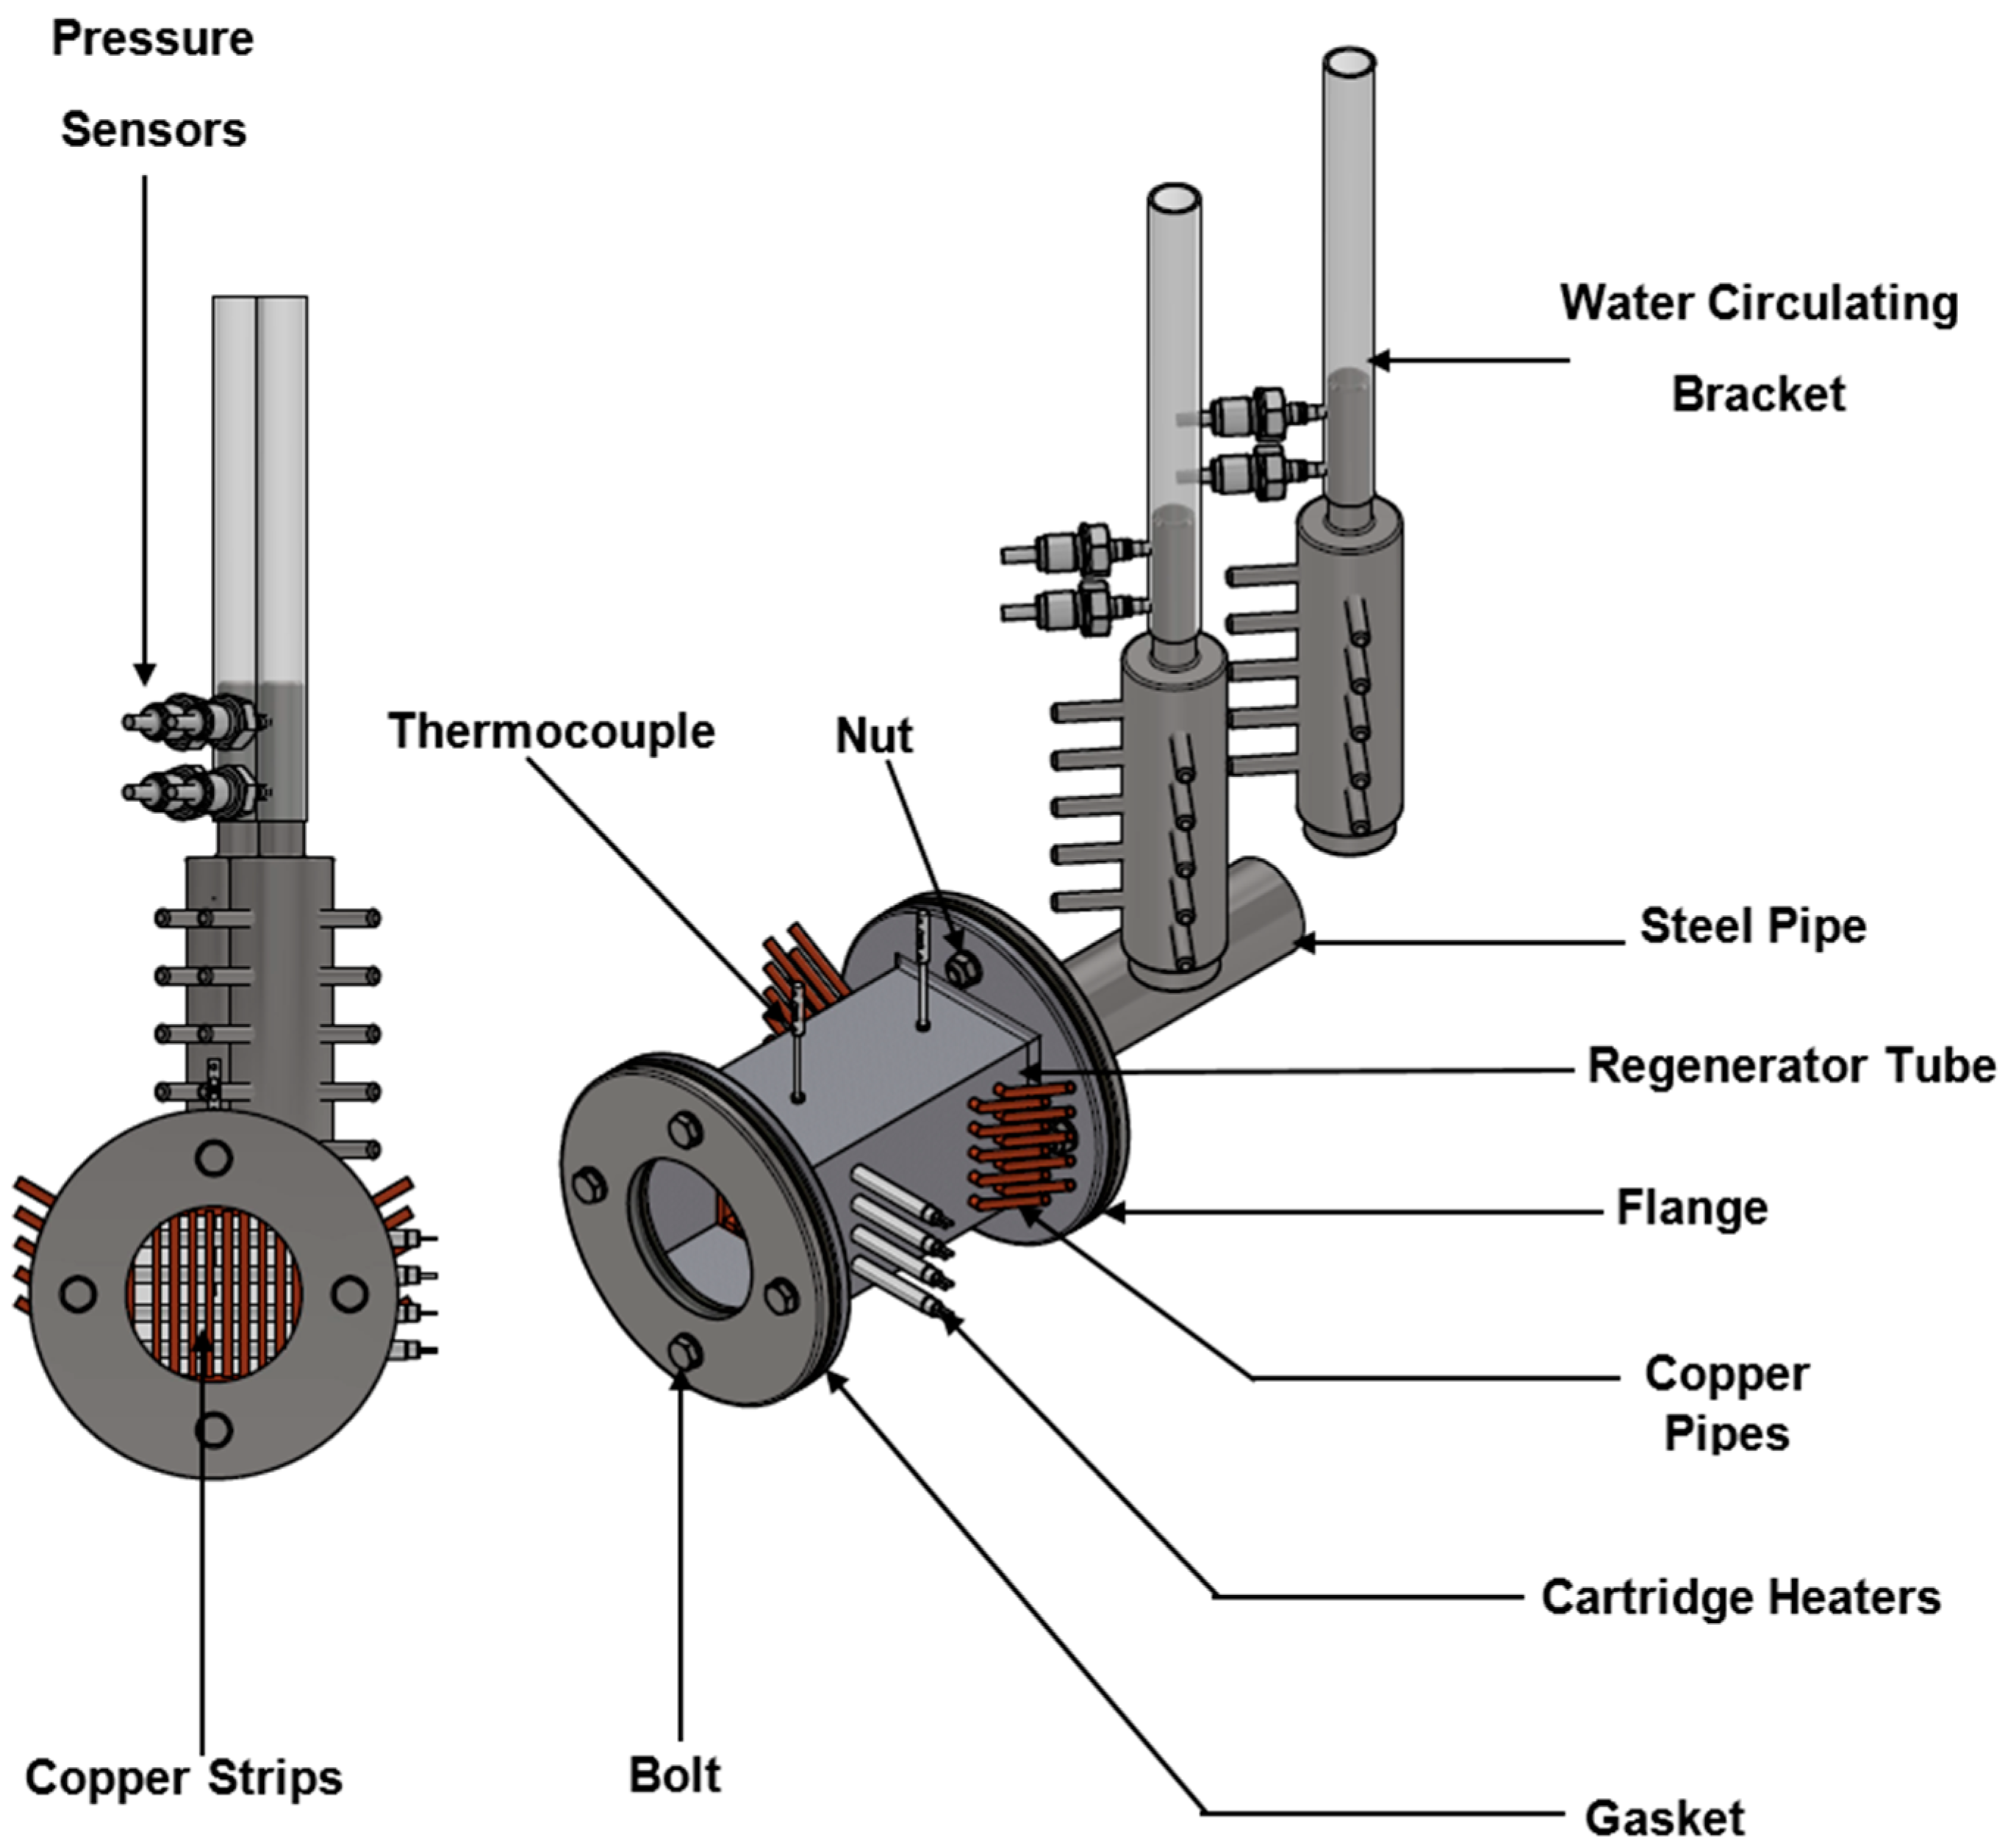
4.1. Design of a Thermo-Acoustic Generator

In the pursuit of developing a multi-stage thermo-acoustic generator, the initial phase involves the fabrication of three pivotal components: cold heat exchangers, regenerators, and hot heat exchangers. Both the cold and hot heat exchangers were meticulously crafted using copper strips, each measuring 100 mm in length, which were then seamlessly joined through a soldering technique to form a square configuration. Subsequently, these assemblies were drilled and carefully positioned over the cartridge heaters and copper pipes within the regenerator tube. For optimal performance, honeycomb ceramic was chosen as the material of choice for this design owing to its commendable attributes such as excellent thermal conductivity, ready availability, and low thermal conductivity, as highlighted in reference [24]. The utilized honeycomb ceramic possessed a Cell Per Square Inch (CPSI) rating of 400 and was precisely tailored to dimensions of 85 mm by 95 mm before being snugly fitted into the regenerator tube. It is worth noting that honeycomb ceramic finds wide-ranging applications as catalyst supports and particulate filters for controlling vehicular emissions. The construction and assembly of the multi-stage traveling-wave thermo-acoustic generator are visually elucidated in Figure 2 and Figure 3. The experimental phase was carried out under ambient atmospheric pressure and room-temperature conditions to facilitate the measurement of key parameters including output voltage, onset time, working fluid velocity, and temperature differentials (∆T) across each stage of the engine. The cartridge heaters have a voltage supply range with strict limits: the maximum voltage must not exceed 200 V, and the minimum voltage must be no less than 115 V. Any deviation from this specified range could result in damage to the cartridge heaters or a failure of the system to produce the required intensive sound waves for electricity generation.

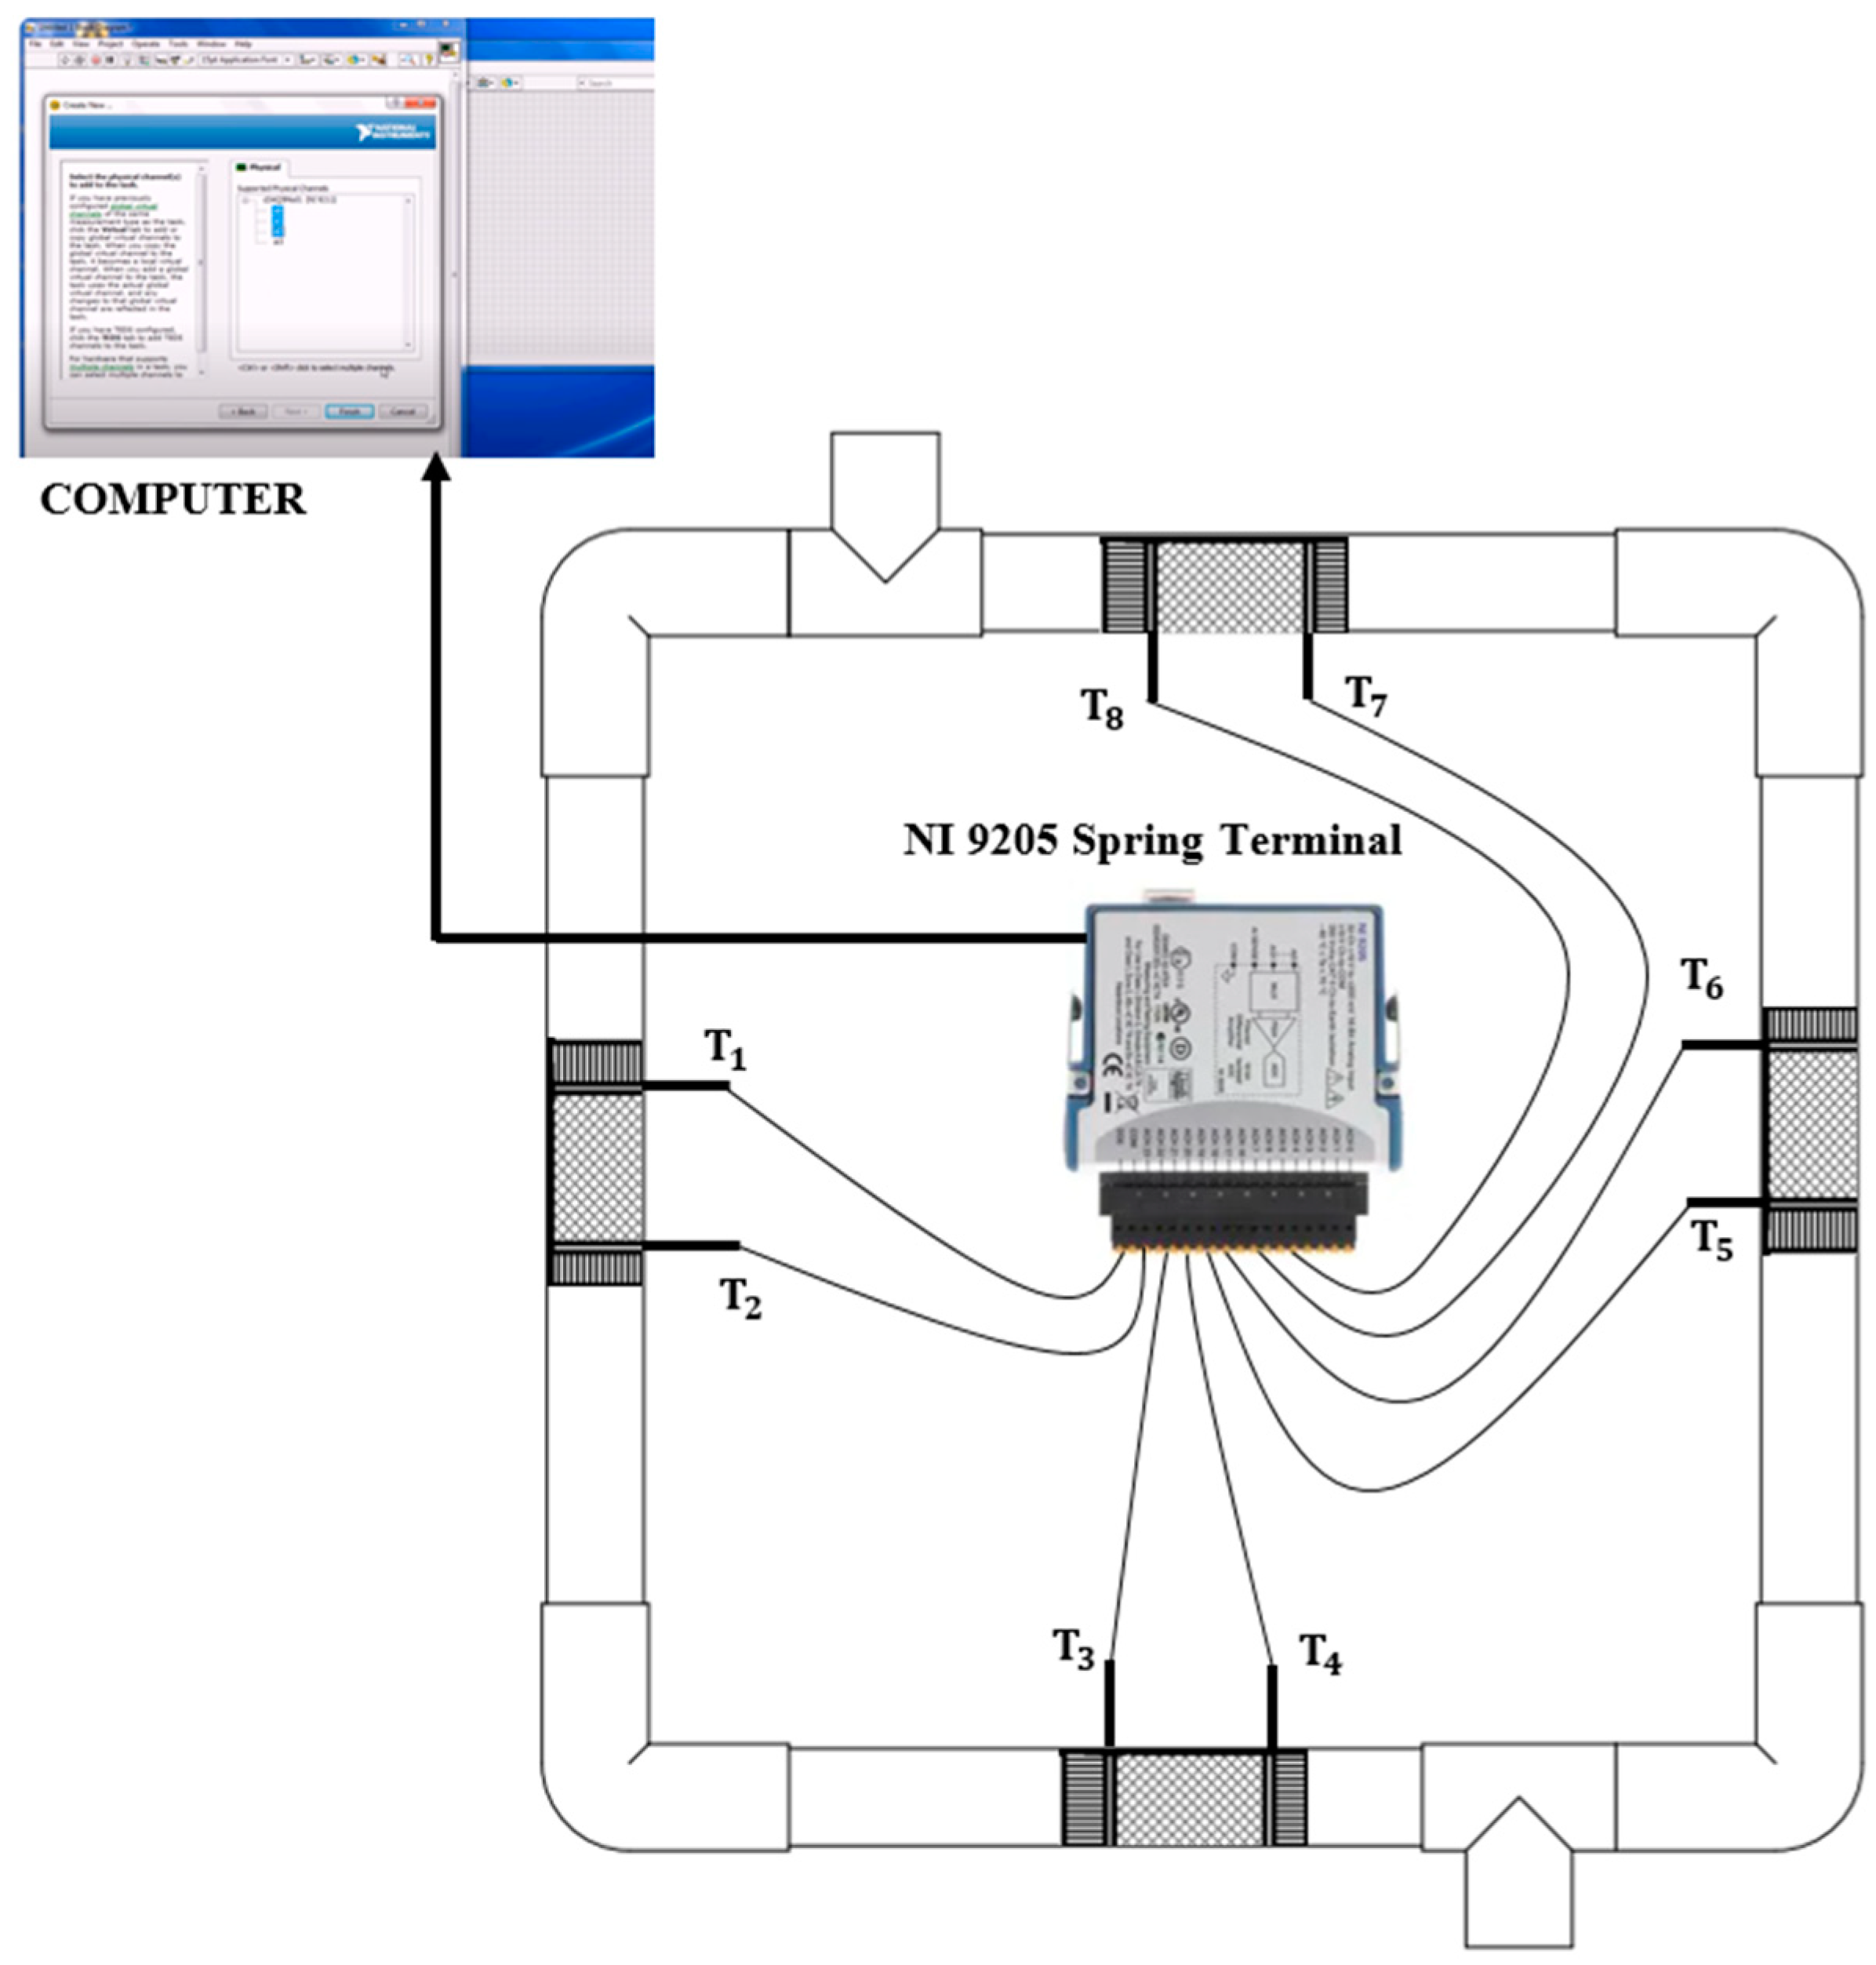
4.2. Temperature Measurements

In this research study, the effectiveness of thermo-acoustic device in generating electricity for a thermo-acoustic generator system is primarily assessed based on the temperature difference across the regenerator units. This crucial parameter is typically measured using K-type thermocouple temperature sensors, which are chosen for their adherence to IEC 584 standards and class 1 tolerance for utmost accuracy [25]. These sensors boast a robust construction, featuring a stainless steel 310 probe sheath and a PFA insulated lead. The mineral insulated flexible probe sheath allows bending and customization to suit a wide array of applications. Additionally, the thermocouple is equipped with a single-element insulated hot junction to reduce electrical interference, and it has a plain pot seal with a temperature rating of up to 200 °C [18]. According to RS components, these specific thermocouples accommodate a temperature range from −40 °C to 1100 °C [25]. Their accuracy is within ±2.5 °C [25]. Typical applications for these mineral-insulated type-K thermocouple probes encompass heat exchangers, heat-treatment and annealing furnaces, brick and cement kilns, power stations, food thermometers, thermostats, vehicle diagnostics, and laboratory settings [25].
The experiments were conducted at room temperature for both single-stage and multiple-stage traveling-wave thermo-acoustic generators. The experimental cycle commenced by running the cold water tap in the ambient heat exchangers for both single-stage and multiple-stage thermo-acoustic systems. Subsequently, electric power was supplied to the system through a variable transformer and a set of cartridge heaters. The input voltage, ranging from 115 V to 200 V, was measured using a digital multi-meter to ensure uniform electric power distribution across all engine stages. The temperature difference (∆T) across each engine stage was recorded by two K-type thermocouples, which were positioned on the cold and hot sides of the regenerator units. These thermocouples were then connected to the data acquisition device (DAQ), which, in turn, was linked to the computer for data capture. The onset temperature difference, defined as the minimum temperature required for the thermo-acoustic engines to generate sound, was recorded across each engine stage. Three sets of experiments were conducted, and the results were averaged to minimize measurement errors. Following each experimental run, the engines were allowed to cool down with cold water and a damp cloth for approximately 30 min and then left for about 2 h. Finally, a digital multilevel meter was employed to measure the generated output voltage for both single-stage and multiple-stage setups. The results presented in this research study for onset temperature across engine stages and output voltage were obtained from three experimental trials and averaged to reduce measurement uncertainties. The experimental setup for temperature measurement is depicted in Figure 4.

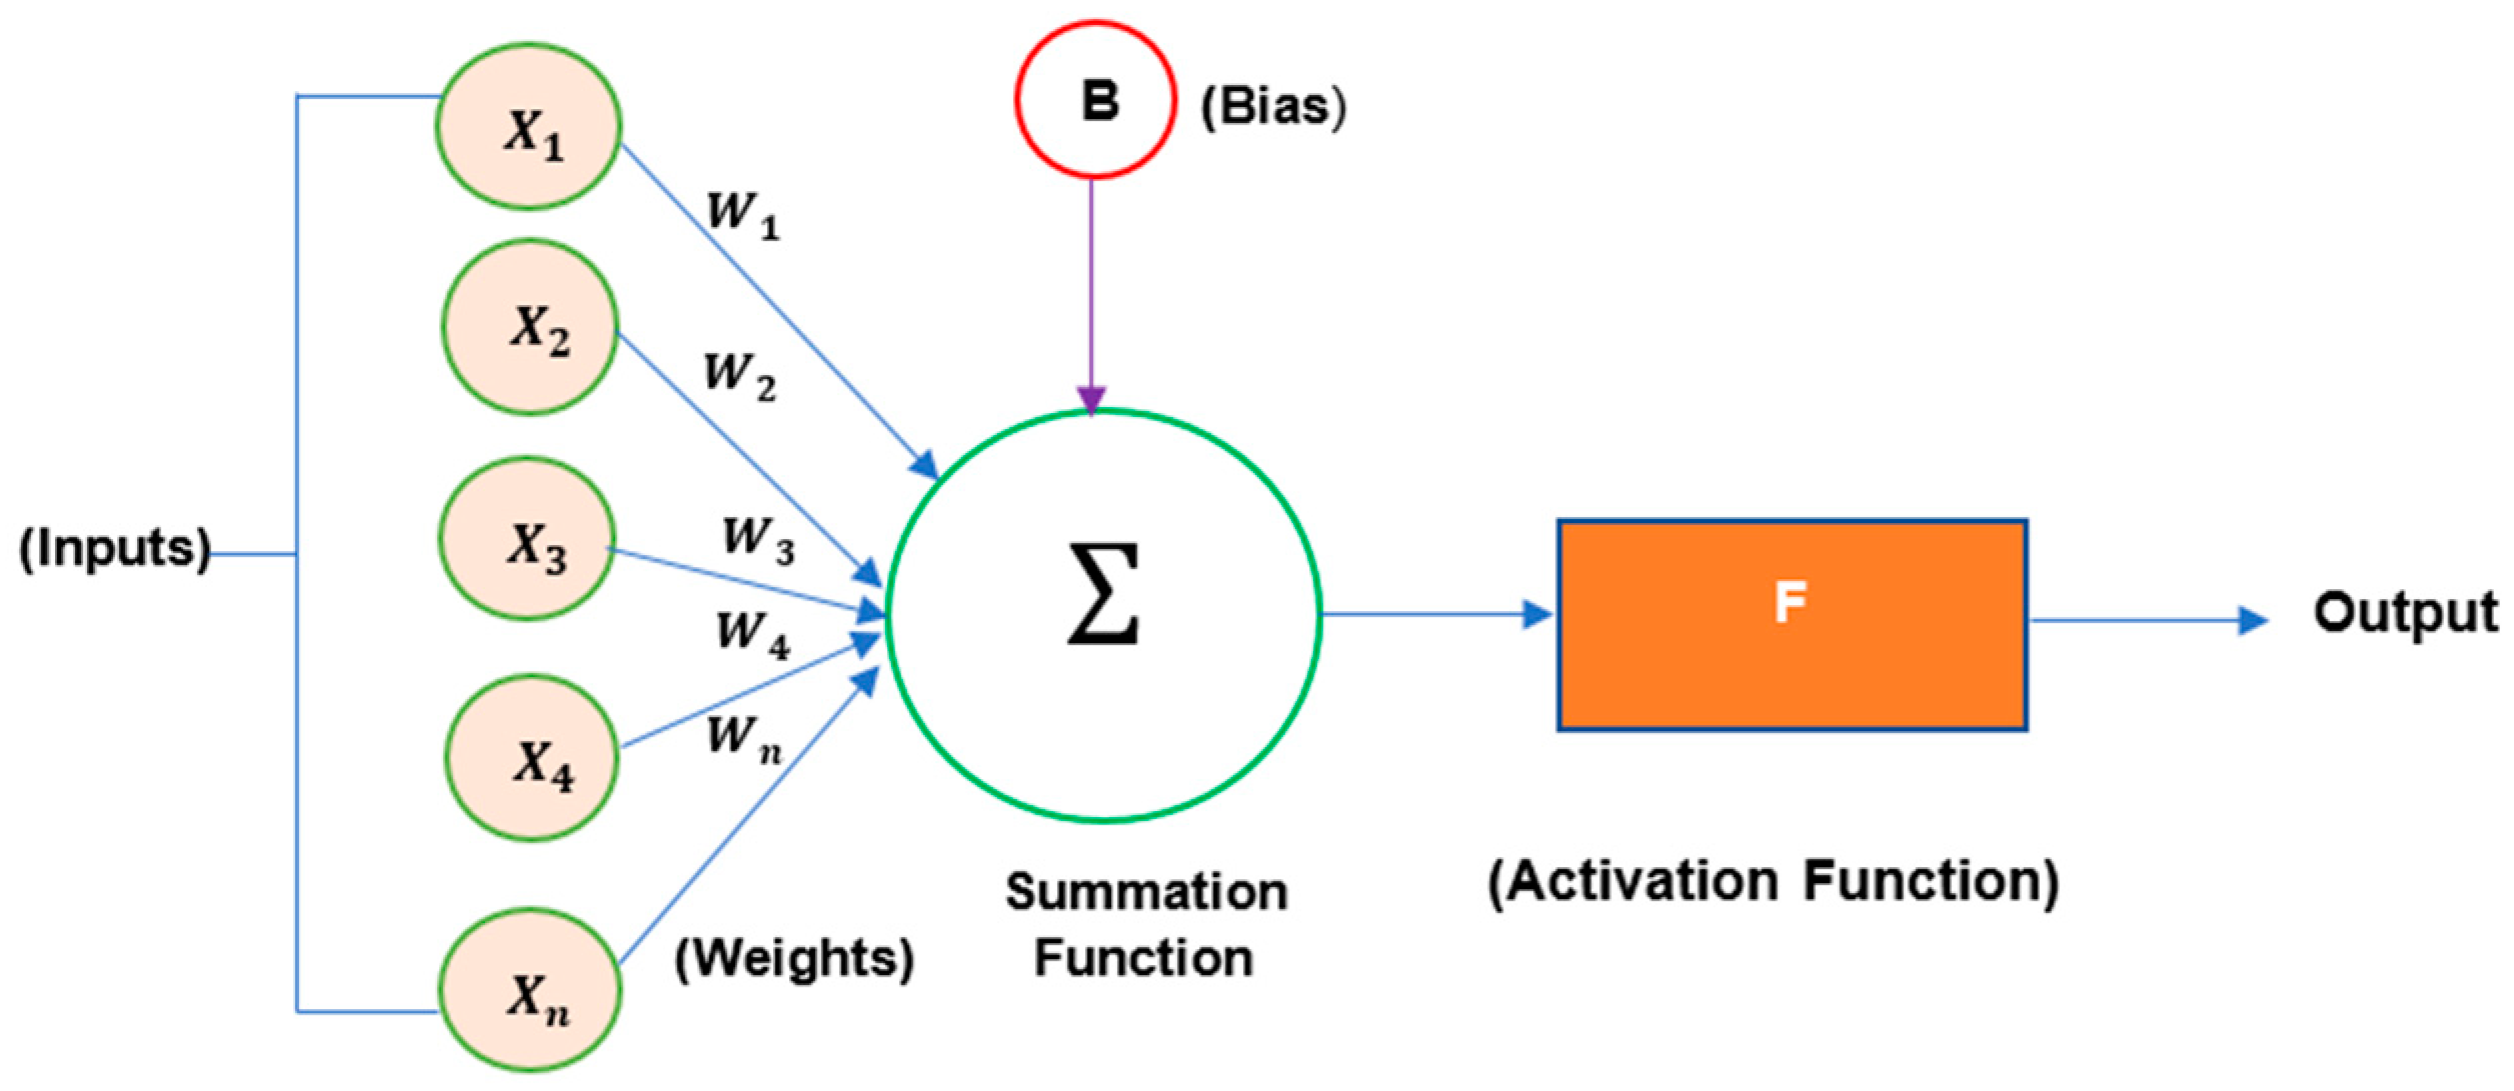
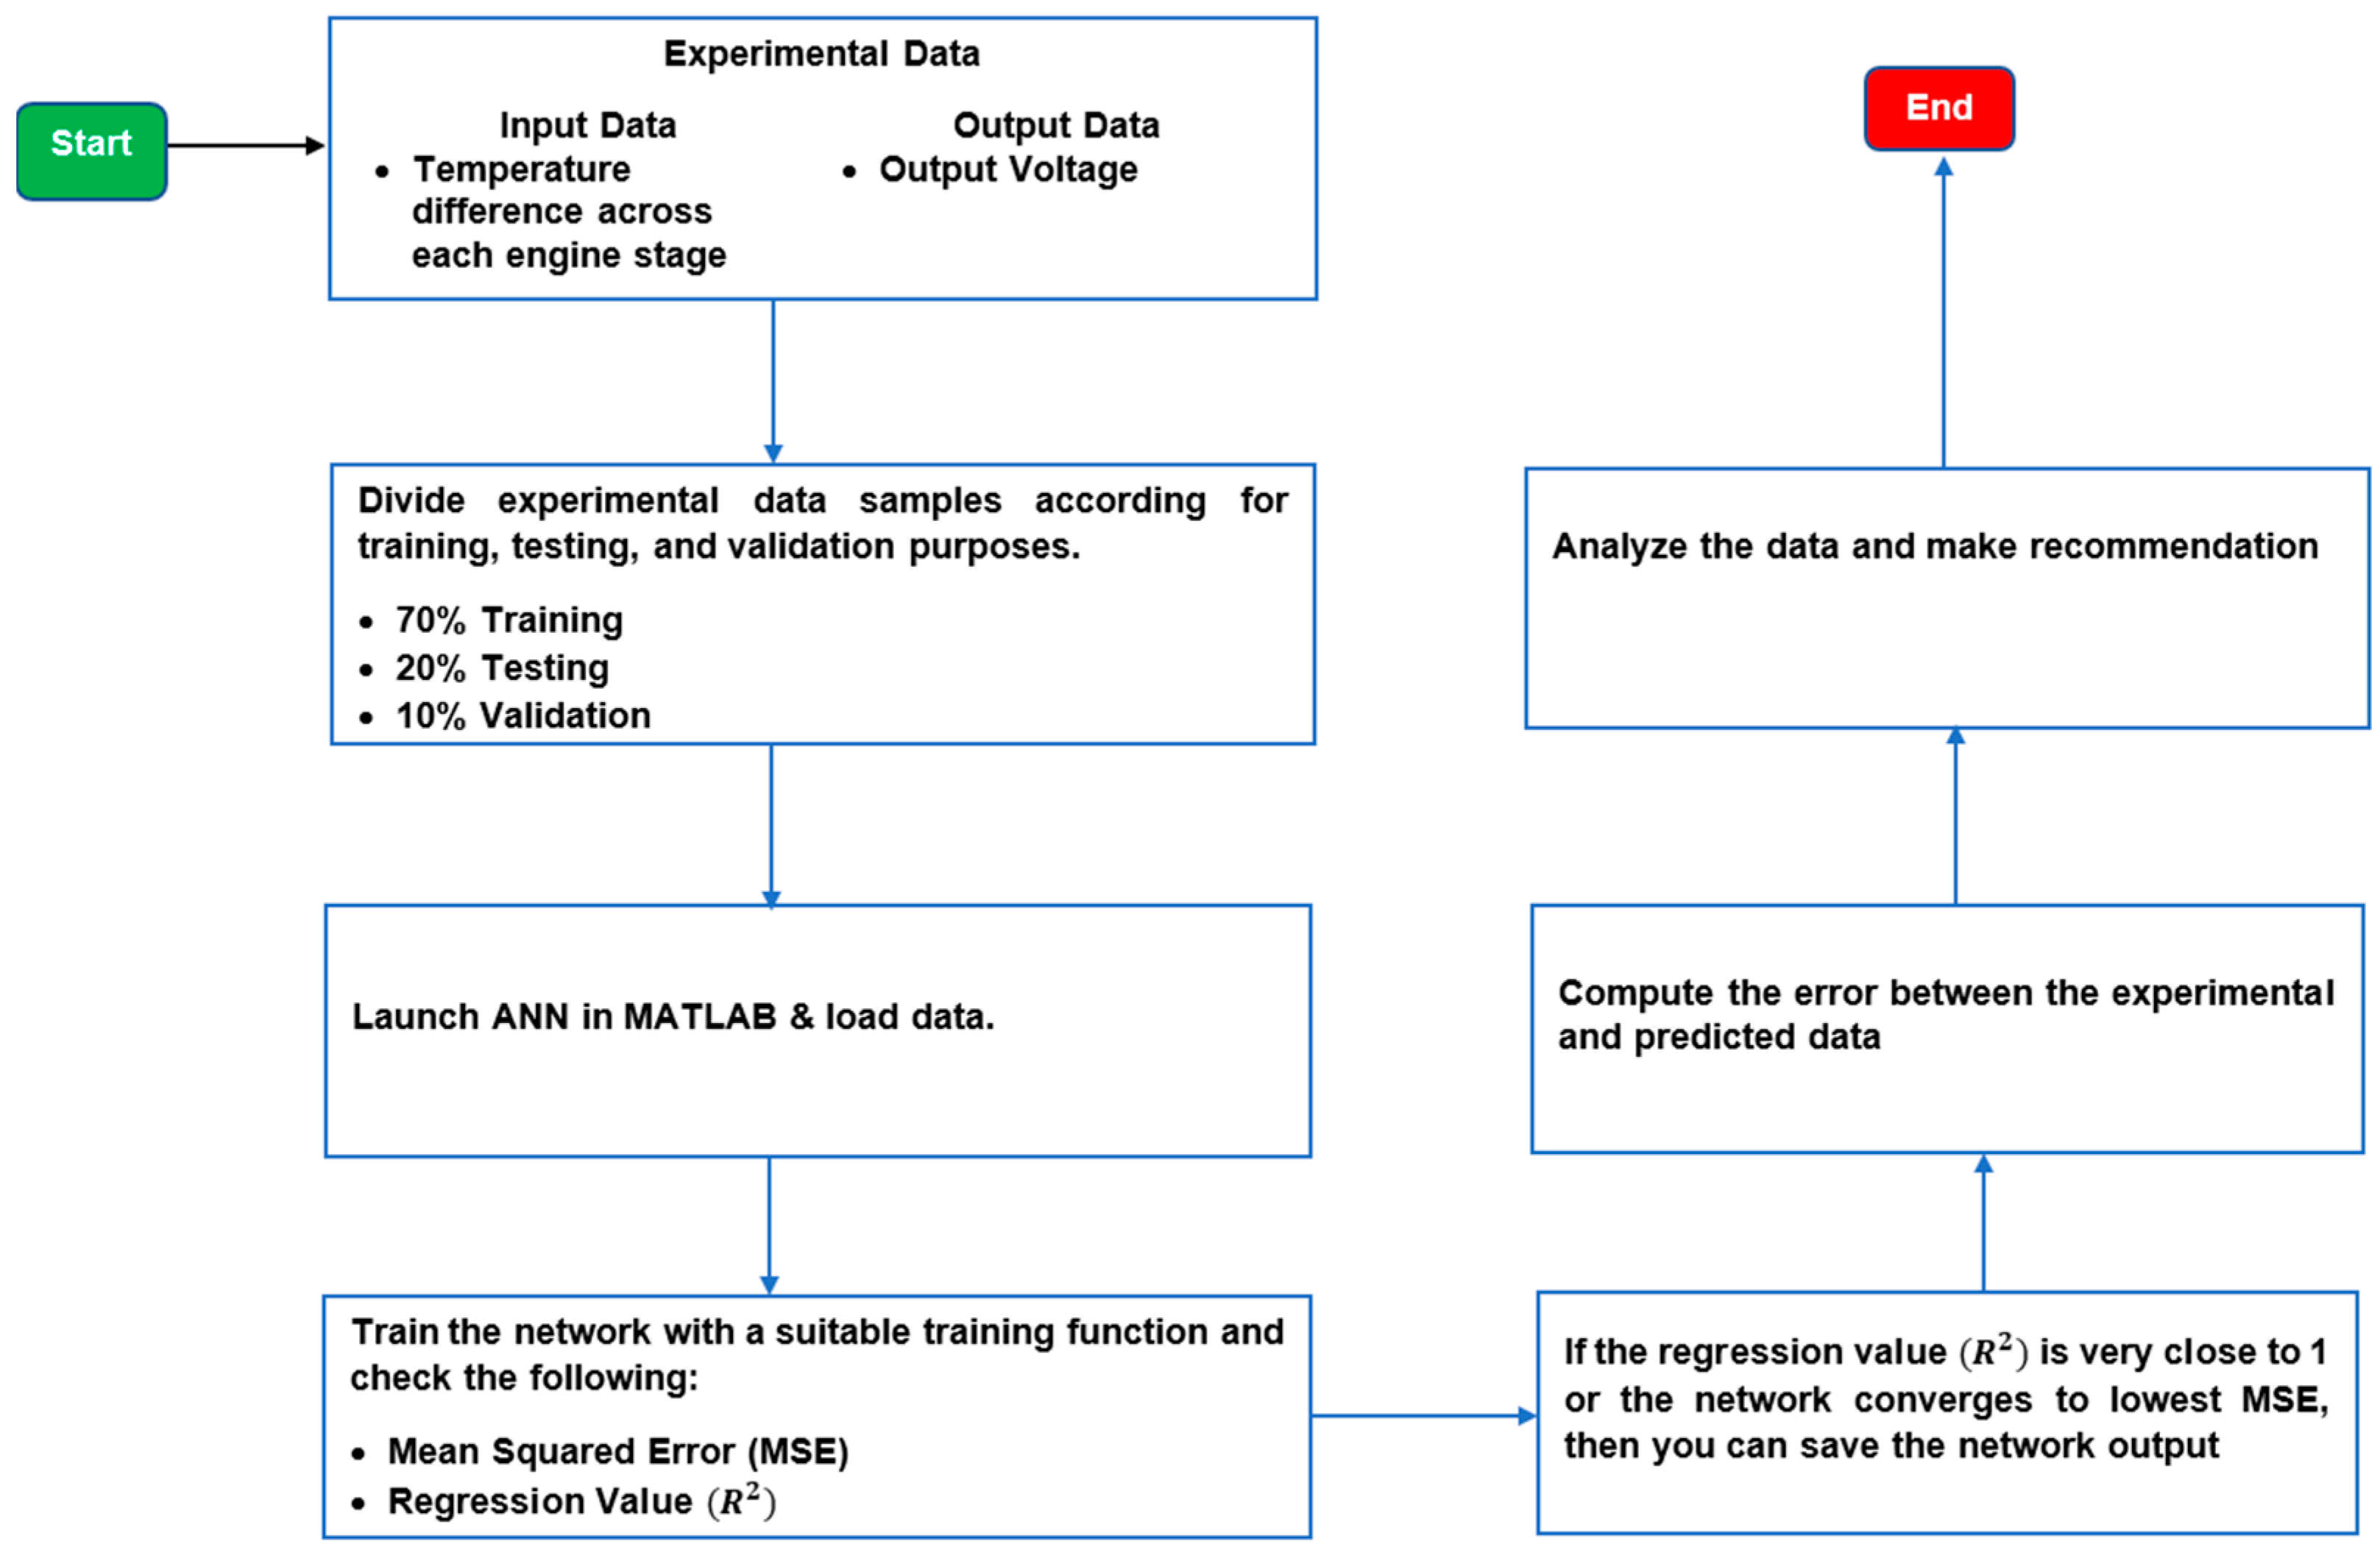
4.3. Artificial Neural Network (ANN)

Artificial neural network (ANN) models were developed using MATLAB software (Matlab 2018). Parametric analysis was performed to identify the configuration of the model that yielded the best results. This was achieved by adjusting the number of neurons in the hidden layers iteratively. The neural fitting app facilitated network training, data selection, and performance evaluation based on mean square error and regression analysis. For this study, a two-layer feed-forward network with a linear target neuron and sigmoid hidden neurons was employed to fit 52 datasets derived from diverse configurations of traveling-wave thermo-acoustic systems. The Levenberg–Marquardt backpropagation algorithm was chosen for training due to its efficiency in processing data [3]. To ensure robust evaluation, the dataset was partitioned into three subsets: 37 samples (70%) for training, 5 samples (10%) for validation, and 10 samples (20%) for testing purposes. The input parameters for the ANN prediction were the onset temperature difference across each engine stage and the number of engine stages. The architecture of the neural network models, as depicted in Figure 5, outlines the configurations utilized to predict the output voltage for both multiple-stage and single-stage thermo-acoustic generators. The variables X 1 to X 4 represent the temperature differences across each engine stage, while X n signifies the number of engine stages. The variable W denotes the weight, a real value associated with each input or feature, conveying the importance of the corresponding feature in predicting the output parameter. Biases were incorporated to shift the activation function either right or left, and the summation function bound the weights and inputs together, calculating their sum. The activation function introduced nonlinearity into the model. The prediction error (Pe) and average prediction error (APe) were computed using the equations provided in reference [3]. Figure 6 illustrates a sequential process employed for the prediction of output voltage through the utilization of an ANN model.
Pe   % = Predicted   results Experimental   results Experimental   results × 100
APe   % = 1 n i n Predicted   results i Experimental   results i Experimental   results i × 100

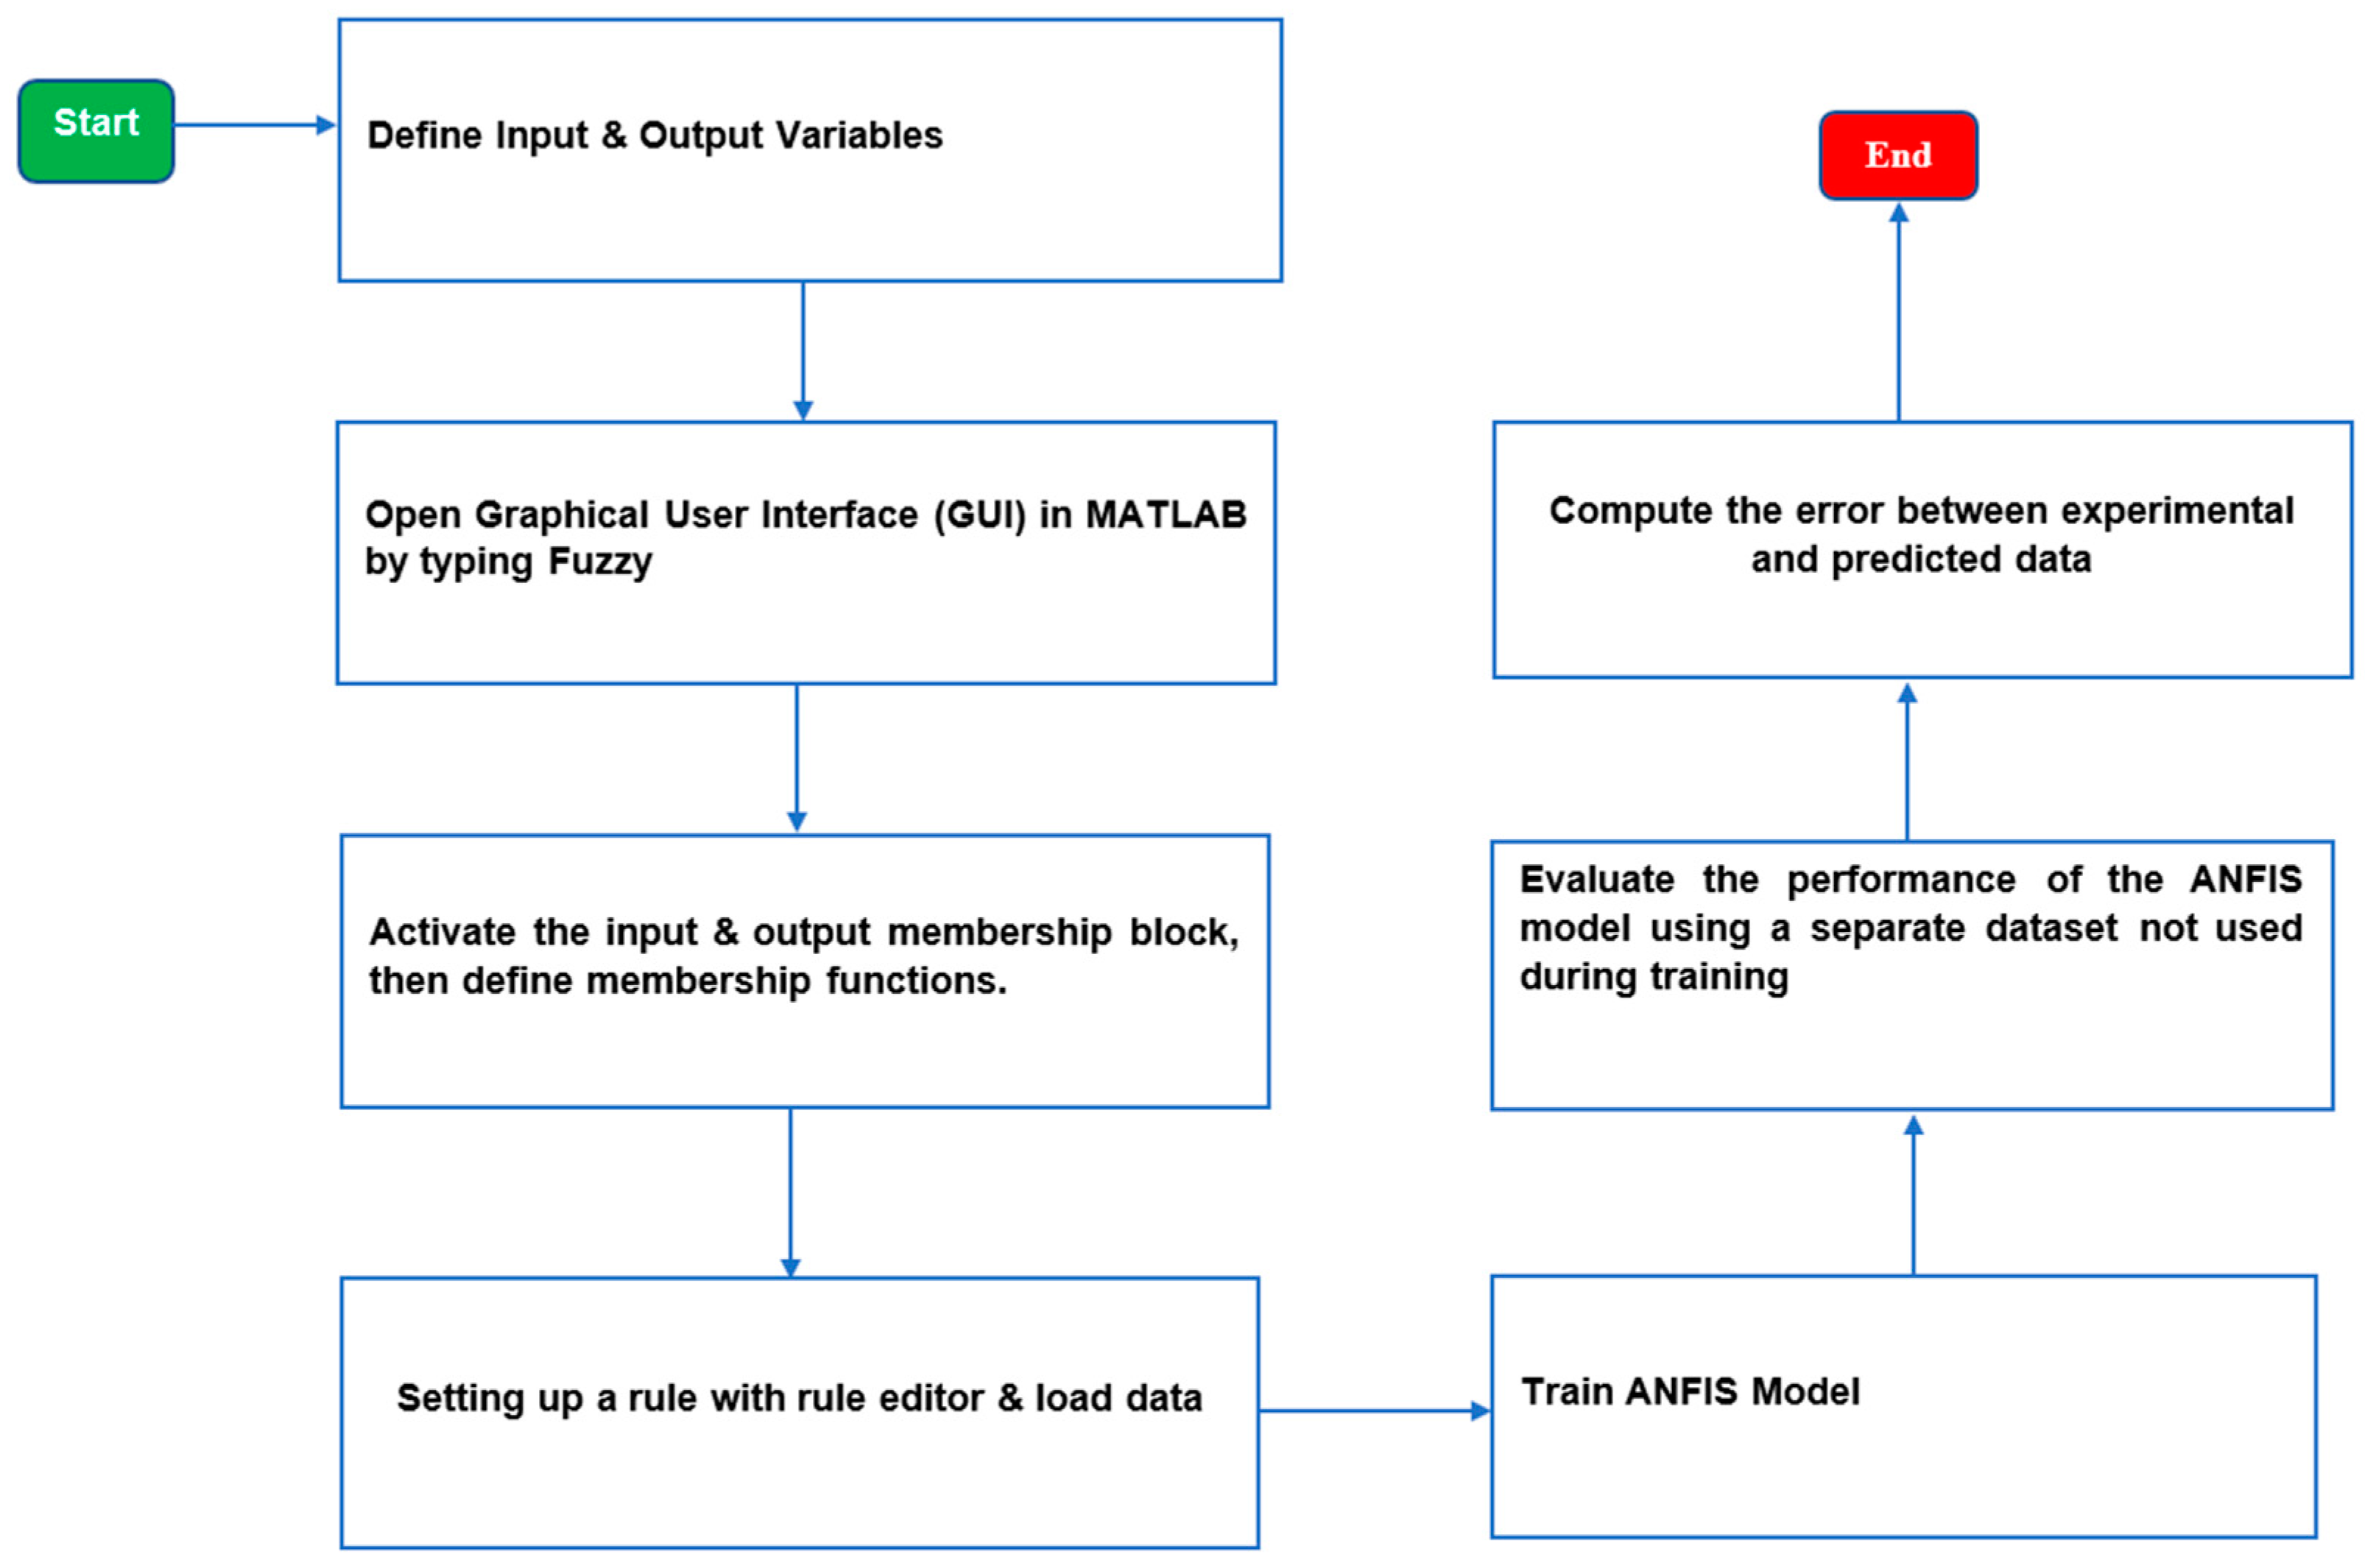
4.4. Adaptive Neuro Fuzzy-Inference System (ANFIS)
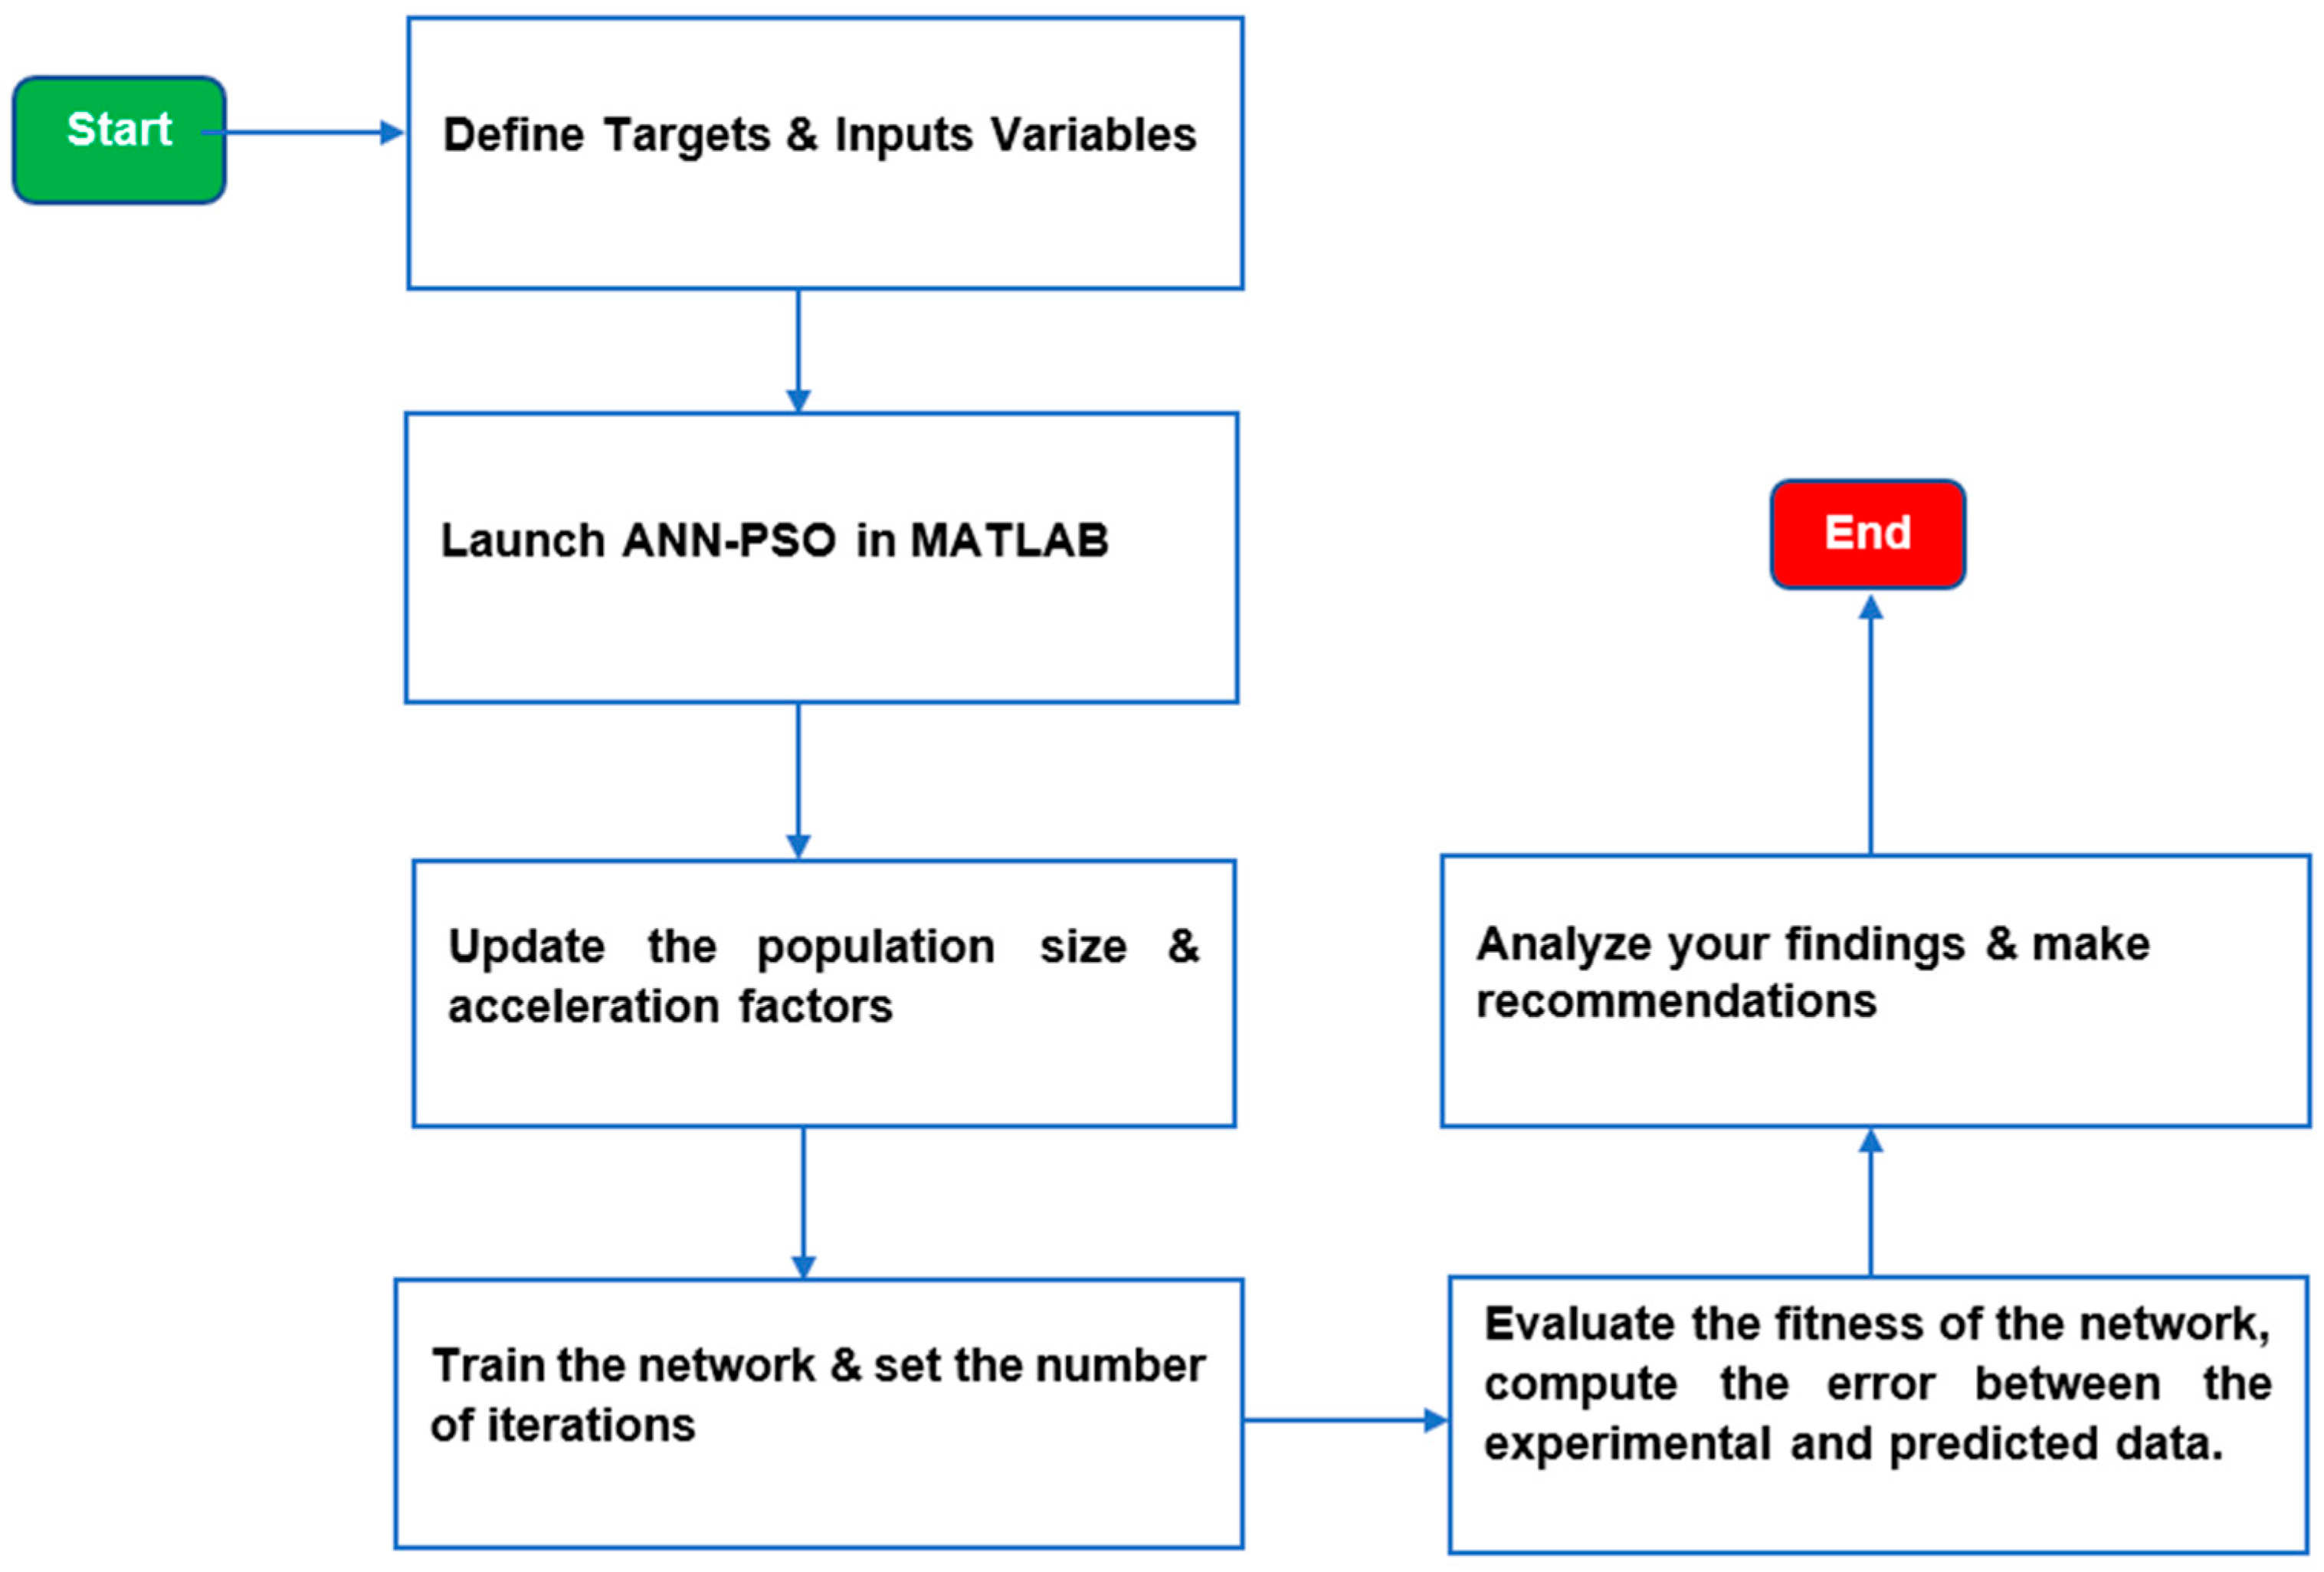
The experimental data were partitioned into training and testing sets to assess the predictive accuracy of the output voltage using the ANFIS model. The testing set comprised the minimum and maximum values (20%) of the experimental data, while the training set consisted of 80% of the data for network training. The input variables for the network were defined as the onset temperature difference across each engine stage and the number of engine stages, whereas the output voltage represented the target variable. This data partitioning ensured a distinct separation between the testing and training phases. The ANFIS model was trained over 1000 epochs for optimal performance. Figure 7 illustrates a sequential process employed for the prediction of output voltage through the utilization of an ANFIS model.

4.5. Hybrid ANN-PSO

The hybrid Artificial Neural Network–Particle Swarm Optimization (ANN-PSO) approach aims to enhance the predictive performance of the output voltage in traveling-wave thermo-acoustic generators. To implement this technique, the ANN model has been integrated with Particle Swarm Optimization (PSO). A total of 52 data points were generated for both single-stage and multiple-stage thermo-acoustic systems. These data were then divided into two sets: one for training and the other for testing. Specifically, 42 data points were utilized to train the hybrid ANN-PSO model, while 10 were reserved to test the models. The PSO parameters, including the number of neurons in the hidden layer (n), swarm size population (N), and values of the acceleration factors ( C 1 and C 2 ), were systematically adjusted. Multiple runs were conducted, exploring various combinations of these parameters to ensure the development of a robust network. Throughout this research study, 7 different neuron counts (ranging from 5 to 11), diverse swarm sizes spanning from 15 to 420, and acceleration factors ( C 1 and C 2 ) in the range of 1 to 3 were considered for the prediction of the output voltage for both single-stage and multiple-stage engines. The number of iterations was uniformly set to 1000. Figure 8 illustrates a step-by-step process employed to predict the output voltage using a hybrid Artificial Neural Network-Particle Swarm Optimization (ANN-PSO) model.

5. Results and Discussion

This section presents the experimental results for both single-stage and multiple-stage traveling-wave thermo-acoustic generators. A dataset comprising 52 data points was employed to construct the ANN, ANN-PSO, and ANFIS models. The analysis focused on the onset temperature difference across each engine stage and the number of engine stages to assess the thermo-acoustic system’s performance. The output voltage served as the primary performance metric for evaluating the thermo-acoustic device. The experimental data for both single-stage and multiple-stage thermo-acoustic systems are outlined in Table 2.

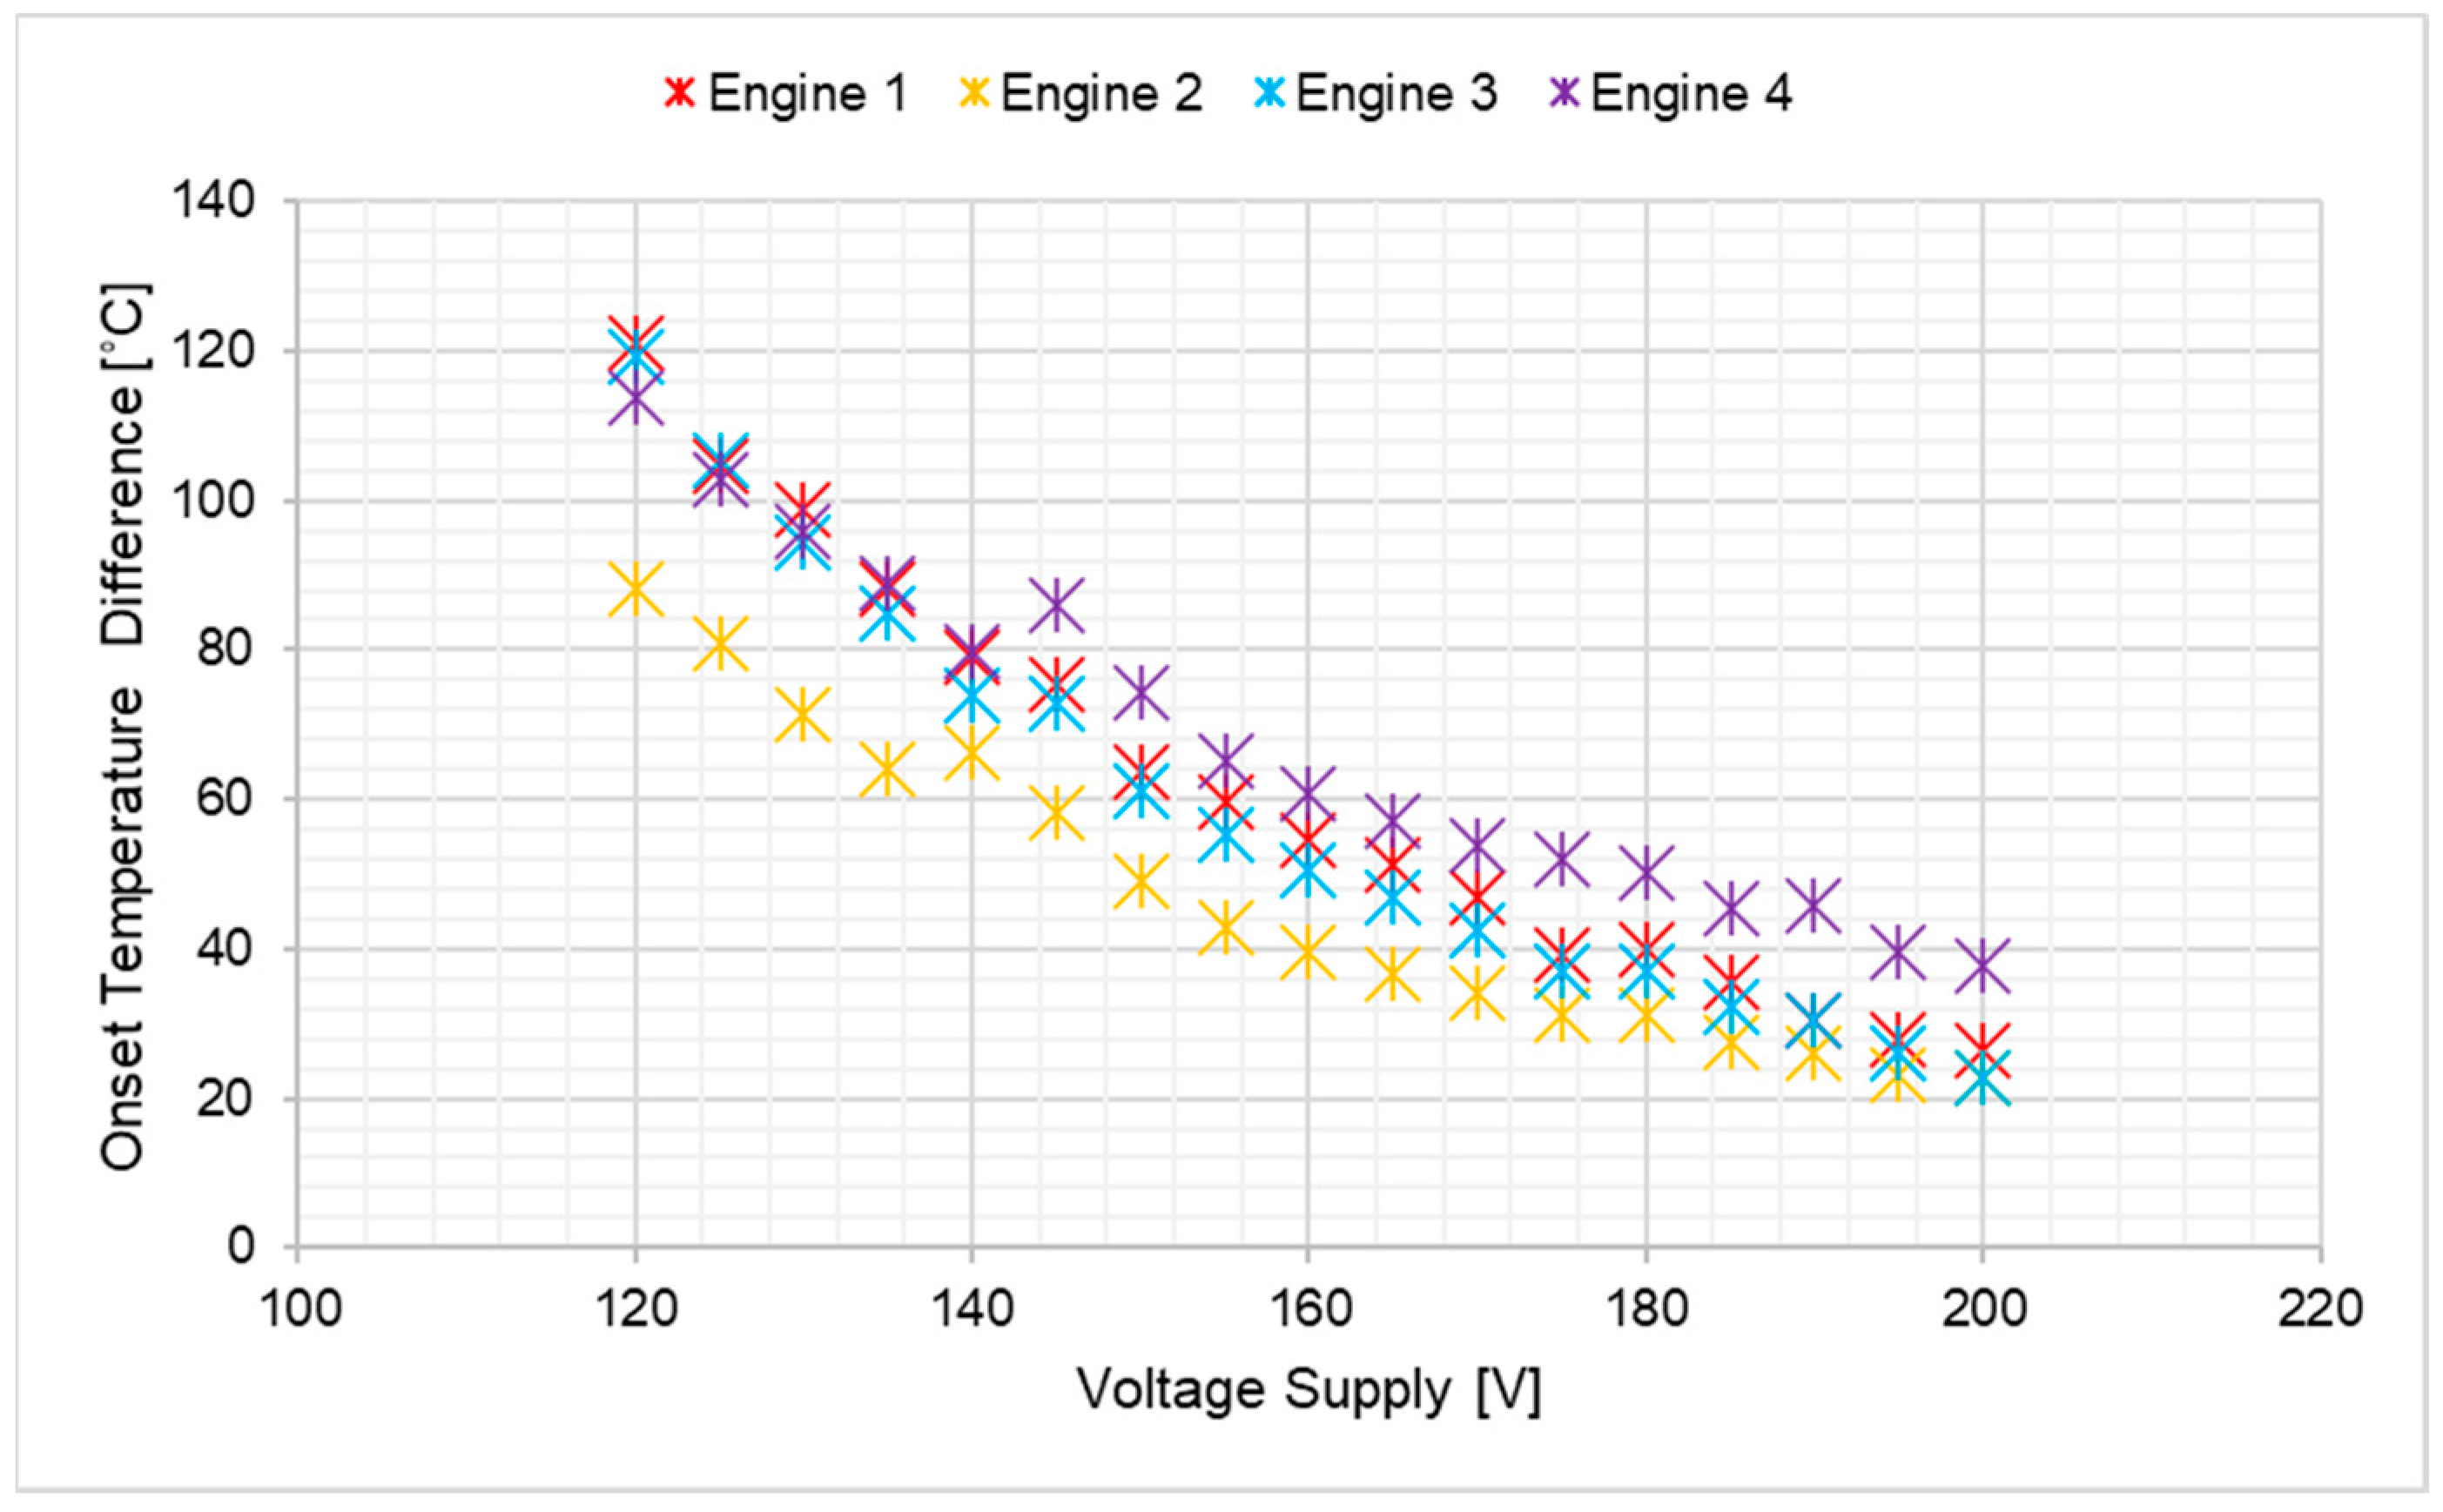
5.1. Comparison of a Temperature Difference of a Four-Stage Configuration

The four-stage traveling-wave thermo-acoustic system underwent an experimental investigation, focusing on the analysis of temperature differentials across each engine stage. Heat was concurrently supplied to all engine stages ranging from 200 V to 120 V. It was observed that despite the visual similarity in design, the engine stages were not identical, leading to distinct temperature differentials. The graphical representation in Figure 9 clearly illustrates that the second engine exhibited the lowest on-set temperature difference.

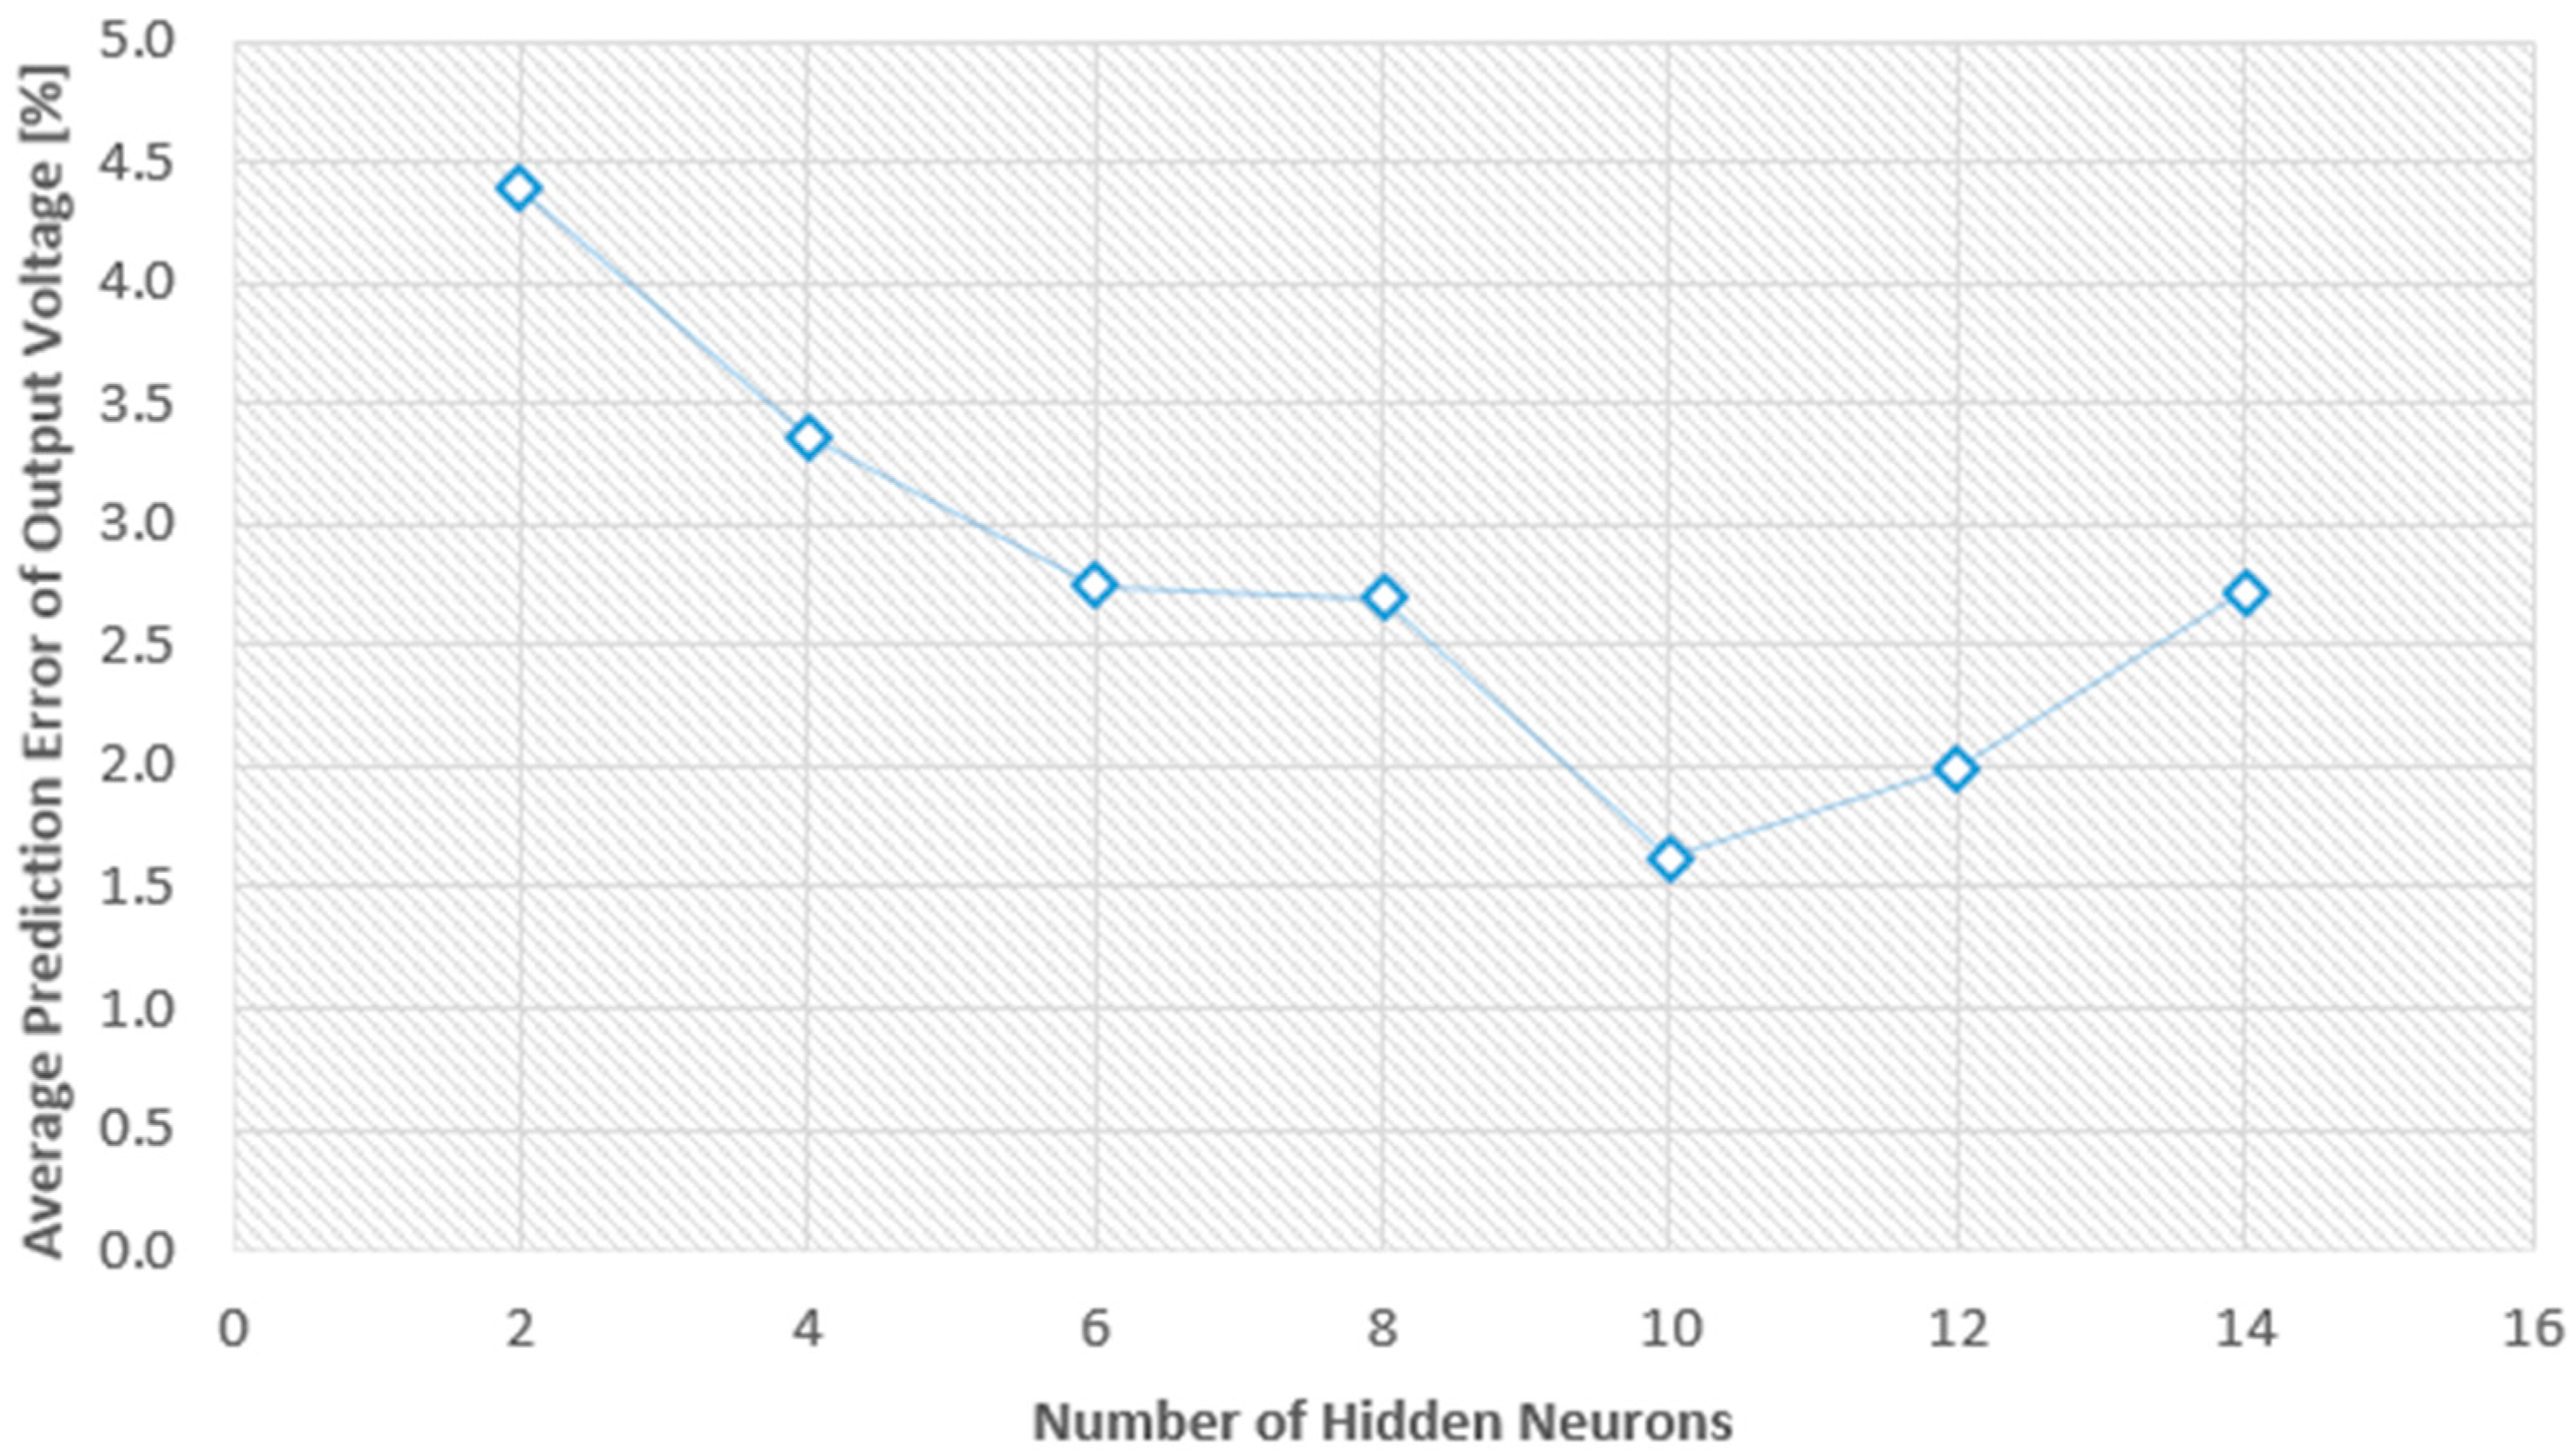
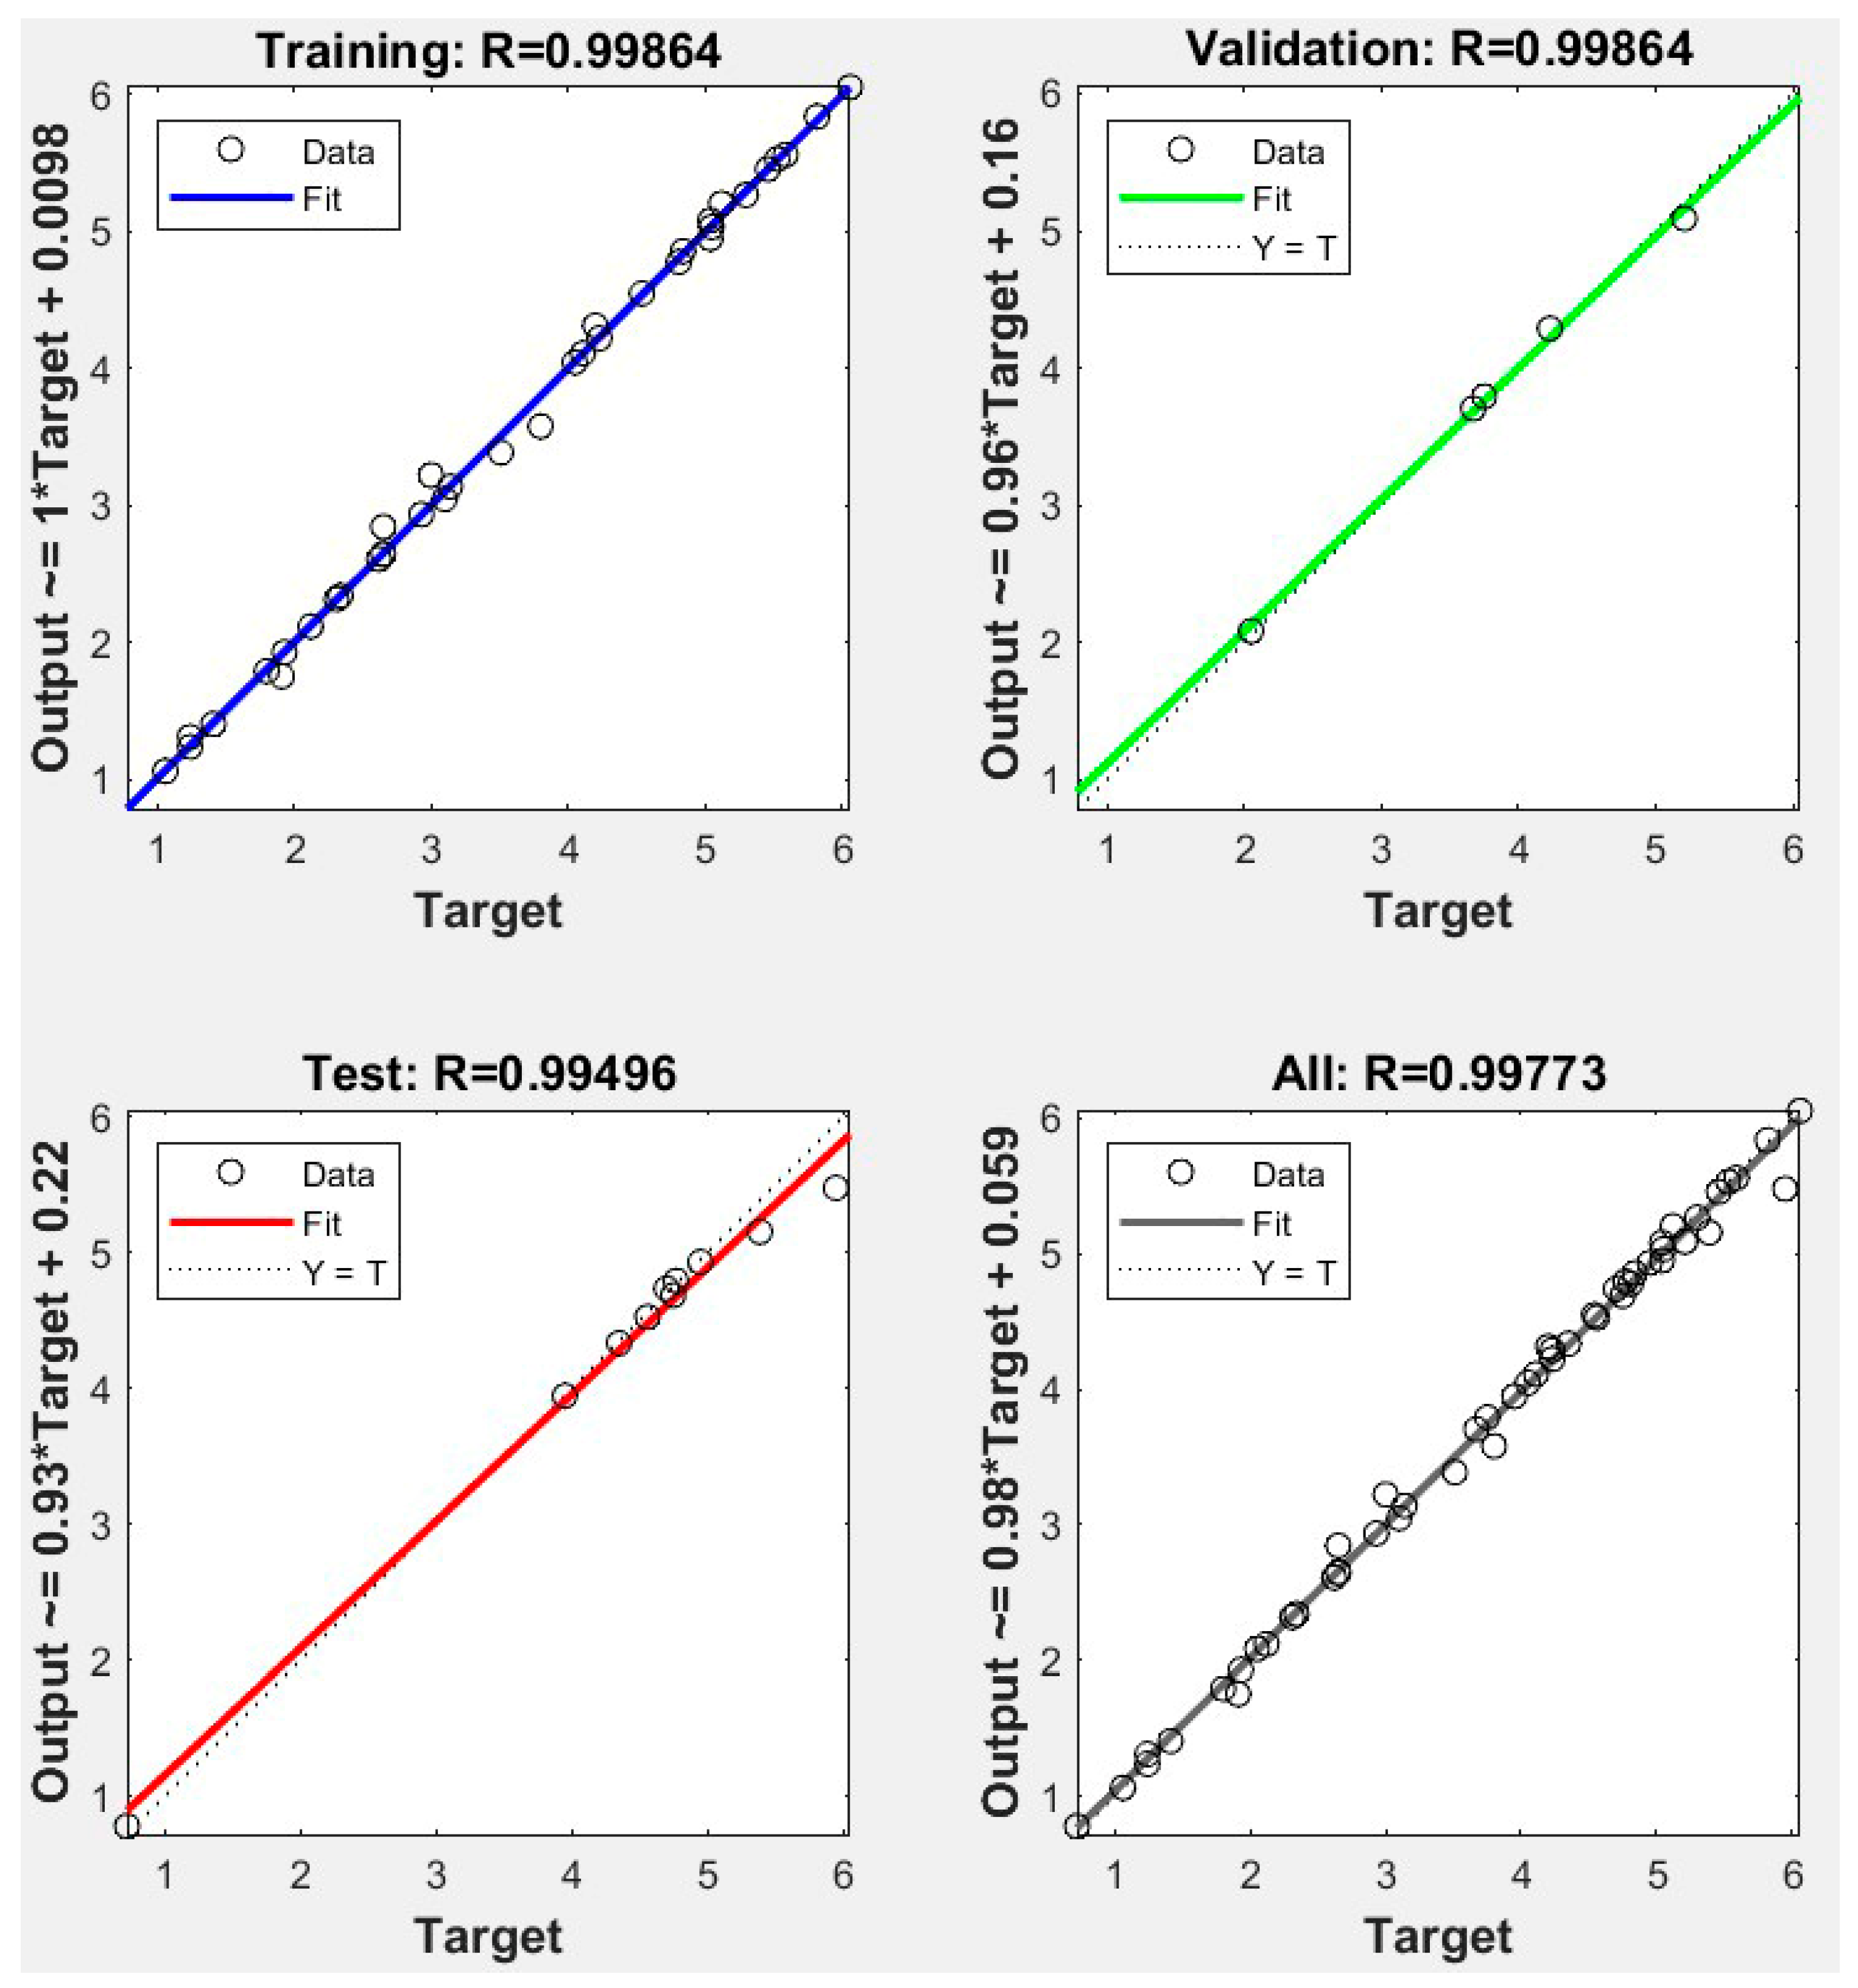
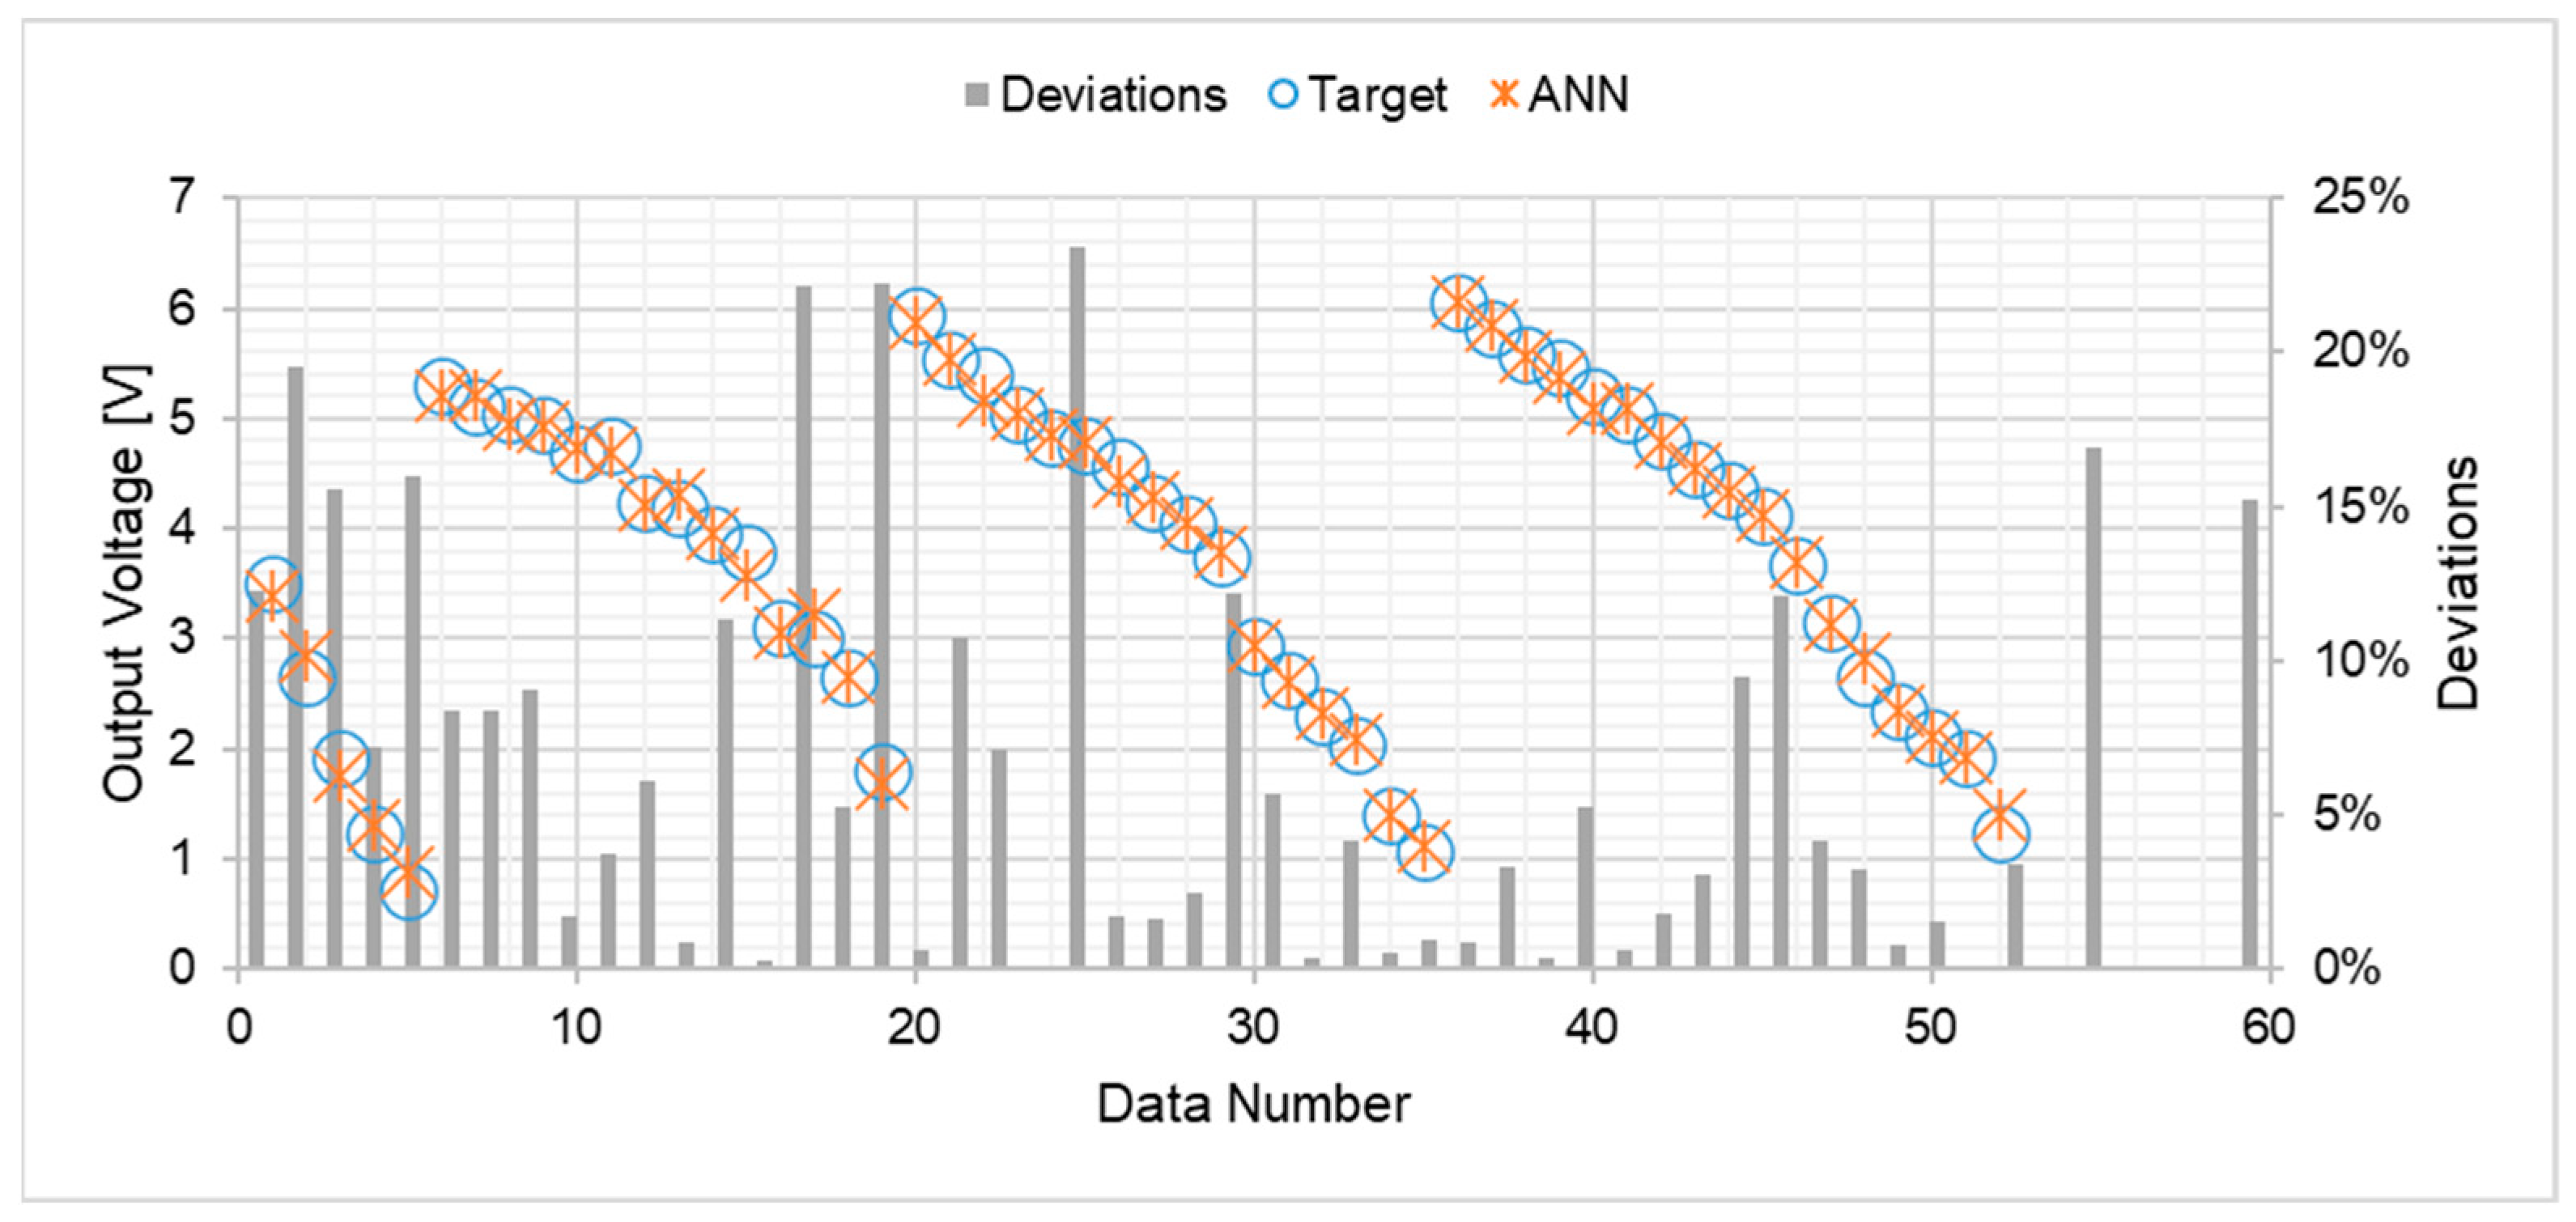
5.2. ANN Model Prediction

The ANN model was employed to predict the output voltage for both single-stage and multiple-engine configurations. The training process involved adjusting the number of hidden neurons, ranging from two to fourteen, and conducting three iterations. This endeavor aimed to identify the optimal ANN architecture that minimizes the deviation between experimental data and predicted values of output voltage. The discrepancies between the model’s predictions and the experimental data were calculated and subsequently plotted against the number of neurons in the hidden layers, as illustrated in Figure 10, which reveals that the average prediction error was minimized when employing ten (10) neurons. Consequently, the most effective network configurations for accurately predicting output voltage were those featuring 10 hidden neurons. Specifically, the output voltage network necessitates 5 input nodes and 1 output neuron, denoted as a 5-10-1 configuration. The regression analysis, as depicted in Figure 11, highlights the robust performance of the model. Both the training and validation phases demonstrate high regression values of 0.99864, while the testing phase exhibits a slightly lower yet commendable value of 0.99496. This underscores the efficacy of the proposed ANN model in accurately predicting the output voltage for both single-stage and multiple-stage engines. Figure 11 showcases the model’s proficiency in generating reliable responses for any new input data within the scope of our study.
The experimental data were compared with the results predicted by the Artificial Neural Network (ANN) model, and this comparison is visually depicted in Figure 12. The analysis reveals a notable alignment between the experimental and model-predicted data, with the most significant deviation being only 23.45%. These results reveal the effectiveness of the proposed model. The deviation was determined by subtracting the experimental data from the predicted data and then multiplying the result by 100 to express it as a percentage. This research suggests that it is possible to estimate the performance of both single-stage and multiple-stage configurations that were not specifically examined in the experiments, thereby reducing the need for time-consuming experimental trials.

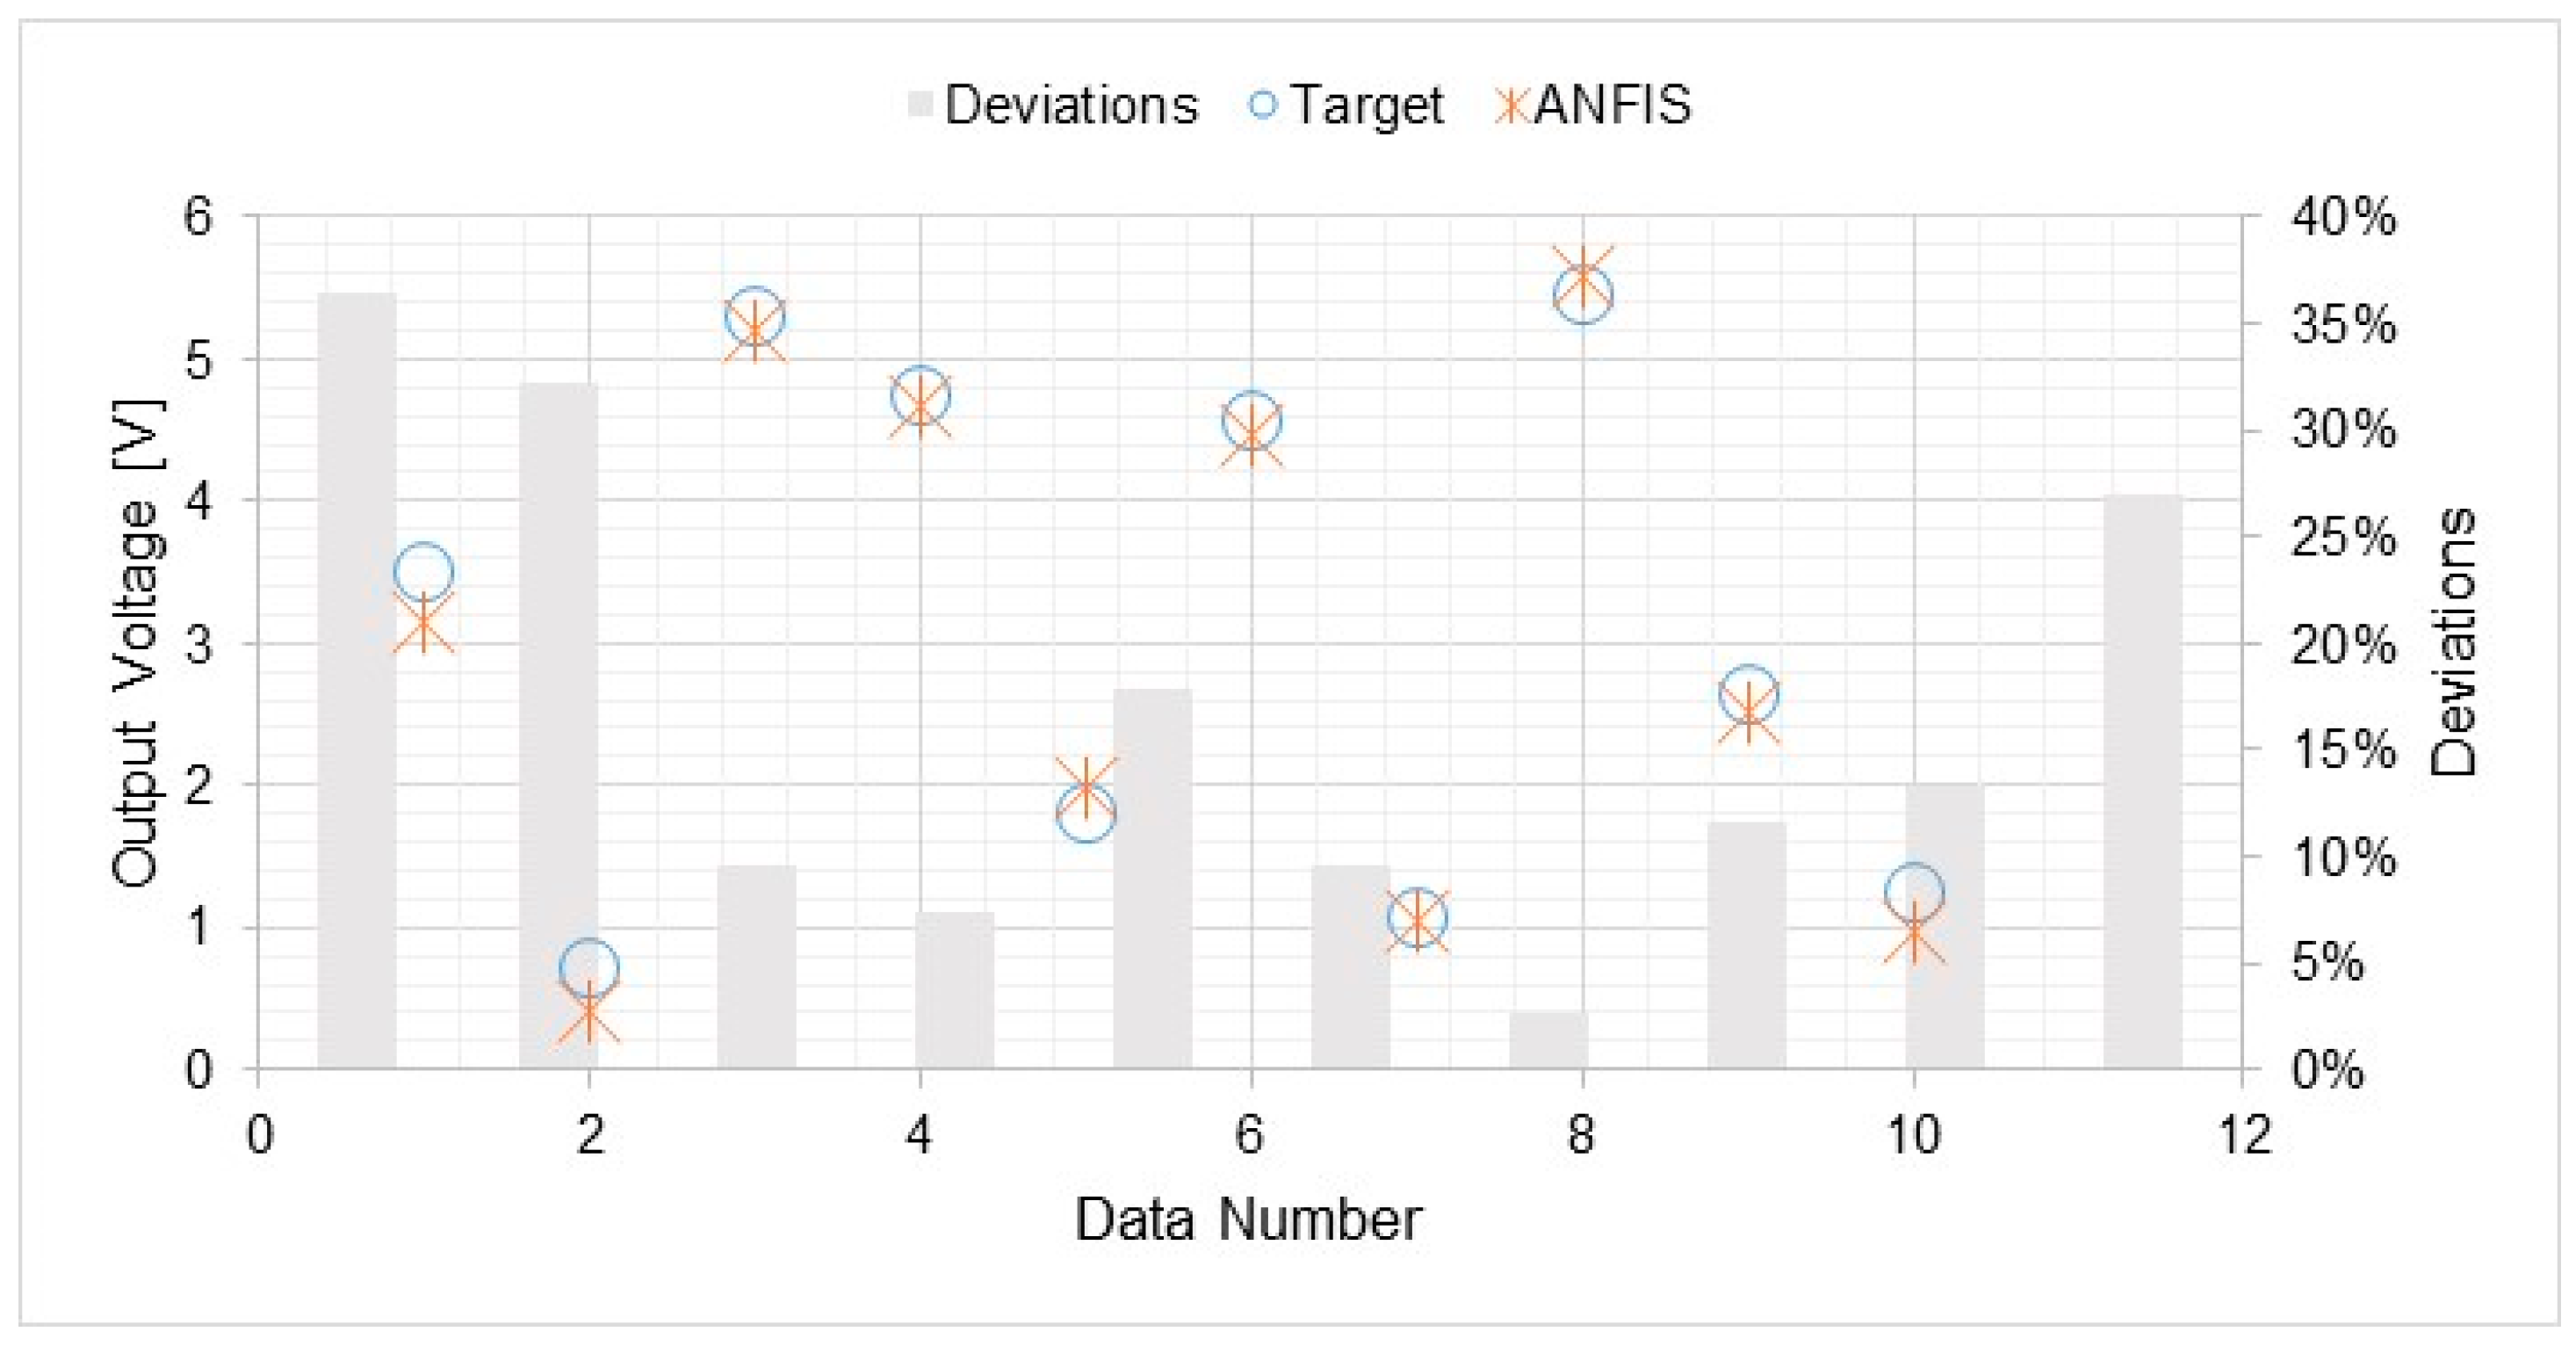
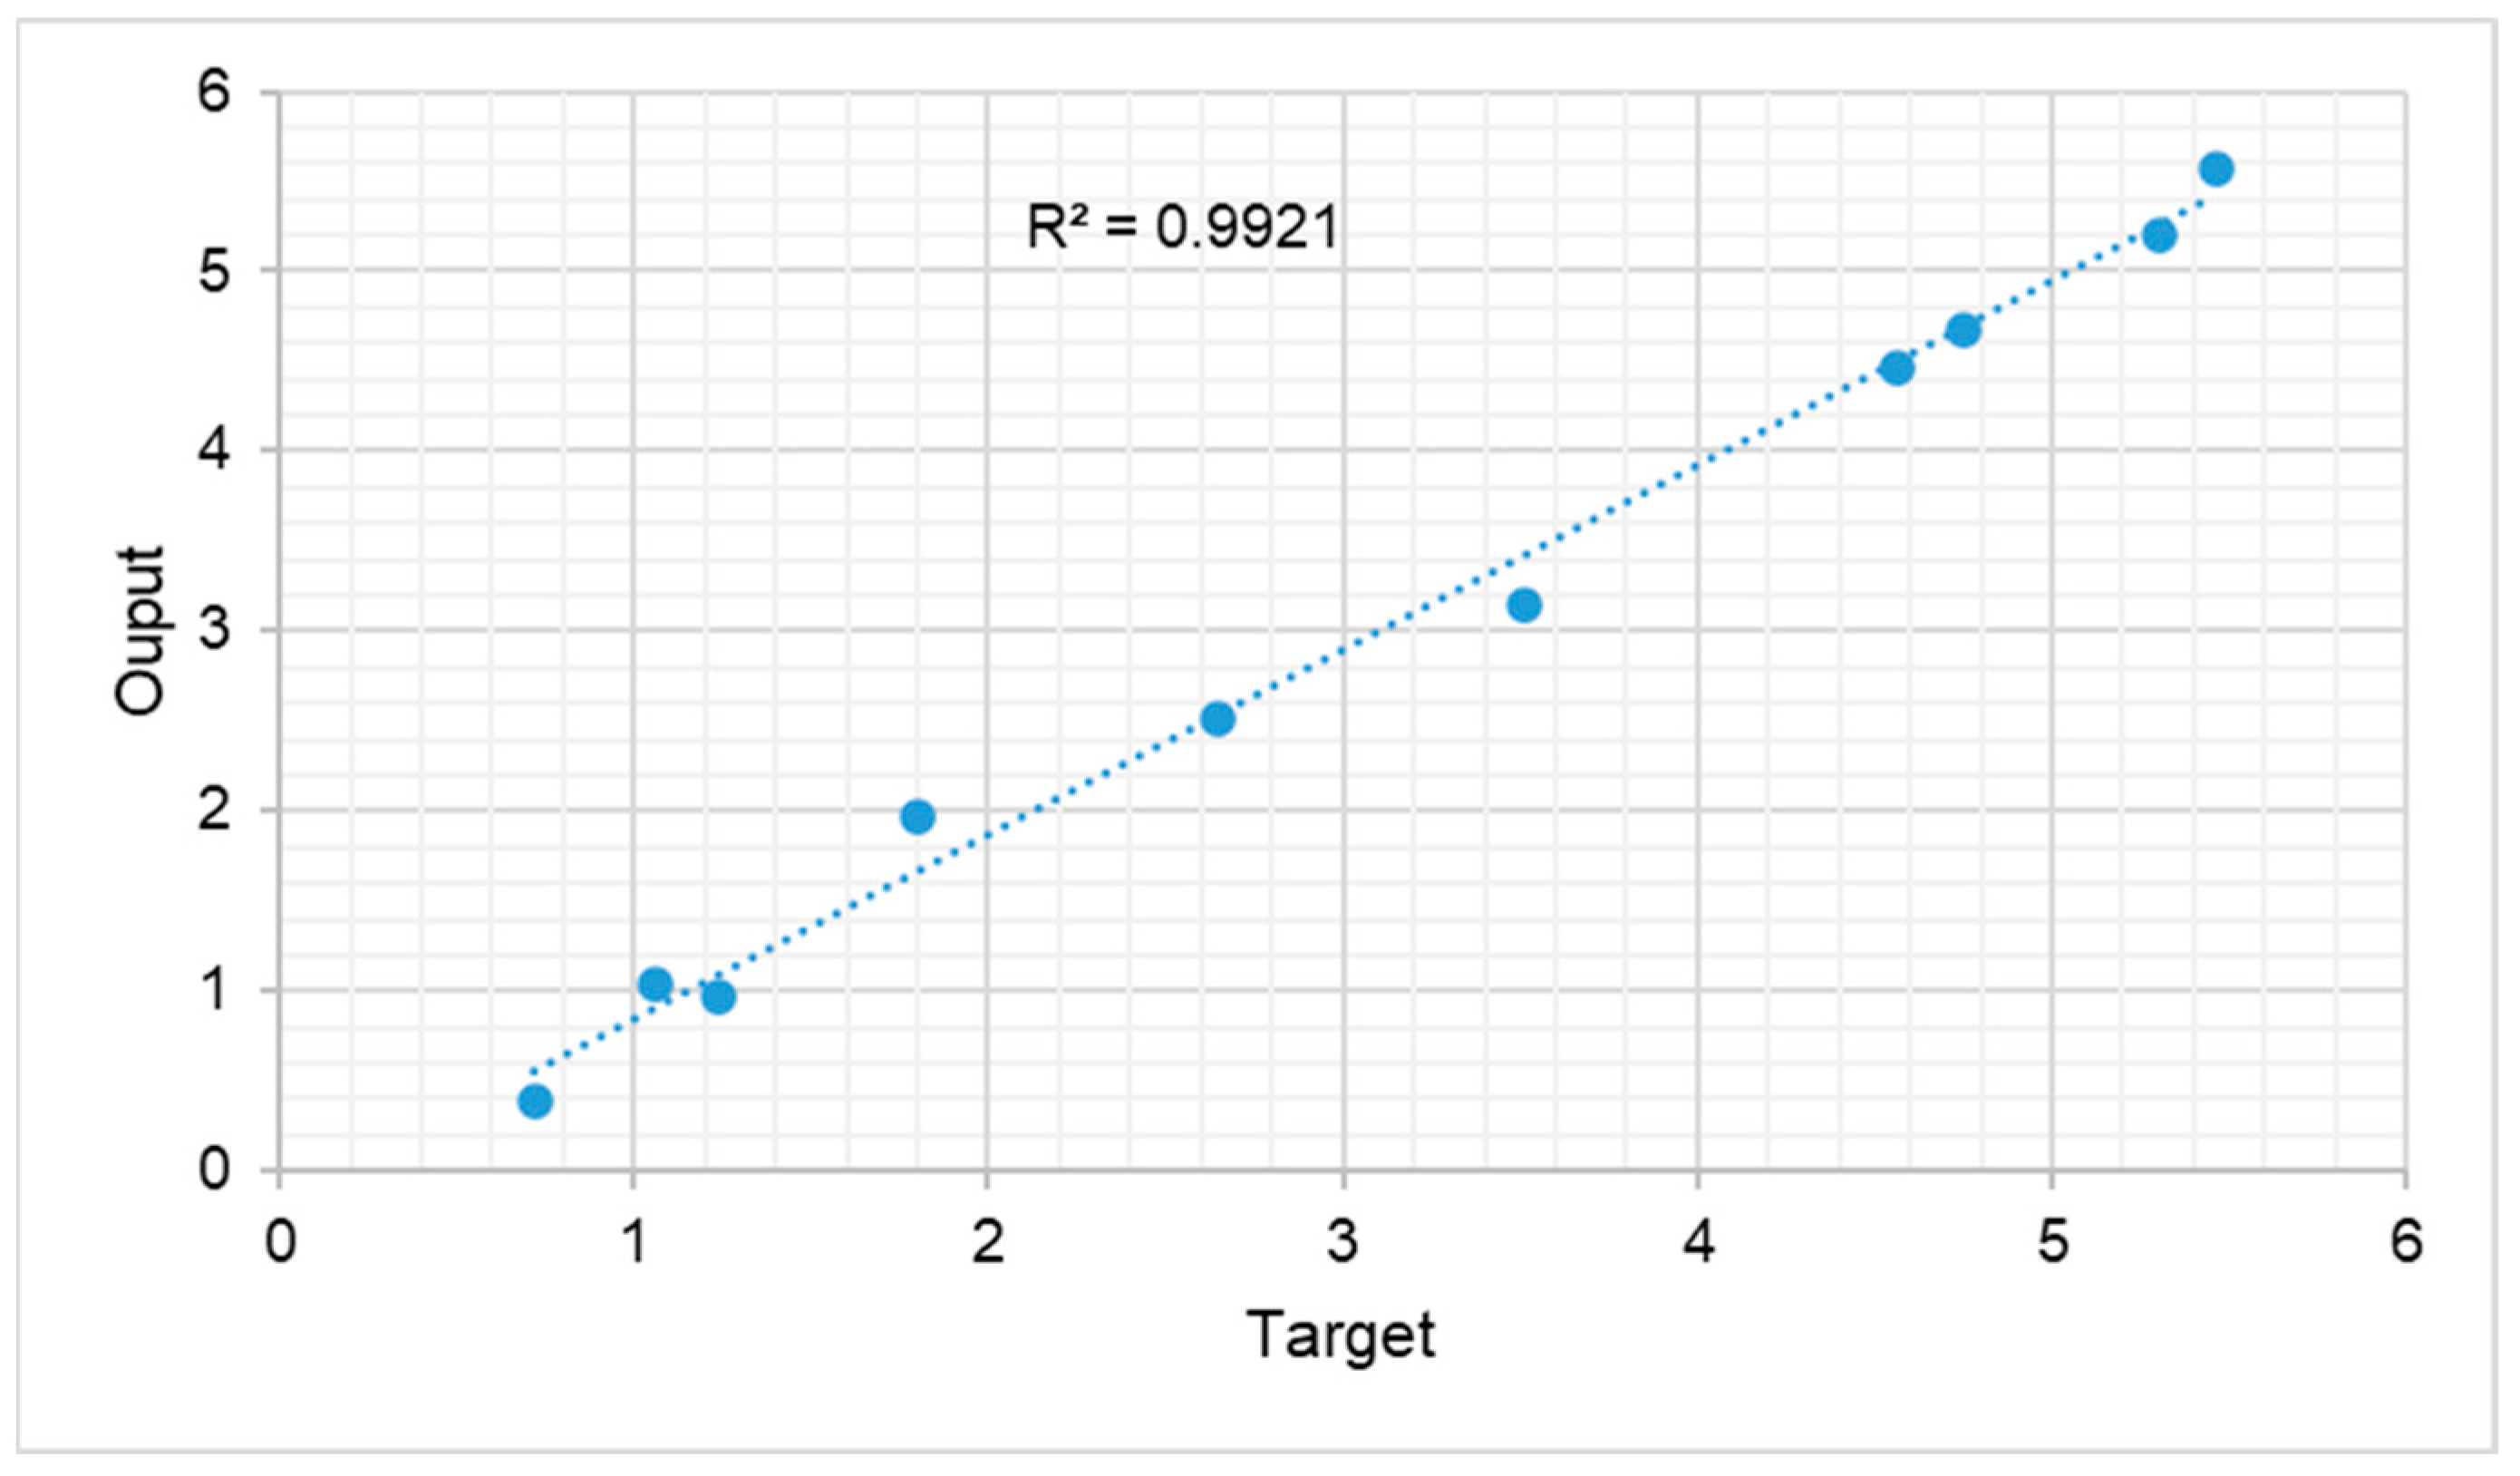
5.3. ANFIS Model Prediction

The experimental data for both single-stage and multiple-stage engines were compared with the predictions generated by the ANFIS model, and the results have been visually represented in Figure 13. Upon careful examination of the graphical representation, it is evident that the trends in the experimental results for both single-stage and multiple-stage engines closely align with the output predictions generated by the ANFIS model. This observed agreement is further substantiated by the high regression test value of 0.9921, as demonstrated in Figure 14. Furthermore, Figure 15 provides a comprehensive three-dimensional surface plot illustrating the correlation between the temperature difference across each engine stage and the corresponding output voltage. This plot serves to visually elucidate the intricate relationship between these variables.

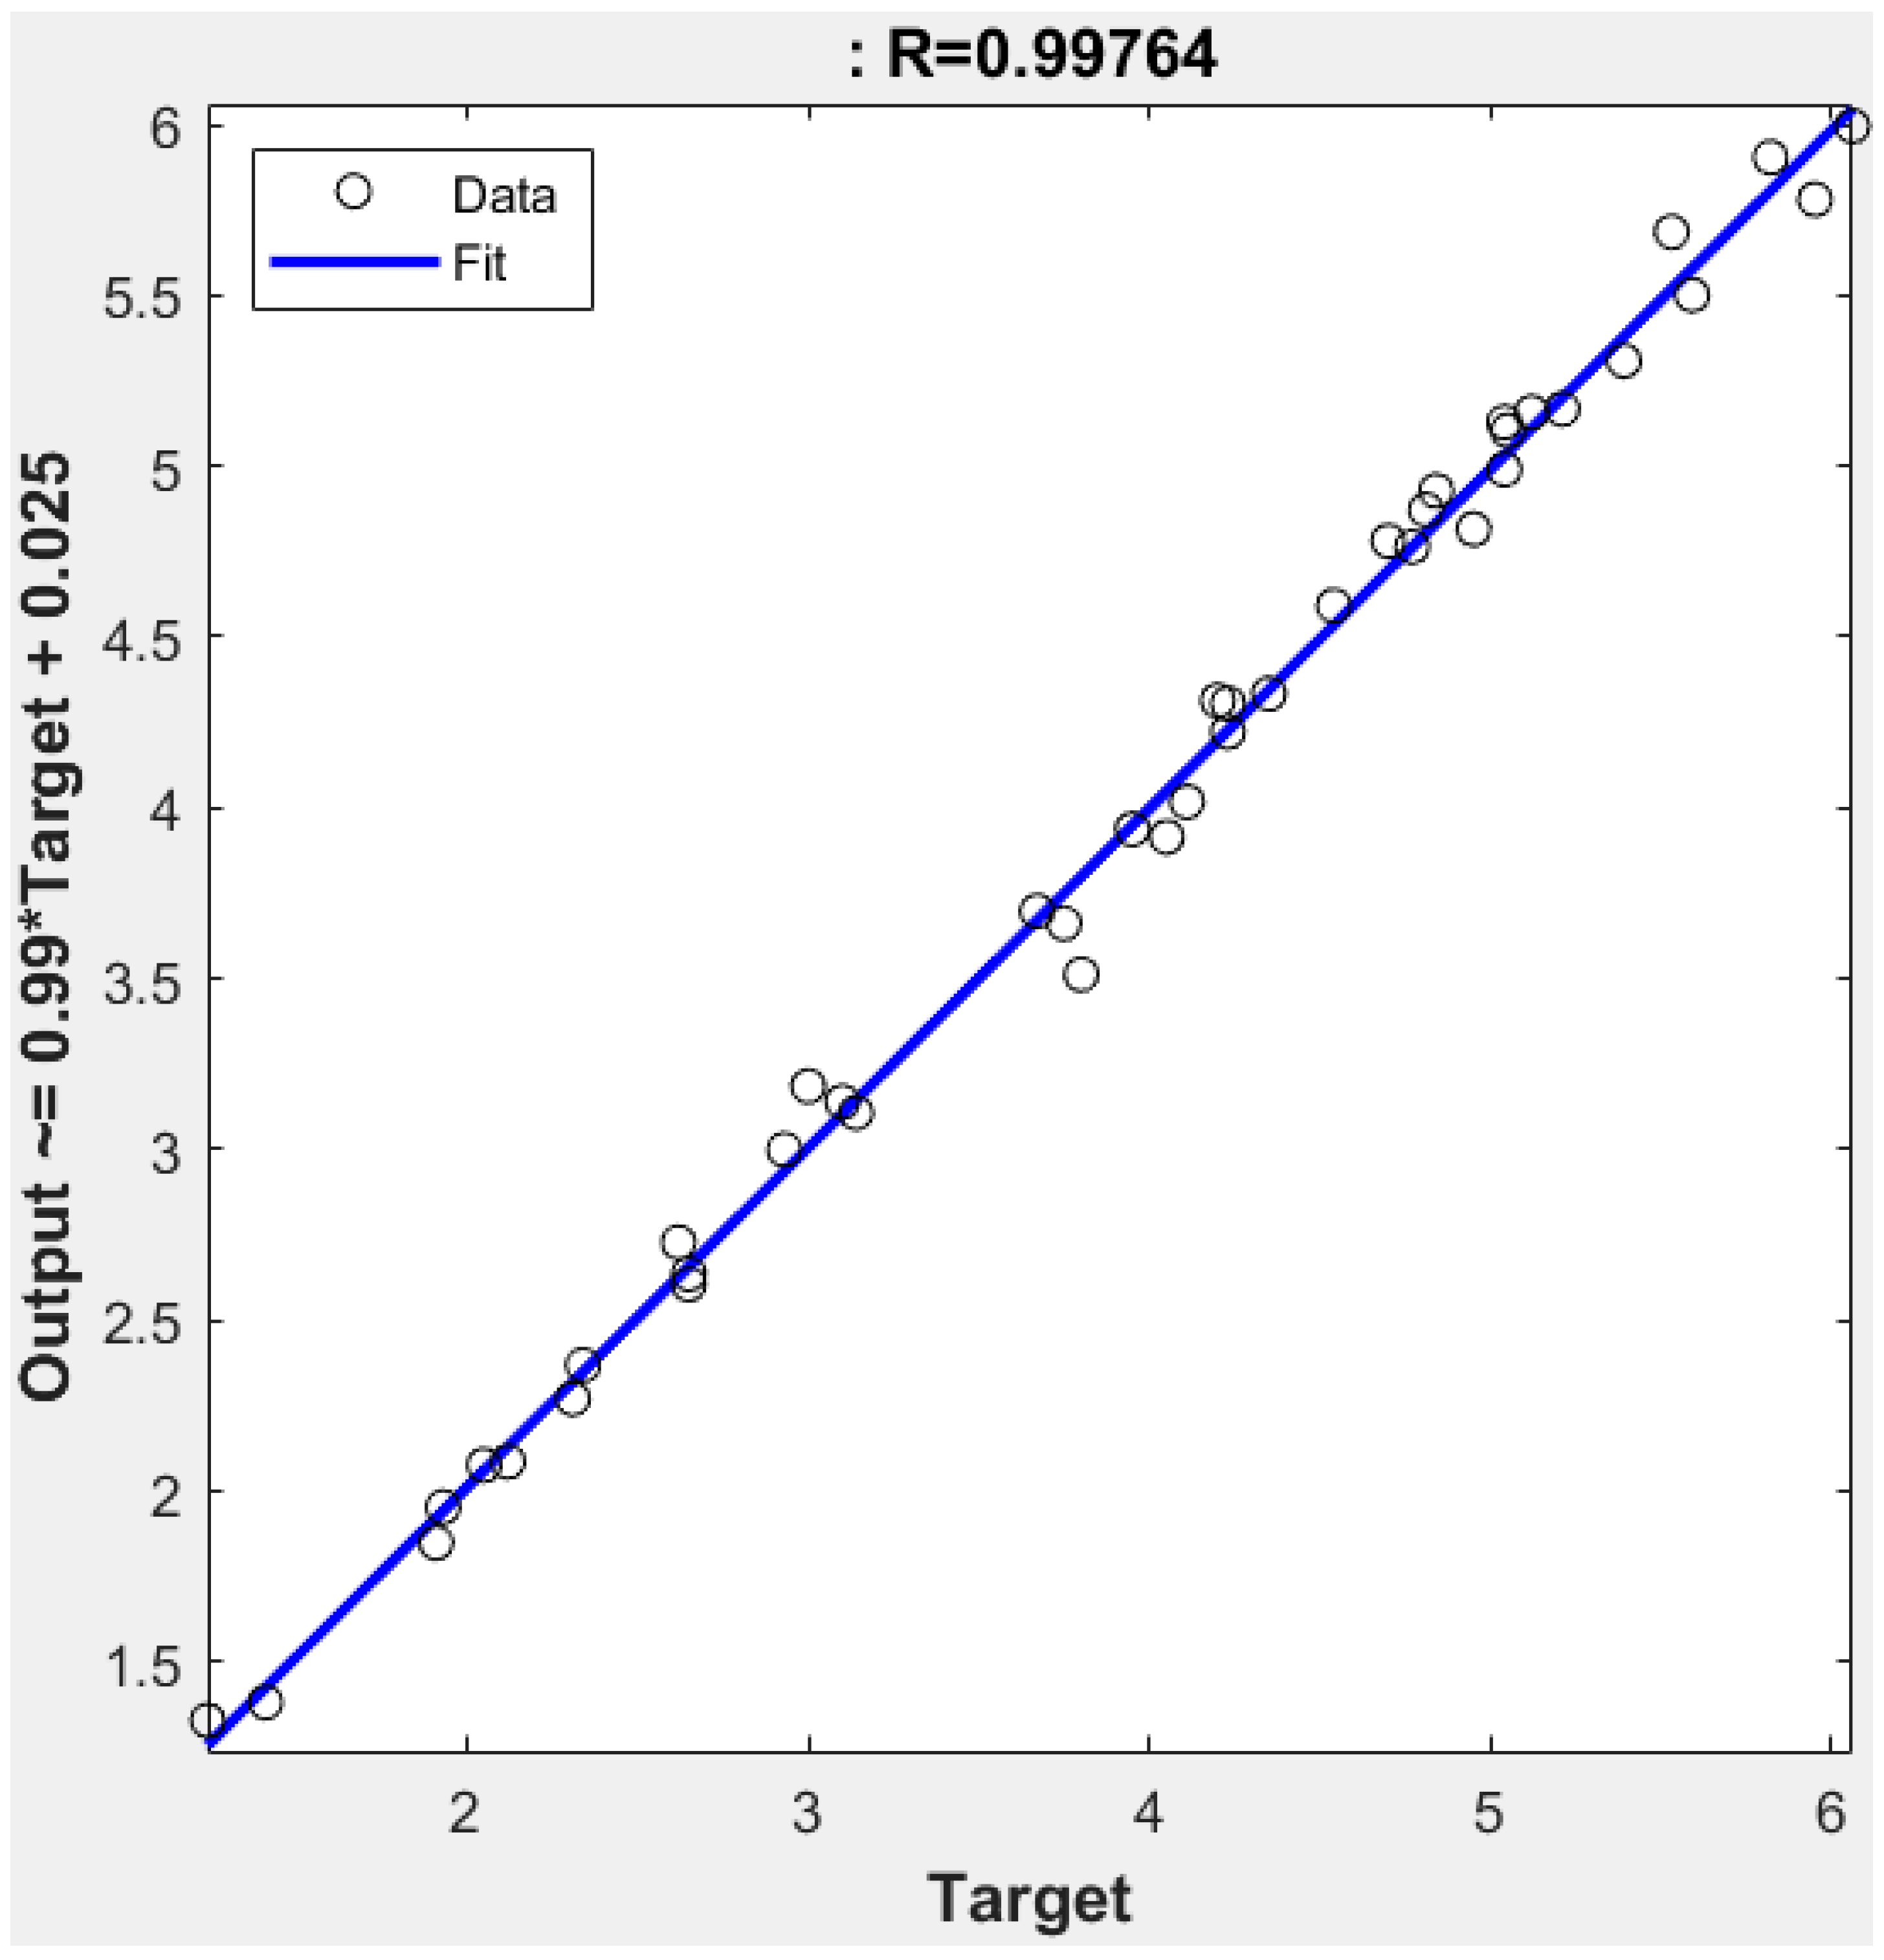
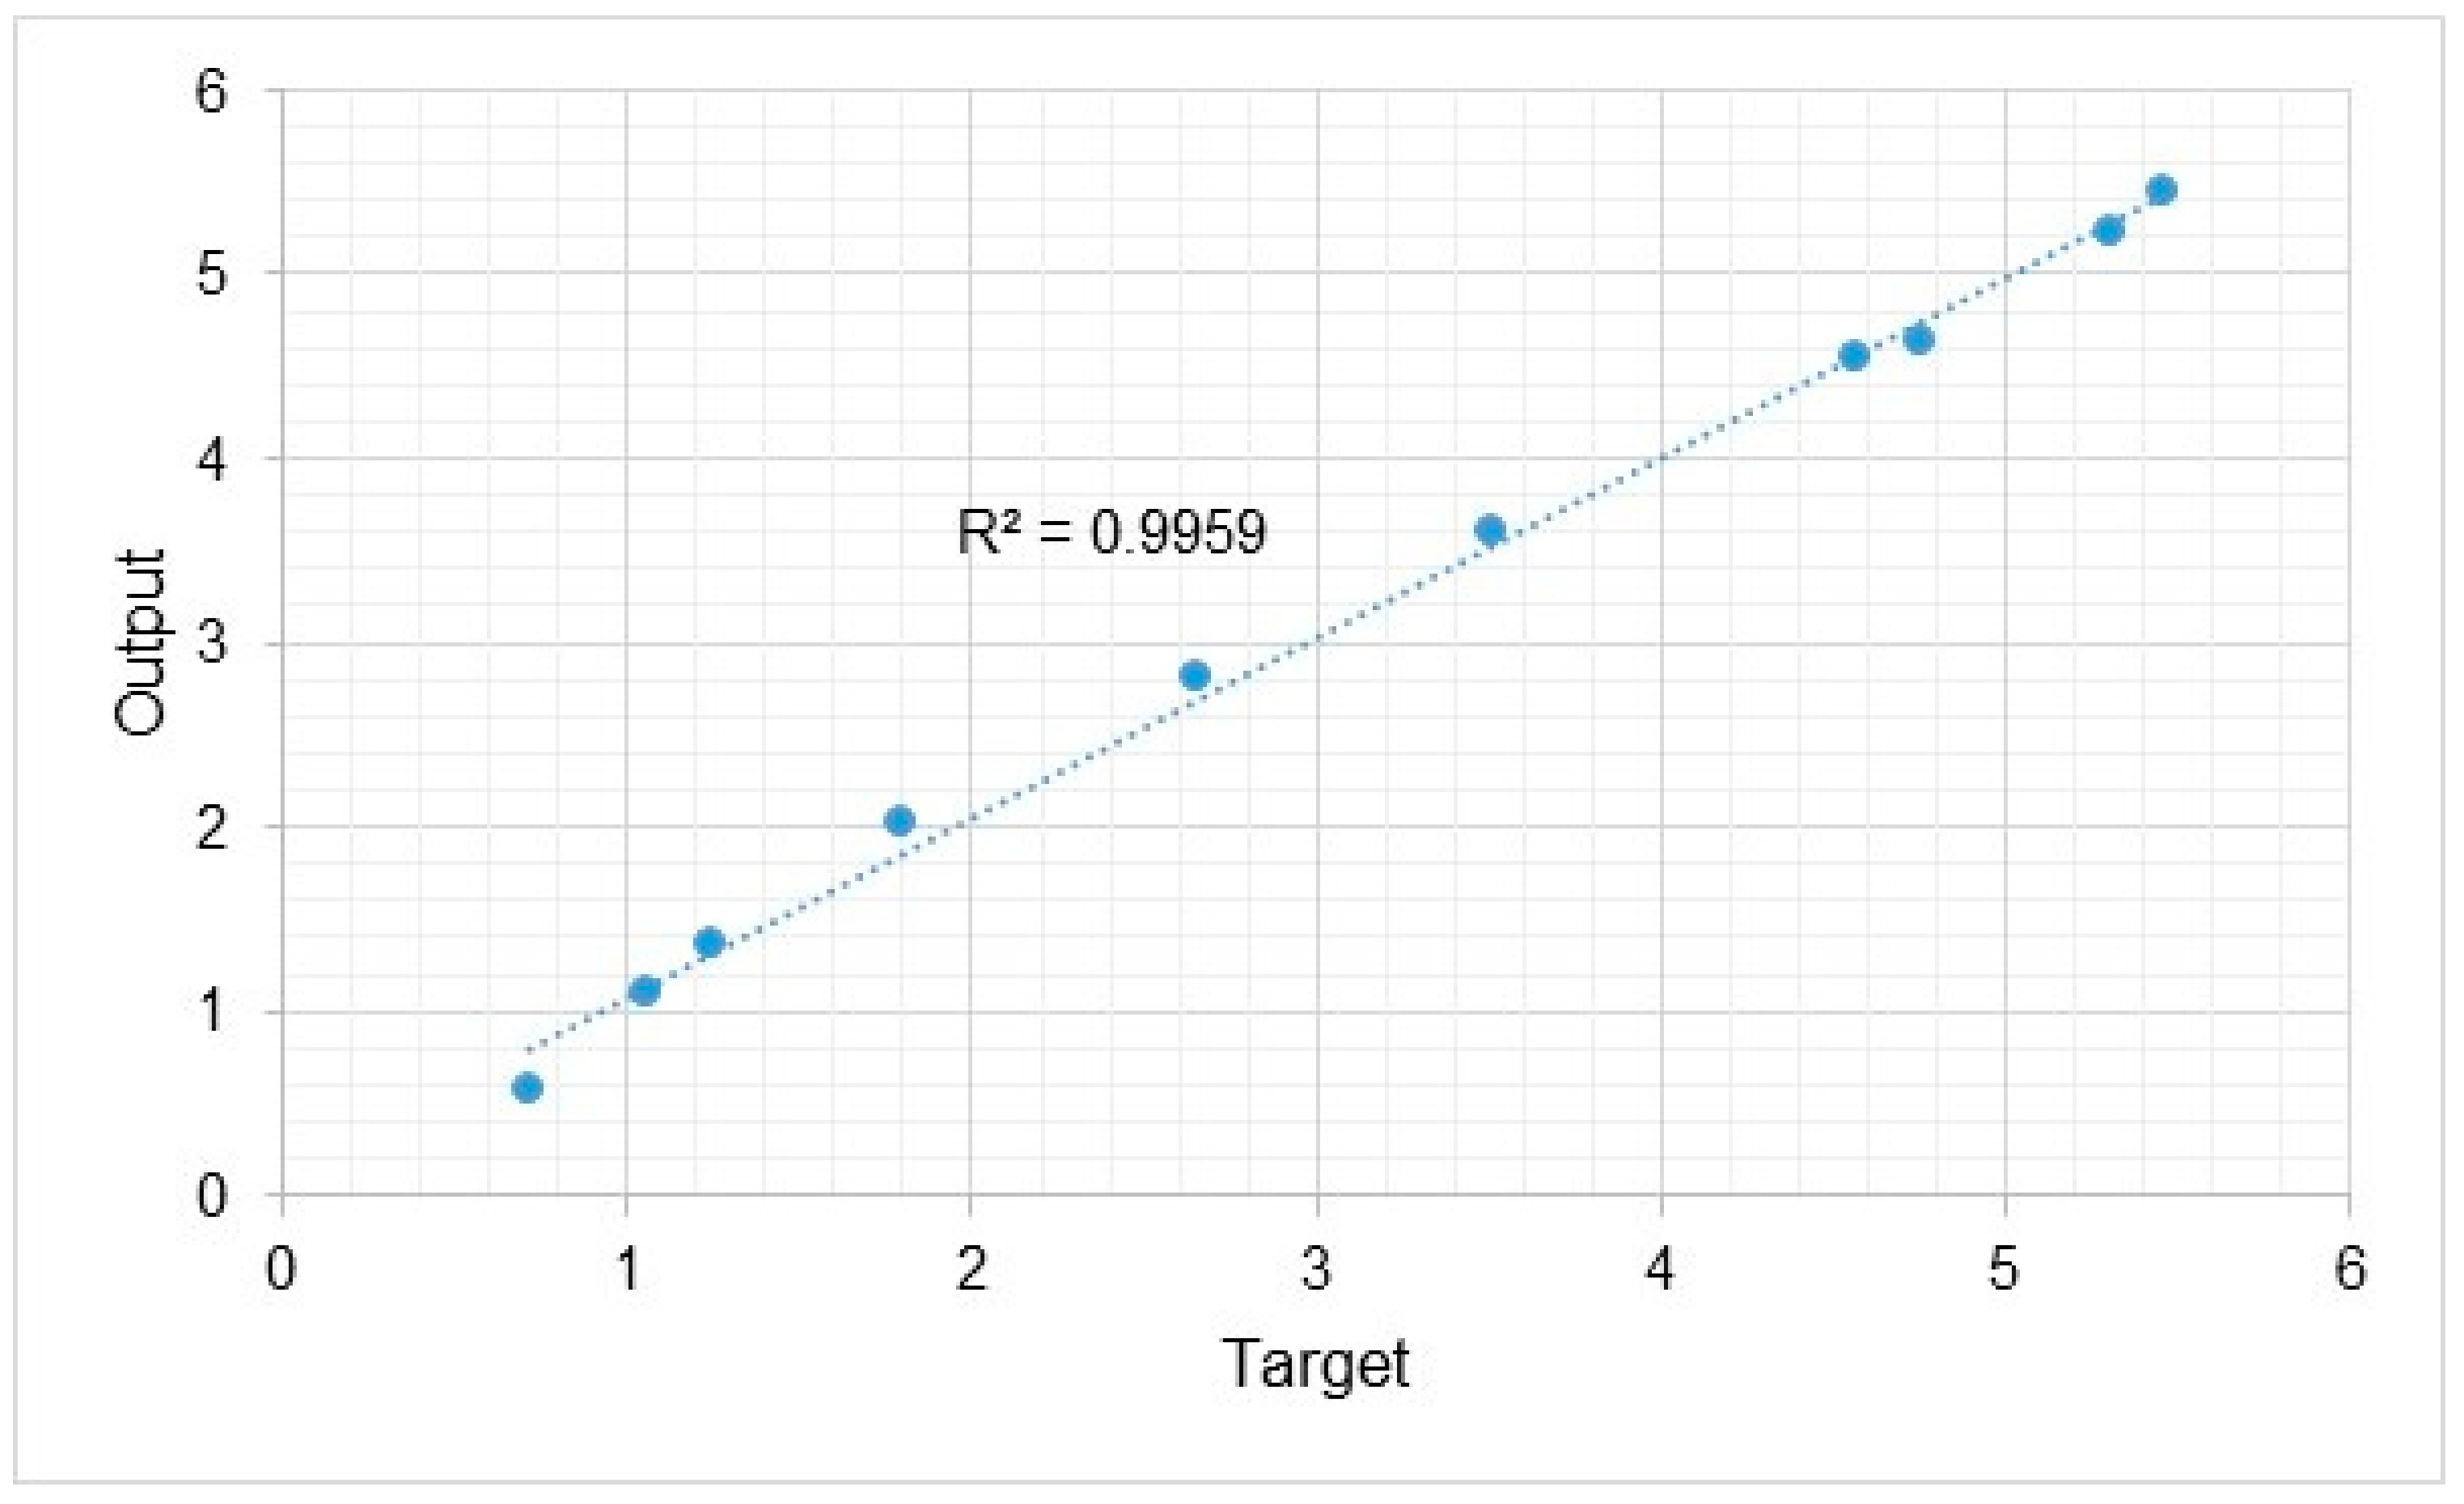
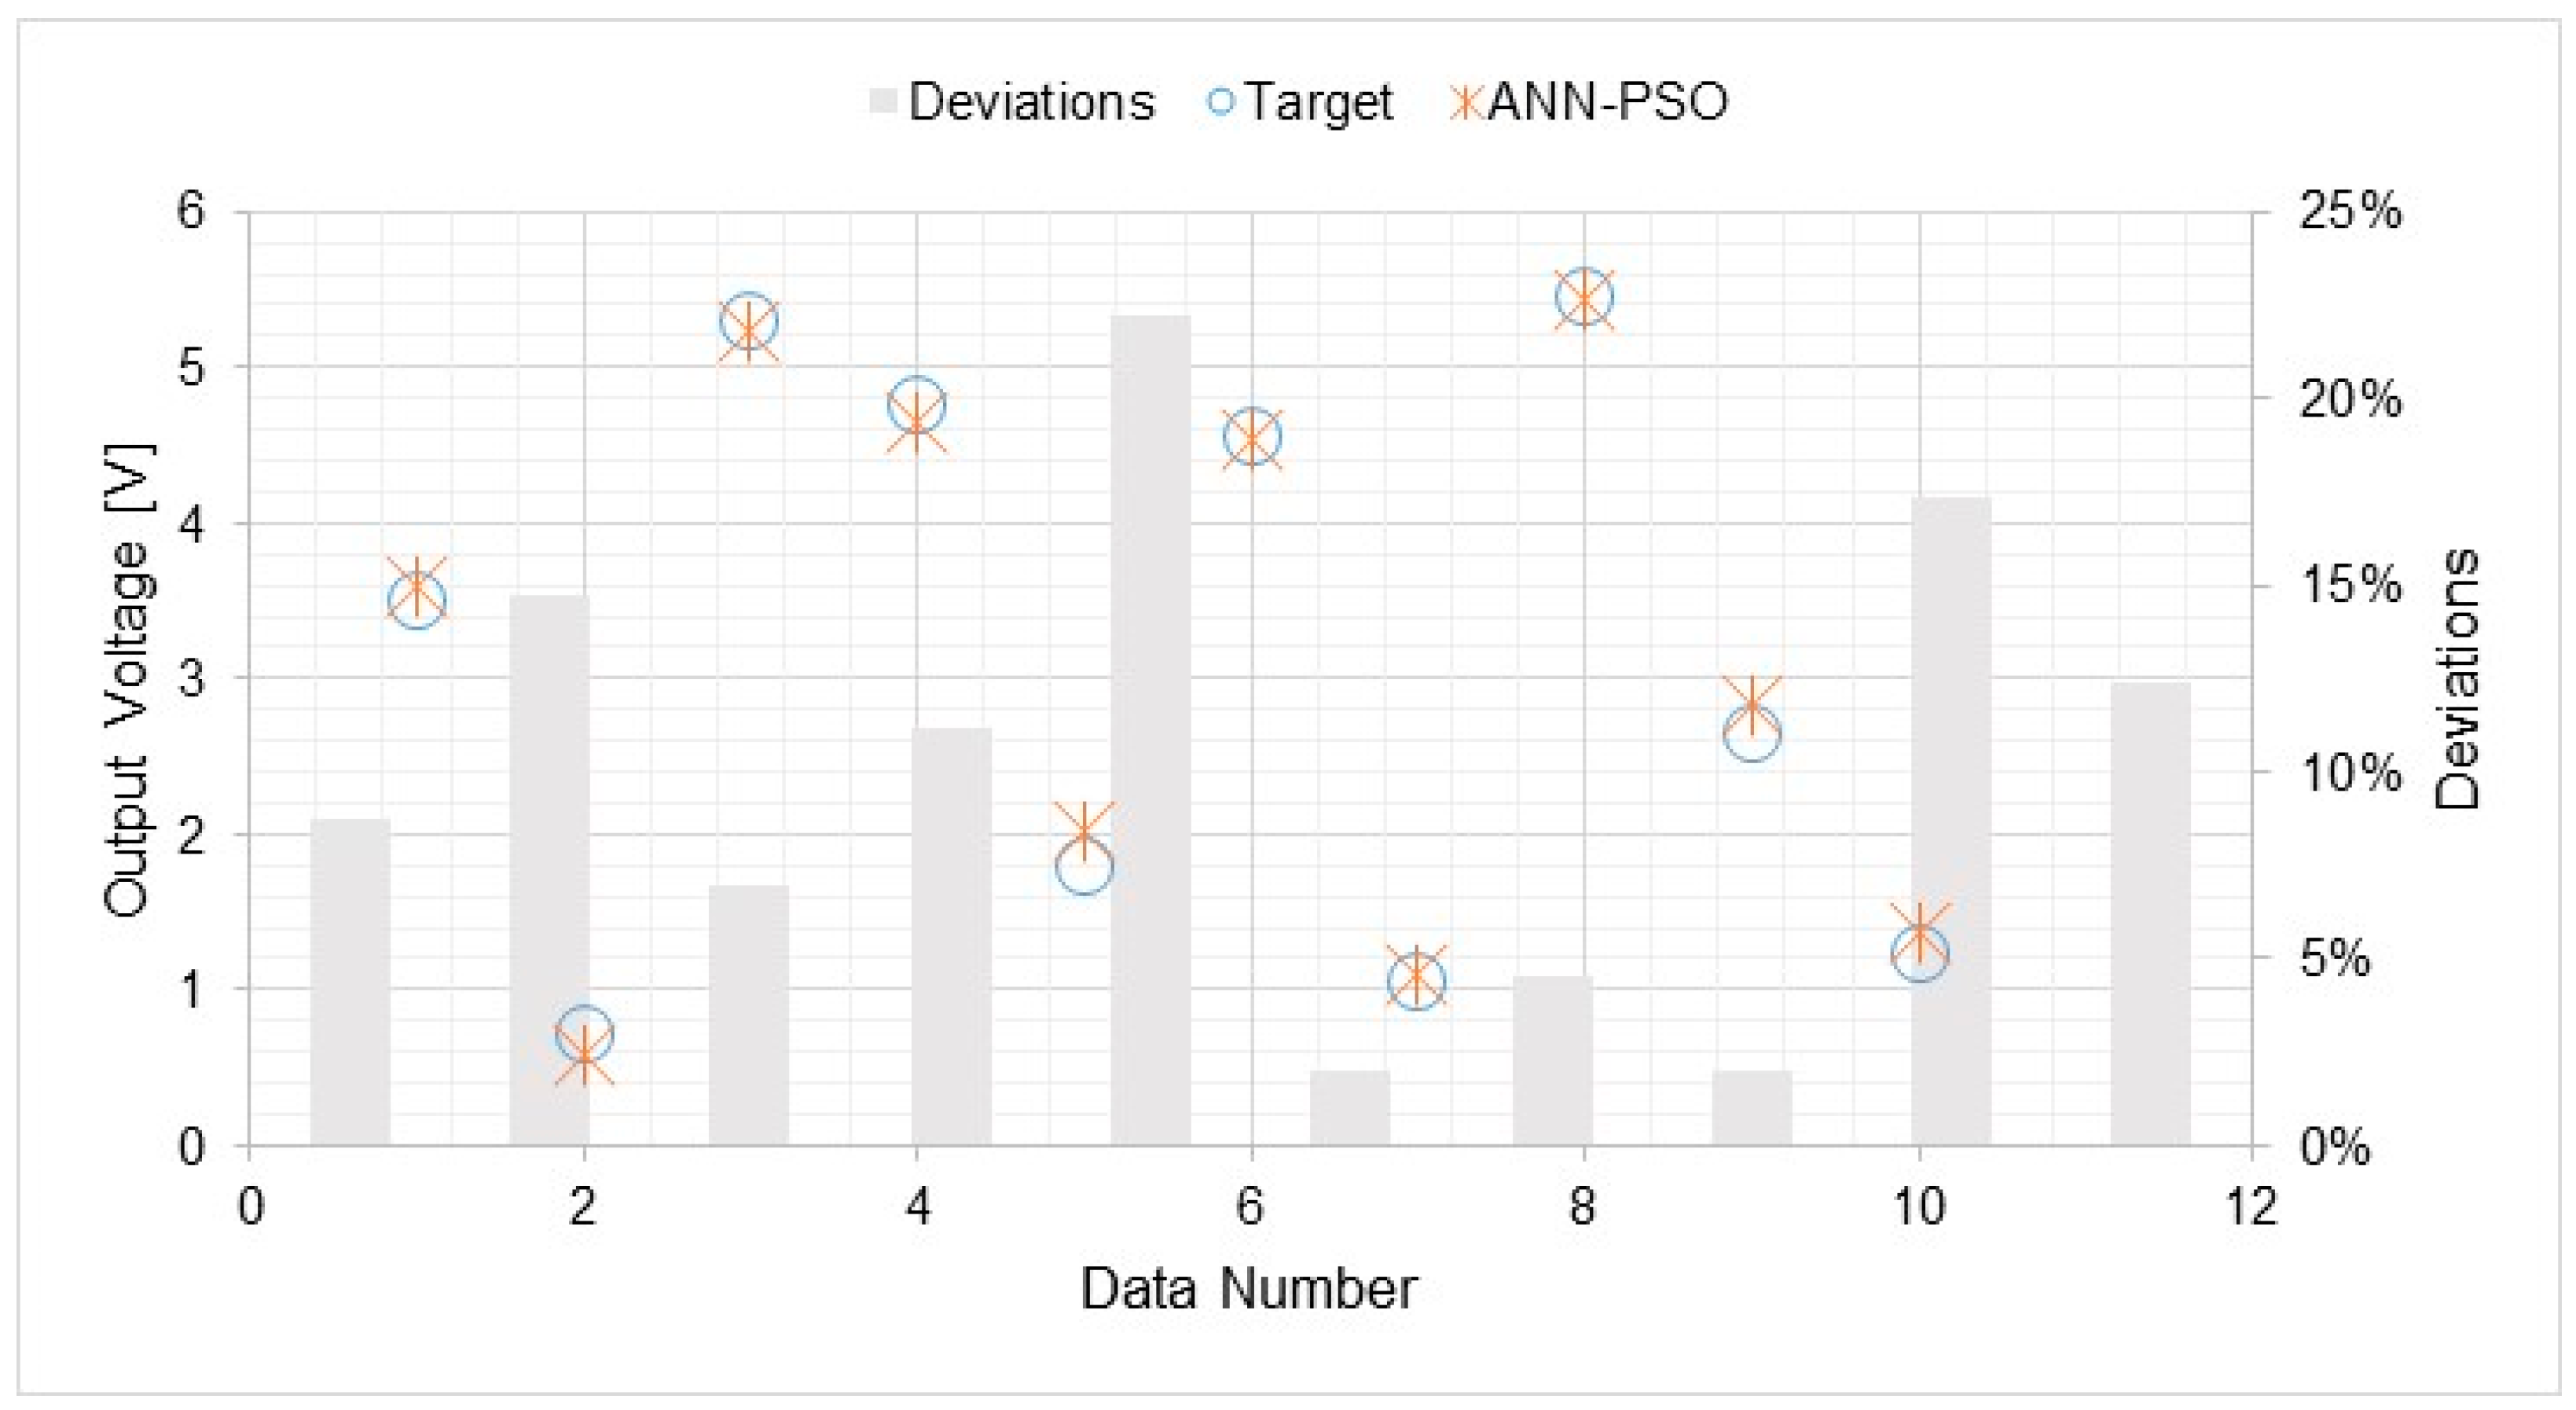
5.4. Analysis of ANN-PSO Models

Table 3 below displays the results of the ANN-PSO hybrid model for each configuration in terms of training and testing. The superior training and testing values are indicated in bold for clarity.
Based on the findings outlined in Table 3, it is evident that the best training outcomes, considering output voltage, were achieved for both single-stage and multiple-stage engines when employing a swarm population size of 200 utilizing 10 neurons and setting acceleration factors ( C 1 and C 2 ) to 1 and 2.75, respectively. The corresponding mean square error (MSE) and training regression values were calculated at 0.0082 and 0.99764, as illustrated in Figure 16. For the best testing results, a swarm population size of 400, 8 neurons, and acceleration factors of 1 and 2.25 ( C 1 and C 1 ) proved optimal. The resulting testing R2 value stood at an impressive 0.9959 , as depicted in Figure 17. The comparison between experimental data and predictions generated by the ANN-PSO model was meticulously undertaken and visually represented in Figure 18. It is noteworthy that the observed output voltage closely aligns with the predictions derived from the ANN-PSO model, substantiated by a testing regression (R2) of 0.9971 and a maximum discrepancy of only 21.66%, as demonstrated in Figure 18.

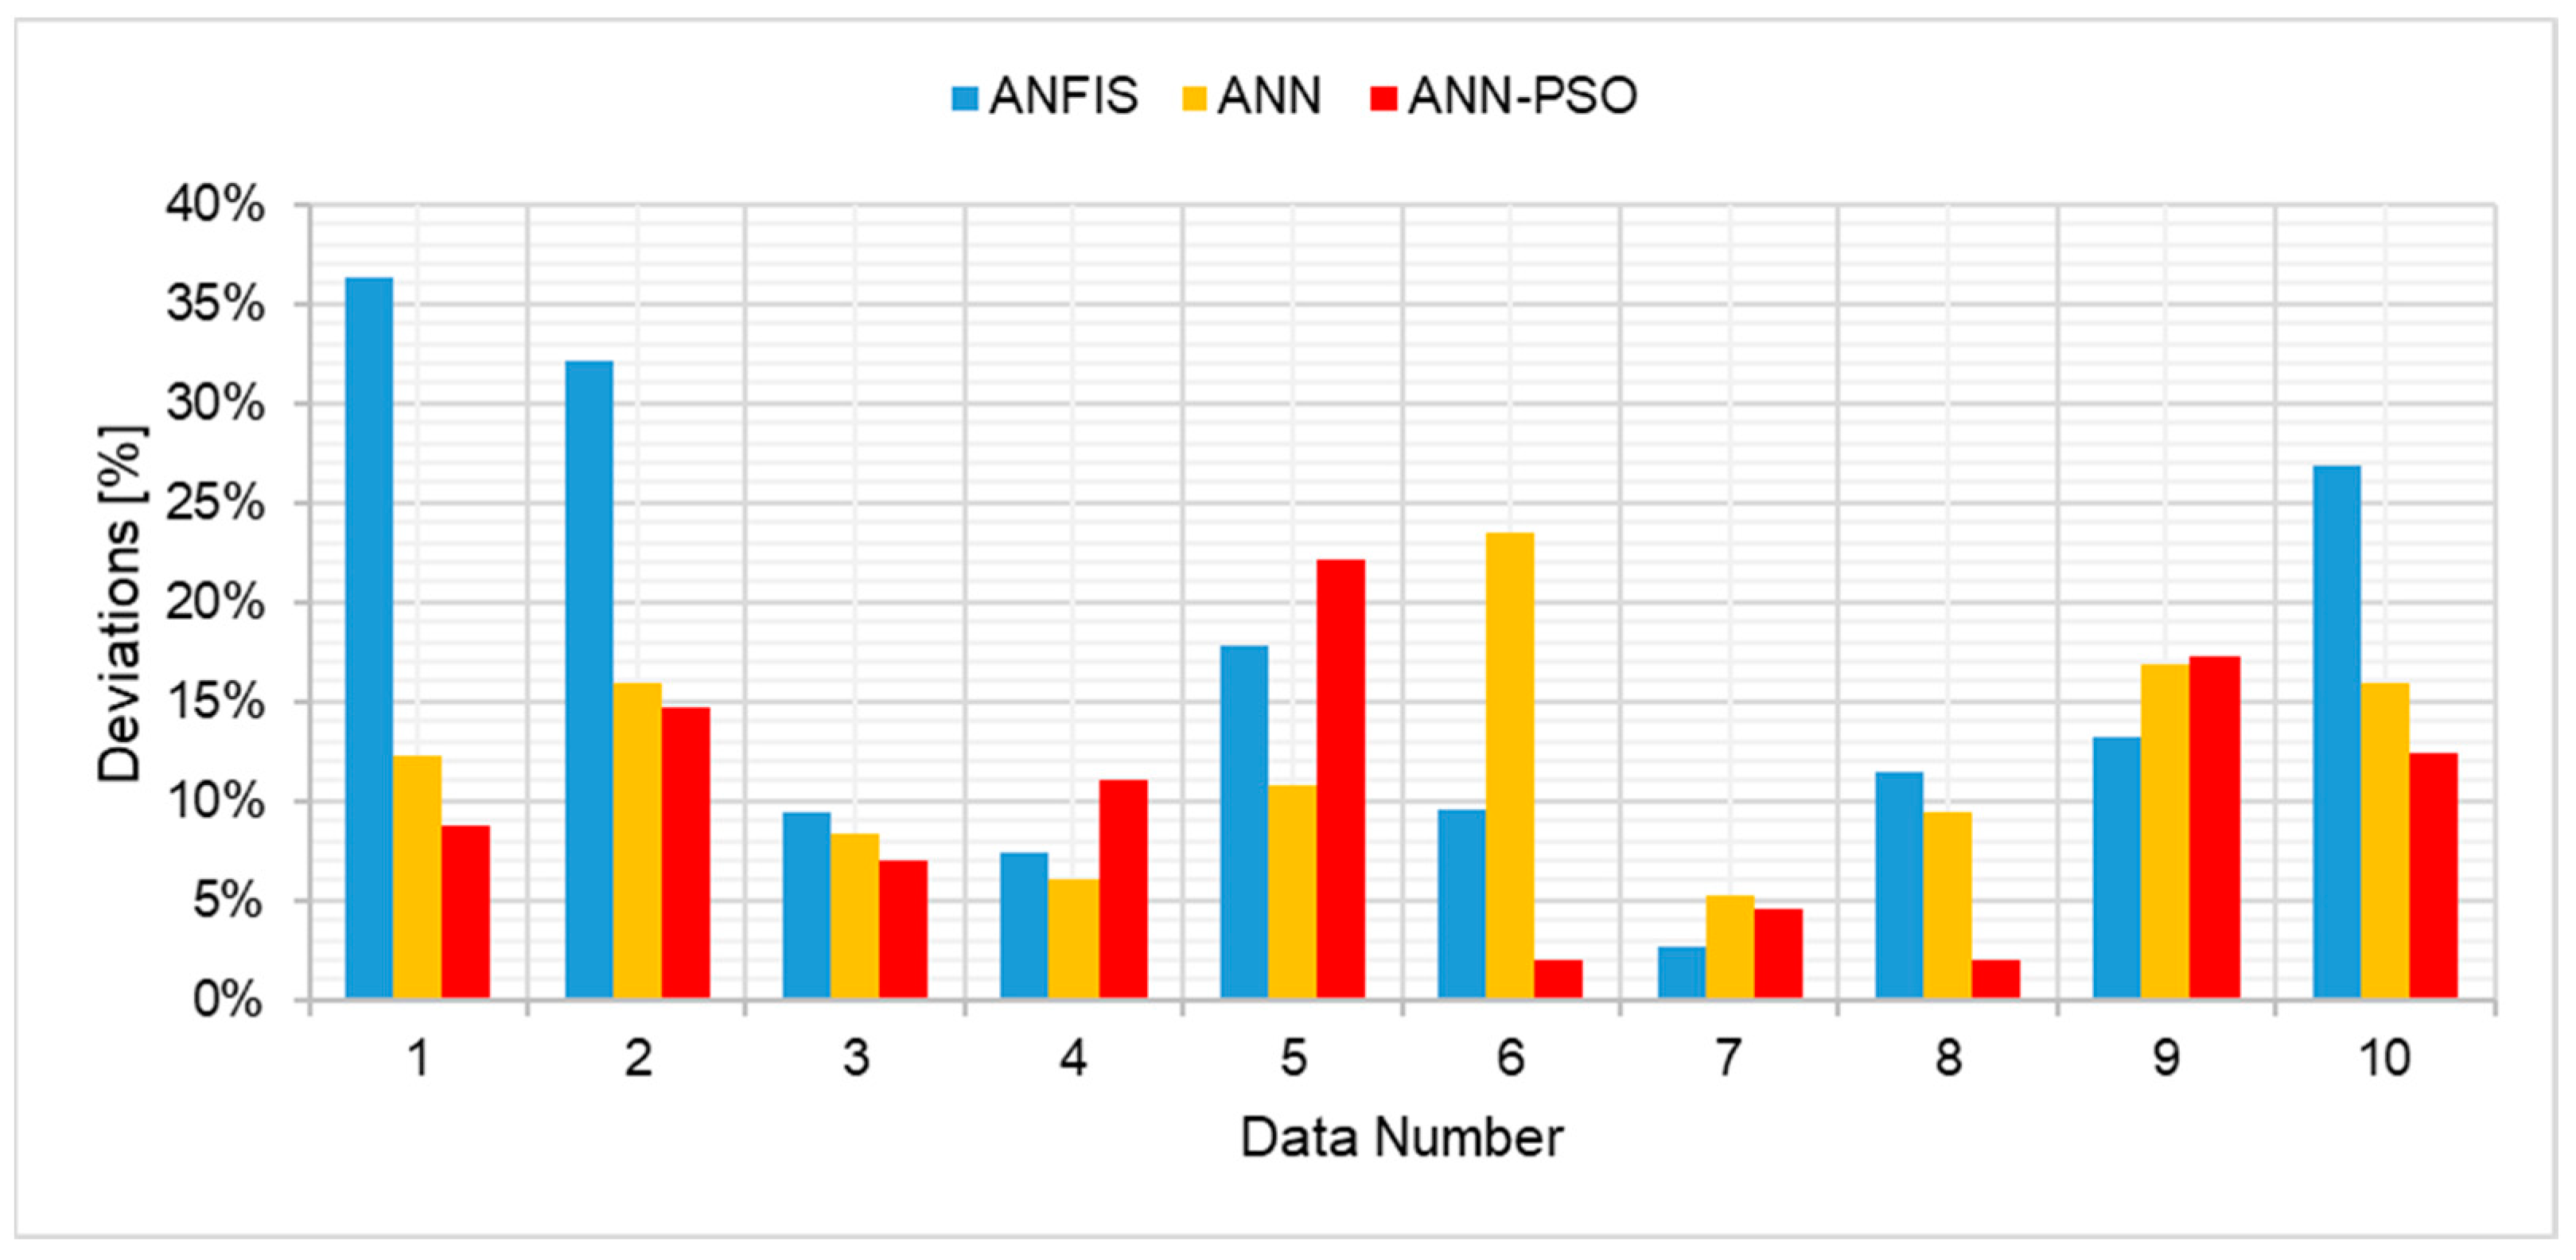
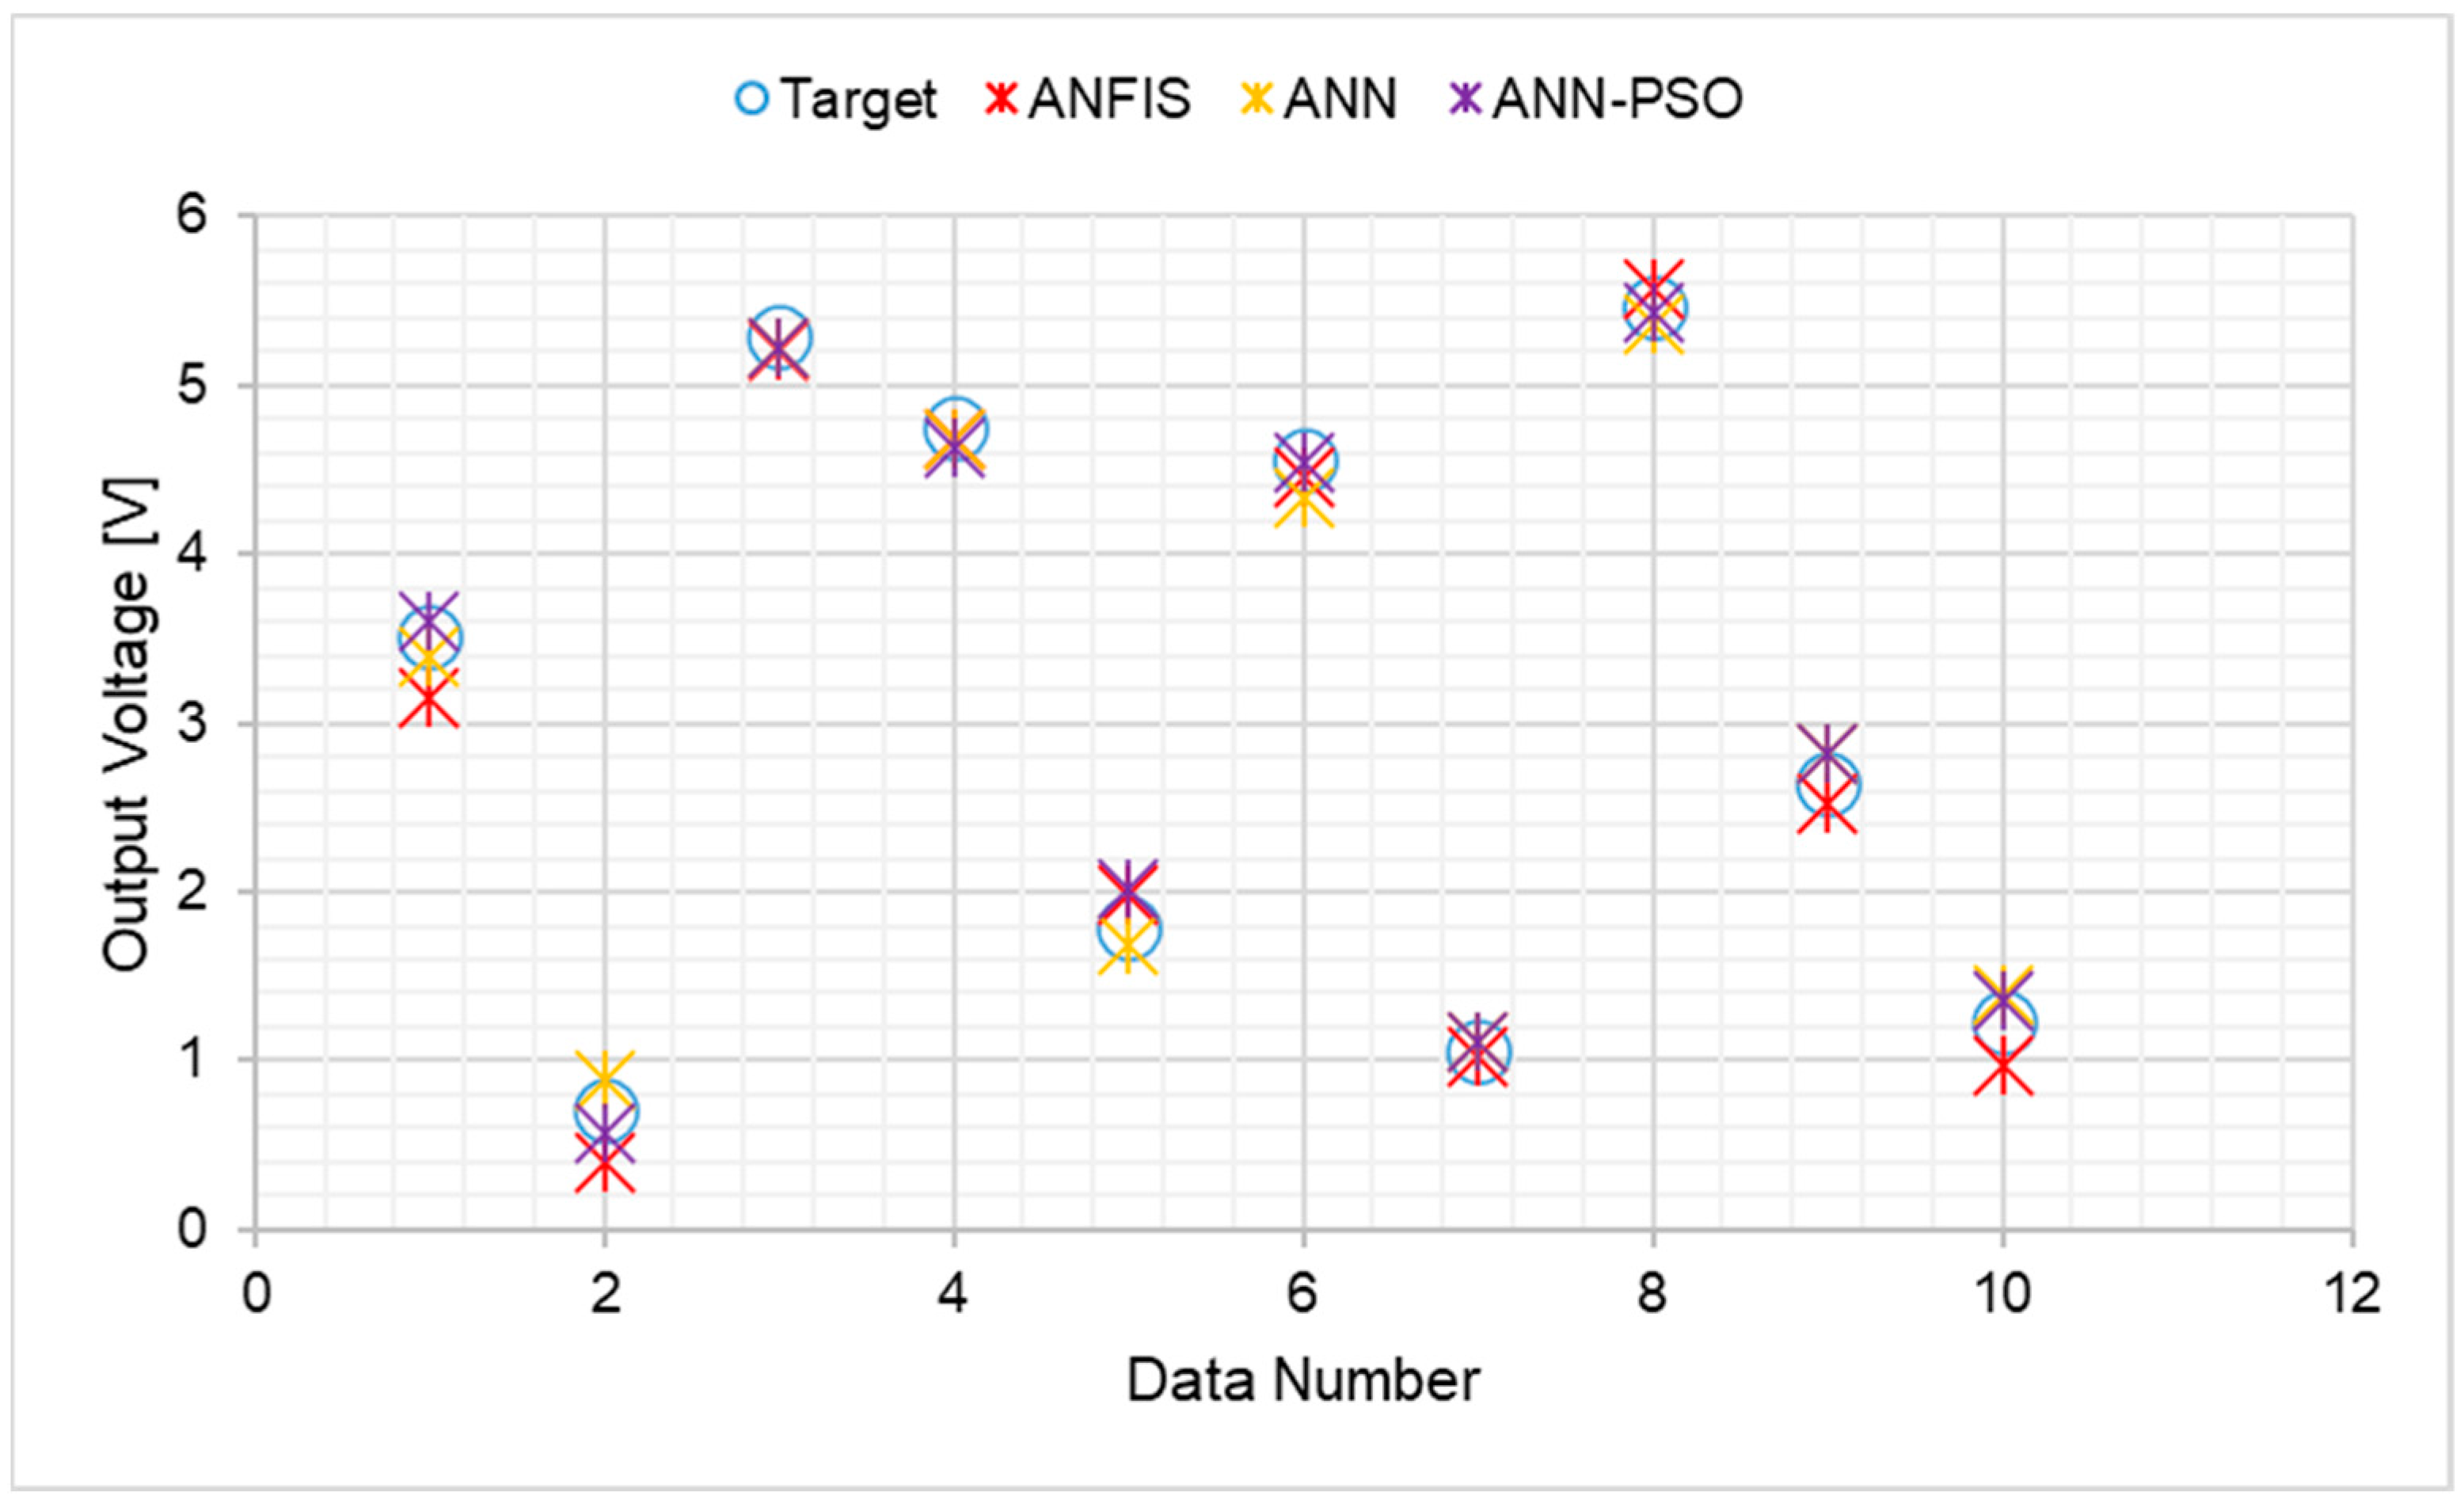
5.5. Comparison of Results for ANN-PSO, ANFIS, and ANN

The performance of three models, namely ANN-PSO, ANN, and ANFIS, was assessed based on their mean squared error (MSE) and regression values ( R 2 ), as summarized in Table 4. The results presented therein reveal that the ANN-PSO model exhibited the highest regression test value ( R 2 ) of 0.9959, followed closely by the ANN model with a regression test value of 0.99496. The ANFIS model, while still commendable, demonstrated a slightly lower regression test value of 0.9921. Upon analyzing Figure 19 and Figure 20, it is evident that the predicted values generated by all three models (ANN-PSO, ANN, and ANFIS) closely align with the experimental data (target). This congruence is further corroborated by the deviation graph depicted in Figure 20. Notably, the ANFIS model exhibited the highest deviation at 36.38%, followed by the ANN model with a deviation of 23.45%. The ANN-PSO model, on the other hand, demonstrated the lowest deviation at 22.20%.

6. Conclusions

This study introduces a novel approach employing machine learning techniques to predict the output voltage of both single-stage and multi-stage thermo-acoustic systems. Specifically, three models were investigated: an Artificial Neural Network trained using Particle Swarm Optimization (ANN-PSO), Adaptive Neuro-Fuzzy Inference System (ANFIS), and a conventional Artificial Neural Network. To validate these models, a traveling-wave thermo-acoustic system was meticulously constructed and subjected to comprehensive experimental analysis. The dataset comprised fifty-two data points encompassing variations in temperature differentials across each engine stage and the number of engine stages. The output voltage served as a pivotal metric for evaluating the thermo-acoustic generator performance. Upon scrutiny of performance metrics, it was discerned that the ANN-PSO model demonstrated the highest predictive accuracy, with an impressive coefficient of determination ( R 2 = 0.9959 ). The application of these machine learning techniques underscores their potential to significantly reduce the number of required experimental configurations. Consequently, this enables researchers to estimate the performance attributes of other configurations with a heightened degree of precision, as the findings of this study suggest that machine learning approaches offer an efficient alternative to the conventional experimentation process by circumventing the need for protracted trials. To enhance the robustness of these machine learning models, scaling up the prototype would be recommendable due to the generation of more extensive datasets amenable for the development of resilient models. This research stands to contribute to the thermo-acoustic research community by proposing a more streamlined and effective modeling approach.

Author Contributions

Conceptualization, M.N. and L.K.T.; methodology, M.N. and L.K.T.; software, M.N.; validation, M.N., L.K.T. and F.B.; formal analysis, M.N.; investigation, M.N.; resources, M.N.; data curation, M.N., L.K.T. and F.B.; writing—original draft preparation, M.N.; writing—review and editing, M.N., L.K.T. and F.B.; visualization, M.N.; supervision, L.K.T. and F.B.; project administration, L.K.T.; funding acquisition, L.K.T. All authors have read and agreed to the published version of the manuscript.

Funding

This research was funded by the University of Johannesburg grant number [URC2022] and the APC was funded by [The University of Johannesburg].

Institutional Review Board Statement

Not applicable.

Informed Consent Statement

Not applicable.

Data Availability Statement

The data for this study are available upon request from the corresponding authors, for the purposes of replication, validation, and further research inquiries. This availability adheres to pertinent ethical and legal considerations. To obtain access to the dataset, please reach out to one of the authors.

Conflicts of Interest

The authors declare no conflict of interest.

References

  1. Belu, R. Artificial intelligence techniques for solar energy and photovoltaic applications. In Handbook of Research on Solar Energy Systems and Technologies; IGI Global: Hershey, PA, USA, 2014; pp. 1661–1720. [Google Scholar] [CrossRef]
  2. Fausett, L.V. Fundamentals of Neural Networks. Architectures, Algorithms, and Application, 1st ed.; Pearson: London, UK, 1993; pp. 9–20. ISBN -10: 0133341860. [Google Scholar]
  3. Rahman, A.A.; Zhang, X. Prediction of acoustic-wave parameters of thermo-acoustic prime mover through Artificial Neural Network technique: Practical approach for thermo-acoustics. J. Therm. Sci. Eng. Prog. 2018, 8, 257–268. [Google Scholar] [CrossRef]
  4. Fadlallah, S.O.; Anderson, T.N.; Nates, R.J. Artificial neural network–particle swarm optimization (ANN-PSO) approach for behaviour prediction and structural optimization of lightweight sandwich composite heliostats. Arab. J. Sci. Eng. 2021, 46, 12721–12742. [Google Scholar] [CrossRef]
  5. Tarno, A.; Rusgiyono, A. Sugito Adaptive Neuro Fuzzy Inference System (ANFIS) approach for modeling paddy production data in Central Java. J. Phys. Conf. Ser. 2019, 1217, 012083. [Google Scholar] [CrossRef]
  6. Zare, S.; Tavakolpour-Saleh, A.; Aghahosseini, A.; Sangdani, M.; Mirshekari, R. Design and Optimization of Stirling Engines Using Soft Computing Methods: A review. Appl. Energy 2021, 283, 116258. [Google Scholar] [CrossRef]
  7. Tijani, M.E.H.; Zeegers, J.C.H.; De Waele, A.T.A.M. The optimal stack spacing for thermoacoustic refrigeration. J. Acoust. Soc. Am. 2002, 112, 128–133. [Google Scholar] [CrossRef]
  8. Kisha, W.; Riley, P.; McKechnie, J.; Hann, D. Asymmetrically heated multi-stage travelling-wave thermoacoustic electricity generator. Energy 2021, 235, 121312. [Google Scholar] [CrossRef]
  9. Bi, T.; Wu, Z.; Zhang, L.; Yu, G.; Luo, E.; Dai, W. Development of a 5 kW traveling-wave thermoacoustic electric generator. Appl. Energy 2016, 185, 1355–1361. [Google Scholar] [CrossRef]
  10. Wu, Z.; Zhang, L.; Dai, W.; Luo, E. Investigation on a 1 kW traveling-wave thermoacoustic electrical generator. Appl. Energy 2014, 124, 140–147. [Google Scholar] [CrossRef]
  11. Wu, Z.; Dai, W.; Man, M.; Luo, E. A solar-powered traveling-wave thermoacoustic electricity generator. Sol. Energy 2012, 86, 2376–2382. [Google Scholar] [CrossRef]
  12. Alrwashdeh, S.S.; Ammari, H.; Madanat, M.A.; Al-Falahat, A.M. The Effect of Heat Exchanger Design on Heat transfer Rate and Temperature Distribution. Emerg. Sci. J. 2022, 6, 128–137. [Google Scholar] [CrossRef]
  13. Hamood, A.; Jaworski, A.J.; Blunt, L.; Townsend, A. The application of additive manufacturing to heat exchangers for oscillatory flow: A case study. Proc. Inst. Mech. Eng. Part B J. Eng. Manuf. 2023. [Google Scholar] [CrossRef]
  14. Rosle, N.D.A.; Saat, F.A.Z.M.; Othman, R.N.F.K.R.; Abd Rahim, I.; Saechan, P. Investigation on Standing Wave Thermoacoustic Generator Using DeltaEC. J. Adv. Res. Fluid Mech. Therm. Sci. 2022, 96, 51–64. [Google Scholar]
  15. McGaughy, M.; Wang, C.; Boessneck, E.; Salem, T.; Wagner, J. A Traveling wave thermoacoustic engine—Design and test. ASME Lett. Dyn. Syst. Control 2021, 1, 031006. [Google Scholar] [CrossRef]
  16. Xiao, L.; Luo, K.; Zhao, D.; Chen, G.; Bi, T.; Xu, J.; Luo, E. Time-domain acoustic-electrical analogy investigation on a high-power traveling-wave thermoacoustic electric generator. Energy 2023, 263, 126088. [Google Scholar] [CrossRef]
  17. Machesa, M.; Tartibu, L.; Okwu, M. Prediction of the oscillatory heat transfer coefficient in thermoacoustic refrigerators. Sustainability 2021, 13, 9509. [Google Scholar] [CrossRef]
  18. Toghyani, S.; Ahmadi, M.H.; Kasaeian, A.; Mohammadi, A.H. Artificial neural network, ANN-PSO and ANN-ICA for modelling the Stirling engine. Int. J. Ambient Energy 2016, 37, 456–468. [Google Scholar] [CrossRef]
  19. Duan, C.; Wang, X.; Shu, S.; Jing, C.; Chang, H. Thermodynamic Design of Stirling Engine Using Multi-Objective Particle Swarm Optimization Algorithm. Energy Convers. Manag. 2014, 84, 88–96. [Google Scholar] [CrossRef]
  20. Rahman, A.A.; Zhang, X. Prediction of temperature difference across thermoacoustic stack through artificial neural network technique. Future 2021, 3, 2314–7237. [Google Scholar]
  21. Wildemans, R.; Kornilov, V.; de Goey, P.; Arteaga, I.L. Nonlinear dynamics of pure intrinsic thermo-acoustic modes. Combust. Flame 2023, 251, 112703. [Google Scholar] [CrossRef]
  22. Alamir, M.A. An artificial neural network model for predicting the performance of thermoacoustic refrigerators. Int. J. Heat Mass Transf. 2021, 164, 120551. [Google Scholar] [CrossRef]
  23. Machesa, M.G.K.; Tartibu, L.K.; Okwu, M.O. Performance analysis of stirling engine using computational intelligence techniques (ANN Fuzzy Mamdani Model) and hybrid algorithms (ANN-PSO ANFIS). Neural Comput. Appl. 2023, 35, 1225–1245. [Google Scholar] [CrossRef]
  24. Tijani, M.E.H.; Zeegers, J.C.H.; De Waele, A.T.A.M. Design of thermoacoustic refrigerators. Cryogenics 2002, 42, 49–57. [Google Scholar] [CrossRef]
  25. RS Component Thermocouples and Sensors. RS PRO Type K Thermocouple 150 mm Length, 6 mm Diameter. Available online: https://docs.rsonline.com/bd9d/A700000007350778.pdf (accessed on 6 May 2023).
Figure 1. Thermo-acoustic conversion processes.
Ai 05 00013 g001
Figure 2. Thermo-acoustic core.
Ai 05 00013 g002
Figure 3. Traveling-wave thermo-acoustic electricity generator.
Ai 05 00013 g003
Figure 4. Experimental setup for temperature measurements.
Ai 05 00013 g004
Figure 5. ANN Structure (Predicting Output Voltage).
Ai 05 00013 g005
Figure 6. Flowchart for ANN Model.
Ai 05 00013 g006
Figure 7. Flowchart for ANFIS Model.
Ai 05 00013 g007
Figure 8. Flowchart for hybrid ANN-PSO model.
Ai 05 00013 g008
Figure 9. Temperature difference for four-stage configuration.
Ai 05 00013 g009
Figure 10. Average prediction error of output voltage [%] vs. number of hidden neurons.
Ai 05 00013 g010
Figure 11. Regression plot for validation, testing, and training phases (output voltage).
Ai 05 00013 g011
Figure 12. ANN prediction vs. output parameters/output voltage.
Ai 05 00013 g012
Figure 13. ANFIS prediction vs. output parameters (output voltage).
Ai 05 00013 g013
Figure 14. ANFIS regression plot (output voltage test values).
Ai 05 00013 g014
Figure 15. ANFIS 3D surface plot for output input correlation.
Ai 05 00013 g015
Figure 16. Training response of the best performance network for output voltage.
Ai 05 00013 g016
Figure 17. Testing response of the best performance network for output voltage.
Ai 05 00013 g017
Figure 18. ANN-PSO prediction vs. output parameters/output voltage.
Ai 05 00013 g018
Figure 19. Results Comparison for Output Voltage.
Ai 05 00013 g019
Figure 20. Deviations between target and output from ANN-PSO, ANFIS, AND ANN/output voltage.
Ai 05 00013 g020
Table 1. Advantages and disadvantages of ANN, ANFIS, and hybrid ANN-PSO approach.
ML TechniqueAdvantagesDisadvantages
ANNANNs can model complex, nonlinear relationships in data, making them suitable for tasks in which traditional linear models might fail.Training large ANNs can be computationally expensive and time-consuming, especially for deep architectures with many layers and parameters.
ANFISANFIS excels in capturing intricate, nonlinear relationships between input and output variables, making it ideal for systems with complex patterns. Its adaptability to changing environments is notable, as it dynamically adjusts parameters during the learning phase to enhance performance.ANFIS performance hinges on the quality and quantity of training data. Inadequate or biased data can yield inaccurate models. Training ANFIS is computationally demanding, particularly with large datasets or intricate rule bases, leading to extended training times and increased resource demands.
ANN-PSOThe combination of ANN and PSO (ANN-PSO) helps us to find global optima for complex optimization problems and also enhances the ability to fine-tune the parameters of the neural network for improved performance. Finally, it allows for better adaptation of the network’s weights and biases to capture intricate patterns in the data.The utilization of the combined ANN and PSO approach poses significant computational demands, particularly when applied to extensive datasets or large-scale problems. The training of neural networks and the optimization of PSO parameters necessitate substantial computational resources. Moreover, this technique is notably sensitive to the selection of hyperparameters for both the neural network and the PSO algorithm. Achieving the optimal set of parameters proves to be a challenging task, requiring additional fine-tuning efforts.
Table 2. Experimental data for traveling-wave thermo-acoustic generator.
Stage 1 Onset Temp DiffStage 2 Onset Temp DiffStage 3 Onset Temp DiffStage 4 Onset Temp DiffNo of Engine StagesOutput Voltage
[ ° C ] ° C ° C ° C [V]
36.3700013.51
39.0900012.65
46.9200011.91
51.5600011.24
58.2400010.72
21.4718.850025.3
21.1820.170025.12
24.2724.030025.04
27.3823.360024.95
27.9326.990024.7
30.2527.250024.75
35.7834.780024.23
35.7632.970024.2
41.8838.40023.95
48.9543.340023.8
54.5654.80023.1
54.2349.30023
64.1959.410022.65
73.3560.980021.8
29.7129.0939.18035.95
31.2730.3644.48035.53
33.6435.5852.64035.39
36.438.8756.51035.05
37.9341.8158.6034.84
41.8646.2361.32034.77
45.351.7366.14034.56
47.9556.3470.47034.23
51.7761.8175.42034.05
58.2567.4181.78033.75
59.9274.687.45032.93
66.4281.2391.63032.62
75.5492.0499.36032.31
91.47107.33111.72032.05
98.28123.41118.25031.41
111.55141.72130.25031.06
26.2922.6222.6637.6146.06
27.8523.0726.2139.7245.82
30.426.2130.3945.6845.59
35.6227.5232.1145.3345.46
39.9231.1437.0350.3545.21
39.2331.1836.9851.8645.04
46.7934.1542.6853.8144.81
51.1336.747.0557.0844.54
54.5539.5350.5960.8344.35
59.542.9155.2265.1444.11
63.6649.0460.9874.4443.67
75.4958.2572.8585.9243.14
79.0666.1673.9679.9142.65
88.1264.0684.7888.8342.34
98.6171.2894.5495.8242.12
104.8180.76105.31102.9641.93
121.2388.21119.23113.841.24
Table 3. Analysis of ANN-PSO model for output voltage.
Number of NeuronsSwarm Population SizeAcceleration Factors Training   R 2 MSE Testing   R 2
    C 1 C 2
5102.2520.986750.04590.9124
5202.2520.990700.03230.8843
5501.52.250.994560.01890.9439
510012.750.995190.01670.9481
52001.520.995990.01390.9840
54001.520.995900.01420.9714
610130.995530.01550.9232
62022.250.981190.06630.9190
65012.50.995870.01430.9743
610012.50.996330.01280.8290
620012.750.996170.01330.9200
640012.250.995050.01720.9661
7101.52.50.995220.01660.9478
72012.750.995630.01520.9544
75012.50.995190.01670.9640
710012.50.993860.02130.9566
72001.52.250.993650.02200.9811
7400220.994420.01940.9497
81012.750.994990.01740.9871
82012.50.995630.01520.9391
8501.52.250.995510.01560.9630
810012.50.997410.00900.9740
820012.750.997620.00830.9844
840012.250.995220.00260.9959
91012.750.989040.03800.8716
920130.996180.01330.9667
9501.52.250.994080.02060.9697
9100220.993620.02220.9559
92001.52.250.995330.01620.9593
940012.50.997040.01030.9796
101012.750.994850.01790.9406
10201.52.50.994700.01840.9480
10501.52.50.996560.01200.9555
1010012.750.996450.01230.9459
1020012.750.997640.00820.9717
104001.52.50.994190.02020.9738
Table 4. Performance results of ANN-PSO, ANN, AND ANFIS models.
Output Voltage
R 2 (Training or Testing)MSE (Training or Testing)
ANN-PSO0.99764/0.99590.0026/-
ANN0.99864/0.994965.89257 × 10−3/2.87704 × 10−2
ANFIS0.9981/0.99210.0574524/0.0574534
Disclaimer/Publisher’s Note: The statements, opinions and data contained in all publications are solely those of the individual author(s) and contributor(s) and not of MDPI and/or the editor(s). MDPI and/or the editor(s) disclaim responsibility for any injury to people or property resulting from any ideas, methods, instructions or products referred to in the content.

