Article

Experimental Study on the Use of Polyurethane Elastomers to Enhance Structural Performance of A36 Steel Sheets Under Near-Field Detonation

1
Divisão de Ciências Fundamentais, Departamento de Química, Instituto Tecnológico de Aeronáutica, Pça. Mal. Eduardo Gomes, 50, São José dos Campos 12228-900, SP, Brazil
2
Sid and Reva Dewberry Department of Civil, Environmental, and Infrastructure Engineering, George Mason University, 4400 University Drive, MS 6C1, Fairfax, VA 22030, USA
*
Author to whom correspondence should be addressed.
Appl. Mech. 2025, 6(2), 28; https://doi.org/10.3390/applmech6020028
Submission received: 12 March 2025 / Revised: 9 April 2025 / Accepted: 14 April 2025 / Published: 15 April 2025

Abstract

:
In recent years, a series of studies have examined the effects of blast loads on structures and proposed new materials to enhance or retrofit the resistance of conventional materials, such as steel or concrete. Polymeric materials, including foams and elastomers, play a significant role in this field due to their low density and favorable mechanical properties under dynamic loads. This study investigates the use of polyurethane elastomer to improve the mechanical properties of 2 mm A36 steel sheets. The efficiency of this material in steel structures has not yet been studied in the scientific literature through blast tests. A total of 18 near-field blast tests were conducted at standoff distances of 300 mm and 500 mm. The explosive charges consisted of 334 g of bare Composition B in a spherical shape. The steel sheets were fixed to rigid supports and exposed to the blast either bare or covered with different layers of commercial Shore A 60 or 90 polyurethane elastomer, with thicknesses varying from 2 to 6 mm. The maximum displacement of the steel sheets was measured using a high-speed camera and the results were compared. The elastomer retrofitted sheets exhibited a reduction in maximum displacement ranging from 5% to 20% when compared to the sheet without the elastomer.

1. Introduction

The investigation of blast effects of explosives on structures is essential for predicting their impacts and mitigating associated risks. Worldwide, there has been a substantial concern regarding terrorist incidents [1], unintended harm [2], as well as accidental [3] and deliberate [4] detonations. Several studies present the application of retrofitting materials to enhance the resistance of traditional structural materials, such as steel or concrete, under blast effects. Polymeric elastomers and foams are widely studied due to their material properties, such as low density, good flexibility, chemical resistance, adherence and mechanical performance under dynamic loads. These materials can be applied to new or existing installations or vehicles, enhancing their resistance to shock waves while maintaining low weight and good chemical stability [5].
Polyurethane elastomer is one of these polymeric materials. It is synthesized by reacting polyols (alcohol-based molecules) with diisocyanatos (isocyanate-based molecules), characterized by relatively low cross-linking densities, which grant it flexibility and high elasticity. In addition to these properties, its chemical resistance to weathering effects, high mechanical strength, and viscoelastic behavior make polyurethane elastomers suitable for high-performance applications as a protective layer against impact. Further information about this material and its characteristics is provided in the referenced sources [6,7,8,9].
In academia, the most commonly related works involve the application of polyurea, another elastomeric polymer, on concrete and masonry structures, focusing on the benefits related to blast resistance. The study by X. Zu et al. [10] evaluated the use of polyurea coatings on masonry walls, applying 6 mm to the front face and 2 to 8 mm to the back face; based on four field tests, the authors reported a reduction in both damage area and depth, although the limited sample size constrains broader generalizations. In the work of W. Huang et al. [11], two blast tests were carried out—one on a concrete specimen coated with 10 mm of polyurea and another uncoated—revealing a substantial reduction in fragmentation, with complete prevention of back-face spalling in the protected configuration. Experimental results presented by Z. Yue et al. [12], who performed four tests on concrete arches coated with 5 mm of polyurea, revealed a shift in the failure mode from bending at the vault to shear, indicating that polyurea modified the structural response; they also concluded that 5 mm was the maximum effective thickness, as greater thicknesses did not lead to further improvements.
A numerical investigation by H. H. Fatt et al. [13] employed Abaqus and a single-degree-of-freedom (SDOF) model to assess the effect of a 2 mm polyurea layer on masonry walls, but no experimental tests or comparisons with uncoated conditions were provided. J. Davidson et al. [14] conducted three field tests on masonry walls with polyurea coatings, recording maximum deflections; however, the absence of uncoated reference walls limited the evaluation of the protective performance. Research carried out by G. Wu et al. [15] included nine experimental tests on clay masonry coated with 3 or 6 mm of polyurea applied to the front face, back face, or both; using a defined damage level classification and measuring debris dispersion, the authors demonstrated that polyurea significantly reduced structural damage and fragment projection.
A. Santos et al. [16] performed eight blast tests on concrete masonry walls coated with polyurea layers ranging from 4 to 10 mm, concluding that 6 mm represents the minimum effective thickness, while 10 mm substantially improves structural resistance. The investigation led by P. Lyu et al. [17] comprised three tests on concrete slabs—one uncoated and two coated with 10 mm of polyurea—showing that the protected specimens exhibited reduced damage area and penetration depth. Lastly, Y.-S. Chen et al. [18] tested 2 mm polyurea coatings applied to autoclaved aerated concrete (AAC), with seven configurations placing the coating on the front face, back face, or both; in addition, three separate tests were performed on strengthened AAC without polyurea. Their results indicated that polyurea provided better protection under higher explosive loads, while strengthened AAC was more effective under lower charge conditions.
Considering the use of polyurea elastomers in aluminum structures, Zhu et al. [19] reported an improvement of approximately 20% to 30% in overall deformation resistance in aluminum alloy sheets subjected to repetitive detonations. In another paper, Zhu et al. [20] reviewed the advances and challenges in the use of polyurea elastomers to enhance the blast resistance of structures, discussing the protection mechanisms; however, no new field tests were presented.
Regarding polymeric foams, Jamil et al. [21] and Bahei-El-Din and Dvorak [22] studied the blast response of sandwich panels filled with polyurethane and polyurea, and layered with aluminum sheets. The first study [21] compared, in sixteen small-scale detonation tests, the use of polyurethane foam with thicknesses ranging from 5 to 20 mm; however, it did not test the aluminum material without protection. The second work [22] numerically simulated the response of the sandwich panels but did not present experimental tests, nor did it compare the behavior of unprotected metallic sheets. Both studies demonstrated that polymer thickness positively affects energy absorption and damage reduction.
The study of Kannan and Ponnalagu [23] evaluated the blast response of single and bilayer polyurethane foams with different densities, using a blast wave simulator. Bilayer configurations showed superior energy absorption compared to single-layer foams, supporting their use in blast mitigation. Hosam et al. [24] tested reinforced rigid polyurethanes of varying densities by conducting twelve small-scale detonations and comparing the resulting damage on lead witness plates. Target deformations ranged from 0.0 to 0.4 mm, with denser materials showing improved performance. Jia et al. [25] presented a similar study using flexible polyurethane foam and polyurea plates with thicknesses ranging from 1 to 20 mm. Across twenty-four tests, attenuation of the atmospheric overpressure generated by the blast was observed, leading to the conclusion that thicker and denser materials resulted in greater reductions.
Freidenberg et al. [26] analyzed polymeric elastomers by comparing the results of numerical analyses with five tests conducted using a blast simulator, demonstrating the material’s good capability to withstand this type of loading. Somarathna et al. [27] characterized polyurethane elastomers through laboratory tests and theorized their use for retrofitting structures against blast effects. Chattopadhyay and Raju [28] analyzed the structural use of polyurethane coatings for high-performance applications, including impact, presenting a comprehensive characterization of the material properties and explaining why it is suitable for such uses. Somarathna et al. [29] reviewed a series of studies demonstrating the suitable applicability of elastomers, including polyurethane, in various types of structures for blast and ballistic protection. It is important to note that these studies did not test the materials directly applied to structures; they only examined the mechanical and chemical properties of the elastomers and their application, demonstrating their suitability for use as protective coatings in impact events such as blasts.
The use of polyurethane elastomers was tested on walls by Knox et al. [30] and Davidson et al. [31], showing a reduction in damage to the masonry under blast. The first study conducted three detonation tests using different wall and polymer thicknesses, showing that thicker protection led to reduced damage and internal casualties. The second study tested twelve walls with varying parameters and showed that applying a polymer coating directly to the surface can effectively reduce the vulnerability of unreinforced, non-structural concrete masonry walls when exposed to blast loads.
The study most comparable to the current work was published by Mohotti et al. [32], with the main differences lying in the type of elastomer used, the greater elastomer thickness, the lower number of tests, and the comparison being based on residual displacement rather than maximum displacement. Mohotti et al. conducted a total of ten blast tests, comparing the residual displacement of different 10 mm thick steel plates, either uncoated or coated with 6 mm or 12 mm of polyurea. The tests showed a reduction of 4% to 15% in residual displacement with 6 mm protection, and 21% to 28% with 12 mm protection.
All the presented studies, although employing different materials and methods, demonstrated the effectiveness of polymeric elastomers and polyurethane as protective materials against blast loads. However, it is notable that polyurethane elastomer has never been tested with this function in steel structures. Some studies have explored other uses of this elastomer or theorized its effectiveness in protecting structures against blast loads, but none of them have proven it through field tests.
As observed in the references, the most commonly tested material was the elastomer polyurea. This elastomer shares some similarities with polyurethane, such as elasticity, flexibility, chemical stability, and impact resistance. However, there are notable differences between them [33]:
  • Polyurethane elastomer is a cheaper and more readily available material compared to polyurea;
  • Polyurethane can take hours to cure, whereas polyurea cures almost instantly, making each suitable for different scenarios. For example, it is easier to produce sandwich elements with polyurethane;
  • Polyurethane is more resistant to UV exposure, making it more appropriate for outdoor environments;
  • Polyurethane requires greater control over moisture during fabrication, making it more suitable for use with dry materials such as metals.
The lack of experimental studies using polyurethane elastomer in steel structures as a protective material against blast loads, along with its advantages in different scenarios, motivated the conduction of the current research. Considering this, the present study aims to evaluate the performance of polyurethane elastomer coatings applied to steel sheets subjected to near-field blast loading.
Steel structures are extensively used across various industries, including construction, transportation, and defense, where they are frequently subjected to dynamic loads such as blast waves from explosive detonations. Minimizing the damage caused by these high-intensity impacts is essential to maintain structural integrity and ensure safety.
To achieve its objective, this study investigates the use of polyurethane elastomer to enhance the blast resistance of 2 mm thick A36 steel sheets. The investigation focuses on evaluating the ability of polyurethane coatings to reduce deformation caused by blast waves. A comprehensive series of 18 field tests was conducted, utilizing spherical charges 334 g of bare Composition B explosive. The tests were performed at two stand-off distances—300 mm and 500 mm—allowing for an assessment of blast effects at varying proximities.
The steel sheets were securely fixed to rigid supports and subjected to blast loading in two configurations: six tests with bare (uncoated) sheets and twelve with sheets coated with commercial polyurethane elastomers of Shore A 60 and Shore A 90 hardness. The coatings were applied in layers of varying thicknesses, ranging from 2 mm to 6 mm, to evaluate the influence of coating thickness and material hardness on blast mitigation. In four of the coated tests, an additional layer of thin (0.6 mm) mild steel AISI 1008 was bonded to the polyurethane coating while the resin was still uncured, creating a sandwich-type protection. The maximum deformation of the steel sheets was measured using a bow-facing high-speed camera.

2. Materials and Methods

This section is divided into the following five subsections:
  • Coating A36 Steel Sheets with Polyurethane Elastomer;
  • Near-Field Blast Tests;
  • Blast Intensity of the Experiments Compared with Real Events;
  • Method for Measuring Peak Displacement;
  • Uncertainties in Displacement Measurement.

2.1. Coating A36 Steel Sheets with Polyurethane Elastomer

A total of eighteen A36 steel sheets were prepared for the tests. They were provided by Companhia Siderúrgica Nacional, a Brazilian steel manufacturer [34], and acquired in the city of São José dos Campos, SP.
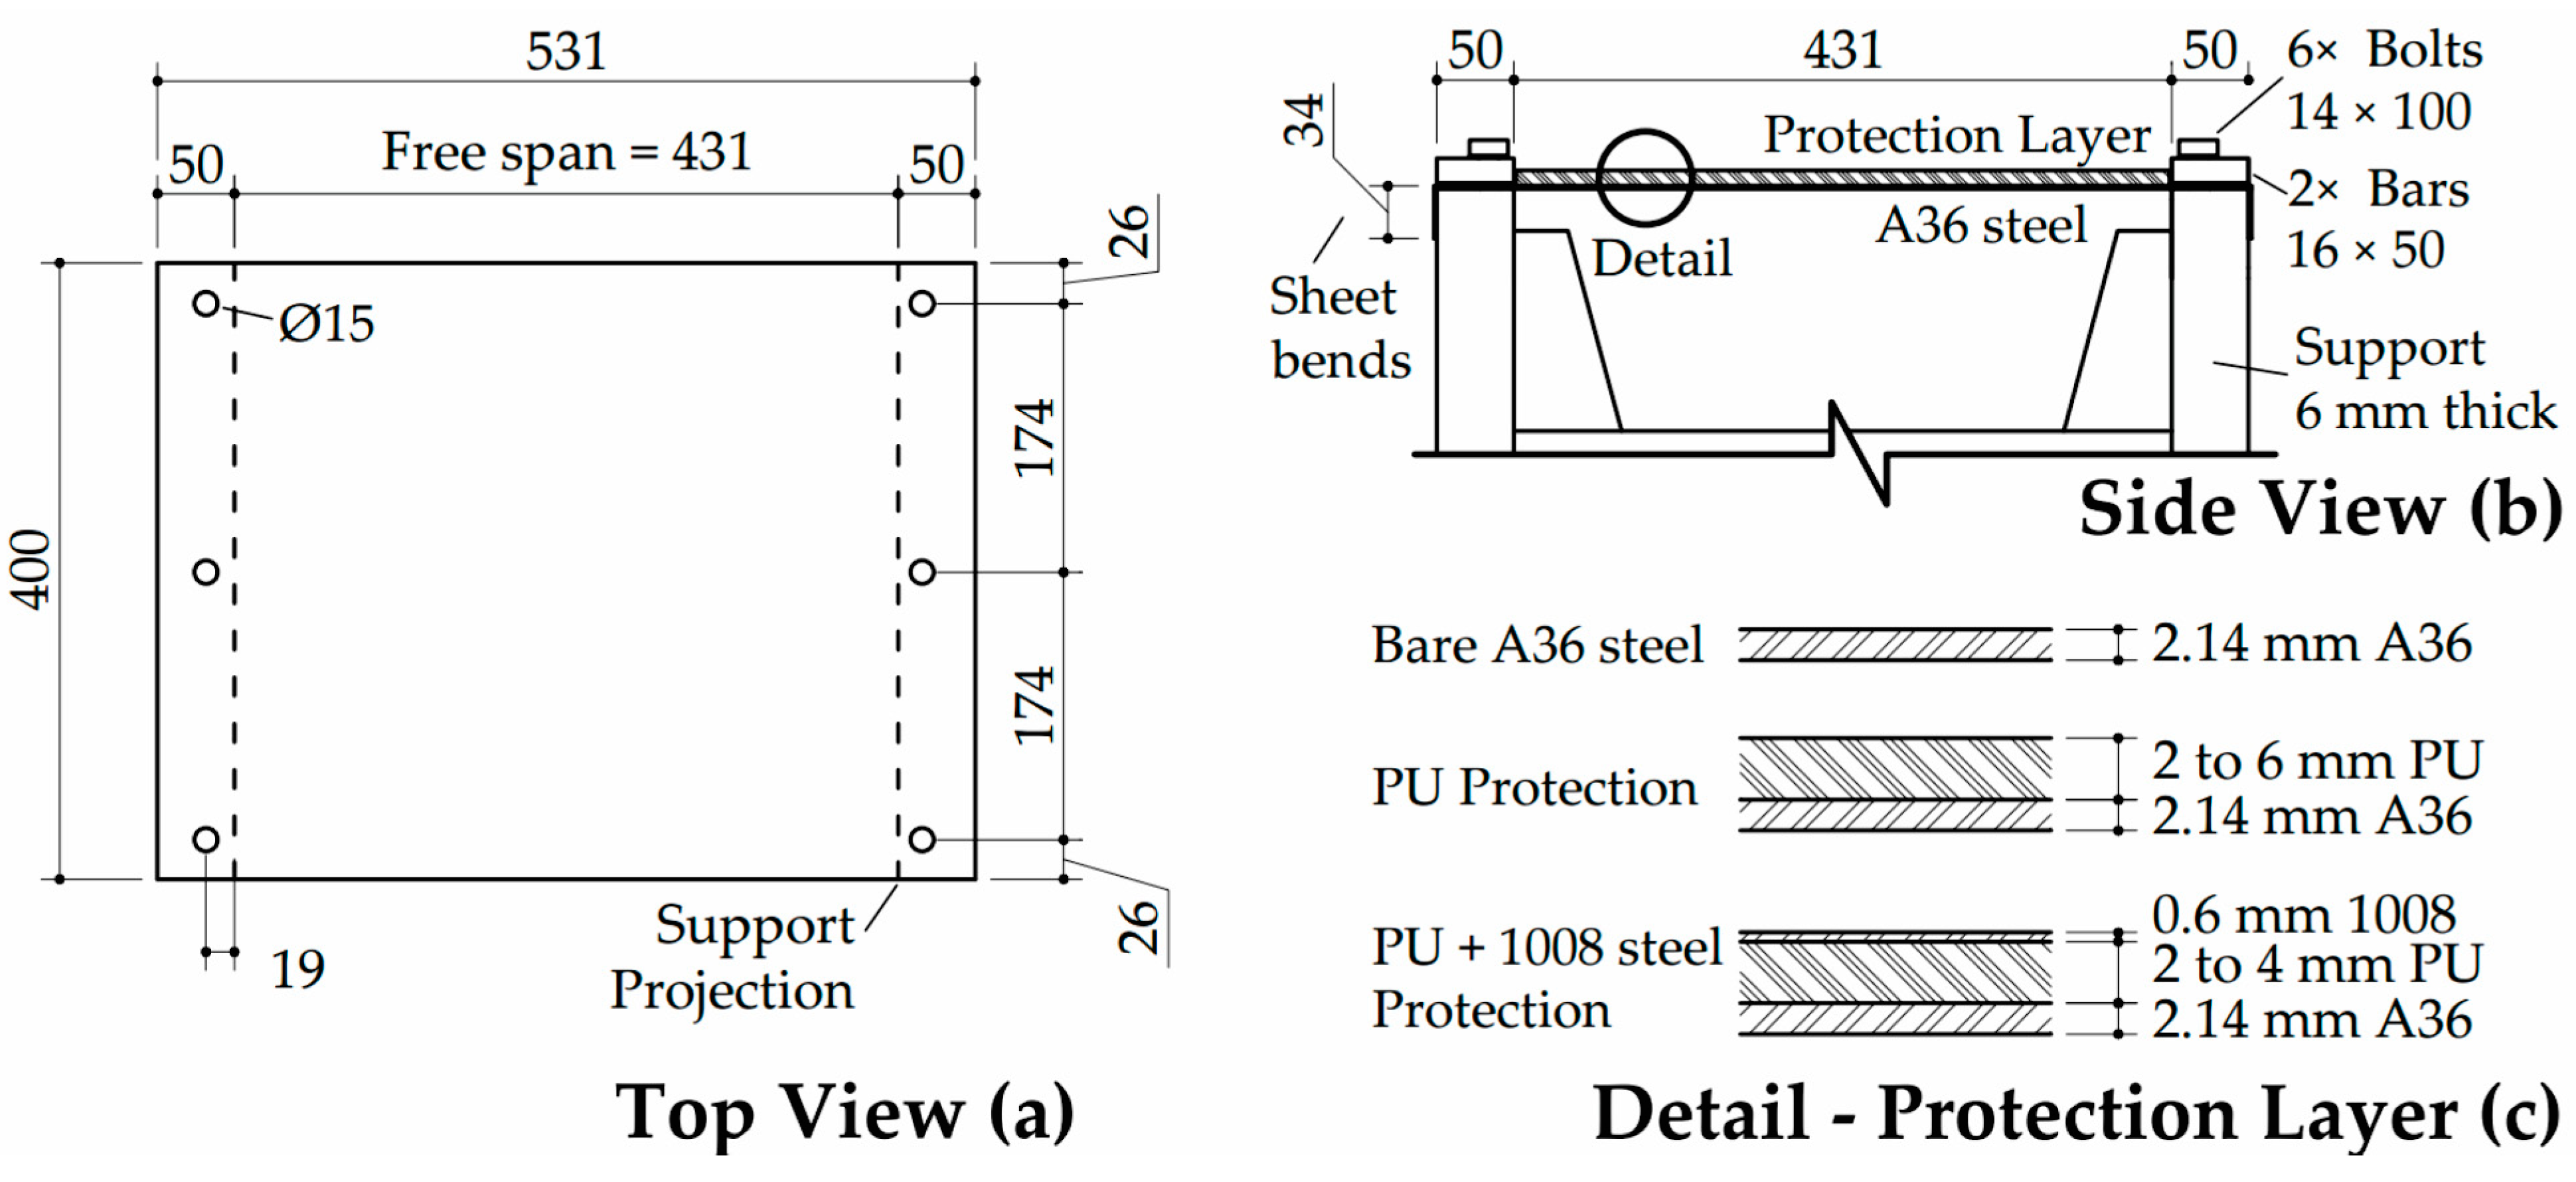
Each sheet measured 600 × 400 × 2.14 mm and had bends and holes on the edges for fixation to the testing apparatus. The free span of the sheet subjected to the blast loads was 431 mm, which was the region where the polyurethane coating was applied. ASTM A36 is a widely utilized low-carbon structural steel known for its favorable mechanical properties. This material offers good weldability and machinability, making it suitable for various structural applications [35]. Table 1 presents the main characteristics of the A36 steel used, provided by the steel manufacturer. The stiffening of the steel under the dynamic load generated by the detonation is accounted for using the Dynamic Increase Factor (DIF). For steel subjected to blast loads under bending conditions, the DIF multiplier is 1.20 for yield strength and 1.05 for tensile strength [36]. The dynamic values, including the stiffening effect, are also presented in Table 1.
Six sheets did not receive any type of polyurethane protection and were used in the initial tests. The other twelve had their upper surfaces sanded and cleaned with thinner to ensure the adhesion of polyurethane to the steel. The sanding process was carried out manually using 120-grit sandpaper on a fixed, flat table, avoiding any damage or stress to the steel sheet. The sanding and thinner application were performed to remove any residual material from the steel manufacturing process, without significantly altering the steel’s roughness, thus preventing any interference with the polyurethane adherence.
Each steel sheet was then placed on a table with flatness control, and the edges were sealed with neutral silicone to prevent the liquid resin from leaking. The amount of polyurethane was controlled by mass and applied to the steel surface using the pour-over method, which involves pouring the liquid material onto the surface, allowing it to spread evenly and cure. The material and method used were commercial, and the criteria for defining the material’s characteristics were based on Shore hardness. Two of the sheets received a Shore 60A polyurethane elastomer to study the influence of material hardness compared to the other ten with Shore 90A. Table 2 presents the characteristics of the polyurethane used in the study. This table demonstrates that the Shore 60A polyurethane has lower strength and hardness; however, it is more flexible.
The polyurethane elastomer was provided by Celpan Indústria e Comércio de Plásticos Ltda [37], located in Carapicuíba, SP, Brazil.
Four of the sheets, after the polyurethane resin pouring process, received an additional layer of a 0.6 mm thin sheet of AISI 1008 steel. These sheets were provided by Usinas Siderúrgicas de Minas Gerais S.A. [38], another Brazilian steel company, and acquired in the city of São José dos Campos, SP. AISI 1008 steel is a low-carbon steel widely used due to its low cost and ease of forming. It is not intended for structural purposes, as it does not have controlled mechanical strength, and is commonly found in automotive parts, simple metal components, and applications where high strength is not required. These sheets were sanded and cleaned similarly to the A36 ones and applied while the resin was still uncured to ensure adhesion. The main objective was to evaluate whether the sandwich material would provide an extra layer of protection at a low additional cost and weight.
Figure 1 presents an A36 steel sheet with no protection (a), two sanded steel sheets (b), a steel sheet with cured polyurethane elastomer applied (c), and a sandwich configuration with polyurethane elastomer and thin 1008 steel (d). Figure 2 details the layout and dimensions of the resulting sheets, with a top view (a), a side view (b), and a detailed cut of the protection layers (c). Table 3 lists all eighteen specimens after the application of the polyurethane elastomer.

2.2. Near-Field Blast Tests

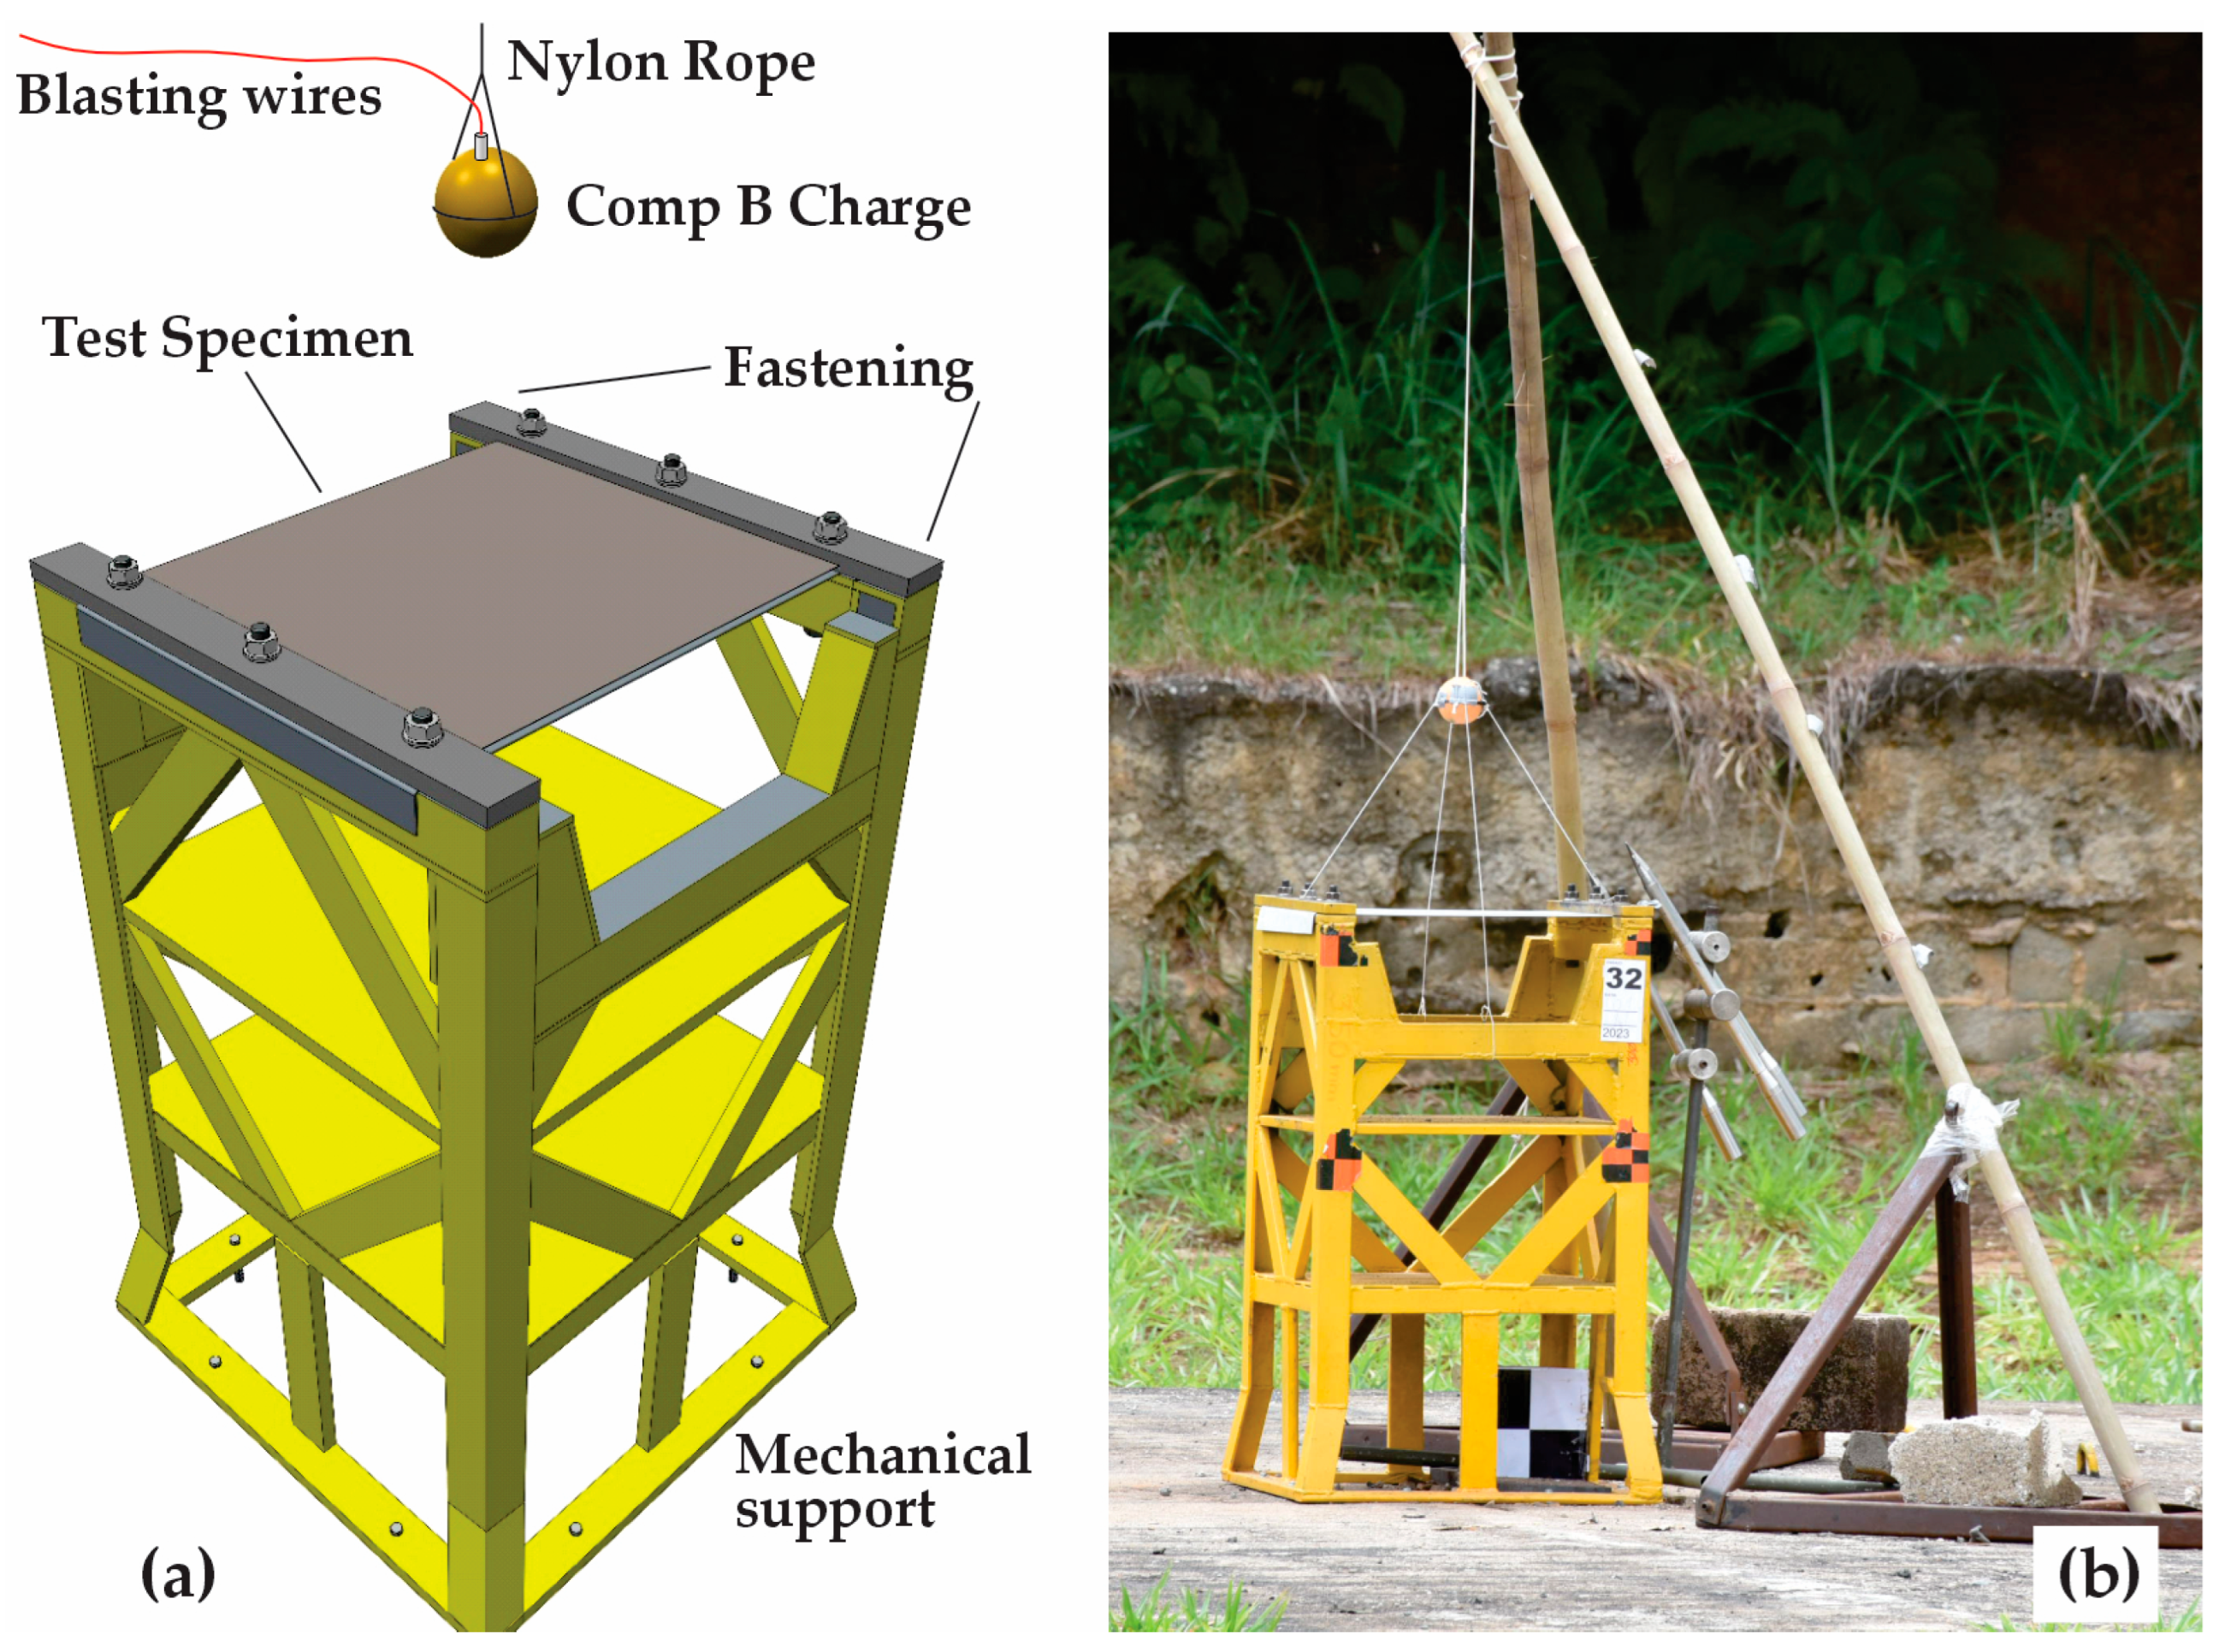
Figure 3a shows the blast test layout, and Figure 3b presents a photo of the test site. A robust steel mechanical support, 900 mm height, was mounted on a concrete base. This structure was designed to remain completely rigid, without undergoing any deformations during the explosion tests. The eighteen explosive charges consisted of Composition B (Comp B), shaped into bare spheres with a diameter of approximately 72 mm and a mass of 334 g. More detailed information about the Comp B used in the experiments can be found in [39]. These charges were secured with a nylon rope tied to a replaceable, flexible wooden rod. The explosive was initiated at its center using a No. 8 blasting cap and approximately 1.4 g of a pressed 1,3,5-Trinitro-1,3,5-triazacyclohexane (RDX) explosive booster pellet.
The A36 steel sheets, whether bare or protected (referred to as test specimens), were replaced after each test. As previously mentioned, these sheets featured two bends along the edges, as well as holes for bolt passage. They were secured to the mechanical support using a pair of steel bars with a 16 × 50 mm cross-section and six class 12.9 metric hex bolts measuring 14 × 100 mm, each accompanied by a nut of matching grade and dimensions. The support was constructed using welded bars with a thickness of 6 mm, with an approximate total mass of 200 kg. The entire structure was mechanically designed in advance and tested in preliminary blast experiments that were not recorded, as they were conducted solely for trial purposes. However, the results show that the fastening system withstood the loads without deformation. More details about the dimensions were presented in Figure 2.
As observed in Figure 4, the entire system was carefully centered with the explosive (Figure 4a), and calibration marks were affixed to ensure accurate measurement (Figure 4b). All positions and calibrations were measured using a meter with a precision of 1 mm, with the aid of reference bars.
The detonation events were captured by a high-speed camera positioned 45 m from the explosive (L), ensuring sufficient distance to prevent damage to the equipment. Phantom VEO 640 cameras were used, with specifications outlined in the manufacturer’s datasheet [40]. The lenses mounted on the cameras were Sigma 120–300mm f/2.8, regulated to a focal length (f) of 200 mm. The camera recorded displacement at 10,000 fps with a resolution of 640 × 576 pixels.
Nine tests were conducted with a standoff distance of 500 mm between the explosive charge and the steel sheet. Subsequently, nine additional tests were performed with a standoff distance of 300 mm, with no changes to any other configuration.

2.3. Blast Intensity of the Experiments Compared with Real Events

An important parameter for evaluating detonation intensity is the scaled distance, which is used to compare blast effects at different distances and charge sizes. It is typically calculated using Equation (1) [41]:
Z = R /   W 3
where Z is the scaled distance; R is the actual distance from the explosive charge to the target (in meters); and W is the mass of the explosive, in kilograms of 2,4,6-Trinitrotoluene (TNT) equivalent.
In assessing blast effects, another key factor is the TNT equivalence, which represents the power of an explosive relative to TNT based on the mass ratio for a specific parameter. It provides a reference for evaluating the overall performance of an explosive charge. This value can be determined using various parameters, such as atmospheric peak overpressure, generated impulse, heat of detonation, and others [42].
Using the scaled distance and TNT equivalence, it is possible to compare different events involving various types of explosives, charge masses, and distances. The studies by Kinney and Graham [43] and Kingery and Bulmash [41] consider scaled distance as the primary input parameter for predicting blast parameters, such as shock wave peak overpressure. These methods are among the most widely recognized in the field of blast analysis and are used by major organizations, including the United Nations [2], the U.S. Department of Defense [3], and the Brazilian Air Force [44]. For these methods, detonation events with the same scaled distance will generate similar shock wave peak overpressure.
Considering that the TNT equivalence of Comp B for peak overpressure is 1.28 and the total mass of the charges is 334 g [45], it is possible to calculate the different scaled distances for the tests and compare them with other real-world events that produce a similar peak overpressure. This provides an estimate of the order of magnitude of the intensity of the tests conducted. The incident peak overpressure was calculated using the Kingery and Bulmash method [41]. Table 4 lists some comparisons conducted.
Analyzing Table 4, it is clear that both standoff distances result in high blast peak overpressure, comparable to aggressive real-world events such as a van bomb with 1815 kg of TNT equivalent at a relatively close distance of approximately 8 and 5 m.
This is corroborated by the near-blast field concept, defined by some sources [48,49,50] as the region in close proximity to an explosive detonation, where the effects are dominated by the interaction of high-temperature, high-pressure detonation products and the surrounding medium. Within this zone, blast pressures can exceed the yield strength of structural materials, leading to severe damage. This region can be delineated by a scaled distance of approximately < 1 m/kg1/3, which includes both standoff distance tests. Tyas [48] further defines the extreme near-field zone, characterized by a scaled distance of approximately < 0.5 m/kg1/3, where detonation effects are even more aggressive—a region that would encompass the 300 mm standoff tests.
The conclusion is that all tests were characterized by a near-field detonation region, with pressures and temperatures comparable to real-world aggressive events, capable of generating severe damage to structures.

2.4. Method of Measuring the Peak Displacement

The high-speed camera captured the event at 10,000 frames per second, enabling the measurement of displacements. This method was chosen due to the extreme velocities and accelerations involved during the tests. Considering that the center of the steel sheet displaced approximately 50 to 70 mm in just 3 ms, the average acceleration reached the order of magnitude of 104 m/s2. These test parameters would exceed the capabilities of other available sensors, such as linear displacement transducers, accelerometers, and laser Doppler velocimeters.
As shown in Figure 4b, calibration marks were fixed on the side of the mechanical support, spaced 350 ± 0.5 mm apart. The camera’s line of sight was positioned perpendicularly to the experimental support, ensuring that the calibration and measurement planes were parallel and not inclined in the camera image. Due to the test setup, the distance between these two planes (D) was 55 ± 0.5 mm. The center of the camera’s field of view was aligned with the center of the steel sheet, with the camera height controlled at 900 mm.
The software Tracker 6.2.0 [51] was used to calibrate the event and perform the displacement measurements. This open-source tool, developed by Open-Source Physics, is well-suited and reliable for such analyses. The distance was calibrated using the visible marks, and the time was calibrated based on the high-speed camera’s frame rate, with the initial frame set at the moment of the explosive detonation.

2.5. Uncertainties in Displacement Measurement

There are several sources of measurement uncertainties using the proposed method. Since the camera’s point of view was positioned perpendicular to the parallel planes of calibration and measurement, and no object moved out of these planes, the parallax error relies on the distance between these two planes (D), resulting in the simplified Equation (2).
e p = D   f   L
where ep is the parallax error; D is the distance between the calibration and the measurement planes; f is the focal length of the camera; and L is the distance from the camera to the calibration plane [52].
Another important cause of uncertainties in image measurement is the resolution limit, which is determined by the pixel size. In the present work, the resolution of 640 × 576 pixels resulted in an image measuring 531 × 478 mm after the calibration process, leading to a pixel size of 0.83 mm in both directions [52].
The calibration distance itself presents uncertainty related to the meter used for its fixation and the image resolution. The error generated by this uncertainty is proportional to the ratio between the measured displacement and the calibration length. A displacement of 70 mm, larger than the maximum observable value during the tests, was considered [52].
Other potential errors from optical distortion were assessed before the tests, and no measurable distortions were detected due to the use of calibrated and suitable equipment. Additionally, no angular error was present, as the calibration and measurement planes were perpendicular to the camera’s field of view.

3. Results

3.1. Blast Near-Field Tests Results

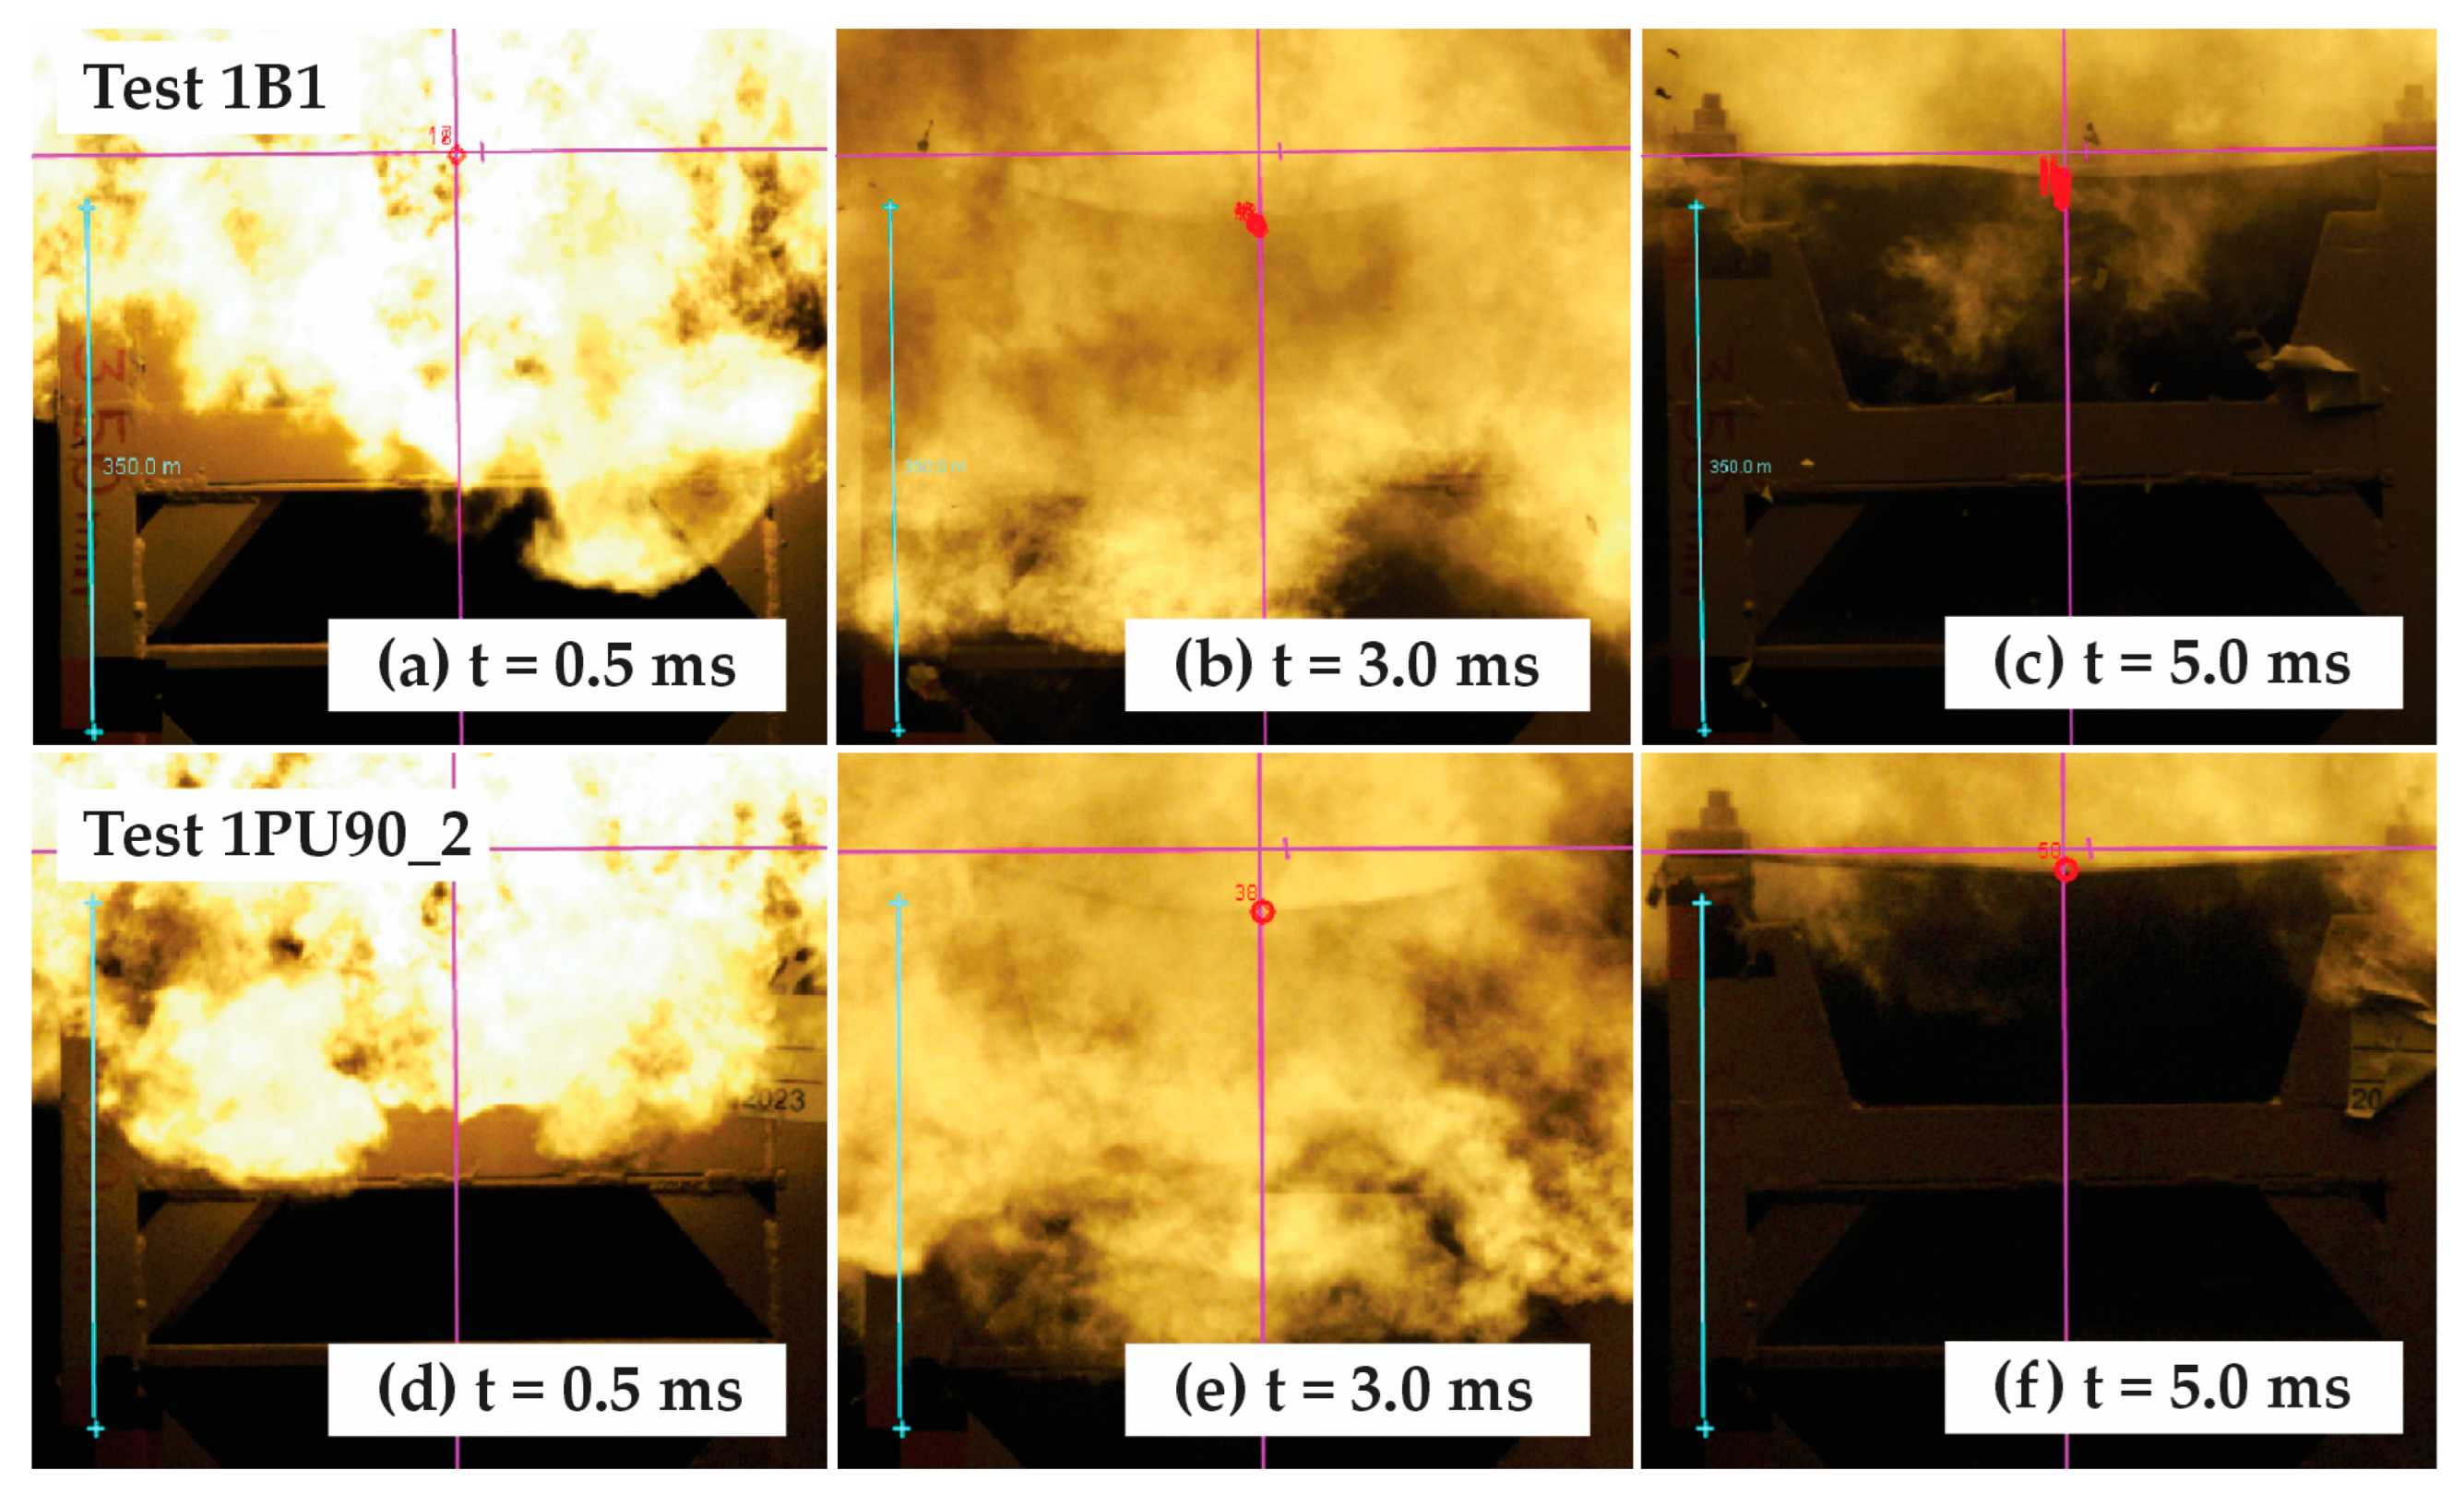
All tests were conducted without any incidents being recorded by the high-speed camera. Initially, the event was characterized by the rapid expansion of gases and shock wave propagation, which reached the steel sheet in less than 0.5 ms. The sheet was naturally deformed downward by the high pressure generated by the blast, reaching its maximum displacement in less than 2 ms. After 3.5 ms, the steel sheet was impacted by an upward-directed reflected shock wave, originating from the interaction of the initial shock wave with the concrete base. This secondary shock wave displaced the steel sheet from its maximum deflection, causing an upward deformation.
Observation of the event was partially obscured during the initial deformation due to the explosion’s fireball, as expected in a near-field region. With the exception of one test, the maximum displacement was observable before the second shock wave impact. This allowed for accurate measurement of the maximum displacement, the most critical structural parameter of interest for this research.
Figure 5 presents representative examples of the test evolution through three frames captured by the high-speed camera during two experiments: Test 1B1 and Test 1PU90_2. In the first frames (Figure 5a,d, t = 0.5 ms), the explosive fireball obscures the sheet’s deformation. The maximum displacement is visible in the second frames (Figure 5b,e, t = 3.0 ms). Finally, the third frames (Figure 5c,f, t = 5.0 ms) show the upward displacement of the sheet following the impact of the reflected shock wave. All tests exhibited similar behavior during the detonation event, as observed in these examples, differing only in the maximum displacement measured due to the different protection layers. Such differences in deformation can only be detected with the support of Tracker 6.2.0, which was used to measure the displacements.

3.2. Visual Results of the Specimens

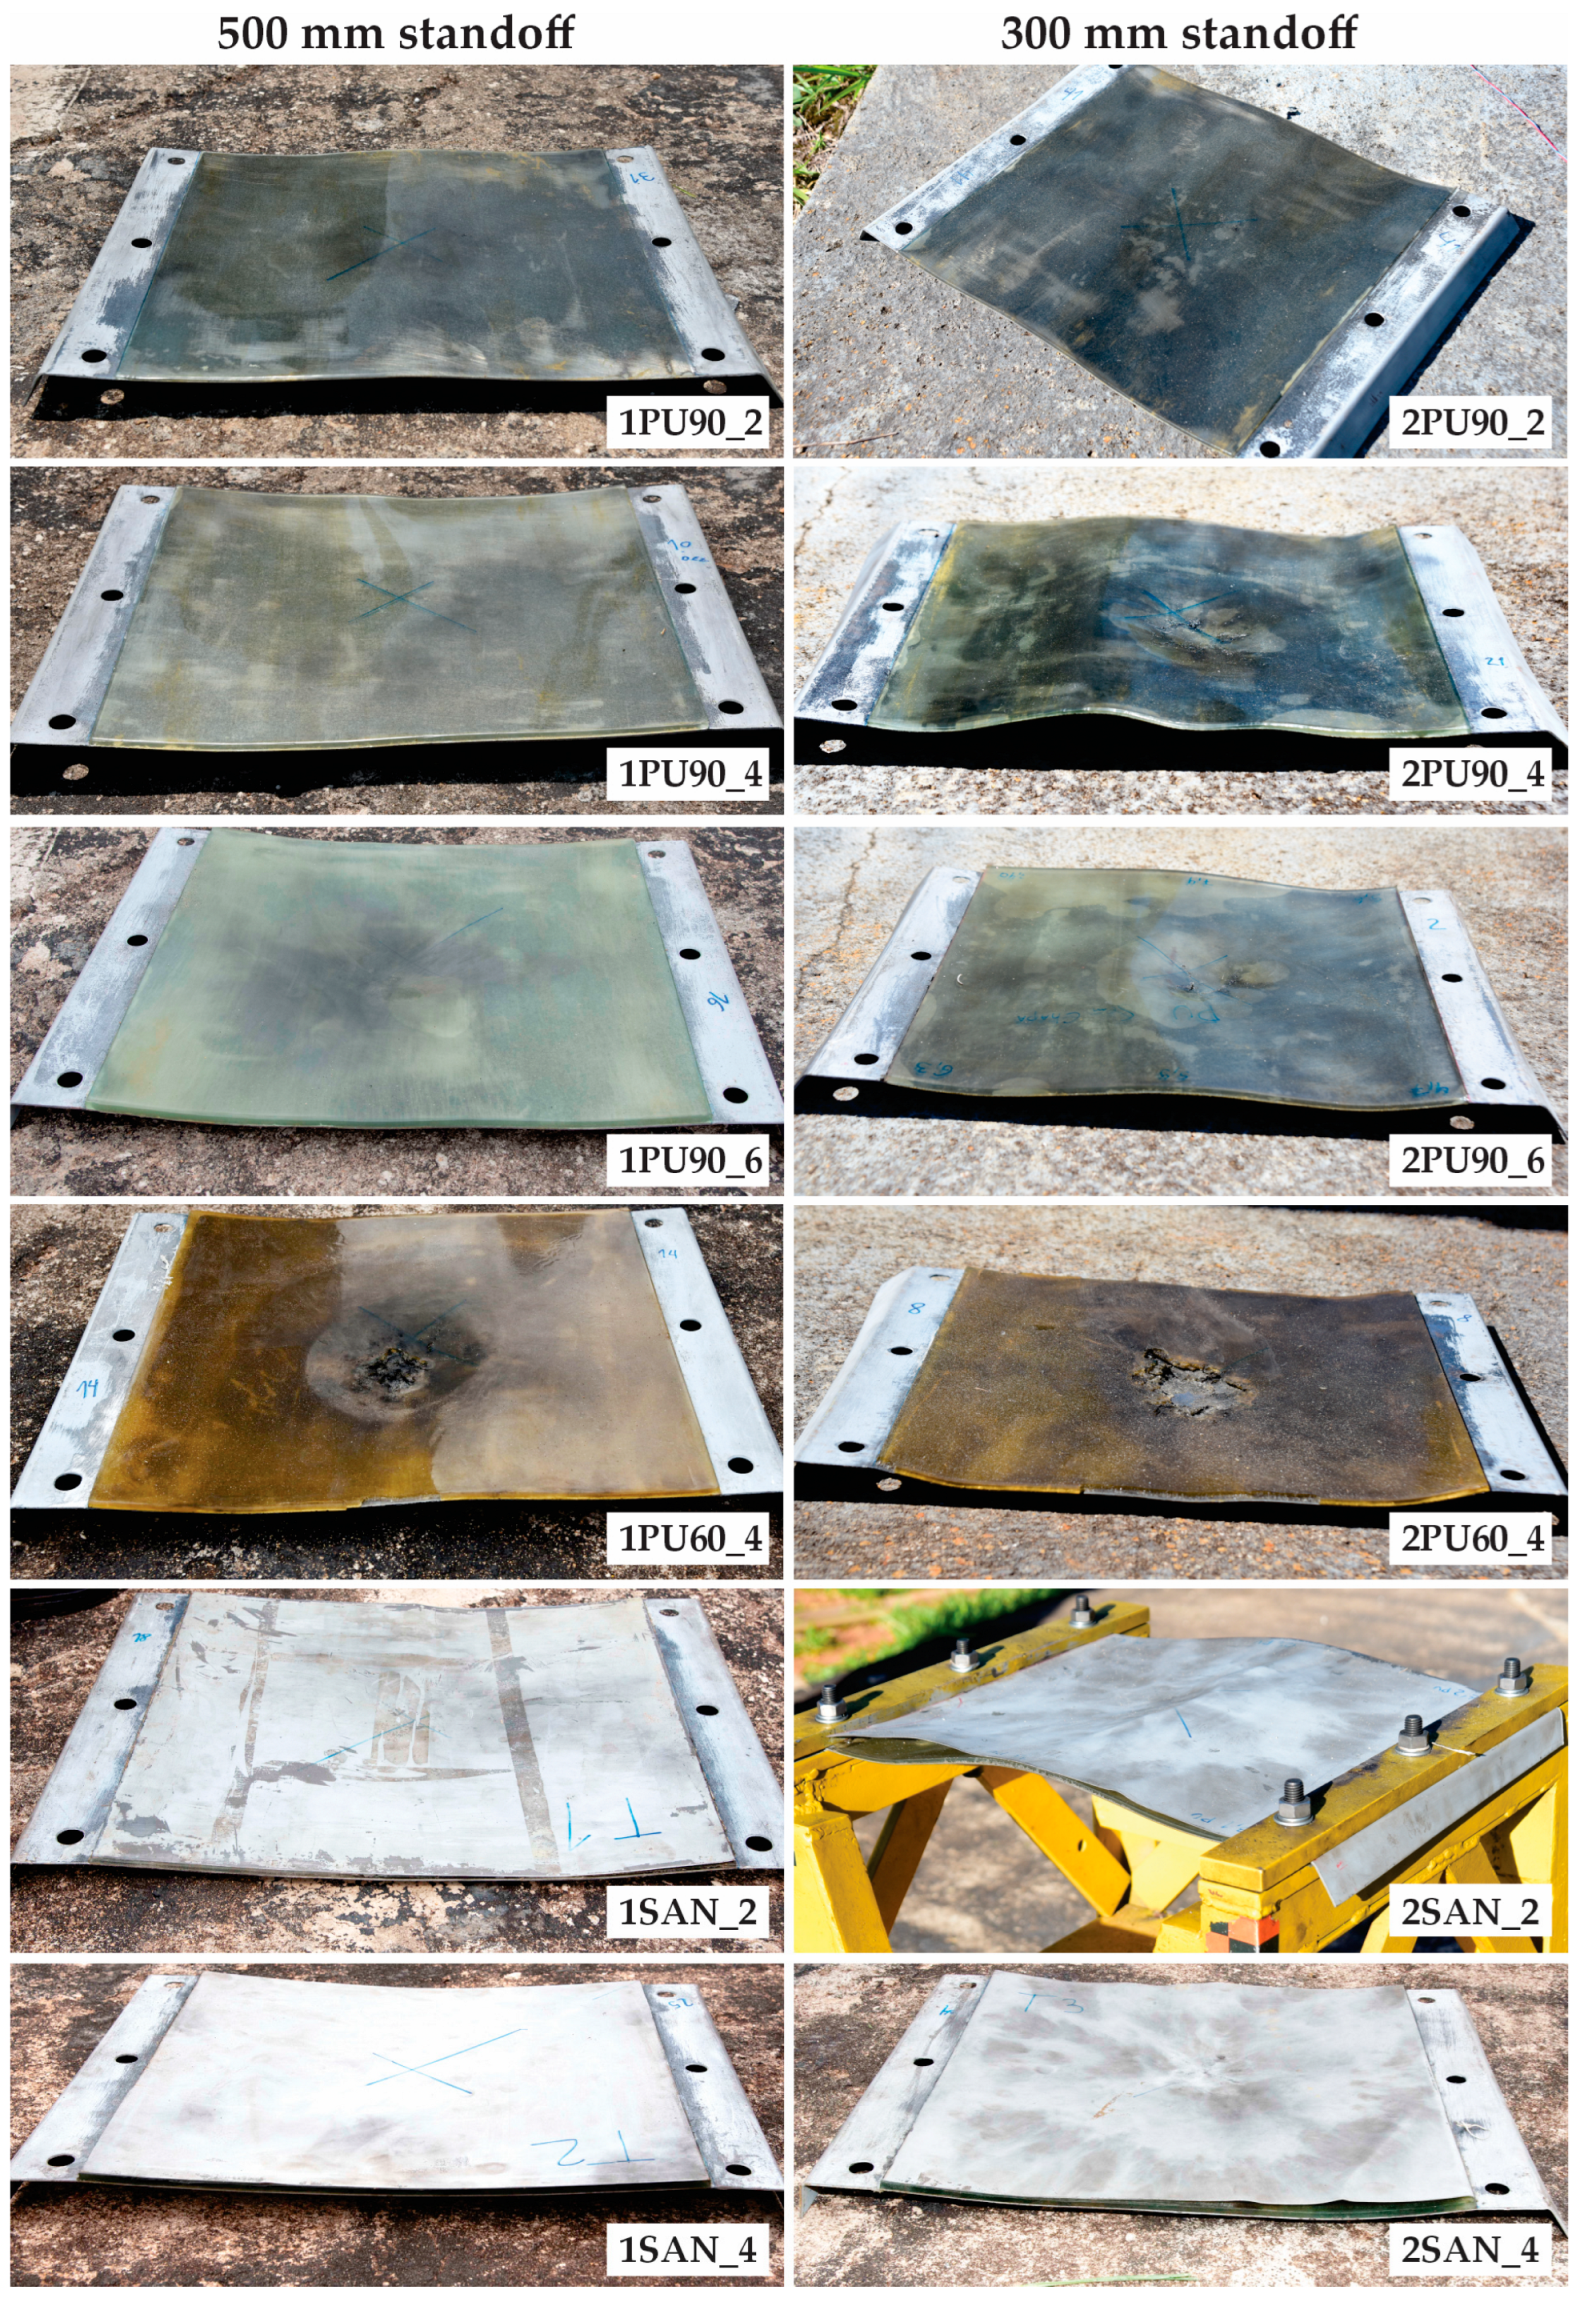
This section presents the visual results of the tests, showing the behavior of the specimens after exposure to the near-field blast. A detailed analysis of the results will be provided in the discussion. The six bare steel sheets exhibited consistent and repetitive behavior during the blast tests, displaying significant residual deformations that were naturally smaller than the maximum displacement. Figure 6 presents two of these tests, with standoff distances of 500 mm (a) and 300 mm (b), while Figure 7 shows each steel sheet protected with different polyurethane elastomer configurations after blast exposure.
The results in Figure 7 are shown as a function of the two standoff distances: 500 mm in the left column and 300 mm in the right column. As illustrated in the figure, the protective performance of the elastomer layers varied depending on the configuration and standoff distance, influencing the resulting damage patterns. The identification of each specimen follows the list presented in Table 3, which details the specific elastomer configurations applied in each case.

3.3. Maximum Displacement

The resulting uncertainties in the measurements are presented in Table 5. The total uncertainty was calculated using the root sum of squares of each independent uncertainty. In the table, the uncertainty values are correctly presented with one significant digit; however, for the calculations, all significant digits were considered to prevent error propagation. Table 6 presents the maximum displacement measured in each test. The uncertainties in other derived values followed the established method of uncertainty propagation.
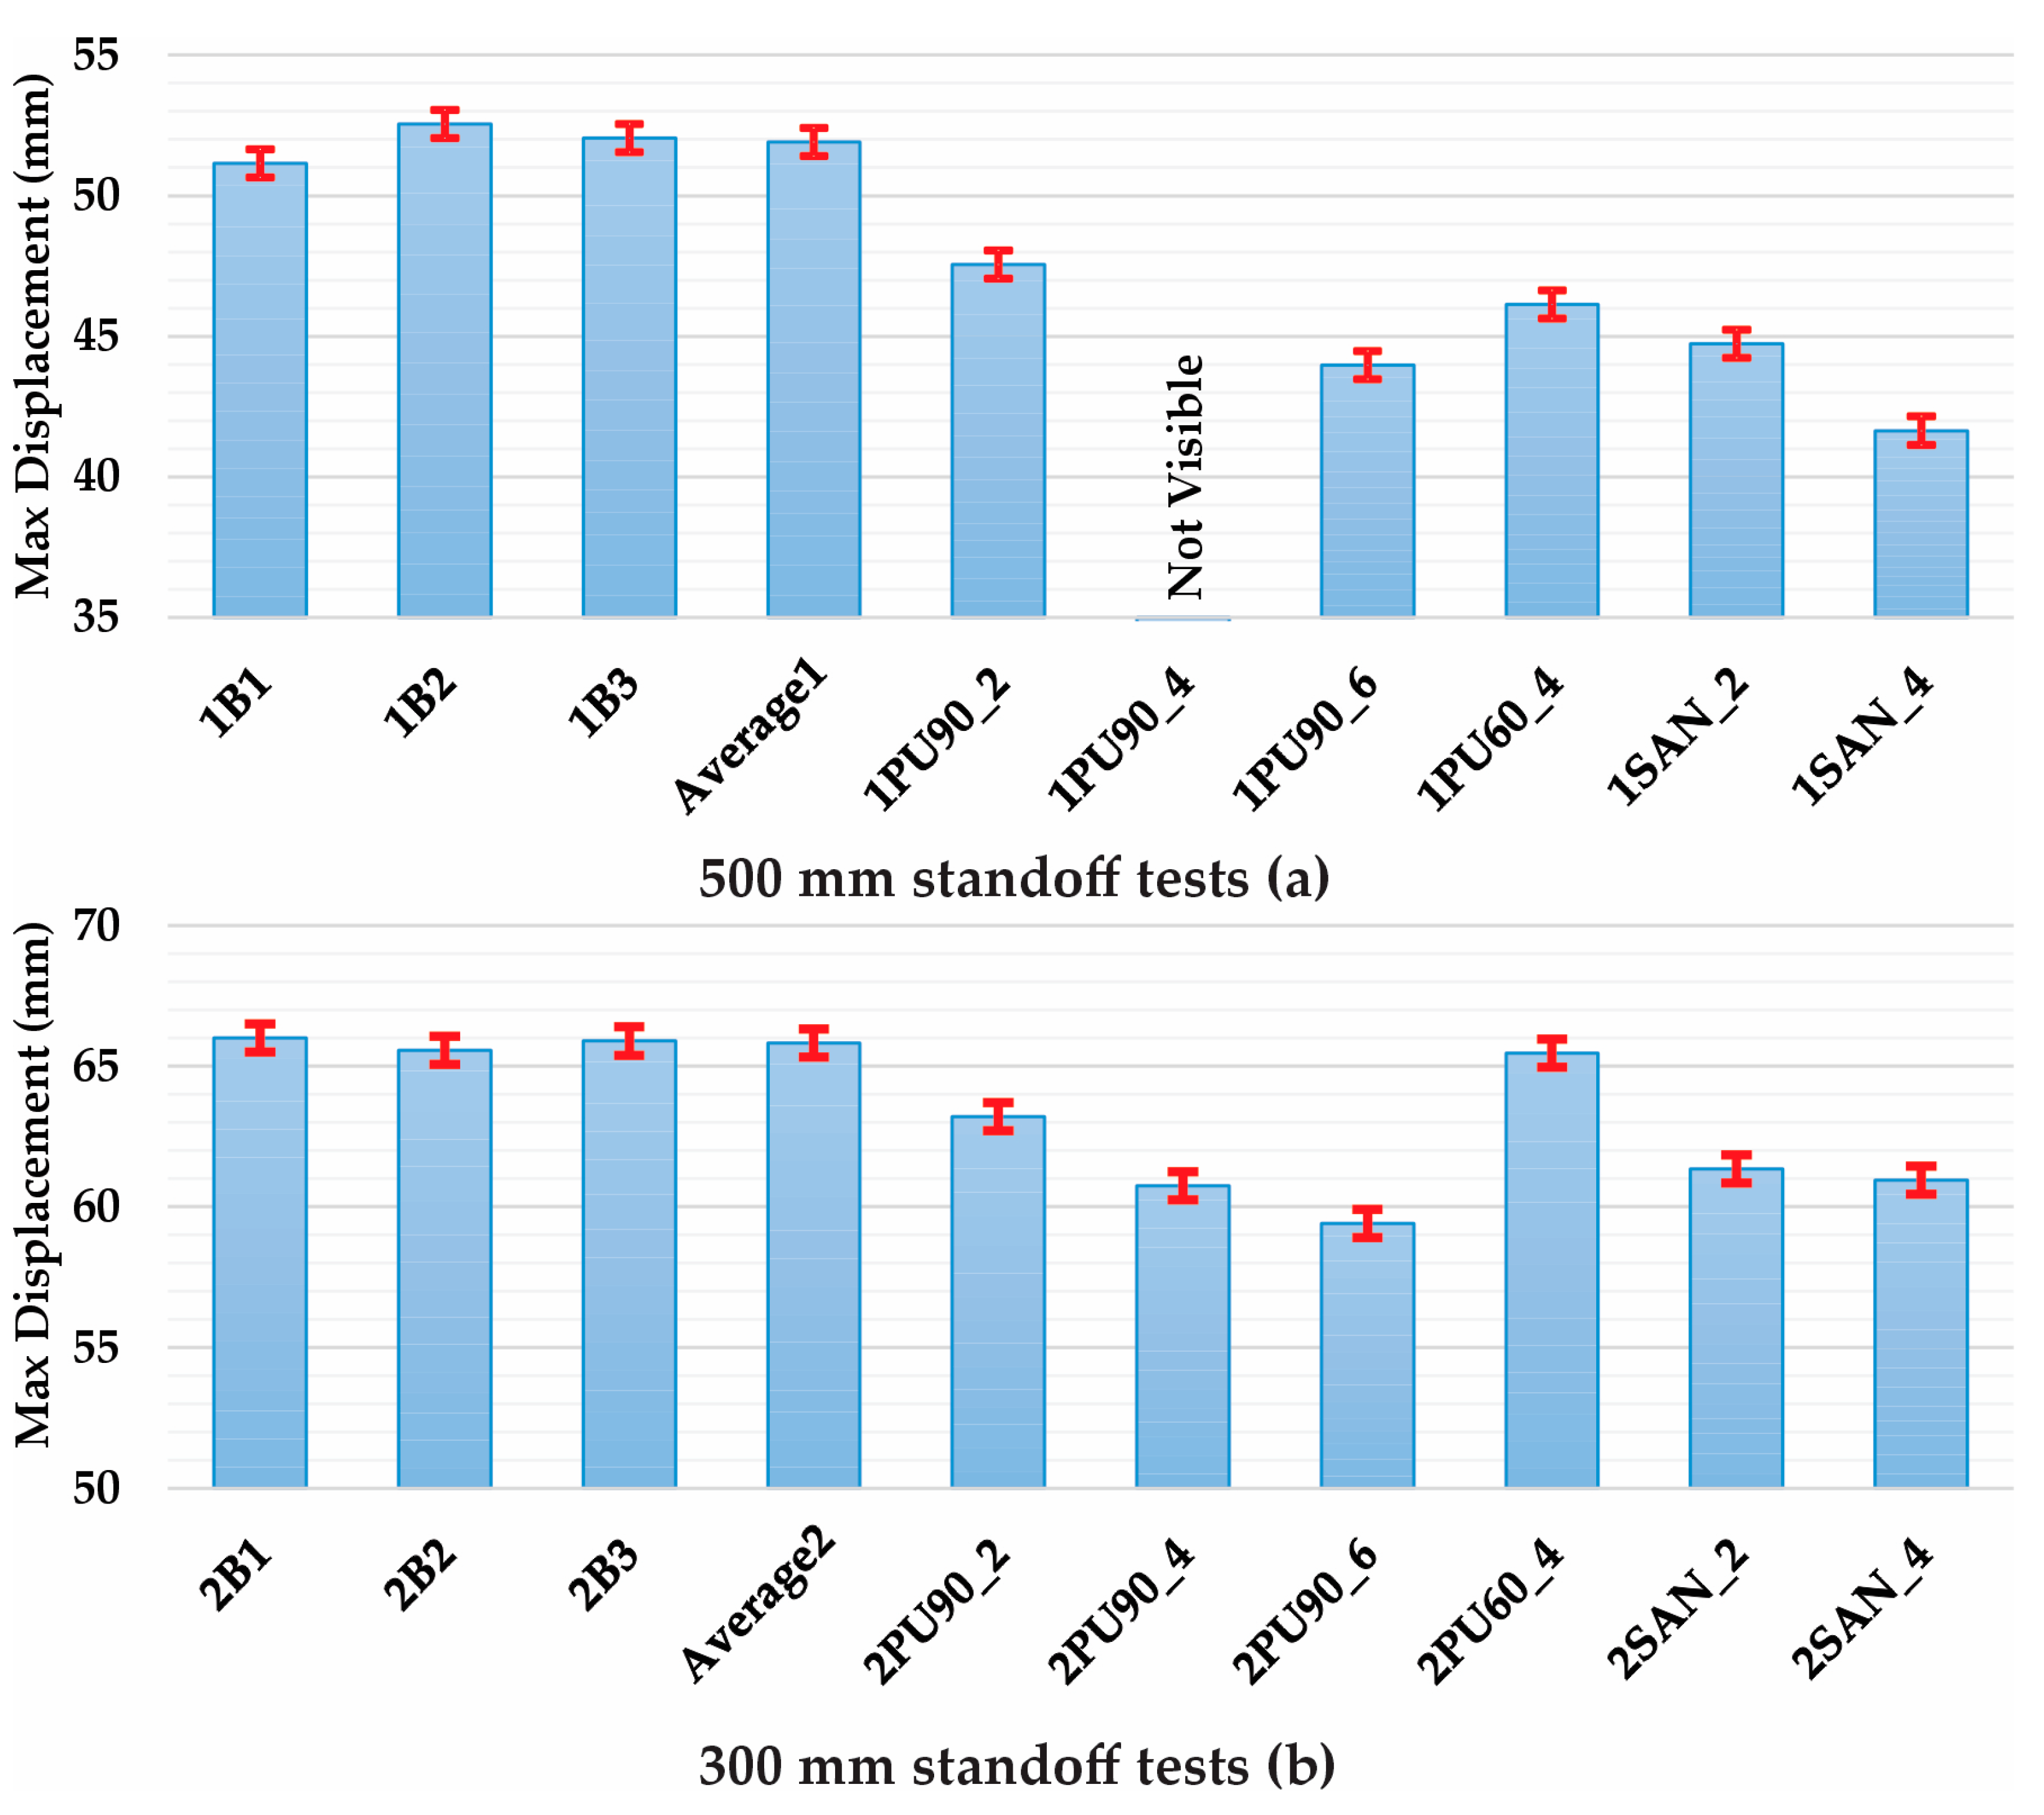
In one of the tests, it was not possible to measure the maximum displacement as the fireball obscured the image at the peak deformation moment. The displacement reduction was compared with the average value from the three tests with unprotected steel sheets, demonstrating the effect of the polyurethane elastomer. Figure 8 presents the results graphically.

4. Discussion

4.1. Results Discussion

The results showed a significant reduction in displacement of A36 sheets when polyurethane elastomer was used under near-field detonation. The most effective results were achieved at a 500 mm standoff distance, with reductions ranging from 8% to 20%. Even in the extreme near-field zone, at a standoff distance of 300 mm, the elastomer was effective when using Shore 90 polyurethane, achieving up to a 10% reduction in displacement.
Focusing on the 500 mm standoff tests, it is notable that the results were aligned with expectations. The displacements were proportional to the elastomer thickness, with 2 mm and 6 mm thick Shore 90 polyurethane reducing displacement by 8% and 15%, respectively. The 4 mm thick Shore 60 polyurethane achieved an 11% reduction, placing it in the mid-range between the 2 mm and 6 mm thick samples. The reduction in polyurethane hardness did not significantly affect the elastomer’s performance in this scenario. The best results were obtained with the sandwich configuration of polyurethane elastomer and a thin 0.6 mm thick 1008 steel sheet. Even with 2 mm and 4 mm elastomer layers, the displacement was reduced by 14% and 20%, significantly outperforming the same thickness of pure polyurethane elastomer. At this standoff distance, the addition of the inexpensive and lightweight 1008 steel sheet proved effective for protection.
Analyzing the resulting photographs of the 500 mm standoff tests (left column of Figure 7), no superficial damage is visible on the polyurethane Shore 90 layer or the sandwich configuration. The elastomer remained attached to both A36 and 1008 steel, and the sheets exhibited a smoother residual displacement compared to the bare condition. The polyurethane 90 elastomer showed no signs of burning or compression deformation and did not lose material. On the other hand, the polyurethane 60 elastomer displayed signs of burning and compression damage, concentrated in the center of the specimen, though this did not affect its protective effectiveness. The burning effect occurred during exposure to the explosion’s fireball, with no residual flames, meaning there is no fire risk, even with the polyurethane 60 elastomer.
Due to the even more aggressive environment, the 300 mm standoff tests presented more complex results. Considering first the use of polyurethane 90 elastomer without a sandwich configuration, the displacement reductions were proportional to the polyurethane thickness, with 4%, 8%, and 10% reductions achieved for 2 mm, 4 mm, and 6 mm thicknesses, respectively. The effectiveness was lower than that observed at the 500 mm standoff distance but still significant, given the extreme conditions. The photographic analysis of pure polyurethane 90 elastomer (first three images in the right column of Figure 7) showed no signs of burning, material loss or detachment. However, at this standoff distance, compression deformation in the polyurethane layer is observable at the center of the specimen. This may explain the slightly lower effectiveness in protecting the steel sheets.
Analyzing the result of the test with the polyurethane 60 elastomer protection at the 300 mm standoff distance, it is notable that the material was unfortunately ineffective. The peak displacement measured was similar to the bare steel condition, showing no reduction at all. This can be explained by the severe damage to the elastomer surface, visible in Figure 7. The material was burned across its entire surface, with partial material loss in the center of the specimen. At this distance, with extreme explosive conditions, the polyurethane 60 elastomer’s hardness was not sufficient to resist and protect the steel sheet.
The sandwich specimens at the 300 mm standoff distance presented the most intriguing results. With a 2 mm polyurethane layer, the addition of the 1008 steel sheet reduced displacement by 7%, slightly better than the 4% reduction observed with the pure 2 mm elastomer. However, the 4 mm polyurethane layer in the sandwich configuration also showed a 7% reduction in displacement, offering no improvement over the same thickness of polyurethane without the 1008 steel layer. These results indicate that the additional thin 1008 steel layer was minimally effective or even ineffective at the 300 mm standoff distance.
This can be explained by adhesion issues between the polyurethane layer and the 1008 steel sheet, visible in the tested specimens and highlighted in Figure 9. While the polyurethane remained adhered to the A36 steel, the 1008 sheet lost its chemical and mechanical bond with the rest of the structure. Since this issue was not observed in the 500 mm standoff tests, it was likely caused by the extreme heat and load conditions rather than a manufacturing defect. The difference in the efficiency of the 2 mm and 4 mm sandwich configurations can be attributed to the more pronounced loss of adherence in the latter case. As observed in Figure 9, only one side of the 2 mm sample (a) was detached, while the 4 mm sample (b) exhibited adhesion issues on both sides.
The last analysis concerns the six bare steel sheet tests. These tests were repeated to ensure the reliability of the testing method, measurement system, and explosive consistency. As expected, for the same standoff distance, the maximum displacement was very similar for the six bare steel sheets. The small differences are attributed to measurement uncertainties and the natural variation in the materials used, even under strict quality control. The maximum deviation between an individual test and the average of the six bare steel sheets was only 1%, which is the same as the uncertainty of this value (±1%).

4.2. Contextualization and Practical Application

When comparing the present study with other works in the field, as described in the introduction, the first notable aspect was the larger number of field tests. Most studies presented between four and ten experiments, while the current one included eighteen. Another important advancement was the use of a high-speed camera to directly measure the maximum displacement that occurred within 3 ms. Most previous works relied on residual deformations or other secondary effects, such as debris projection, energy absorption, overpressure attenuation, or analytical interpretations based on observed damage. These characteristics brought greater repeatability and reliability to the experimental results.
Another important contribution, compared to previous studies, was that near-field blast tests using polyurethane elastomer as reinforcement for steel structures were conducted for the first time. Other protective materials had been tested, such as polyurea elastomer, polyurethane foam, and rigid polyurethane. Polyurethane elastomer, however, had previously only been tested on walls.
The study by Mohotti et al. [32] was the most similar to the present work, but it employed polyurea and measured residual displacement. With a 6 mm polyurea protection layer, a reduction of 4% to 15% in residual displacement was observed. For comparison, in the present study, the same thickness of polyurethane resulted in a reduction of 10% to 15% in maximum displacement when compared to the unprotected sheet.
The similar results demonstrate that polyurethane elastomer can be comparable to polyurea in effectiveness as protection for steel sheets against blast loads. It is important to note that polyurethane elastomer may be more suitable in certain scenarios, such as sandwich components and outdoor applications, due to its longer curing time and resistance to UV and weathering. In addition, it is cheaper and more widely available on the market, which makes it an attractive option for practical use [21].
Considering that, polyurethane elastomer can be applied in various blast protection scenarios. One example is the reinforcement of existing steel floor panels. Since polyurethane elastomer has low density and is self-leveling, its application on floors is simple and does not significantly increase the structural load. A similar application can be found on flat steel roof decks or on the top covers of metallic bunkers and casemates. A similar application can also be considered for removable steel frames, where the polyurethane elastomer can be used without compromising mobility or structural integrity.
Considering new structures, vehicles, and equipment that may be exposed to blast loads—such as hangars, radar stations, troop transport vehicles, and armored tanks—polyurethane elastomer can be used as an additional layer of blast protection without a significant increase in weight. This material is already employed in similar applications to improve impact and abrasion resistance [28], so there is no technical limitation to its use for blast protection. Another possible application is in sandwich panels, provided that proper adhesion is ensured.
Due to its longer curing time, polyurethane elastomer has limited use in existing vertical panels that are permanently fixed to the structure, as the uncured polymer may flow and fail to cure in the correct position. Another limitation is its application in structures that are constantly wet. During the curing process, polyurethane reacts with water, releasing carbon dioxide and forming bubbles. However, this issue occurs only during fabrication, as cured polyurethane is highly resistant to environmental factors such as water and sunlight. A controlled moisture environment during fabrication is an important mitigation measure for this issue.

5. Conclusions

The conclusions of the studies can be summarized as follows:
  • This study tested the use of polyurethane elastomer as reinforcement for steel sheets subjected to near-field blast loads. According to the consulted references, this combination had never been tested before and introduced a more cost-effective material that may be suitable in different scenarios when compared to other materials previously studied, such as polyurea;
  • Eighteen near-field blast tests were conducted on 2 mm A36 steel sheets at 300 mm and 500 mm standoff distances using 334 g of Composition B. Sheets retrofitted with 2–6 mm of Shore A 60 or 90 polyurethane elastomer showed a reduction in maximum displacement ranging from 5% to 20% compared to unprotected sheets. For the 500 mm distance, the best performance was observed with the sandwich configuration, while at 300 mm, the greatest reduction occurred with the thickest polyurethane layer. Overall, Shore A 90 elastomer provided better results than Shore A 60;
  • Polyurethane elastomer showed protective performance similar to that reported for polyurea in a referenced study but offers broader practical applications. Due to its longer curing time, UV resistance, low density, and self-leveling properties, it is suitable for use in sandwich panels, steel floor panels, flat steel roof decks, metallic bunkers, casemates, removable steel frames, and military assets such as hangars, radar stations, transport vehicles, and armored tanks. However, it is not suitable for use on vertically fixed frames due to the flow of the uncured material, or on wet surfaces during curing due to its unintended reaction with water;
  • Future work to advance the field should include testing polyurethane elastomer with different steel profiles and various steel grades. Additionally, analyzing the propagation of vibrations within the structure and their potential influence on the delamination process would be essential to ensure effective adhesion between layers, particularly under extreme loading conditions. This aspect affected the performance of the sandwich configuration tested at the 300 mm standoff distance. Moreover, the present results serve as valuable primary data for the validation of numerical simulations, such as those based on Finite Element Methods, and can support future studies and research in this field.

Author Contributions

Conceptualization, A.S.A., G.U., F.B.M., J.A.F.F.R. and K.I.; methodology, A.S.A., G.U., F.B.M. and J.A.F.F.R.; validation, A.S.A. and G.U., formal analysis, A.S.A.; investigation, A.S.A.; resources, A.S.A. and G.U.; data curation, A.S.A. and G.U.; writing—original draft preparation, A.S.A. and, J.A.F.F.R.; writing—review and editing, G.U., F.B.M. and K.I.; visualization, A.S.A., G.U., F.B.M., J.A.F.F.R. and K.I.; supervision, K.I.; project administration, A.S.A. and G.U. All authors have read and agreed to the published version of the manuscript.

Funding

This research received no external funding.

Institutional Review Board Statement

Not applicable.

Informed Consent Statement

Not applicable.

Data Availability Statement

The original contributions presented in the study are included in the paper. Further inquiries can be directed to the corresponding author.

Acknowledgments

We extend our sincere thanks to RJC Defesa Aeroespacial Ltda for supplying the explosive materials at no cost. Additionally, we are grateful to the Instituto de Aeronáutica e Espaço (IAE) for allowing the use of the detonation test field and for providing expert teams in explosives, occupational safety, area security, and first response. In particular, we would like to acknowledge the Divisão de Sistemas de Defesa (ASD) of the IAE, which played an important role in supplying armament engineers and instrumentation specialists.

Conflicts of Interest

The authors declare no conflicts of interest.

References

  1. Nazarian, A.; Presser, C. Forensic analysis methodology for thermal and chemical characterization of homemade explosives. Thermochim. Acta 2014, 576, 60–70. [Google Scholar] [CrossRef]
  2. United Nations. International Ammunition Technical Guidelines—IATG 01.08, 3rd ed.; United Nations: New York, NY, USA, 2021; Available online: https://data.unsaferguard.org/iatg/en/IATG-01.80-Formulae-ammunition-management-IATG-V.3.pdf (accessed on 3 April 2025).
  3. USDOD. Structures to Resist the Effects of Accidental Explosions—UFC 3-340-02; United States Department of Defense (USDOD): Washington, DC, USA, 2008; p. 1943. Available online: https://www.wbdg.org/FFC/DOD/UFC/ARCHIVES/ufc_3_340_02.pdf (accessed on 3 April 2025).
  4. Mendonça, F.B.; Urgessa, G.S.; Almeida, L.E.N.; Rocco, J.A.F.F. Damage diagram of blast test results for determining reinforced concrete slab response for varying scaled distance, concrete strength and reinforcement ratio. An. Acad. Bras. Ciênc. 2021, 93, e20200511. [Google Scholar] [CrossRef] [PubMed]
  5. Barsoum, R.G. Elastomeric Polymers with High Rate Sensitivity—Applications in Blast, Shockwave, and Penetration Mechanics; William Andrew: Oxford, UK, 2015; Available online: https://www.sciencedirect.com/book/9780323354004/elastomeric-polymers-with-high-rate-sensitivity (accessed on 3 April 2025).
  6. Oertel, G. Polyurethane Handbook; Hanser Publishers: Munich, Germany, 1985; p. 629. [Google Scholar] [CrossRef]
  7. Cartman, L. Handbook of Polyurethane; NY Research Press: New York, NY, USA, 2015. [Google Scholar]
  8. Souza, F.M.d.; Kahol, P.K. Introduction to polyurethane chemistry. In Renewable Polyols and Isocyanates; Gupta, R.K., Ed.; ACS Symposium Series: Washington, DC, USA, 2021; pp. 1–24. [Google Scholar] [CrossRef]
  9. Oertel, G. Polyurethane Handbook: Chemistry, Raw Materials, Processing, Application, Properties, Subsequent ed.; Hanser Pub Inc.: Cincinnati, OH, USA, 1994. [Google Scholar]
  10. Zu, X.; Chen, T.; Cai, Y.; Huang, Z.; Xiao, Q. Blast resistance of a masonry wall coated with a polyurea elastomer. Coatings 2022, 12, 1744. [Google Scholar] [CrossRef]
  11. Huang, W.; Zhang, R.; Wang, X.; Lyu, P.; Ju, J.; Gao, F.; Yan, S. Study of blast mitigation performance and fracture mechanism of polyurea under contact explosion. Polymers 2022, 14, 3458. [Google Scholar] [CrossRef]
  12. Yue, Z.; Zhou, J.; Kong, X.; Xu, Y.; Chen, Y.; Wang, B.; Huang, Y.; Wang, P. Anti-blast performance of polyurea-coated concrete arch structures. Polymers 2023, 15, 1263. [Google Scholar] [CrossRef]
  13. Fatt, H.S.H.; Ouyang, X.; Dinan, R.J. Blast response of walls retrofitted with elastomer coatings. In Structures Under Shock and Impact VIII; Force Protection Branch, Air Force Research Laboratory, Tyndall Air Force Base: Tyndall AFB, FL, USA, 2004; Available online: https://apps.dtic.mil/sti/tr/pdf/ADA589006.pdf (accessed on 3 April 2025).
  14. Davidson, J.; Porter, J.; Dinan, R.; Hammons, M.; Connell, J. Explosive testing of polymer retrofit masonry walls. J. Perform. Constr. Facil. 2004, 18, 100–107. [Google Scholar] [CrossRef]
  15. Wu, G.; Ji, C.; Wang, X.; Gao, F.Y.; Zhao, C.X.; Liu, Y.J.; Yang, G.L. Blast response of clay brick masonry unit walls unreinforced and reinforced with polyurea elastomer. Def. Technol. 2022, 18, 643–662. [Google Scholar] [CrossRef]
  16. Santos, A.P.; Chiquito, M.; Castedo, R.; López, L.; Gomes, G.; Mota, C.; Fangueiro, R.; Mingote, J.L. Experimental and numerical study of polyurea coating systems for blast mitigation of concrete masonry walls. Eng. Struct. 2023, 284, 116006. [Google Scholar] [CrossRef]
  17. Lyu, P.; Fang, Z.; Wang, X.; Huang, W.; Zhang, R.; Sang, Y.; Sun, P. Explosion Test and Numerical Simulation of Coated Reinforced Concrete Slab Based on BLAST Mitigation Polyurea Coating Performance. Materials 2022, 15, 2607. [Google Scholar] [CrossRef]
  18. Chen, Y.S.; Wang, B.; Zhang, B.; Zheng, Q.; Zhou, J.N.; Jin, F.N.; Fan, H.L. Polyurea coating for foamed concrete panel: An efficient way to resist explosion. Def. Technol. 2020, 16, 136–149. [Google Scholar] [CrossRef]
  19. Zhu, H.; Wang, X.; Wang, Y.; Wu, G.; Cao, Y.; Ji, C. Dynamic responses of aluminum alloy plates coated with polyurea elastomer subjected to repeated blast loads: Experimental and numerical investigation. Thin-Walled Struct. 2023, 189, 110912. [Google Scholar] [CrossRef]
  20. Zhu, H.; Ji, C.; Feng, K.; Tu, J.; Wang, X.; Zhao, C. Polyurea elastomer for enhancing blast resistance of structures: Recent advances and challenges ahead. Thin-Walled Struct. 2024, 200, 111938. [Google Scholar] [CrossRef]
  21. Jamil, A.; Guan, Z.W.; Cantwell, W.J.; Zhang, X.F.; Langdon, G.S.; Wang, Q.Y. Blast response of aluminium/thermoplastic polyurethane sandwich panels—Experimental work and numerical analysis. Int. J. Impact Eng. 2019, 127, 31–40. [Google Scholar] [CrossRef]
  22. Bahei-El-Din, Y.A.; Dvorak, G.J. Behavior of sandwich plates reinforced with polyurethane/polyurea interlayers under blast loads. J. Sandw. Struct. Mater. 2007, 9, 261–281. [Google Scholar] [CrossRef]
  23. Kannan, K.; Ponnalagu, A. Blast effect on layered polyurethane foam. Int. J. Impact Eng. 2024, 187, 104894. [Google Scholar] [CrossRef]
  24. Mostafa, H.E.; El-Dakhakhni, W.W.; Mekky, W.F. Use of reinforced rigid polyurethane foam for blast hazard mitigation. J. Reinf. Plast. Compos. 2010, 29, 3048–3057. [Google Scholar] [CrossRef]
  25. Jia, S.; Wang, C.; Xu, W.; Ma, D.; Qi, F. Experimental investigation on weak shock wave mitigation characteristics of flexible polyurethane foam and polyurea. Def. Technol. 2024, 31, 179–191. [Google Scholar] [CrossRef]
  26. Freidenberg, A.; Lee, C.W.; Durant, B.; Nesterenko, V.F.; Stewart, L.K.; Hegemier, G.A. Characterization of the Blast Simulator elastomer material using a pseudo-elastic rubber model. Int. J. Impact Eng. 2013, 60, 58–66. [Google Scholar] [CrossRef]
  27. Somarathna, H.M.C.C.; Raman, S.N.; Badri, K.H.; Mutalib, A.A. Mechanical characterization of polyurethane elastomers: For retrofitting application against blast effects. In Proceedings of the SMAR 2015: Third Conference on Smart Monitoring, Assessment & Rehabilitation of Civil Structures, Antalya, Turkey, 7–9 September 2015; Available online: https://plus.empa.ch/smar-conferences-data/SMAR_2015_Proceedings/papers/48.pdf (accessed on 3 April 2025).
  28. Chattopadhyay, D.K.; Raju, K.V.S.N. Structural engineering of polyurethane coatings for high performance applications. Prog. Polym. Sci. 2007, 32, 352–418. [Google Scholar] [CrossRef]
  29. Somarathna, H.M.C.C.; Raman, S.N.; Mutalib, A.A.; Badri, K.H. Elastomeric polymers for blast and ballistic retrofitting of structures. J. Teknol. Sci. Eng. 2015, 76, 1–13. [Google Scholar] [CrossRef]
  30. Knox, K.J.; Hammons, M.I.; Lewis, T.T.; Porter, J.R. Polymer Materials for Structural Retrofit; Force Protection Branch, Air Expeditionary Forces, Technology Division, Air Force Research Laboratory: Tyndall AFB, FL, USA, 2000; Available online: http://userfile.alephnetwork.com/files/b2gmarekt_vendor/Polymer_Retrofit_Paper-1.pdf (accessed on 3 April 2025).
  31. Davidson, J.S.; Fisher, J.W.; Hammons, M.I.; Porter, J.R.; Dinan, R.J. Failure mechanisms of polymer-reinforced concrete masonry walls subjected to blast. J. Struct. Eng. 2005, 131, 1194–1205. [Google Scholar] [CrossRef]
  32. Mohotti, D.; Fernando, P.; Weerasinghe, D.; Remennikov, A. Evaluation of effectiveness of polymer coatings in reducing blast-induced deformation of steel plates. Def. Technol. 2021, 17, 1895–1904. [Google Scholar] [CrossRef]
  33. Woods, G. The ICI Polyurethanes Book, 2nd ed.; Wiley: New York, NY, USA, 1991; p. 362. [Google Scholar] [CrossRef]
  34. Companhia Siderúrgica Nacional. Aços Planos Laminados a Quente (Hot-Rolled Flat Steel Sheets). Available online: https://www.csn.com.br/homepage/acos-planos/laminados-a-quente/ (accessed on 3 April 2025).
  35. Preedawiphat, P.; Mahayotsanun, N.; Sa-ngoen, K.; Noipitak, M.; Tuengsook, P.; Sucharitpwatskul, S.; Dohda, K. Mechanical investigations of ASTM A36 welded steels with stainless steel cladding. Coatings 2020, 10, 844. [Google Scholar] [CrossRef]
  36. Cormie, D.; Geoff, M. Blast Effects on Buildings, 2nd ed.; Thomas Telford: London, UK, 2009. [Google Scholar]
  37. Celpan Industria e Comercio de Plásticos Ltda. Elastômeros Poliuretano—Peças Técnicas (Polyurethane Elastomer Technical Parts). Available online: https://www.celpan.com.br/plasticos/poliuretano/elastomeros-pecas-tecnicas/ (accessed on 3 April 2025).
  38. Usinas Siderúrgicas de Minas Gerais S.A., Laminados a Frio (Cold-Rolled Steel). Available online: https://www.usiminas.com/wp-content/uploads/2020/05/LAMINADOSFRIO-PORT.pdf (accessed on 3 April 2025).
  39. Augusto, A.S.; Urgessa, G.; Amorim, C.B.; Lopes Júnior, R.E.; Mendonça, F.B.; Rocco, J.A.F.F.; Iha, K. Experimental Characterization of Cast Explosive Charges Used in Studies of Blast Effects on Structures. CivilEng 2025, 6, 20. [Google Scholar] [CrossRef]
  40. Phantom. PHANTOM VEO 640/VEO 440 High-Speed Camera Datasheet; Phantom: Wayne, NJ, USA, 2024; p. 4. Available online: https://www.phantomhighspeed.com/products/cameras/veo/veo640 (accessed on 3 April 2025).
  41. Kingery, C.N.; Bulmash, G. Technical Report ARBRL TR-02555—Airblast Parameters from TNT Spherical Air Burst and Hemispherical Surface Burst; Aberdeen Proving Ground, Army Armament and Development Center, Ballistic Research Laboratory: Aberdeen Proving Ground, MD, USA, 1984. [Google Scholar]
  42. Jeremić, R.; Bajić, Z. An approach to determining the TNT equivalent of high explosives. Sci. Tech. Rev. 2006, 56, 58–62. Available online: http://www.vti.mod.gov.rs/ntp/rad2006/1-06/jere/jere.pdf (accessed on 3 April 2025).
  43. Kinney, G.F.; Graham, K.J. Explosive Shocks in Air, 2nd ed.; Springer Science+Business Media, LLC: New York, NY, USA, 1985; p. 269. [Google Scholar] [CrossRef]
  44. Mendonça, F.B.; Urgessa, G.S.; Domingues, M.G.; Iha, K.; Rocco, J.A.F.F. Efeitos do EPS na leitura de pico de pressão refletida em ensaio de campo com explosivo militar. Spectrum 2023, 24, 49–53. [Google Scholar] [CrossRef]
  45. Panowicz, R.; Konarzewski, M.; Trypolin, M. Analysis of criteria for determining a TNT equivalent. J. Mech. Eng. 2017, 63, 666–672. [Google Scholar] [CrossRef]
  46. Hyde, D.W. Conventional Weapons Effect (CONWEP)—Application of TM5-855-1; Department of the Army: Vicksburg, MS, USA, 1988; Available online: https://apps.dtic.mil/sti/pdfs/ADA195867.pdf (accessed on 3 April 2025).
  47. National Academies; Department of Homeland Security. IED Attack—Improvised Explosive Devices; Department of Homeland Security: Washington, DC, USA, 2009. Available online: https://www.dhs.gov/xlibrary/assets/prep_ied_fact_sheet.pdf (accessed on 3 April 2025).
  48. Rigby, S.E.; Knighton, R.; Clarke, S.D.; Tyas, A. Reflected near-field blast pressure measurements using high-speed video. Exp. Mech. 2020, 60, 875–888. [Google Scholar] [CrossRef]
  49. Tyas, A. Blast loading from high explosive detonation: What we know and don’t know. In Proceedings of the 13th International Conference on Shock and Impact Loads on Structures, Guangzhou, China, 14–15 December 2019. [Google Scholar]
  50. Tyas, A. Experimental measurement of pressure loading from near-field blast events: Techniques, findings and future challenges. Proceedings 2018, 2, 471. [Google Scholar] [CrossRef]
  51. Brown, D.; Christian, W.; Hanson, R.M. Tracker 6.2.0: Video Analysis and Modelling Tool. Available online: https://opensourcephysics.github.io/tracker-website/ (accessed on 3 April 2025).
  52. Rastogi, P.K. Photomechanics (Topics in Applied Physics); Springer: Berlin/Heidelberg, Germany, 2000. [Google Scholar] [CrossRef]
Figure 1. A36 steel sheet with no protection (a), two sanded steel sheets (b), a steel sheet with cured polyurethane elastomer applied (c), and a sandwich configuration with polyurethane elastomer and thin 1008 steel (d).
Applmech 06 00028 g001
Figure 2. Detailed layout of the resulting sheets, both unprotected and protected: (a) top view, (b) side view, and (c) detailed cut of the protection layers. Units not provided are in millimeters.
Applmech 06 00028 g002
Figure 3. Test layout (a) and photograph of a test site (b).
Applmech 06 00028 g003
Figure 4. Centering of the test site (a) and detail of the calibration marks (b).
Applmech 06 00028 g004
Figure 5. High-speed camera results analyzed using Tracker 6.2.0 across three frames for each of two example tests: Test 1B1 (ac) in the first row, and Test 1PU90_2 (df) in the second row. Time is measured from the moment of explosive detonation. At 0.5 ms (a,d), the view is obscured by the fireball; at 3.0 ms (b,e), the maximum displacement of the sheet is measurable. After 3.5 ms, the structure is struck by the reflected shock wave, causing an upward movement, as seen at 5.0 ms (c,f). The cyan lines represent the calibration measurements, the magenta lines indicate the coordinate system axes, and the red points track the central displacement of the steel sheet.
Applmech 06 00028 g005
Figure 6. (a) Deformation in a bare A36 steel sheet, still fixed to the test base, with a standoff distance of 500 mm. (b) Deformation in another steel sheet exposed to the blast at a 300 mm standoff distance, after being removed from the support.
Applmech 06 00028 g006
Figure 7. Steel sheets protected with different polyurethane elastomer configurations after the detonations, with a standoff distance of 500 mm (left column) and 300 mm (right column). The identification of each specimen corresponds to Table 3.
Applmech 06 00028 g007
Figure 8. Maximum displacement variation during the blast tests for 500 mm (a) and 300 mm (b) standoff distances. The error bars are indicated in red.
Applmech 06 00028 g008
Figure 9. Detachment of the 1008 steel thin sheet from the polyurethane layer occurred exclusively in the 300 mm standoff tests. The two sides of the 2 mm (a) and the 4 mm (b) polyurethane thick are presented.
Applmech 06 00028 g009
Table 1. Main characteristics of the ASTM A36 steel used.
ParameterUnitValue
Yield strengthMPa328
Tensile strengthMPa467
Dynamic yield strengthMPa394
Dynamic tensile strengthMPa490
Elongation (50 mm gauge)%27
Young’s Modulus GPa200
Poisson’s ratio-0.26
Densityg/cm37.85
Table 2. Main characteristics of the polyurethane elastomer used.
ParameterUnitTest Standard60 Shore A90 Shore A
HardnessShore AASTM D 22406090
Tensile strengthMPaASTM D 4121328
100% modulusMPaASTM D 412210
300% modulusMPaASTM D 412314
Elongation%ASTM D 412990475
Tear strengthkN/mASTM D 6243176
Permanent deformation%ASTM D 395 5040
Resilience (Bashore)%ASTM D 26323526
Abrasion resistancemm3DIN 535168045
Densityg/cm3ASTM D 7921.101.15
Table 3. List of all eighteen specimens after the application of the polyurethane (PU) elastomer.
ID CodeNominal ProtectionA36 Sheet MassPU MassPU
Thickness
1008 Sheet MassTotal Mass
(g)(g)(mm)(g)(g)
Used in 500 mm standoff distance blast tests
1B1Bare385600.003856
1B2Bare388100.003881
1B3Bare384500.003845
1PU90_22 mm of PU Shore 9038714162.104287
1PU90_44 mm of PU Shore 9038368234.104658
1PU90_66 mm of PU Shore 90388212266.205108
1PU60_44 mm of PU Shore 6038498094.304658
1SAN_22 mm of PU 90 + 1008 sheet38134162.18045033
1SAN_44 mm of PU 90 + 1008 sheet38367253.78035364
Used in 300 mm standoff distance blast tests
2B1Bare387100.003871
2B2Bare380800.003808
2B3Bare386800.003868
2PU90_22 mm of PU Shore 9038764162.104292
2PU90_44 mm of PU Shore 9038148294.204643
2PU90_66 mm of PU Shore 90384011755.905015
2PU60_44 mm of PU Shore 6038198224.304641
2SAN_22 mm of PU 90 + 1008 sheet38503831.98035036
2SAN_44 mm of PU 90 + 1008 sheet38197723.98045395
Note: The scale used to assess the masses had a precision of 1 g, while the caliper used to measure the thickness had a precision of 0.1 mm.
Table 4. Comparing the blast tests with real-world detonation events.
ChargeTNT Equiv.Dist.Scaled Dist.P 1Ref. 2
(kg)(m)(m/kg 1/3)(bar)
Test 334 g Comp B0.430.500.662422.54[45]
Hand grenade0.100.300.646323.69[46]
Explosive vest bomb9.001.380.663422.47[47]
Parcel bomb23.001.890.664622.39[47]
Airdropped 230 kg bomb99.003.070.663622.46[46]
Car bomb226.004.040.663322.48[47]
Airdropped 920 kg bomb429.005.010.664322.41[46]
Van bomb1815.008.010.656722.94[47]
Test 334 g Comp B0.430.300.397558.06[45]
Hand grenade0.100.180.397558.06[46]
Explosive vest bomb9.000.830.399057.69[47]
Parcel bomb23.001.130.397358.09[47]
Airdropped 230 kg bomb99.001.840.397757.99[46]
Car bomb226.002.420.397358.10[47]
Airdropped 920 kg bomb429.003.000.397857.99[46]
Van bomb1815.004.850.397658.03[47]
1—Peak overpressure considering free air blast and Kingery and Bulmash [41]. 2—Reference for the TNT equivalence.
Table 5. Uncertainties in Displacement Measurement.
Main ParametersUncertainties
LfDPixelParallaxResolutionCalibrationTotal 1
(mm)(mm)(mm)(mm)(mm)(mm)(mm)(mm)
45,000200550.83±0.2±0.4±0.1±0.5
1—Calculated as the root sum of squares of each independent uncertainty.
Table 6. Measured maximum displacement during the tests and reduction due to the use of polyurethane (PU) elastomer.
ID CodeProtection UsedMaximum
Displacement
Max Displacement Reduction 1Percentual
Reduction 1
(mm)(mm)(%)
500 mm standoff distance tests
1B1Bare51.2 ± 0.50.8 ± 0.71 ± 1%
1B2Bare52.5 ± 0.50.6 ± 0.71 ± 1%
1B3Bare52.0 ± 0.50.1 ± 0.70 ± 1%
Average1 2Bare Average51.9 ± 0.50.0 ± 0.70 ± 1%
1PU90_22 mm of PU Shore 9047.6 ± 0.54.3 ± 0.78 ± 1%
1PU90_44 mm of PU Shore 90Not visible
1PU90_66 mm of PU Shore 9044.0 ± 0.57.9 ± 0.715 ± 1%
1PU60_44 mm of PU Shore 6046.1 ± 0.55.8 ± 0.711 ± 1%
1SAN_22 mm of PU 90 + 1008 sheet44.7 ± 0.57.2 ± 0.714 ± 1%
1SAN_44 mm of PU 90 + 1008 sheet41.6 ± 0.510.3 ± 0.720 ± 1%
300 mm standoff distance tests
2B1Bare66.0 ± 0.50.2 ± 0.70 ± 1%
2B2Bare65.6 ± 0.50.3 ± 0.70 ± 1%
2B3Bare65.9 ± 0.50.1 ± 0.70 ± 1%
Average2 2Bare Average65.8 ± 0.50.0 ± 0.70 ± 1%
2PU90_22 mm of PU Shore 9063.2 ± 0.52.6 ± 0.74 ± 1%
2PU90_44 mm of PU Shore 9060.8 ± 0.55.1 ± 0.78 ± 1%
2PU90_66 mm of PU Shore 9059.4 ± 0.56.4 ± 0.710 ± 1%
2PU60_44 mm of PU Shore 6065.5 ± 0.50.4 ± 0.71 ± 1%
2SAN_22 mm of PU 90 + 1008 sheet61.4 ± 0.54.5 ± 0.77 ± 1%
2SAN_44 mm of PU 90 + 1008 sheet60.9 ± 0.54.9 ± 0.77 ± 1%
1—Compared with the bare average max displacement. 2—Not a test but the average value of the three bare tests.
Disclaimer/Publisher’s Note: The statements, opinions and data contained in all publications are solely those of the individual author(s) and contributor(s) and not of MDPI and/or the editor(s). MDPI and/or the editor(s) disclaim responsibility for any injury to people or property resulting from any ideas, methods, instructions or products referred to in the content.