Article

Aberrometric, Geometrical, and Biomechanical Characterization of Sound-Induced Vibrational Modes of the Living Human Cornea

by
Francisco J. Ávila
1,*,
Óscar del Barco
2,
Maria Concepción Marcellán
1 and
Laura Remón
1
1
Departamento de Física Aplicada, Facultad de Ciencias, Universidad de Zaragoza, 50009 Zaragoza, Spain
2
Laboratorio de Óptica, Instituto Universitario de Investigación en Óptica y Nanofísica, Universidad de Murcia, 30100 Murcia, Spain
*
Author to whom correspondence should be addressed.
Optics 2025, 6(1), 5; https://doi.org/10.3390/opt6010005
Submission received: 10 December 2024 / Revised: 24 January 2025 / Accepted: 3 February 2025 / Published: 5 February 2025
(This article belongs to the Section Biomedical Optics)

Abstract

:
Repeatable and reliable assessment of corneal biomechanics with spatial resolution remains a challenge. Vibrational Optical Computerized Tomography (V-OCT), based on sound-wave elastography, has made it possible to investigate the natural resonant modes of the cornea and obtain the elastic moduli non-invasively. This pilot study presents a characterization of four corneal vibrational modes from aberrometric, geometrical, and biomechanical approaches in the living human cornea of five healthy volunteers by combining a corneal sound-wave generator, dual Placido–Scheimpflug corneal imaging, and the Ocular Response Analyzer (ORA) devices. Sound-induced corneal wavefront aberration maps were reconstructed as a function of sound frequency and isolated from the natural state. While maps of low-order aberrations (LOA) revealed symmetric geometrical patterns, those corresponding to high-order aberrations (HOA) showed complex non-symmetric patterns. Corneal geometry was evaluated by reconstructing corneal elevation maps through biconical fitting, and the elastic and viscous components were calculated by applying the standard linear solid model to the ORA measurements. The results showed that sound-wave modulation can increase high-order corneal aberrations significantly. Two frequencies rendered the corneal shape more prolate (50 Hz) and oblate (150 Hz) with respect to the baseline, respectively. Finally, both the elastic and viscous properties are sensitive to sound-induced vibrational modes, which can also modulate the corneal stress-strain response. The cornea exhibits natural resonant modes influenced by its optical, structural, and biomechanical properties.

1. Introduction

Ocular biomechanics focuses on the dynamic response the cornea when an external stress is applied [1]. This response, typically measured through air-puff corneal deformation, reflects the cornea’s elastic and viscoelastic properties [1,2]. The cornea’s intrinsic biomechanical characteristics are determined by its extracellular matrix (corneal stroma), which ensures optical transparency, mechanical stability, and tissue shape [3]. Factors such as hydration levels [4], environmental conditions, metabolic influences [5], and age [6] can alter these properties. Pathological and external factors, including increased intraocular pressure (IOP) [7], contact lens wear [8], laser refractive surgery [9], or diseases like keratoconus [10], glaucoma [11], and corneal ectasia [12,13], can further disrupt the biomechanical stability of the cornea.
Given the critical role of corneal biomechanics in ocular health, various tools have been developed to assess these properties. Among the most widely used are the Ocular Response Analyzer (ORA; Reichert Technologies) and the Oculus Corvis ST (OCULUS Optikgeräte GmbH), both of which employ non-contact air-puff tonometry. The ORA measures corneal viscoelasticity [14,15] through corneal hysteresis (CH), a parameter that has been extensively studied as a biomarker for glaucoma [16,17], Fuchs’ dystrophy [18], and biomechanical changes in keratoconus and post-LASIK patients [19]. Meanwhile, the Corvis ST combines tonometry with high-speed Scheimpflug imaging, offering dynamic parameters that have been applied to studying keratoconus [20,21], orthokeratology [22], dry eye [23], and myopia-related biomechanical alterations [24].
Although these devices provide rapid assessments, they do not directly measure intrinsic biomechanical properties. Computational modeling, such as the viscoelastic models proposed by Glass et al. [25], has been employed to infer these properties from the devices’ measurements. Recently, our group proposed a methodology based on ORA measurements and the standard linear solid model to derive distinct analytical expressions for elastic and time-dependent biomechanical parameters, including retardation time and viscosity [26].
Emerging technologies, like elastography imaging, have also gained prominence in biomechanics. Optical Coherence Elastography (OCE) provides spatially resolved measurements of the elastic modulus by analyzing the propagation of mechanical shear waves [27,28,29]. However, these measurements can be influenced by factors like corneal curvature, thickness [30], intraocular pressure [31], and even systemic variables such as heartbeat and respiration [32], potentially leading to inaccuracies.
This study aims to build on this foundation by investigating the biomechanical response of the living human cornea under acoustic stimulation. Specifically, we seek to characterize changes in wavefront aberrometry, corneal geometry, and stress-strain responses across four vibrational frequency modes (50, 150, 250, and 350 Hz). By integrating these findings, this work provides new insights into the dynamic behavior of corneal biomechanics, offering potential advancements in the diagnosis and treatment of biomechanical disorders.

2. Materials and Methods

2.1. Subjects

Five healthy Caucasian participants (35 ± 10 years old) were recruited to participate in the study. Measurements were performed at the Vision Sciences Laboratory of the University of Zaragoza (Zaragoza, Spain). Exclusion criteria included elevated intraocular pressure (IOP), glaucoma, contact lens wearers, and patients undergoing refractive surgery or corneal complications that could alter measurements results. Demographic information is shown in Table 1.
The present study was conducted in accordance with the Declaration of Helsinki and approved by the Ethics Committee of the Health Sciences Institute of Aragon, Spain (protocol code: C.P.-C.I. PI20/377; date of approval: 14 July 2020).

2.2. Experimental Measurements

A corneal acoustic wave generator [33] was used to obtain geometric, biomechanical, and total corneal wavefronts for four different sound frequencies from a sine wave signal applied at a maximum pressure of 90 dB. These sound frequencies were 50, 150, 250, and 350 Hz. Commercial dual Placido–Scheimpflug imaging (Galilei G2; Ziemer Ophthalmic Systems AG, Port, Switzerland) and the Ocular Response Analyzer (ORA, Reichert Instruments, Depew, NY, USA) devices were used to obtain the data summarized in Table 2.

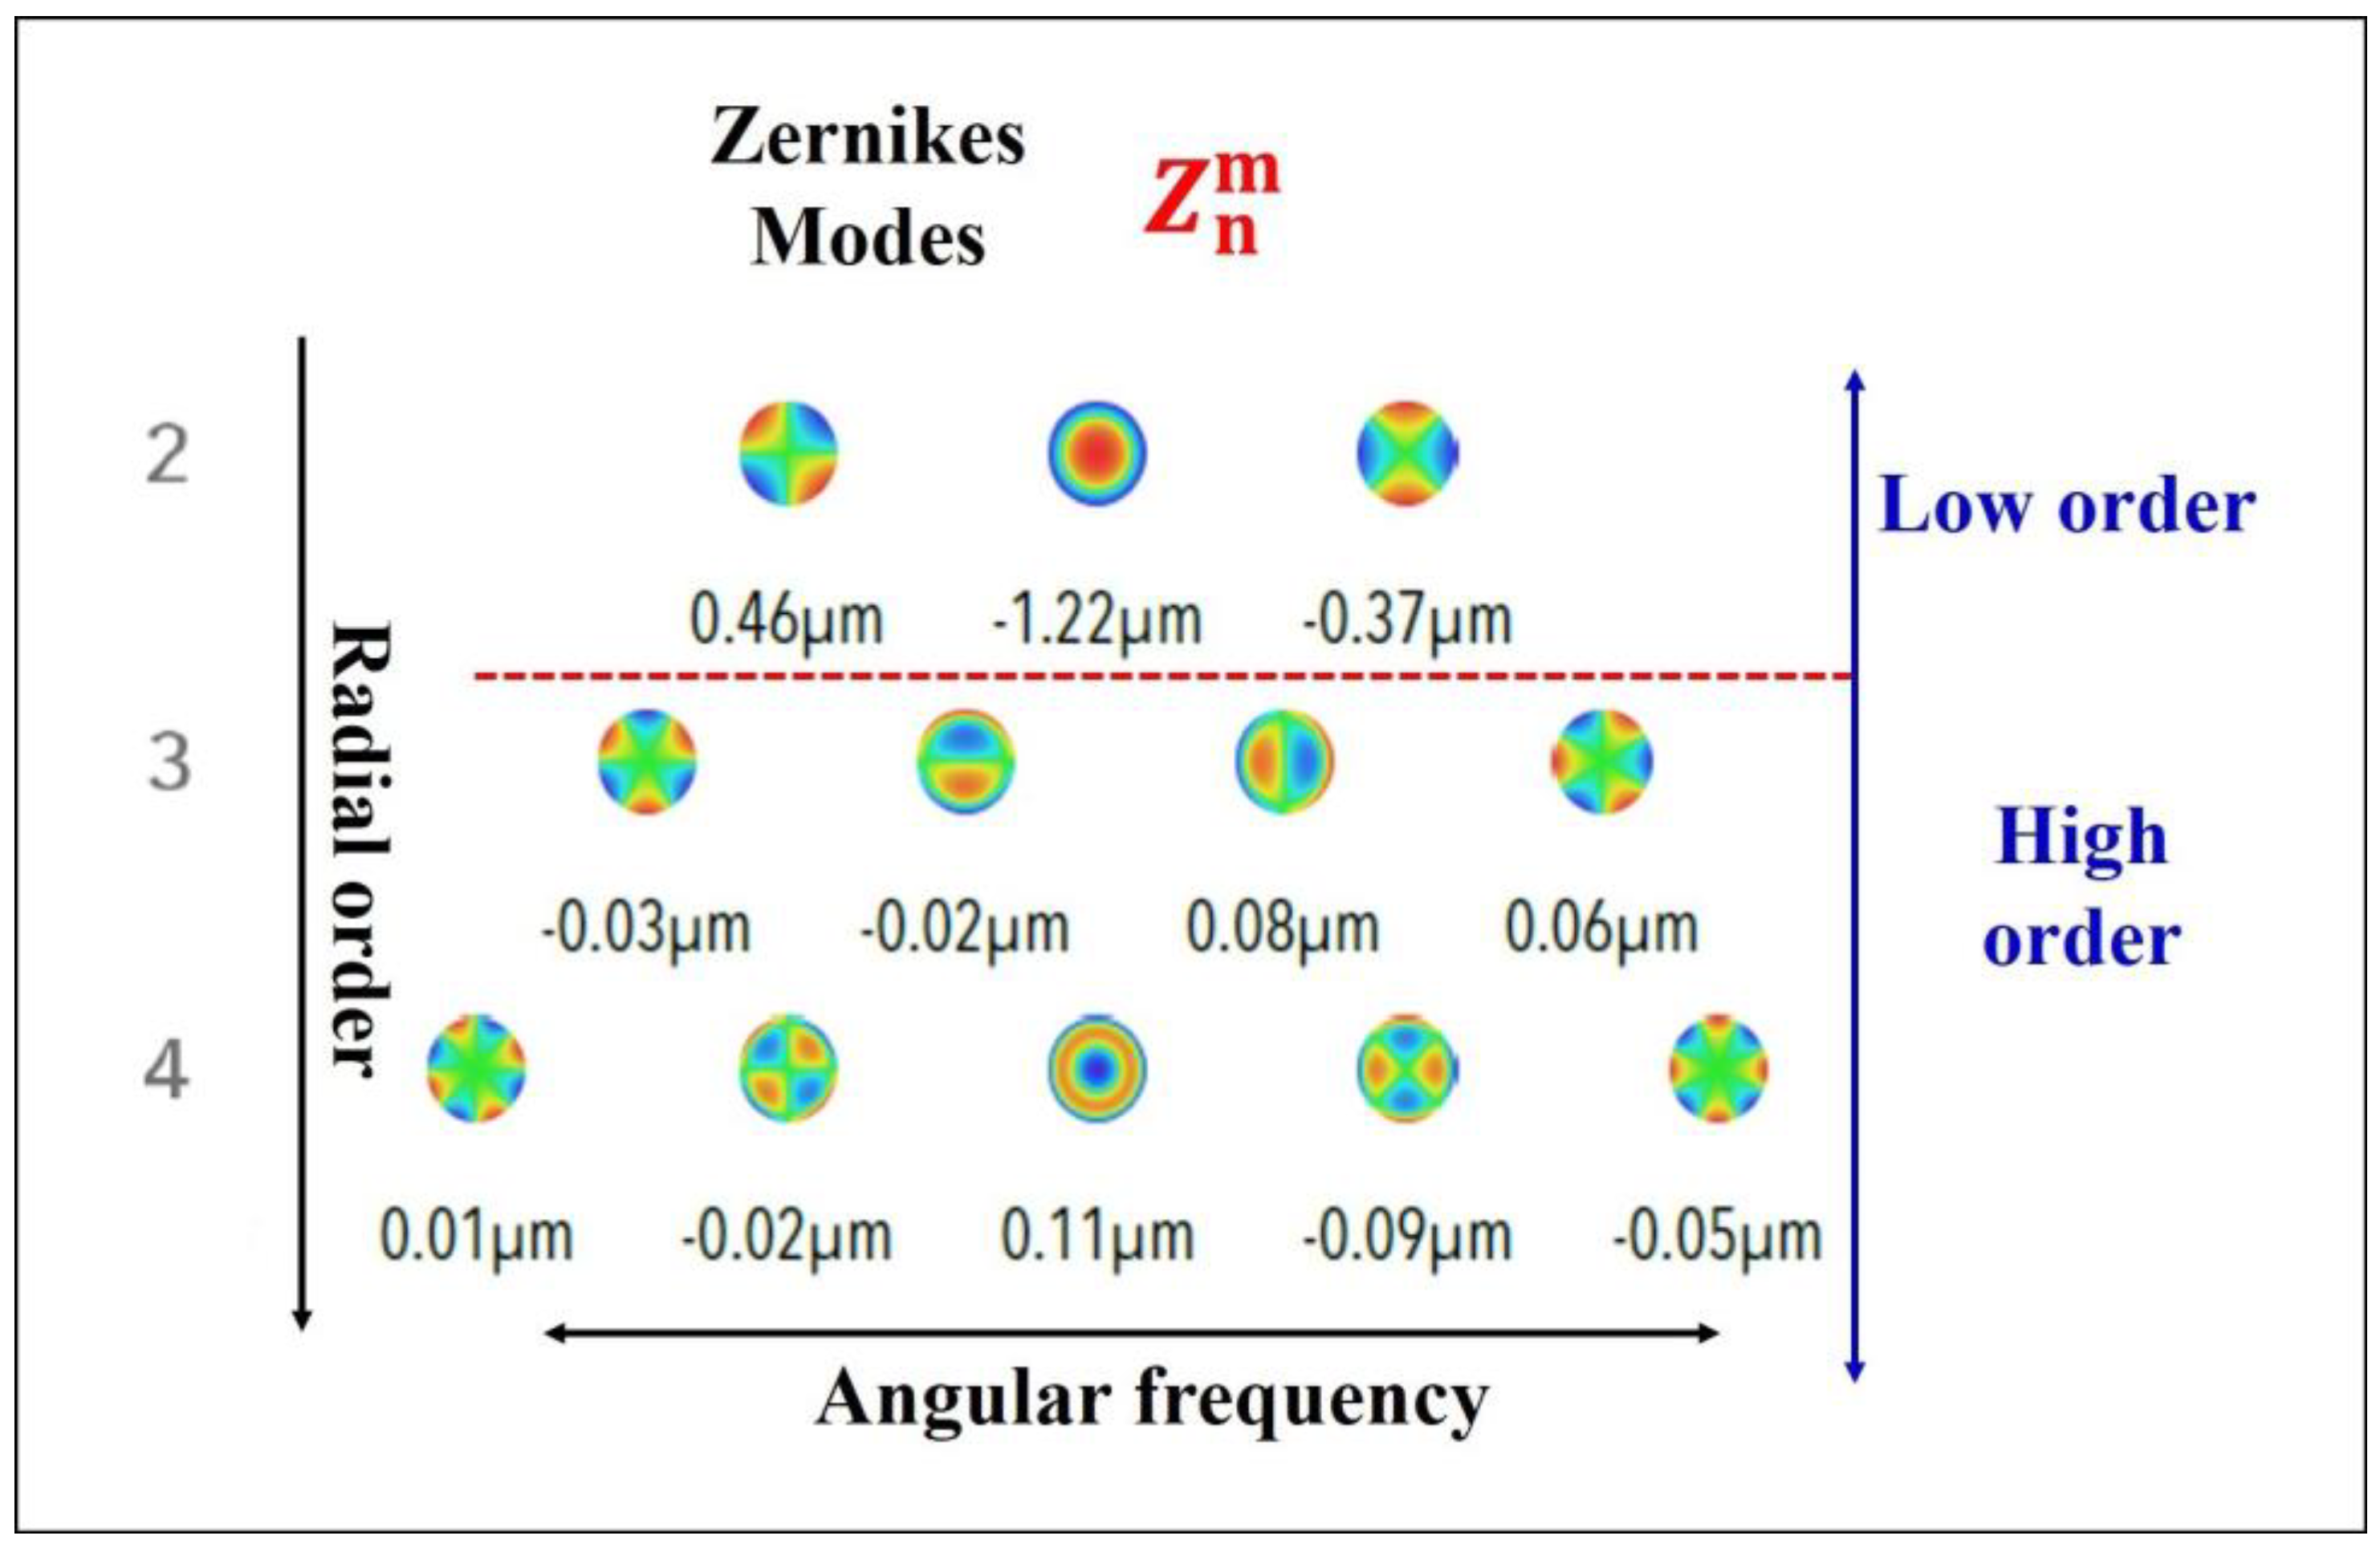
2.3. Wavefront Analysis

Corneal Zernike coefficients were obtained from the Galilei G2 measurements for 6 mm of corneal zone (aperture), and those mode number were used to reconstruct wavefront aberration (WA) maps as a function of sound frequency using Equation (1).
W A ρ , θ = n = 0 m = n n   c n m × Z n m ρ , θ
Equation (1) represents the corneal wavefront aberration in the Zernike polynomial expansion according to the Optical Society of America (OSA) standards [34]. Here,   Z n m and c n m and are the Zernike modes and coefficients, respectively. The subscript n and superscript m correspond to the radial order and angular frequency. Figure 1 shows a representation of the Zernikes modes provided by the Galilei G2 device.
The root mean square (RMS) metric was used to numerically compare the influence of sound waves on corneal WA, calculated as follows:
R M S = j = 3 14 c j 2
where j = n n + 2 + m 2 . Then, the RMS was calculated for low-order and high-order aberrations (LOA and HOA, respectively).

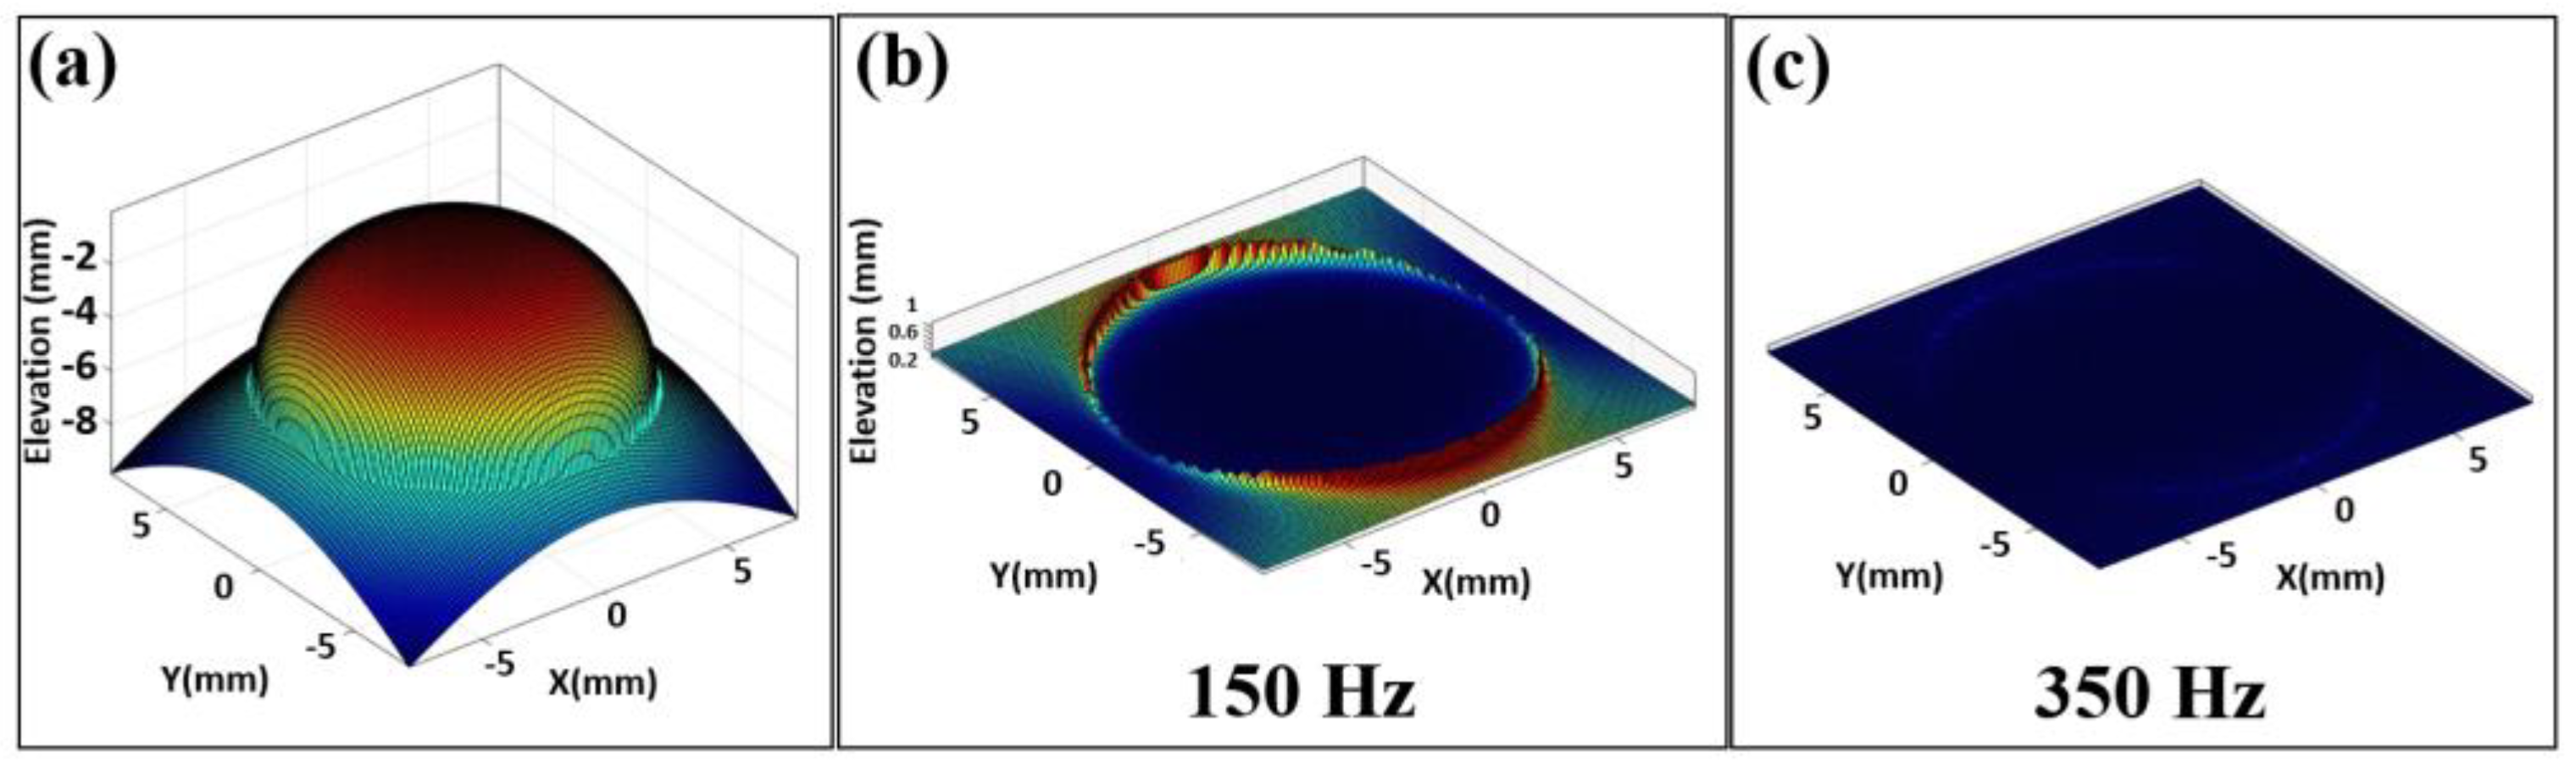
2.4. Corneal Surface Reconstruction

The geometrical information provided by the Galilei device (i.e., the Q-factor and radii of curvature) was employed to reconstruct the corneal surfaces for each sound frequency using the equation of the sagittal curve for a biconic surface, that can be expressed in Cartesian coordinates, as in [35]:
z x , y = x 2 R x + y 2 R y 1 + 1 1 + Q x x 2 R x 1 + Q y y 2 R y
Here, Rx, Ry, Qx, and Qy are the radii of curvature (i.e., flat and steep principal corneal meridians) and conic constants of the cornea. Equation (3) allows for fitting the cornea to a biconic surface, from which the mean corneal elevation is calculated and analyzed in Section 3.2.

2.5. Biomechanical Model

The ORA device was employed to extract the parameters required to calculate the elastic and time-dependent parameters (i.e., corneal retardation time and viscous component) of the cornea, as reported in [26]. The elasticity, retardation time, and viscosity were employed to simulate creep-relaxation tests as a function of sound frequency in Section 3.3.

2.6. Statistical Analysis and Image Reconstruction Processing

A statistical analysis was applied to aberrometric data to explore differences in the mean values among the different sound frequencies. Basically, the analysis consisted of performing the Shapiro–Wilk test to check the normality of the data and then the One-Way Repeated Measures Analysis of Variance (One-Way RM ANOVA). Graphical representations and statistics were carried out in Origin Lab v.13 software (OriginPro 2024, Origin Lab Corp., Northampton, MA, USA). Wavefront aberration maps and corneal surface reconstructions were carried out using custom-written scripts in Matlab2019b (the MathWorks Inc., Natick, MA, USA).

3. Results

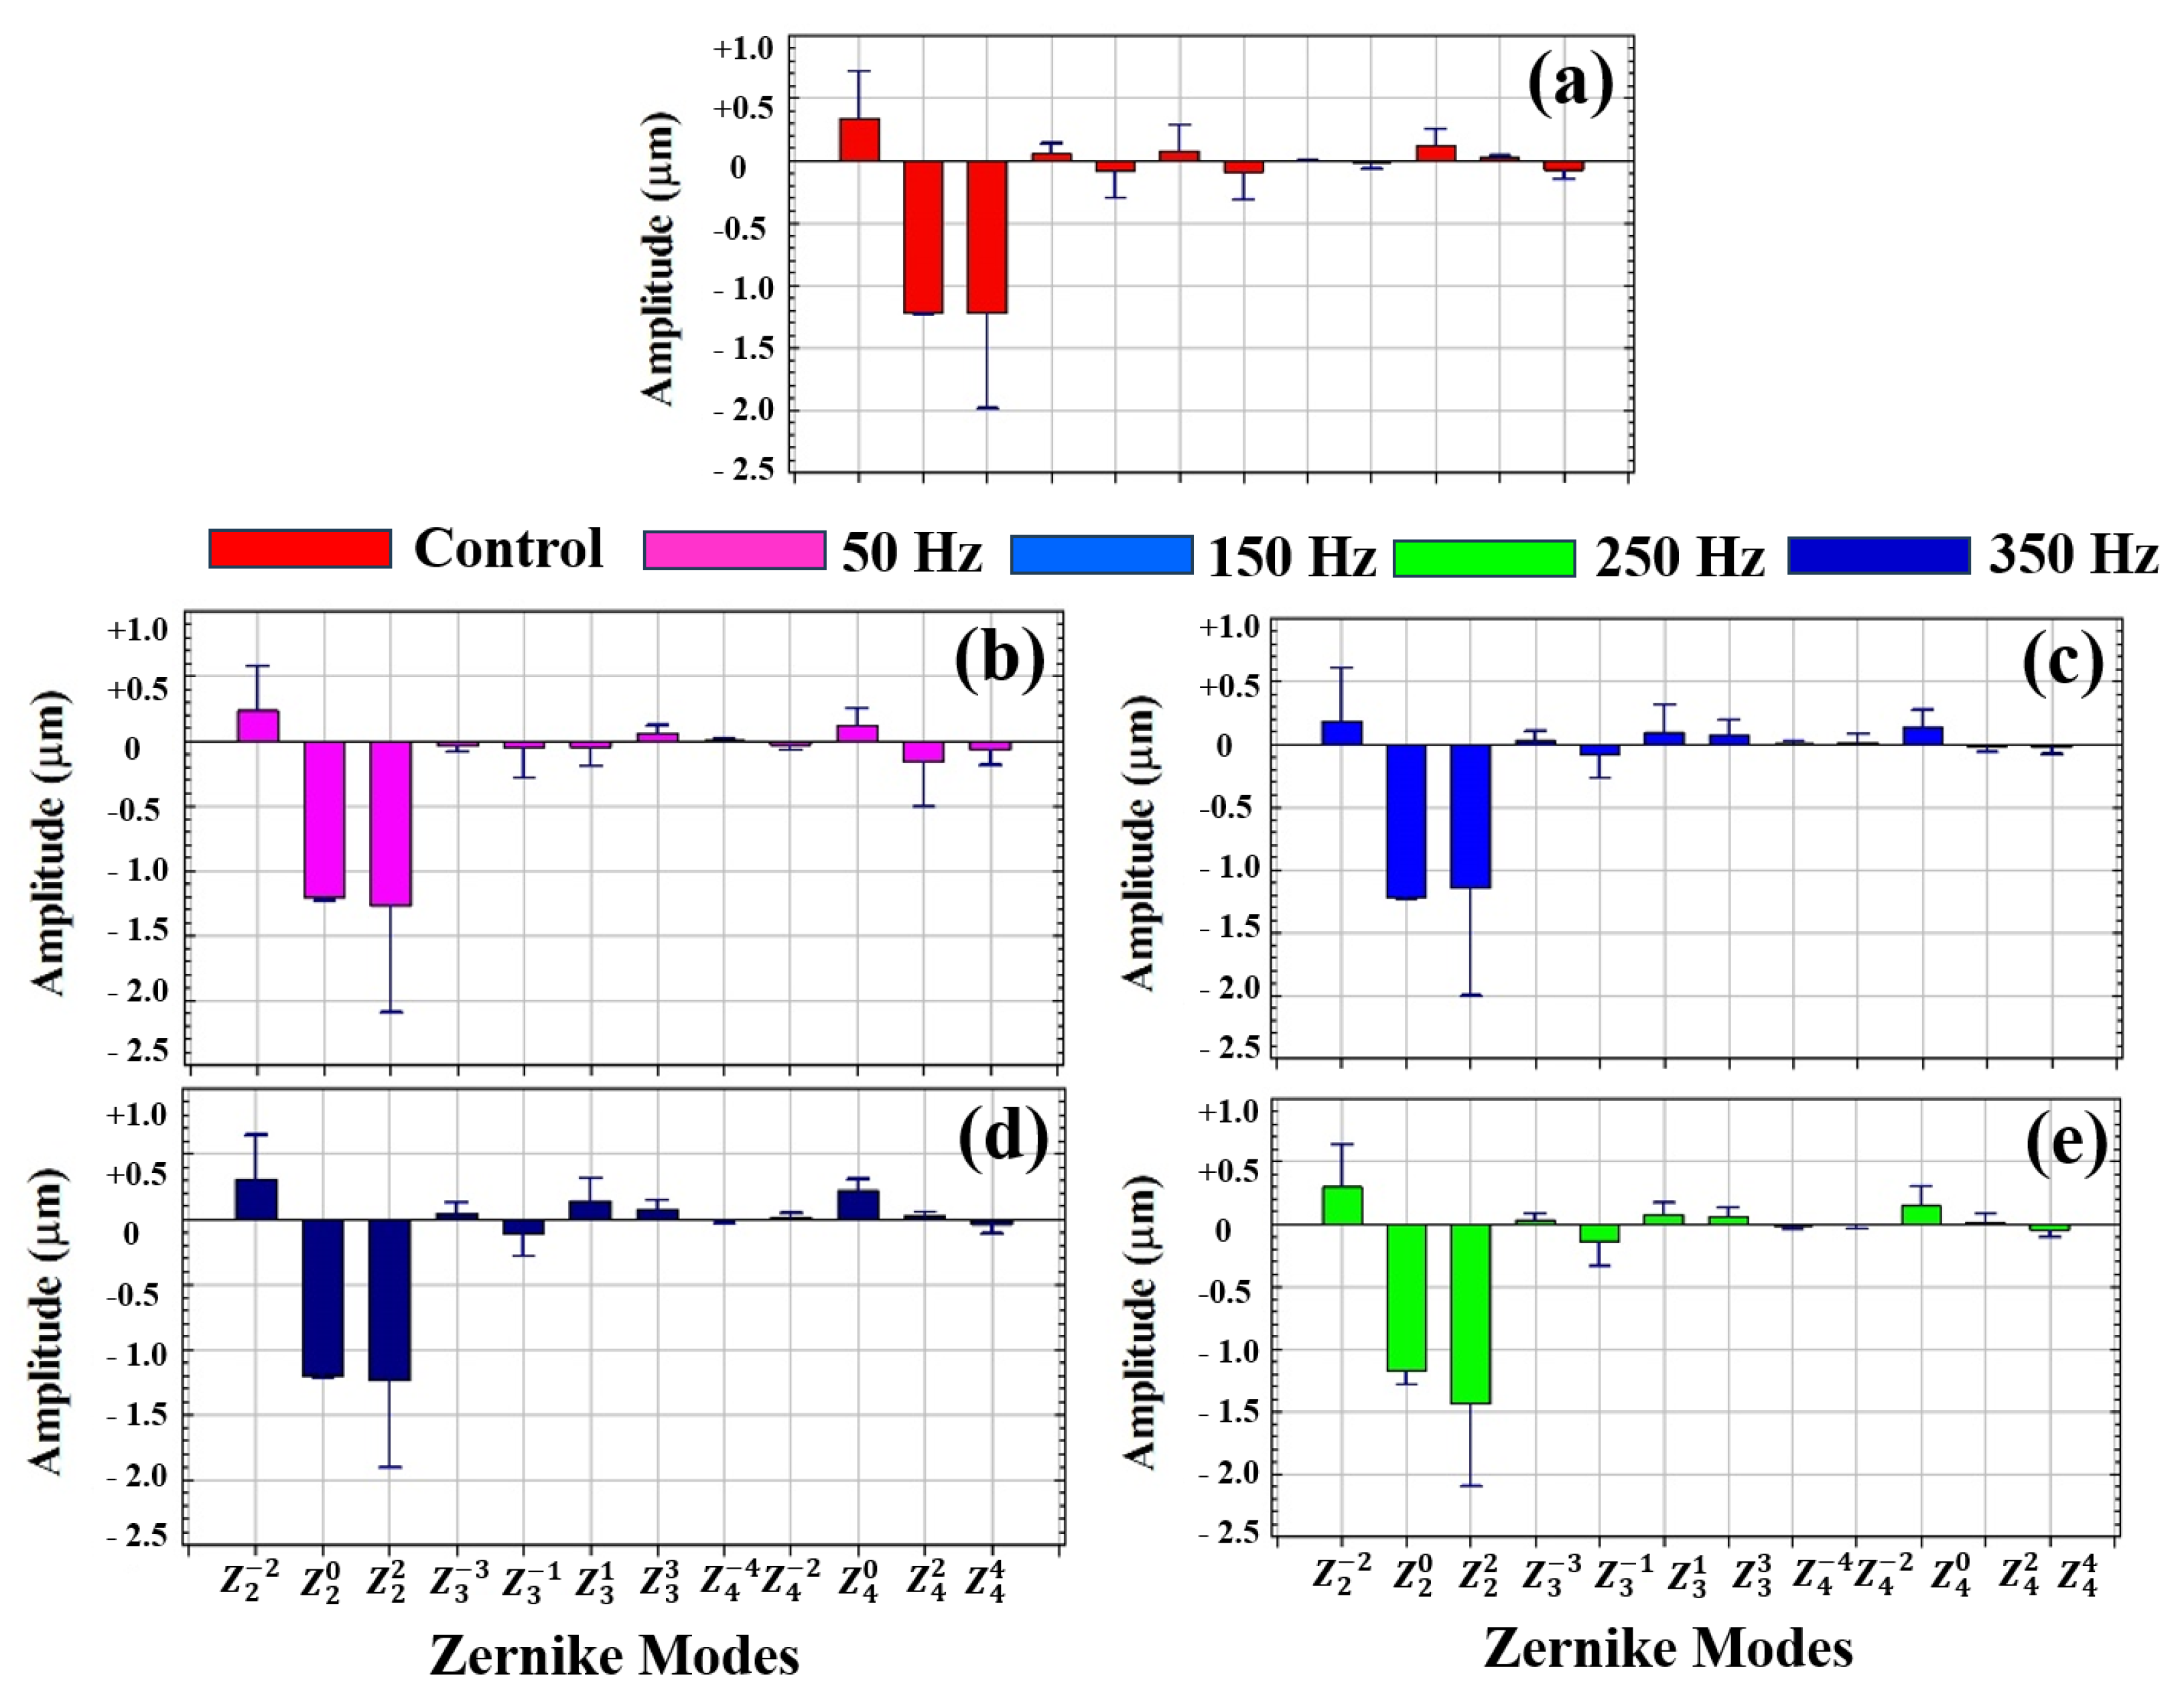
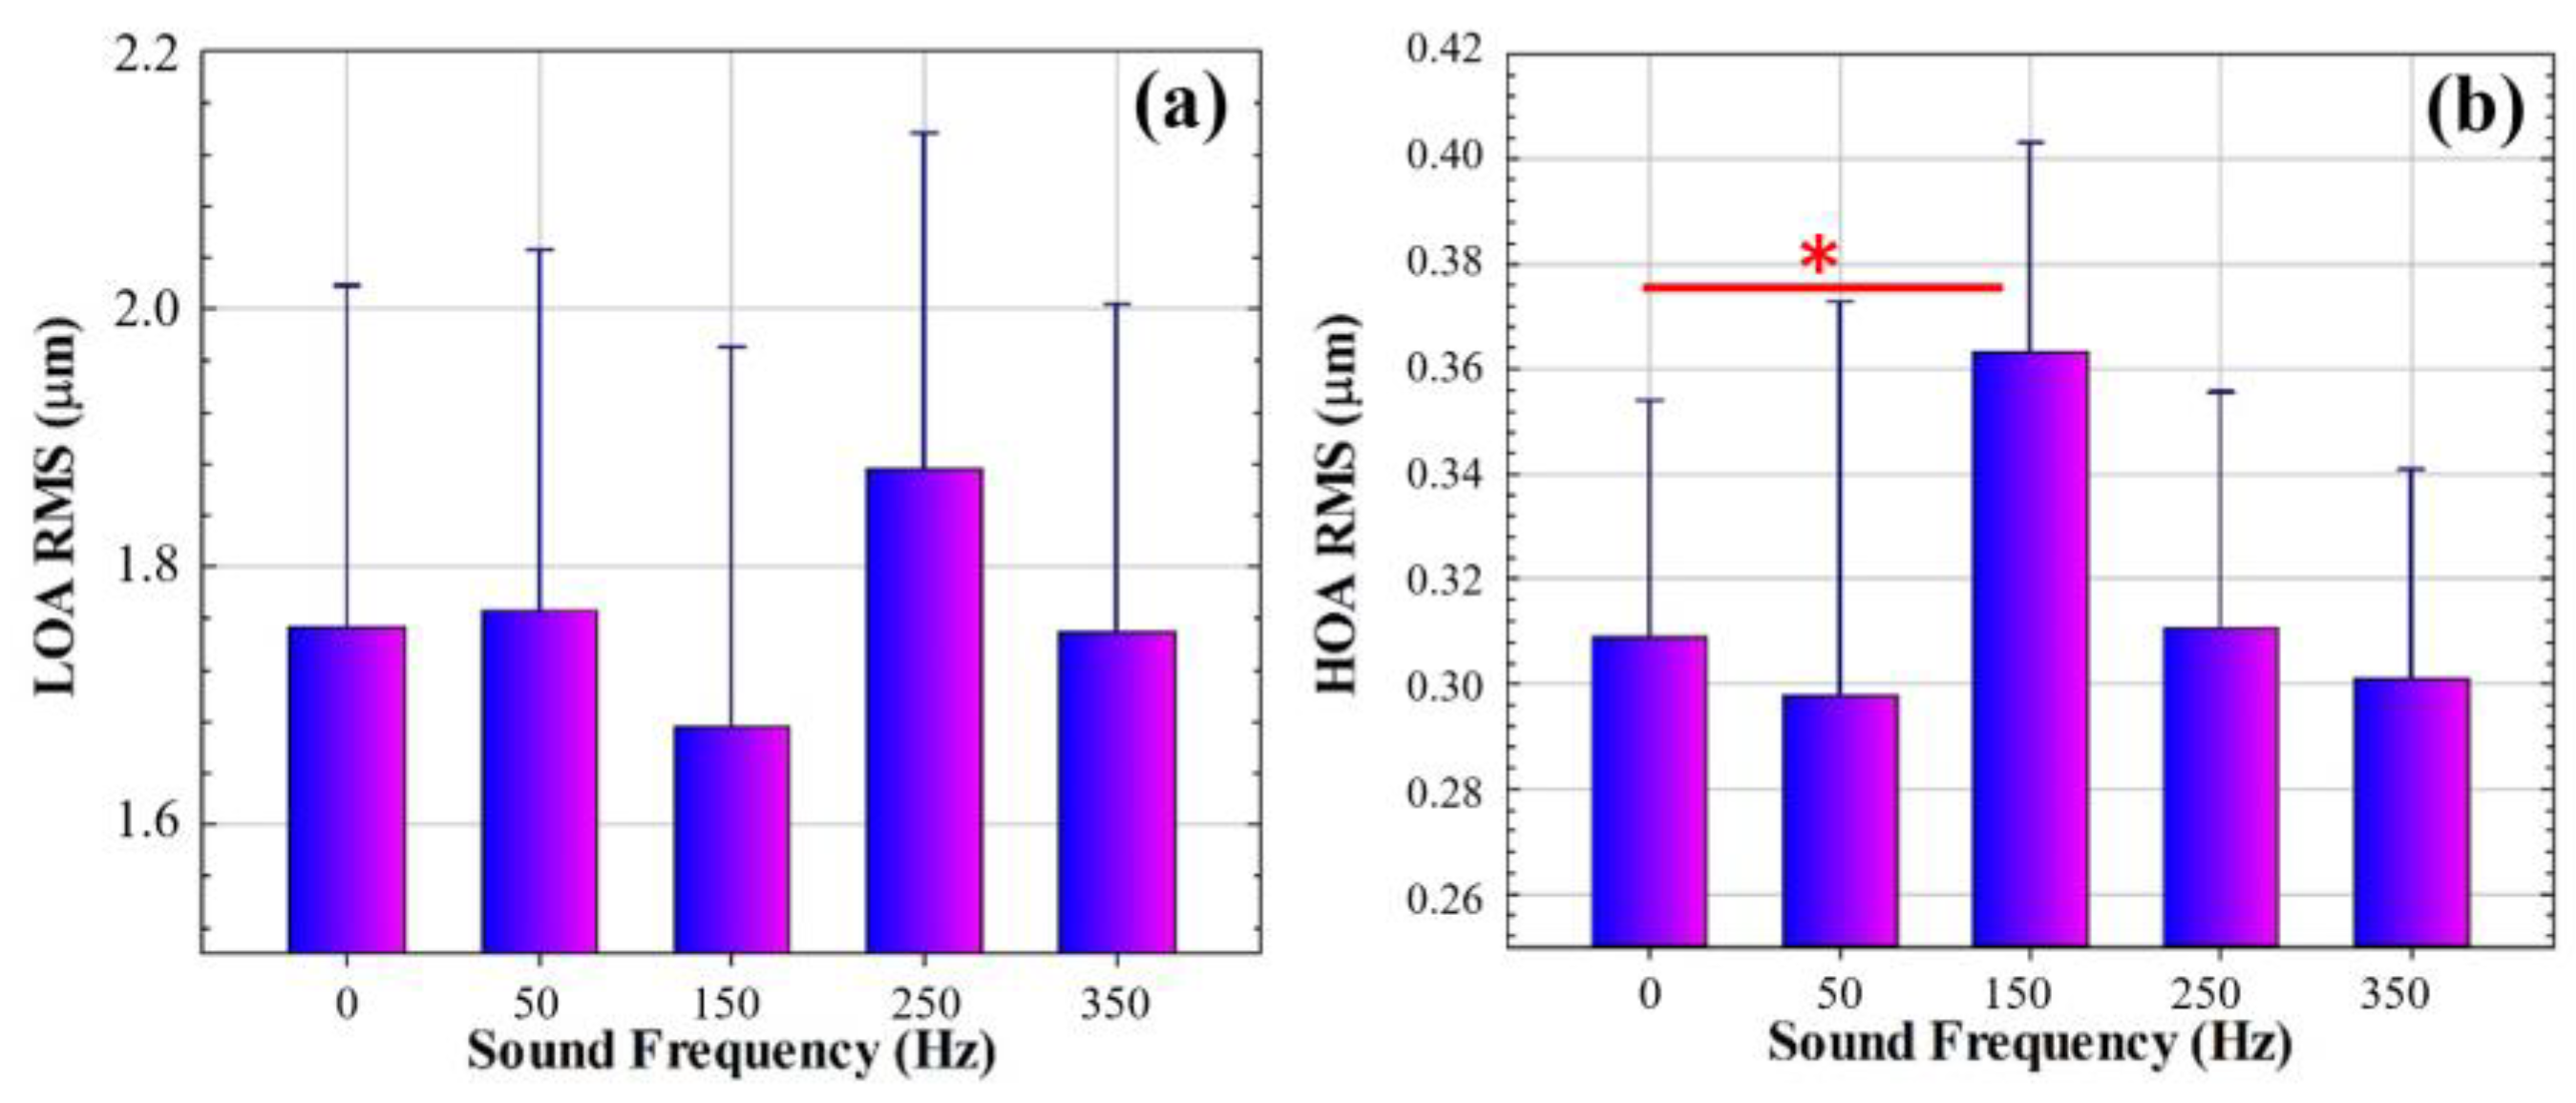
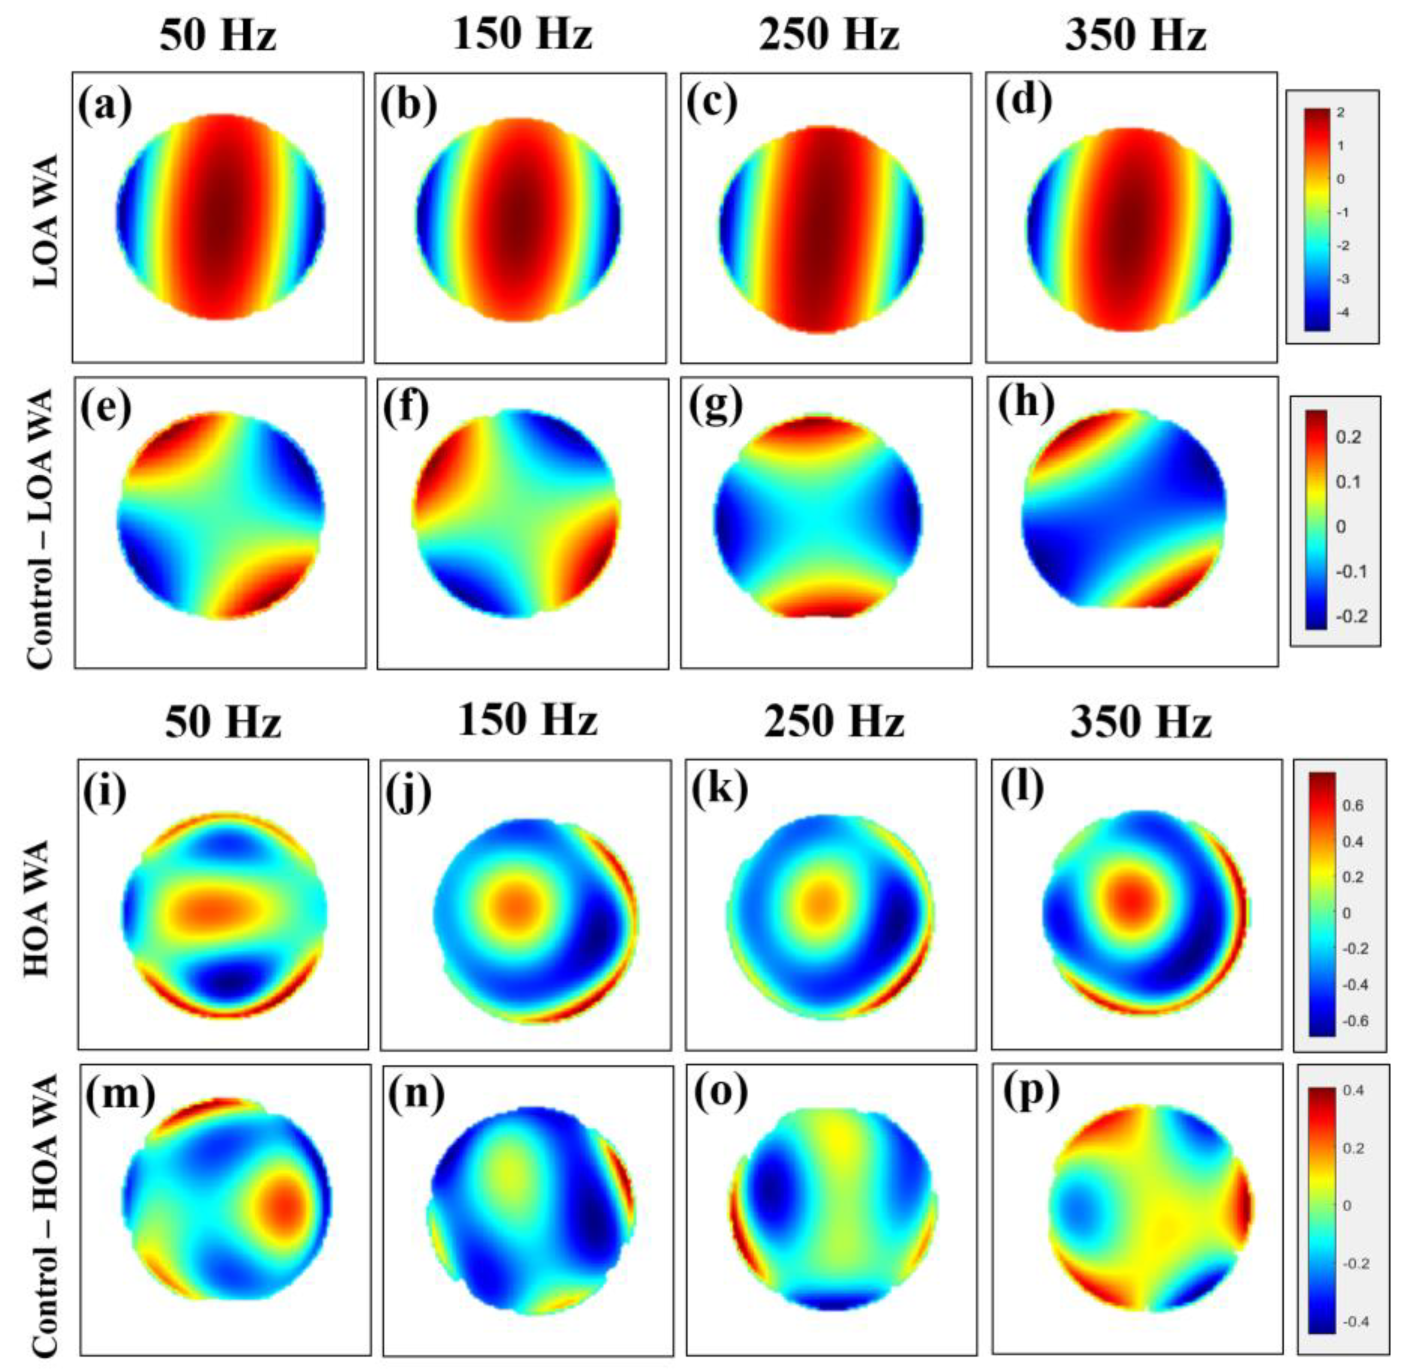
3.1. Wavefront Aberrometry

Figure 2 shows the averaged amplitude values (i.e., the mean of the five participants) of the Zernike coefficients of the corneal WA for the relaxed state (Figure 2a) and for different sound-wave frequencies (Figure 2b–e). The data show how different sound frequencies modulate each individual Zernike coefficient in terms of low and high aberration. Figure 3 shows the low- and high-order aberration root mean square (LOA and HOA RMS, respectively) values as a function of sound frequency. The maximum WA deviations differ for LOA and HOA: while for 250 Hz LOA increases by up to 11.98% (Figure 3a) with respect to the relaxed state (i.e., when the sound-wave generator is off), the maximum RMS variation occurs at 150 Hz for HOA (Figure 3b). Furthermore, this observed increase in the RMS value of 21.92% was found to be significantly higher (one-way Anova test, p = 0.039) than the reference (control) RMS value. Although RMS modulation as a function of sound frequency was observed in both LOA and HOA, no significant differences were found between the rest of the values represented.
To complete the WA description, Figure 4 shows the reconstructed wavefront aberration maps for LOA and HOA as a function of sound frequency. The first and third rows show the original WA map for LOA and HOA, respectively. To highlight the induced effects by sound waves, the second and fourth rows show the WA maps with subtracted control aberrometric data (‘control–LOA WA’ and ‘control–HOA WA’, respectively). It can be observed how WA LOA maps show symmetric geometric patterns, while the HOA maps show complex irregular patterns.
The wavefront results showed that, although sound-induced mechanical vibrations can modulate the low-order aberration (LOA) terms, none of the sound frequencies induced a significant variation in these terms. On the contrary, the frequency of 150 Hz induced a significant increase in corneal high-order aberrations (HOA) with respect to the baseline corneal values. Reconstruction of the wavefront aberration maps allowed visualization of the formation of regular patterns in LOA (Figure 4), while for HOA, complex and asymmetric WA maps were observed. These patterns suggest localized biomechanical responses influenced by collagen fiber distribution and corneal viscoelasticity, as corroborated by Crespo et al. [36] and Silver et al. [37].

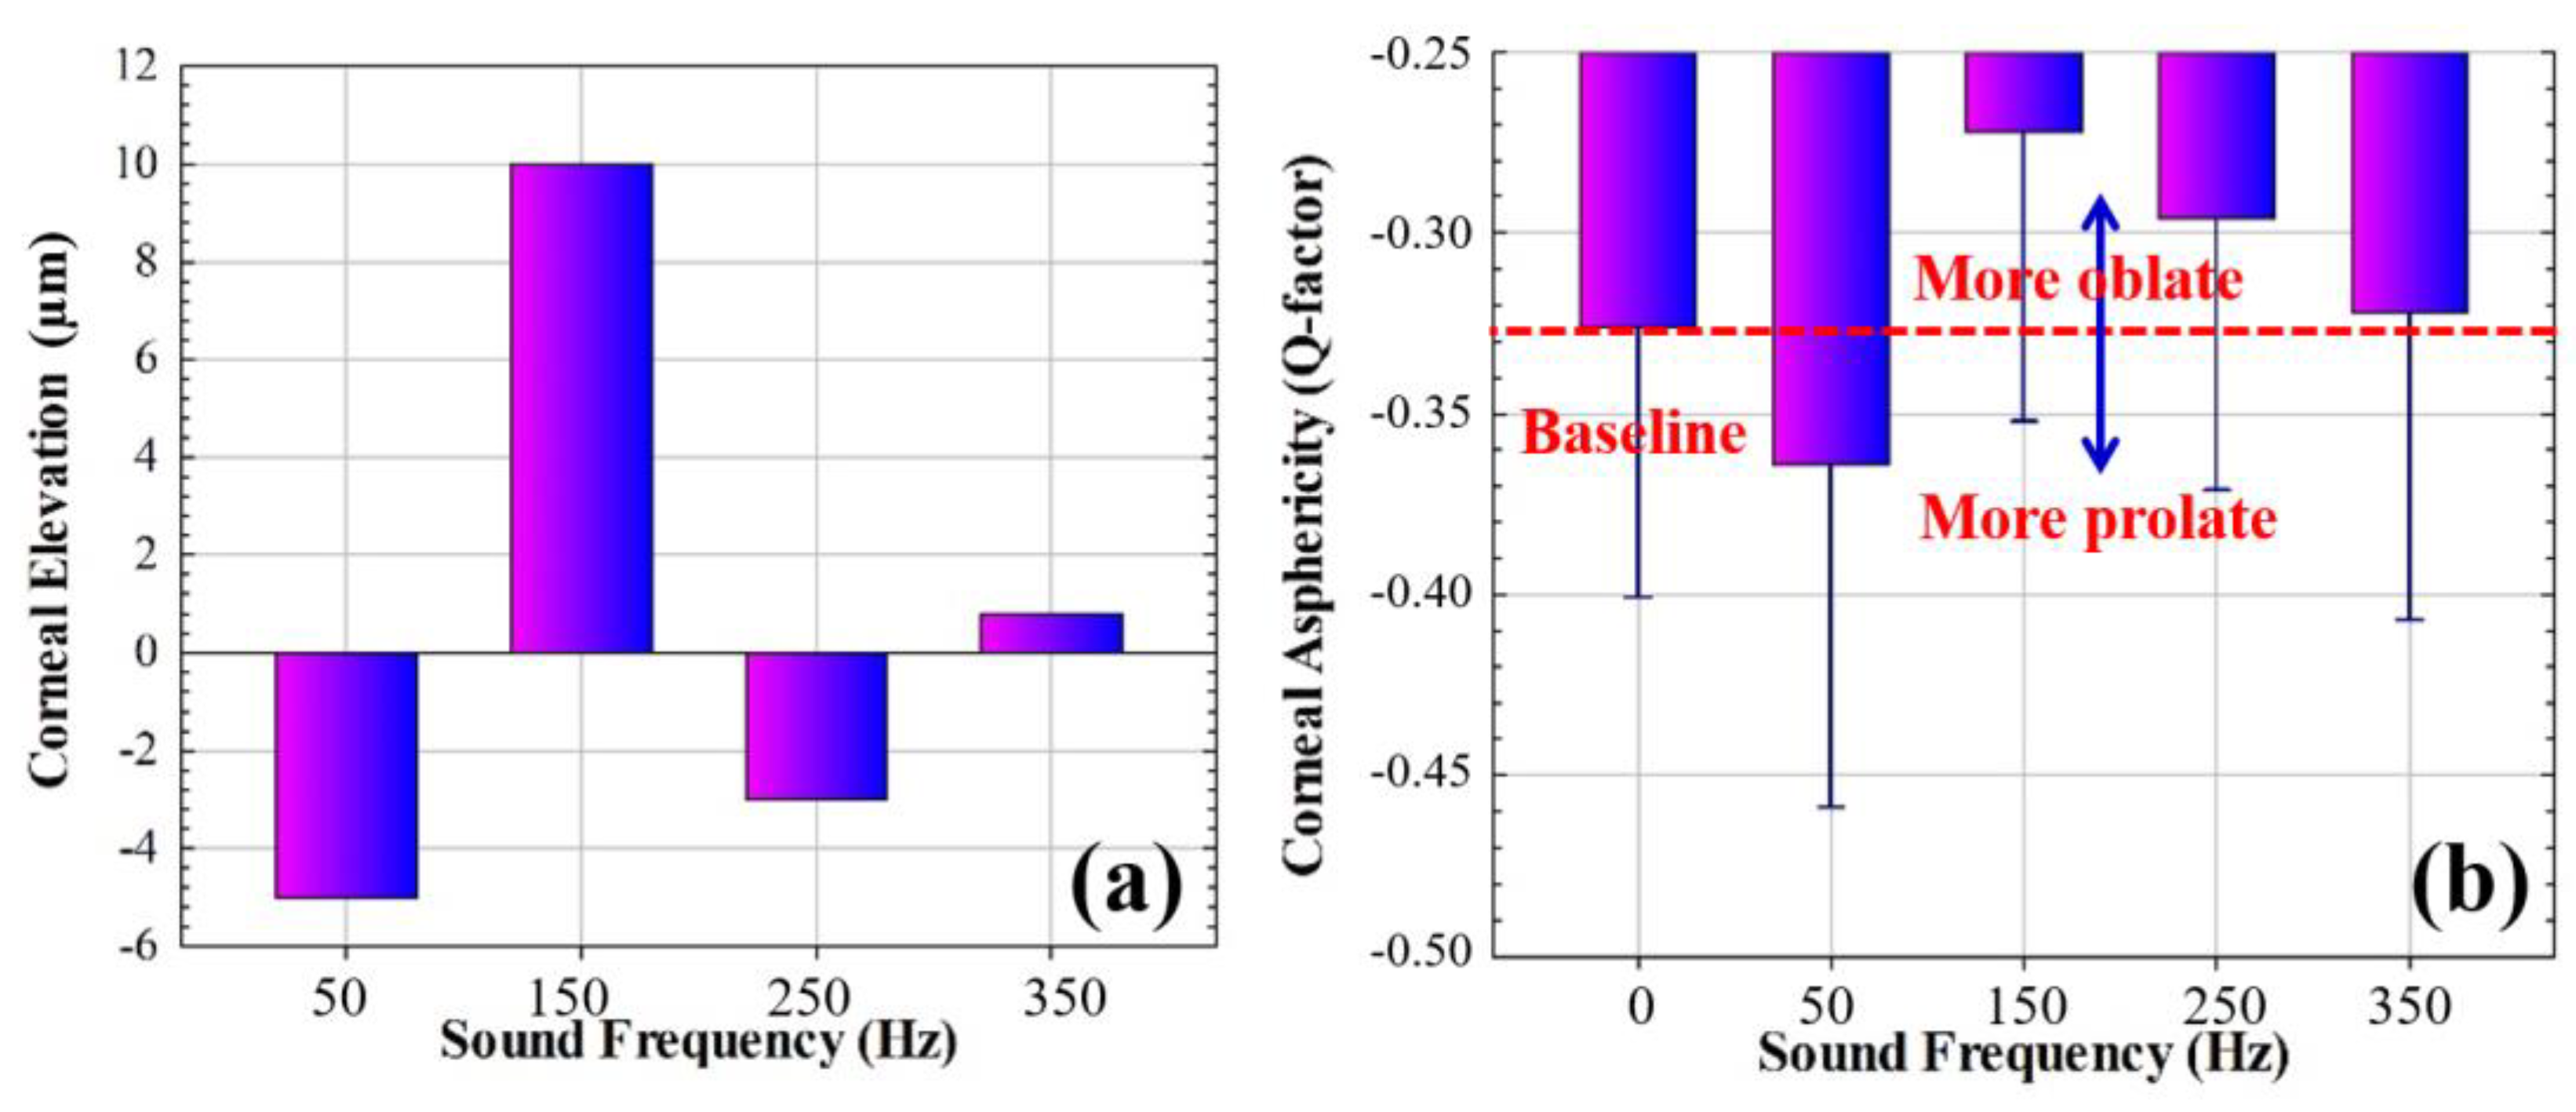
3.2. Corneal Geometry

Corneal surfaces were reconstructed from the mean radii of curvature and conic constants using the biconical equation described in Section 2.3. Figure 5a shows the fit of the corneal surface corresponding to the mean corneal geometric parameters in the relaxed state. This elevation map was set as a reference to be subtracted from those reconstructed for the different sound frequencies. As an example, Figure 5b,c shows the relative elevation maps induced by the application of sound waves for 150 and 350 Hz frequencies. While for 150 Hz an asymmetric meridional elevation is observed, for the 350 Hz frequency the induced elevation appears to be negligible.
Figure 6a shows the mean corneal elevation as a function of sound frequency. It is important to highlight how, depending on the applied frequency, depressions or elevations can be observed. The geometric analysis was complemented by the analysis of corneal asphericity; Figure 6b shows the mean Q-factor measured by Scheimpflug images for the control (baseline) and for the different sound frequencies. As shown, the most oblate induced deformation occurs for 150 Hz, which corresponds to the maximum corneal elevation (Figure 6a). In contrast, the maximum depression observed for 50 Hz (Figure 6a) corresponds to the most prolate deformation at the same frequency (Figure 6b).
The geometrical analysis consisted of corneal elevation analysis computed from the biconical surface corneal fit and asphericity measurements. The maximum corneal elevation was found for the 150 Hz frequency, which corresponded to the most oblate Q-factor. On the other hand, the 50 Hz frequency induced the maximum corneal depression and showed the most prolate deformation of the four sound frequencies. In contrast, the 350 Hz frequency induced negligible changes with respect the baseline values.

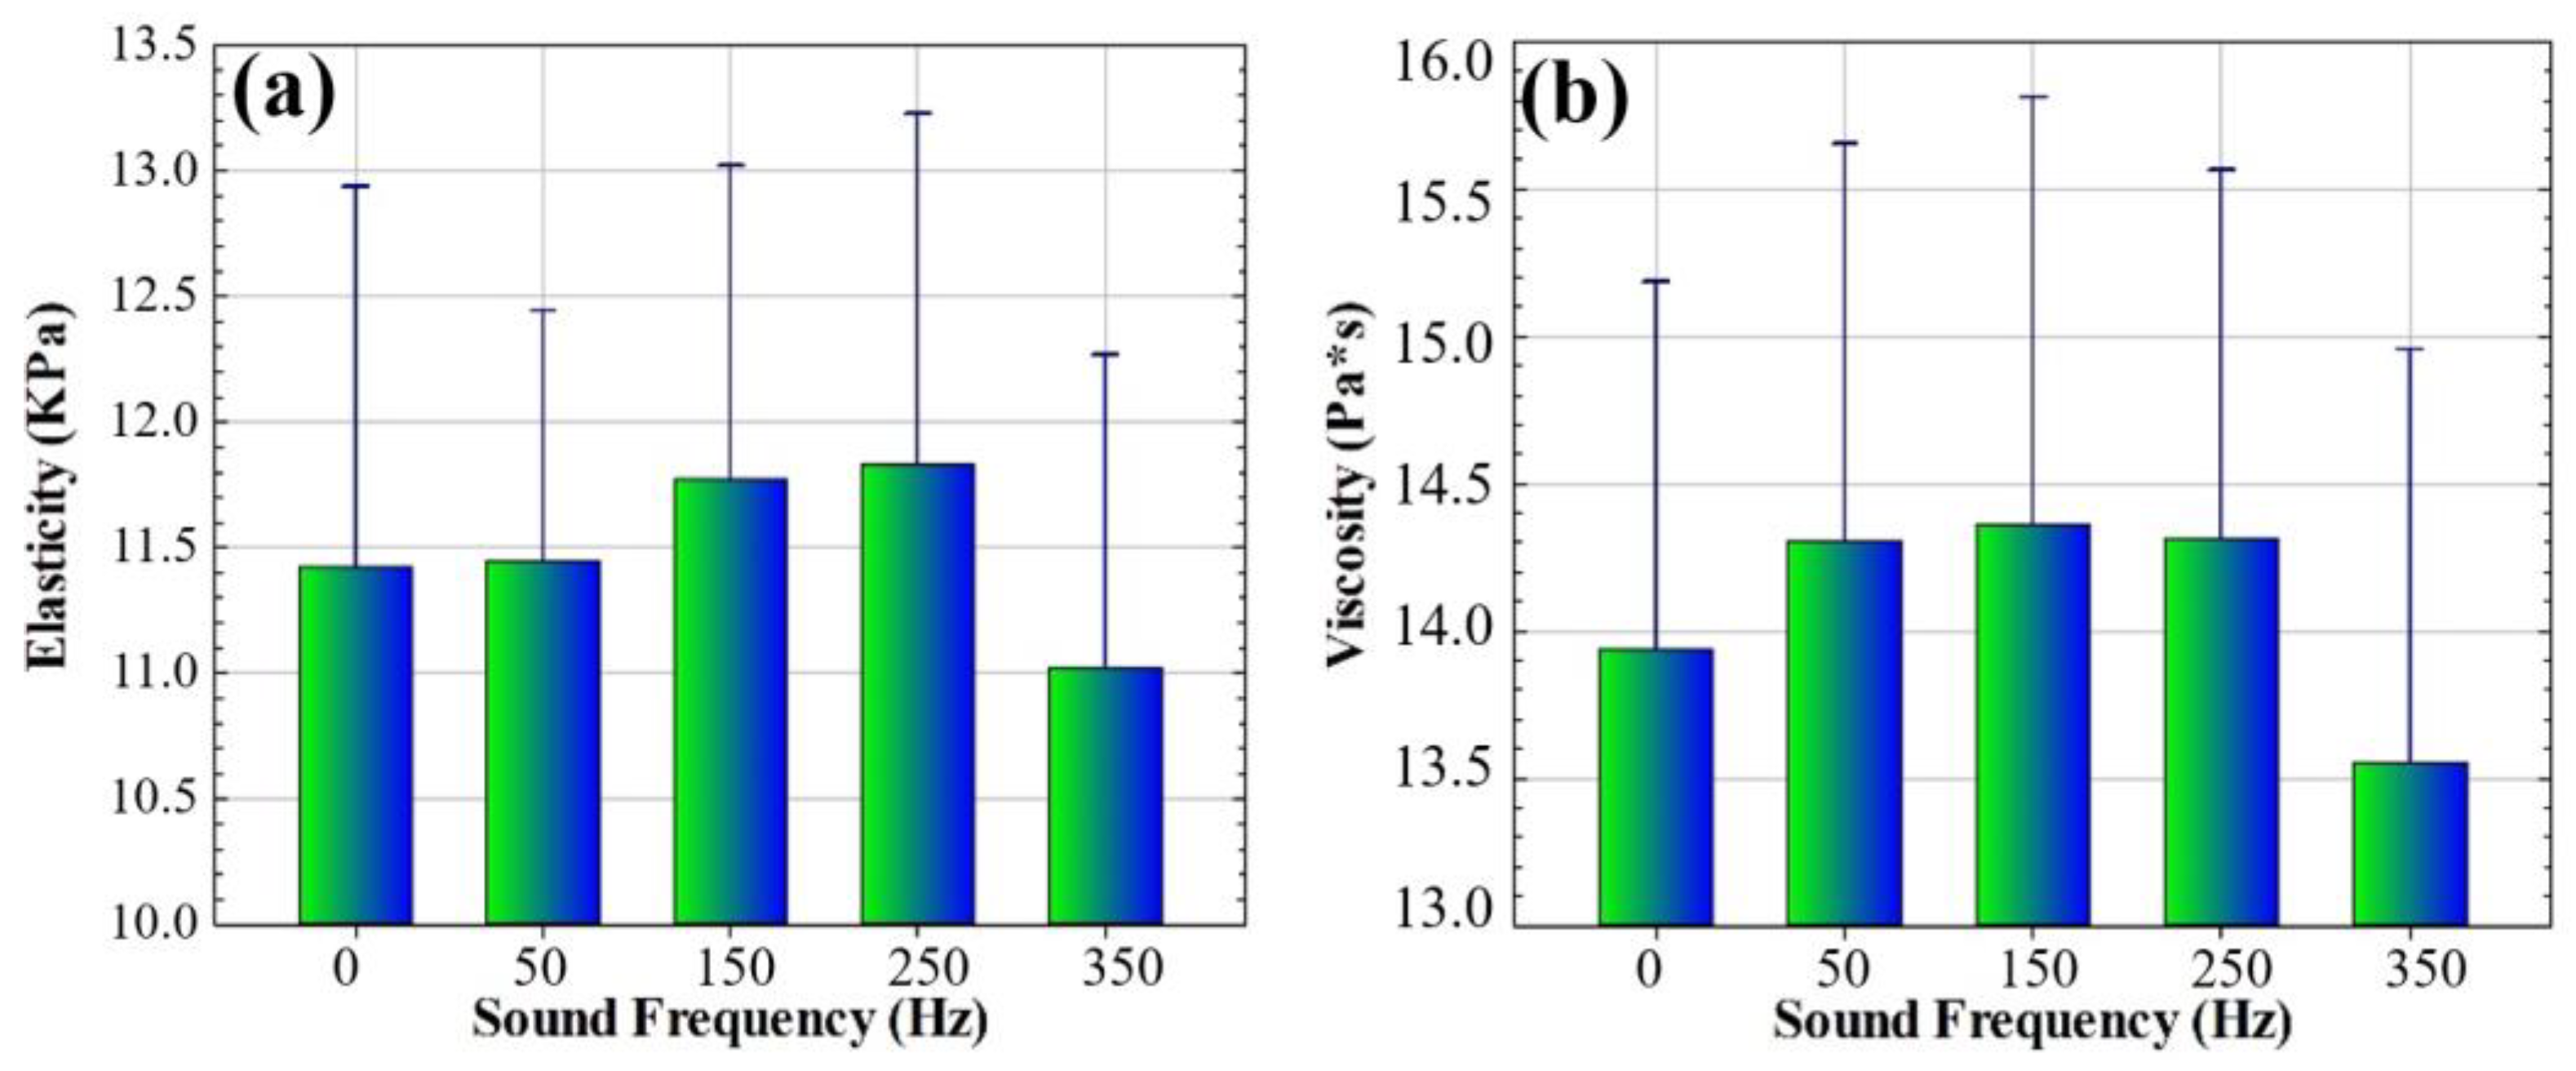
3.3. Biomechanical Analysis

Finally, this subsection analyzes the influence of the mechanical vibration of sound waves on corneal biomechanics. A previously reported standard linear solid model [34] applied to ORA measurements was used to extract the elastic and viscous properties of the cornea as a function of sound frequency. Figure 7 shows the average elasticity and viscosity values for the relaxed state (i.e., sound frequency = 0 Hz) and for four different sound frequencies. The maximum modulation of corneal elasticity occurs for the sound frequency of 250 Hz, while 250 Hz induces the maximum increase in the viscous component. However, for the frequency of 350 Hz, both elasticity and viscosity decrease by relatively similar percentages (decreases of 3.53% and 2.74%, respectively). This fact stands out from the wavefront and geometrical analyses, for which this sound frequency seemed to be innocuous.
The calculated biomechanical parameters were used to feed a previously reported standard linear solid model [34] and then to perform a creep-relaxation (C-R) test as a function of sound frequency. Panels (a) and (b) of Figure 8 show a C-R test with an integration time of 6 s for different sound frequencies. It can be observed that the sound frequency modulates both the creep and relaxation responses. Figure 8c,d show the responses marked in the red rectangles in the above figures for the first second of the C-R test, and those ranges show the largest distances with respect to the control responses, which are given for the frequency of 250 Hz.
The biomechanical analysis consisted of calculating the elastic and viscous components of the cornea using a standard linear solid model (SLSM), previously reported in [26]. The maximum variation in corneal elasticity occurred for 250 Hz, while the maximum increase in the viscous component occurred for 150 Hz. However, the maximum reduction in both elasticity and viscosity was given for 350 Hz.

4. Discussion

Since the first observation of sound-induced vibrational modes of the cornea almost a decade ago by Akca et al. [38], the stimulation of the cornea through its natural resonance frequency has attracted the interest of researchers working on the development of new advanced techniques for the assessment of corneal biomechanics.
We have recently reported on the effect of sound-induced mechanical vibration on the corneal biomechanics of the living human cornea [33] for a discrete range of sound frequencies between 50 and 350 Hz at a maximum sound pressure of 90 dB. The study reported by Akca et al. [38] revealed an amplitude of vibration of 8 µm in the fundamental resonant mode between 80 and 120 Hz for a sound pressure of 100 dB in enucleated corneas of bovine eyes. In good agreement, our findings showed a variation of 7.33 µm in central corneal thickness at the frequency of 150 Hz (90 dB sound pressure) in living human corneas [33].
Lan et al. [39] reported an elastography-based OCT method to quantify the corneal natural resonant frequency in living human eyes by air-pulse stimulation. Although they found a dependence of the dominant natural frequency on corneal thickness, this frequency appeared to be constant for different stimulation pressures and measurement distances. Specifically, they found a natural corneal resonant frequency of the living human cornea of 259 Hz. The same group quantified the natural resonant frequency range of the cornea by inducing submicron corneal vibrations using low-power microliter air pulses [40]. They found a corneal natural frequency range of 234–277 Hz in a measured region of 2.5 × 2.5 mm2 centered at the corneal apex, with an application time of 28.6 s. This range was found to be repeatable over a smaller area (1 mm2) and shorter application time (0.9 s).
Subsequently, Crespo et al. [36], used vibrational OCT imaging for the assessment of the elastic modulus of the living human cornea by resonant frequency excitation. They found five peak resonant frequencies at 73.5, 120.4, 148.7, 207.0, and 239.0 Hz and suggested that peaks two to five might correspond to different collagen networks in the stroma, while peak 1 was related to corneal cellular components.
The latter hypothesis was later confirmed by Silver et al. [37], demonstrating that vibrational OCT can isolate the cellular component of the cornea. Lan et al. [39] demonstrated that different components of the natural frequency spectrum can correspond to different tissue structures and thus characterize different heterogeneities of biological structures.
The natural resonant frequency of the cornea can be altered by variations in intraocular pressure, elasticity, or corneal thickness [41] and has been proposed as a biomarker for corneal biomechanics. The objective of this pilot study was to characterize the induced effects of four sound-induced vibrational modes in the living human cornea from a multimodal analysis based on wavefront aberrometry, geometry, and biomechanics.
In our previous study [26], we introduced the concept of Pneumatic Viscoelastic Damping (PVD) as the ability of the cornea to modify its viscoelastic properties under dynamic loading conditions. Those results showed PVD values of +3.57% and −4.34% for the frequencies of 150 and 250 Hz, respectively. While positive PVD values were associated with an increase in viscosity, an increase in corneal elasticity corresponded to negative PVD values. The possibility of obtaining the separated elastic and viscous components of the human cornea in vivo allowed us to corroborate that the maximum increase in viscosity and elasticity indeed occur at 150 and 250 Hz, respectively.
The SLSM model [33] also allowed the simulation of stress-relaxation tests with the calculated biomechanical properties; such tests showed how vibrational modes can affect both creep and relaxation behaviors. In particular, the application of specific sound frequencies in vibrometry allows for obtaining faster deformation and stress relaxation under the same external load conditions (see Figure 8).
Table 3 summarizes the variations induced by each sound frequency on wavefront aberration, corneal geometry, and biomechanics. The frequency of 50 Hz has the ability to reduce HOA, flatten the corneal surface, and increase corneal viscosity; however, this sound frequency does not induce any effect on LOA or elastic properties.
At 150 Hz, LOAs are reduced by 5.10%, while HOAs showed a significant increase in RMS values (21.92%, p = 0.039) compared to the baseline wavefront aberration.
The observed significant increase in HOAs at 150 Hz aligns with studies reporting resonant frequency effects on corneal biomechanics [42]. Frequencies near natural resonant modes can amplify certain biomechanical responses, potentially explaining the pronounced HOA variations.
Lower frequencies (e.g., 50 Hz) primarily impacted corneal shape and did not significantly alter HOAs, possibly due to insufficient energy to excite low-order modes. Higher frequencies (350 Hz) may not effectively couple with the cornea’s structural properties, leading to minimal aberration changes.
The cornea becomes more oblate (a Q factor increase of 16.56%) and the elastic and viscous components are affected in exactly the same proportion: both increase by 3.05%. This frequency provides the maximum increase in viscosity of the studied vibrational modes. A frequency of 250 Hz shows an inverse behavior compared to 150 Hz in the wavefront analysis; while LOAs increase, HOAs decrease, as shown in Table 3. The corneal geometry becomes more oblate and both elasticity and viscosity increase. This frequency provides the maximum elastic modulation with respect to the other vibrational modes.
Finally, at 350 Hz all the parameters studied are reduced: wavefront aberration, corneal geometry, and biomechanics. It is important to note that the corneal geometry seemed to be insensitive to the specific frequency of 350 Hz; however, it is the only frequency capable of reducing the elastic and viscous components of the corneal biomechanics.

5. Conclusions

In conclusion, the cornea exhibits vibrational modes whose behavior is influenced by its mechanical, structural, and optical properties. These modes are being considered as biomarkers of corneal biomechanics and can reveal critical information in pathological processes such as corneal keratoconus [43].
Low-frequency sound vibrometry provides a non-invasive way to analyze different natural corneal vibrational modes that are sensitive to wavefront aberration, macrostructure, and biomechanical properties such as elasticity and viscosity. The integration of aberrometry and the interaction of sound-wave vibrometry can achieve a more comprehensive understanding of how mechanical and optical corneal aberrations correlate and investigate how vibrational wavefront aberration patterns are altered, identifying areas of potential weakness before surgery or corneal pathologies.
Finally, knowledge of how the elastic and viscous properties of the cornea respond to different vibrational modes reflects the cornea’s ability to compensate for mechanical stress, helping the physician improve clinical outcomes and minimize post-corneal surgery complications.
Future research will focus on the integration of sound-wave corneal vibrometry into new approaches based on structural contrast mechanisms to investigate how different vibrational modes can characterize the corneal tissue and reveal physiological or pathological alterations not detected in current diagnostic modalities.

Author Contributions

Conceptualization, F.J.Á.; methodology, F.J.Á., Ó.d.B., M.C.M. and L.R.; formal analysis, F.J.Á.; investigation, Ó.d.B., M.C.M. and L.R.; writing—original draft preparation, F.J.Á.; writing—review and editing, F.J.Á. and Ó.d.B.; project administration, F.J.Á.; funding acquisition, F.J.Á. All authors have read and agreed to the published version of the manuscript.

Funding

This research was funded by Fundación Bancaria Ibercaja, grant number 223221: JIUZ-2021-CIE-01.

Institutional Review Board Statement

The study was conducted in accordance with the Declaration of Helsinki and approved by the Ethics Committee of the Health Sciences Institute of Aragon, Spain (protocol code: C.P.-C.I. PI20/377; date of approval: 14 July 2020).

Informed Consent Statement

Informed consent was obtained from all subjects involved in the study.

Data Availability Statement

All data generated in this study are shown in the manuscript.

Acknowledgments

The authors thank Julio Amaré and Juanjo Lanuza from the “Departamento de Fisica Aplicada” of the University of Zaragoza for their technical support in the electronic design and mechanical assembly of the corneal waveform generator.

Conflicts of Interest

The authors declare no conflicts of interest.

References

  1. Marinescu, M.; Dascalescu, D.; Constantin, M.; Coviltir, V.; Burcel, M.; Darabus, D.; Ciuluvica, R.; Stanila, D.; Potop, V.; Alexandrescu, C. Corneal Biomechanics—An Emerging Ocular Property with a Significant Impact. Maedica 2022, 17, 925–930. [Google Scholar] [CrossRef] [PubMed]
  2. Kobayashi, A.S.; Staberg, L.G.; Schlegel, W.A. Viscoelastic properties of human cornea. Exp. Mech. 1973, 13, 497–503. [Google Scholar] [CrossRef]
  3. Espana, E.M.; Birk, D.E. Composition, structure and function of the corneal stroma. Exp. Eye Res. 2020, 198, 108137. [Google Scholar] [CrossRef]
  4. Hatami-Marbini, H.; Etebu, E. Hydration dependent biomechanical properties of the corneal stroma. Exp. Eye Res. 2013, 116, 47–54. [Google Scholar] [CrossRef]
  5. Schweitzer, C.; Korobelnik, J.F.; Boniol, M.; Cougnard-Gregoire, A.; Le Goff, M.; Malet, F.; Rougier, M.B.; Delyfer, M.N.; Dartigues, J.F.; Delcourt, C. Associations of biomechanical properties of the cornea with environmental and metabolic factors in an elderly population: The ALIENOR study. Investig. Ophthalmol. Vis. Sci. 2016, 57, 2003–2011. [Google Scholar] [CrossRef]
  6. Kamiya, K.; Shimizu, K.; Ohmoto, F. Effect of aging on corneal biomechanical parameters using the ocular response analyzer. J. Refract. Surg. 2009, 25, 888–893. [Google Scholar] [CrossRef] [PubMed]
  7. David, R.; Zangwill, L.; Briscoe, D.; Dagan, M.; Yagev, R.; Yassur, Y. Diurnal intraocular pressure variations: An analysis of 690 diurnal curves. Br. J. Ophthalmol. 1992, 76, 280–283. [Google Scholar] [CrossRef] [PubMed]
  8. Marcellán, M.C.; Remón, L.; Ávila, F.J. Corneal hysteresis and intraocular pressure are altered in silicone-hydrogel soft contact lenses wearers. Int. Ophthalmol. 2022, 42, 2801–2809. [Google Scholar] [CrossRef] [PubMed]
  9. Bao, F.; Lopes, B.T.; Zheng, X.; Ji, Y.; Wang, J.; Elsheikh, A. Corneal Biomechanics Losses Caused by Refractive Surgery. Curr. Eye Res. 2023, 48, 137–143. [Google Scholar] [CrossRef]
  10. Esporcatte, L.P.G.; Salomão, M.Q.; Lopes, B.T.; Sena, N.; Ferreira, É.; Filho, J.B.R.; Machado, A.P.; Ambrósio, P., Jr. Biomechanics in keratoconus diagnosis. Curr. Eye Res. 2023, 48, 130–136. [Google Scholar] [CrossRef] [PubMed]
  11. Elhusseiny, A.M.; Scarcelli, G.; Saeedi, O.J. Corneal Biomechanical Measures for Glaucoma: A Clinical Approach. Bioengineering 2023, 10, 1108. [Google Scholar] [CrossRef] [PubMed]
  12. Salomão, M.Q.; Hofling-Lima, A.L.; Gomes Esporcatte, L.P.; Lopes, B.; Vinciguerra, R.; Vinciguerra, P.; Bühren, J.; Sena, N., Jr.; Luz Hilgert, G.S.; Ambrósio, R., Jr. The Role of Corneal Biomechanics for the Evaluation of Ectasia Patients. Int. J. Environ. Res. Public Health 2020, 17, 2113. [Google Scholar] [CrossRef] [PubMed]
  13. Esporcatte, L.P.G.; Salomão, M.Q.; Junior, N.S.; Machado, A.P.; Ferreira, É.; Loureiro, T.; Junior, R.A. Corneal biomechanics for corneal ectasia: Update. Saudi J. Ophthalmol. 2022, 36, 17–24. [Google Scholar] [CrossRef] [PubMed]
  14. Lau, W.; Pye, D. A clinical description of Ocular Response Analyzer measurements. Investig. Ophthalmol. Vis. Sci. 2011, 52, 2911–2916. [Google Scholar] [CrossRef] [PubMed]
  15. Luce, D.A. Determining in vivo biomechanical properties of the cornea with an ocular response analyzer. J. Cataract Refract. Surg. 2005, 31, 156–162. [Google Scholar] [CrossRef] [PubMed]
  16. Zimprich, L.; Diedrich, J.; Bleeker, A.; Schweitzer, J.A. Corneal Hysteresis as a Biomarker of Glaucoma: Current Insights. Clin. Ophthalmol. 2020, 14, 2255–2264. [Google Scholar] [CrossRef]
  17. Sit, A.J.; Chen, T.C.; Takusagawa, H.L.; Rosdahl, J.A.; Hoguet, A.; Chopra, V.; Richter, G.M.; Ou, Y.; Kim, S.J.; WuDunn, D. Corneal Hysteresis for the Diagnosis of Glaucoma and Assessment of Progression Risk: A Report by the American Academy of Ophthalmology. Ophthalmology 2023, 130, 433–442. [Google Scholar] [CrossRef] [PubMed]
  18. del Buey, M.A.; Cristóbal, J.A.; Ascaso, F.J.; Lavilla, L.; Lanchares, E. Biomechanical properties of the cornea in Fuchs’ corneal dystrophy. Investig. Ophthalmol. Vis. Sci. 2009, 50, 3199–3202. [Google Scholar] [CrossRef]
  19. Ortiz, D.; Piñero, D.; Shabayek, M.H.; Arnalich-Montiel, F.; Alió, J.L. Corneal biomechanical properties in normal, post-laser in situ keratomileusis, and keratoconic eyes. J. Cataract Refract. Surg. 2007, 33, 1371–1375. [Google Scholar] [CrossRef]
  20. Lopes, B.T.; Roberts, C.J.; Elsheikh, A.; Vinciguerra, R.; Vinciguerra, P.; Reisdorf, S.; Berger, S.; Koprowski, R.; Ambrósio, R., Jr. Repeatability and Reproducibility of Intraocular Pressure and Dynamic Corneal Response Parameters Assessed by the Corvis ST. J. Ophthalmol. 2017, 2017, 8515742. [Google Scholar] [CrossRef] [PubMed]
  21. Borderie, V.; Beauruel, J.; Cuyaubère, R.; Georgeon, C.; Memmi, B.; Sandali, O. Comprehensive Assessment of Corvis ST Biomechanical Indices in Normal and Keratoconus Corneas with Reference to Corneal Enantiomorphism. J. Clin. Med. 2023, 12, 690. [Google Scholar] [CrossRef]
  22. Zhang, P.; Wu, J.; Jiang, J.; Zhang, X.; Ran, Z.; Jiang, F.; Zheng, X.; Wang, J.; Elsheikh, A.; Bao, F. Evaluation of changes in corneal biomechanics after orthokeratology using Corvis ST. Contact Lens Anterior Eye 2024, 47, 102100. [Google Scholar] [CrossRef]
  23. Long, Q.; Wang, J.; Yang, X.; Jin, Y.; Ai, F.; Li, Y. Assessment of Corneal Biomechanical Properties by CorVis ST in Patients with Dry Eye and in Healthy Subjects. J. Ophthalmol. 2015, 2015, 380624. [Google Scholar] [CrossRef]
  24. Wang, X.; McAlinden, C.; Zhang, H.; Yan, J.; Wang, D.; Wei, W.; Mi, S. Assessment of corneal biomechanics, tonometry and pachymetry with the Corvis ST in myopia. Sci. Rep. 2021, 11, 3041. [Google Scholar] [CrossRef]
  25. Glass, D.H.; Roberts, C.J.; Litsky, A.S.; Weber, P.A. A Viscoelastic Biomechanical Model of the Cornea Describing the Effect of Viscosity and Elasticity on Hysteresis. Investig. Ophthalmol. Vis. Sci. 2008, 49, 3919–3926. [Google Scholar] [CrossRef] [PubMed]
  26. Ávila, F.J.; del Barco, Ó.; Marcellán, M.C.; Remón, L. A Comprehensive Study on Elasticity and Viscosity in Biomechanics and Optical Properties of the Living Human Cornea. Photonics 2024, 11, 524. [Google Scholar] [CrossRef]
  27. Kwon, S.J.; Jeong, M.K. Advances in ultrasound elasticity imaging. Biomed. Eng. Lett. 2017, 7, 71–79. [Google Scholar] [CrossRef] [PubMed]
  28. Lan, G.; Aglyamov, S.R.; Larin, K.V.; Twa, M.D. In Vivo Human Corneal Shear-wave Optical Coherence Elastography. Optom. Vis. Sci. 2021, 98, 58–63. [Google Scholar] [CrossRef] [PubMed]
  29. Ramier, A.; Tavakol, B.; Yun, S.H. Measuring mechanical wave speed, dispersion, and viscoelastic modulus of the cornea using optical coherence elastography. Opt. Express 2019, 27, 16635–16649. [Google Scholar] [CrossRef]
  30. Han, Z.; Li, J.; Singh, M.; Aglyamov, S.R.; Wu, C.; Liu, C.H.; Larin, K.V. Analysis of the effects of curvature and thickness on elastic wave velocity in cornea-like structures by finite element modeling and optical coherence elastography. Appl. Phys. Lett. 2015, 106, 233702. [Google Scholar] [CrossRef] [PubMed]
  31. Larin, K.V. Investigating Elastic Anisotropy of the Porcine Cornea as a Function of Intraocular Pressure With Optical Coherence Elastography. J. Refract. Surg. 2016, 32, 562–567. [Google Scholar]
  32. Lan, G.; Gu, B.; Larin, K.V.; Twa, M.D. Clinical Corneal Optical Coherence Elastography Measurement Precision: Effect of Heartbeat and Respiration. Transl. Vis. Sci. Technol. 2020, 9, 3. [Google Scholar] [CrossRef]
  33. Ávila, F.J.; Marcellán, M.C.; Remón, L. In Vivo Biomechanical Response of the Human Cornea to Acoustic Waves. Optics 2023, 4, 584–594. [Google Scholar] [CrossRef]
  34. Thibos, L.N.; Applegate, R.A.; Schwiegerling, J.T.; Webb, R. Standards for reporting the optical aberrations of eyes. J. Refract. Surg. 2002, 18, S652–S660. [Google Scholar] [CrossRef] [PubMed]
  35. Blanco-Martínez, I.; González-Méijome, J.M.; Faria-Ribeiro, M. Linear fitting of biconic surfaces for corneal modeling. J. Opt. Soc. Am. A Opt. Image Sci. Vis. 2024, 41, 288–295. [Google Scholar] [CrossRef] [PubMed]
  36. Crespo, M.A.; Jimenez, H.J.; Deshmukh, T.; Pulido, J.S.; Saad, A.S.; Silver, F.H.; Benedetto, D.A.; Rapuano, C.J.; Syed, Z.A. In Vivo Determination of the Human Corneal Elastic Modulus Using Vibrational Optical Coherence Tomography. Transl. Vis. Sci. Technol. 2022, 11, 11. [Google Scholar] [CrossRef]
  37. Silver, F.H.; Benedetto, D.A.; Rapuano, C.J.; Syed, Z.A. Identification of the Vibrational Optical Coherence Tomography Corneal Cellular Peak. Transl. Vis. Sci. Technol. 2023, 12, 11. [Google Scholar]
  38. Akca, B.I.; Chang, E.W.; Kling, S.; Ramier, A.; Scarcelli, G.; Marcos, S.; Yun, S.H. Observation of sound-induced corneal vibrational modes by optical coherence tomography. Biomed. Opt. Express 2015, 6, 3313–3319. [Google Scholar] [CrossRef] [PubMed]
  39. Lan, G.; Aglyamov, S.; Larin, K.V.; Twa, M.D. In vivo human corneal natural frequency quantification using dynamic optical coherence elastography: Repeatability and reproducibility. J. Biomech. 2021, 121, 110427. [Google Scholar] [CrossRef]
  40. Lan, G.; Larin, K.V.; Aglyamov, S.; Twa, M.D. Characterization of natural frequencies from nanoscale tissue oscillations using dynamic optical coherence elastography. Biomed. Opt. Express 2020, 11, 3301–3318. [Google Scholar] [CrossRef] [PubMed]
  41. McAuley, R.; Nolan, A.; Curatolo, A.; Alexandrov, S.; Zvietcovich, F.; Varea Bejar, A.; Marcos, S.; Leahy, M.; Birkenfeld, J.S. Co-axial acoustic-based optical coherence vibrometry probe for the quantification of resonance frequency modes in ocular tissue. Sci. Rep. 2022, 12, 18834. [Google Scholar] [CrossRef] [PubMed]
  42. Lan, G.; Shi, Q.; Wang, Y.; Ma, G.; Cai, J.; Feng, J.; Huang, Y.; Gu, B.; An, L.; Xu, J.; et al. Spatial Assessment of Heterogeneous Tissue Natural Frequency Using Micro-Force Optical Coherence Elastography. Front. Bioeng. Biotechnol. 2022, 10, 851094. [Google Scholar] [CrossRef] [PubMed]
  43. Koprowski, R.; Ambrósio, R., Jr. Quantitative assessment of corneal vibrations during intraocular pressure measurement with the air-puff method in patients with keratoconus. Comput. Biol. Med. 2015, 66, 170–178. [Google Scholar] [CrossRef] [PubMed]
Figure 1. Scheme of Zernike coefficients provided by Galilei G2 device.
Optics 06 00005 g001
Figure 2. Average amplitude values of each Zernike mode number for control (relaxed state) (a) and for each sound frequency (be).
Optics 06 00005 g002
Figure 3. Average RMS values for low-order (a) and high-order aberrations (b) RMS values (LOA and HOA RMS, respectively) as a function of sound frequency. Asterisk indicates statistically significant difference (p < 0.005).
Optics 06 00005 g003
Figure 4. Top row and third row: low- (ad) and high-order (il) wavefront aberration (LOA WA and HOA WA, respectively) maps as a function of sound frequency. Second and fourth rows: wavefront aberration maps isolated from control measurements [Control–LOA (eh) and HOA WA (mp), respectively].
Optics 06 00005 g004
Figure 5. Corneal surfaces reconstructed using biconic fit. (a): control surface; (b,c): reconstructed surfaces for 150 Hz and 350 Hz, respectively.
Optics 06 00005 g005
Figure 6. Mean corneal elevation (a) and corneal asphericity (b) as a function of sound frequency.
Optics 06 00005 g006
Figure 7. The average (mean of the 5 subjects) elasticity (a) and viscosity (b) parameters for the relaxed state and four sound frequencies.
Optics 06 00005 g007
Figure 8. (a,b) Creep-relaxation test for different sound frequencies and integration time of 6 s. (c,d) Enlarged view of red rectangles for better visualization of sound-wave modulation in stress-strain curves.
Optics 06 00005 g008
Table 1. Demographic information of the cohort studied. N: number of participants; std: standard deviation; IOP: intraocular pressure.
Demographic Information (N = 5)
Male/female2/5
Age (mean ± std)35 ± 10
EthnicityCaucasian
Ophthalmic HistoryNot found
Medical HistoryNot found
IOP (mean ± std)15.32 ± 2.94 mmHg
Table 2. Summary of experimental parameters required for wavefront aberration, geometrical, and biomechanical analysis, the information provided, and the instrument from which they were acquired.
ParameterInformationInstrument
Zernike coefficients (mode number) [µm]Corneal wavefront aberrometryGalilei G2
Pupil aperture [mm]Area of the wavefront measurementGalilei G2
Q-factorCorneal asphericityGalilei G2
Flat R1 [mm]Flat corneal radiusGalilei G2
Steep R2 [mm]Steep corneal radiusGalilei G2
CH [mmHg]Corneal hysteresisORA
CRF [mmHg]Corneal resistant factorORA
IOP [mmHg]Intraocular pressureORA
Table 3. Percentage of variation with respect to reference parameters studied as a function of vibrational mode. Low-order and high-order aberrations (LOA and HOA); corneal asphericity (Q-value); elasticity and viscous corneal biomechanical components.
50 Hz150 Hz250 Hz350 Hz
Wavefront
LOA ↑ 0.70%↓ 5.10%↑ 11.98%↓ 6.70%
HOA↓ 3.62%↑ 21.92%↓ 14.43%↓ 3.15%
Corneal geometry
Q value↑ 11.66%↓ 16.56%↓ 9.20%↓ 1.23%
Biomechanics
Elasticity↑ 0.18%↑ 3.05%↑ 3.56%↓3.53%
Viscosity↑ 2.65%↑ 3.05%↑ 2.71%↓ 2.74%
Disclaimer/Publisher’s Note: The statements, opinions and data contained in all publications are solely those of the individual author(s) and contributor(s) and not of MDPI and/or the editor(s). MDPI and/or the editor(s) disclaim responsibility for any injury to people or property resulting from any ideas, methods, instructions or products referred to in the content.

