Article

Design of Ultra-Wide-Band Fourier Transform Infrared Spectrometer

1
Aerospace Information Research Institute, Chinese Academy of Sciences, No.9 Dengzhuang South Road, Haidian District, Beijing 100094, China
2
School of Optoelectronics, University of Chinese Academy of Sciences, No.19(A) Yuquan Road, Shijingshan District, Beijing 100049, China
3
Department of Key Laboratory of Computational Optical Imagine Technology, Chinese Academy of Sciences, No.9 Dengzhuang South Road, Haidian District, Beijing 100094, China
*
Author to whom correspondence should be addressed.
Optics 2025, 6(1), 7; https://doi.org/10.3390/opt6010007
Submission received: 31 January 2025 / Revised: 26 February 2025 / Accepted: 28 February 2025 / Published: 5 March 2025
(This article belongs to the Section Engineering Optics)

Abstract

:
A wide band range can cover more of the characteristic spectral lines of substances, and thus analyze the structure and composition of substances more accurately. In order to broaden the band range of spectral instruments, an ultra-wide-band Fourier transform infrared spectrometer is designed. The incident light of the spectrometer is constrained by a secondary imaging scheme, and switchable light sources and detectors are set to achieve an ultra-wide band coverage. A compact and highly stable double-moving mirror swing interferometer is adopted to generate optical path difference, and a controller is used to stabilize the swing of the moving mirrors. A distributed design of digital system integration and analog system integration is adopted to achieve a lightweight and low-power-consumption spectrometer. High-speed data acquisition and a transmission interface are applied to improve the real-time performance. Further, a series of experiments are performed to test the performance of the spectrometer. Finally, the experimental results show that the spectral range of the ultra-wide-band Fourier transform infrared spectrometer covers 0.770–200 μm, with an accurate wave number, a spectral resolution of 0.25 cm−1, and a signal-to-noise ratio better than 50,000:1.

1. Introduction

Spectra are one of the important properties of substances. The structure and composition of substances can be analyzed based on their spectra [1,2]. Infrared spectroscopy is widely used in materials analysis due to its strong characteristics and wide range [3,4]. With an in-depth understanding of substances, it has been found that the spectra of many substances in the mid-infrared (MIR) band are very complex, and the spectra of some different substances are also similar [5,6]; however, in the far-infrared (FIR) and near-infrared (NIR) bands, the spectra of some substances are simple and linear, and can be accurately identified [7,8]. Therefore, broadening the spectral range of spectrometers could cover more of the characteristic spectral lines of the substances to be tested, greatly improving the detection capability of spectrometers. Some types of wide-band spectrometers have been designed, such as spatial heterodyne interferometers [9], grating spectrometers [10], Czerny–Turner spectrometers [11], Fourier transform solar spectrometers [12], etc.
A Fourier transform infrared (FTIR) spectrometer has the advantages of fast speed, high spectral resolution, and a high signal-to-noise ratio (SNR). By broadening its spectral range, it could realize the fast and accurate detection of viscous samples, such as solids, liquids, and powders [13,14,15,16]. A wide-band FTIR spectrometer with high resolution, an accurate wave number, and good repeatability would be a powerful tool for determining molecular composition and structure, and could be used for the structural analysis and identification of many substances. Therefore, it is of great significance to carry out research on wide-band FTIR spectrometers. L. Wawrzyniuk et al. introduced an FTIR spectrometer consisting of two Michelson interferometers and a joint sliding mirror, which could simultaneously measure the two infrared bands of 3–5 and 8–12 μm [17]. B. E. Moshkin et al. designed an FTIR spectrometer with a spectral range of 600–5500 cm−1 for studying the atmosphere of Mars [18], with a spectral resolution better than 0.2 cm−1. A. O. Ghoname et al. used MEME technology to develop an ultra-wide-band fiber-free MEMS FTIR spectrometer with an operating wavelength range of 1.8–6.8 µm, but the spectral resolution and SNR of this type of spectrometer were low [19]. V. I. Serdyukov et al. designed a cryogenic vacuum chamber for a Bruker IFS 125-M spectrometer with a spectral range of 1000–20,000 cm−1 [20]. In order to simultaneously achieve a broadband spectrum, high resolution, and high-SNR spectral detection, F. Tian et al. proposed a broadband interferometer spectrometer structure based on bandpass-sampling technology [21]. I. L. Fufurin designed an FTIR spectrometer system using two MCT TE-cooled photodetectors for ambient air analysis [22]. In addition, some companies have also developed wide-band FTIR spectrometers, such as Nicolet iS50 from Thermo Fisher Scientific in the United States and INVENIO from Bruker in Germany, etc.
In this study, we designed an ultra-wide-band FTIR spectrometer that can cover the entire infrared band to meet to the ever-increasing detection requirements of chemical substances. The spectrometer applies a secondary imaging scheme to constrain the incident light, using two switchable light sources and three switchable detectors, and a compact and highly stable double-moving mirror swing interferometer to generate the optical path difference (OPD), thereby achieving the full coverage of a band range of 0.770–200 μm. Finally, we verified the excellent performance of this ultra-wide-band FTIR spectrometer through a series of spectral measurements.

2. System Design

This ultra-wide-band FTIR spectrometer adopts an active spectrum measurement solution. The system mainly includes an optical system and an electronic system. The optical system consists of a light source module, an interferometer module, and a detector module. The electronic system is the control core of the FTIR spectrometer and is responsible for controlling the working logic of the system.

2.1. Optical System Design

2.1.1. Infrared Light Source Design

Ideally, the beam entering the interferometer is a perfect plane wave. However, in reality, since the light source has a certain volume and the light emitted by the light source is not necessarily perfectly collimated, the beam entering the interferometer is not completely parallel, thus affecting the quality of the interference pattern. When a rectangular apodization function is used, the maximum incident light divergence angle corresponding to the spectral resolution limit is
α max = Δ σ λ min
where λ min represents the shortest wavelength, and Δ σ represents the limiting spectral resolution. The designed spectral range of the ultra-wide-band FTIR spectrometer is 50–3000 cm−1. According to Equation (1), when it works at a spectral resolution of 0.25 cm−1, the collimation of the light source output beam must reach 4 mrad, which requires an optical system with high performance.
To meet this requirement, the light source module adopts a secondary imaging scheme, shown in Figure 1. By utilizing the conjugate relationship of the double focus of the ellipsoidal reflector M1, the radiation source is imaged on the surface of the variable diaphragm after collecting the emitted energy of the infrared radiation source. The diaphragm adopts an aperture diaphragm and the size of the aperture is precisely set, with a minimum diameter of 0.8 mm. The field diaphragm is switched by rotating the wheel to change the size of the primary image. The primary image is collimated by the off-axis parabolic mirror M2. In the meantime, the beam divergence angle is determined by the point source size and the effective focal length of the parabolic mirror. When the aperture size is 0.8 mm and the effective focal length of M2 is 100 mm, the divergence angle α max of the collimated beam is
α max = 0.8 mm 2 / 100 mm = 4 mrad
which can meet the requirement of a 0.25 cm−1 spectral resolution. M3 is a plane steering mirror, which is responsible for adjusting the exit angle of the collimated parallel light entering the interferometer module.
The infrared light source is one of the key components of the ultra-wide-band FTIR spectrometer. The infrared radiation intensity directly affects the detection sensitivity. The MIR band range of the proposed FTIR spectrometer is 350–8000 cm−1. MIR light sources generate a lot of heat when working, so effective cooling methods are needed to maintain their performance and life. Common cooling methods include air cooling, Peltier cooling, and water cooling. Water cooling requires a complex system, is large in size, and has the risk of water leakage; Peltier cooling has a high cost and energy consumption, and requires additional heat dissipation measures (such as air cooling) to handle the heat at the hot end. Air cooling is low-cost, has a low power consumption, and is easy to maintain. Considering the cost, power consumption, and application range of the light source, an air-cooling silicon carbide light source is selected as the MIR light source for the spectrometer. The light source’s spectral range is 50–9600 cm−1, so there is no need to switch the light source during the MIR band measurement process. For the NIR band, a spectral range of at least 8000–13,000 cm−1 must be covered. The NIR band of the spectrometer uses a halogen tungsten lamp light source, with a spectral range of 3000–25,000 cm−1. For FIR band (50–350 cm−1), the MIR light sources can cover this spectra range. Therefore, the FIR band and the MIR band share the same light source.

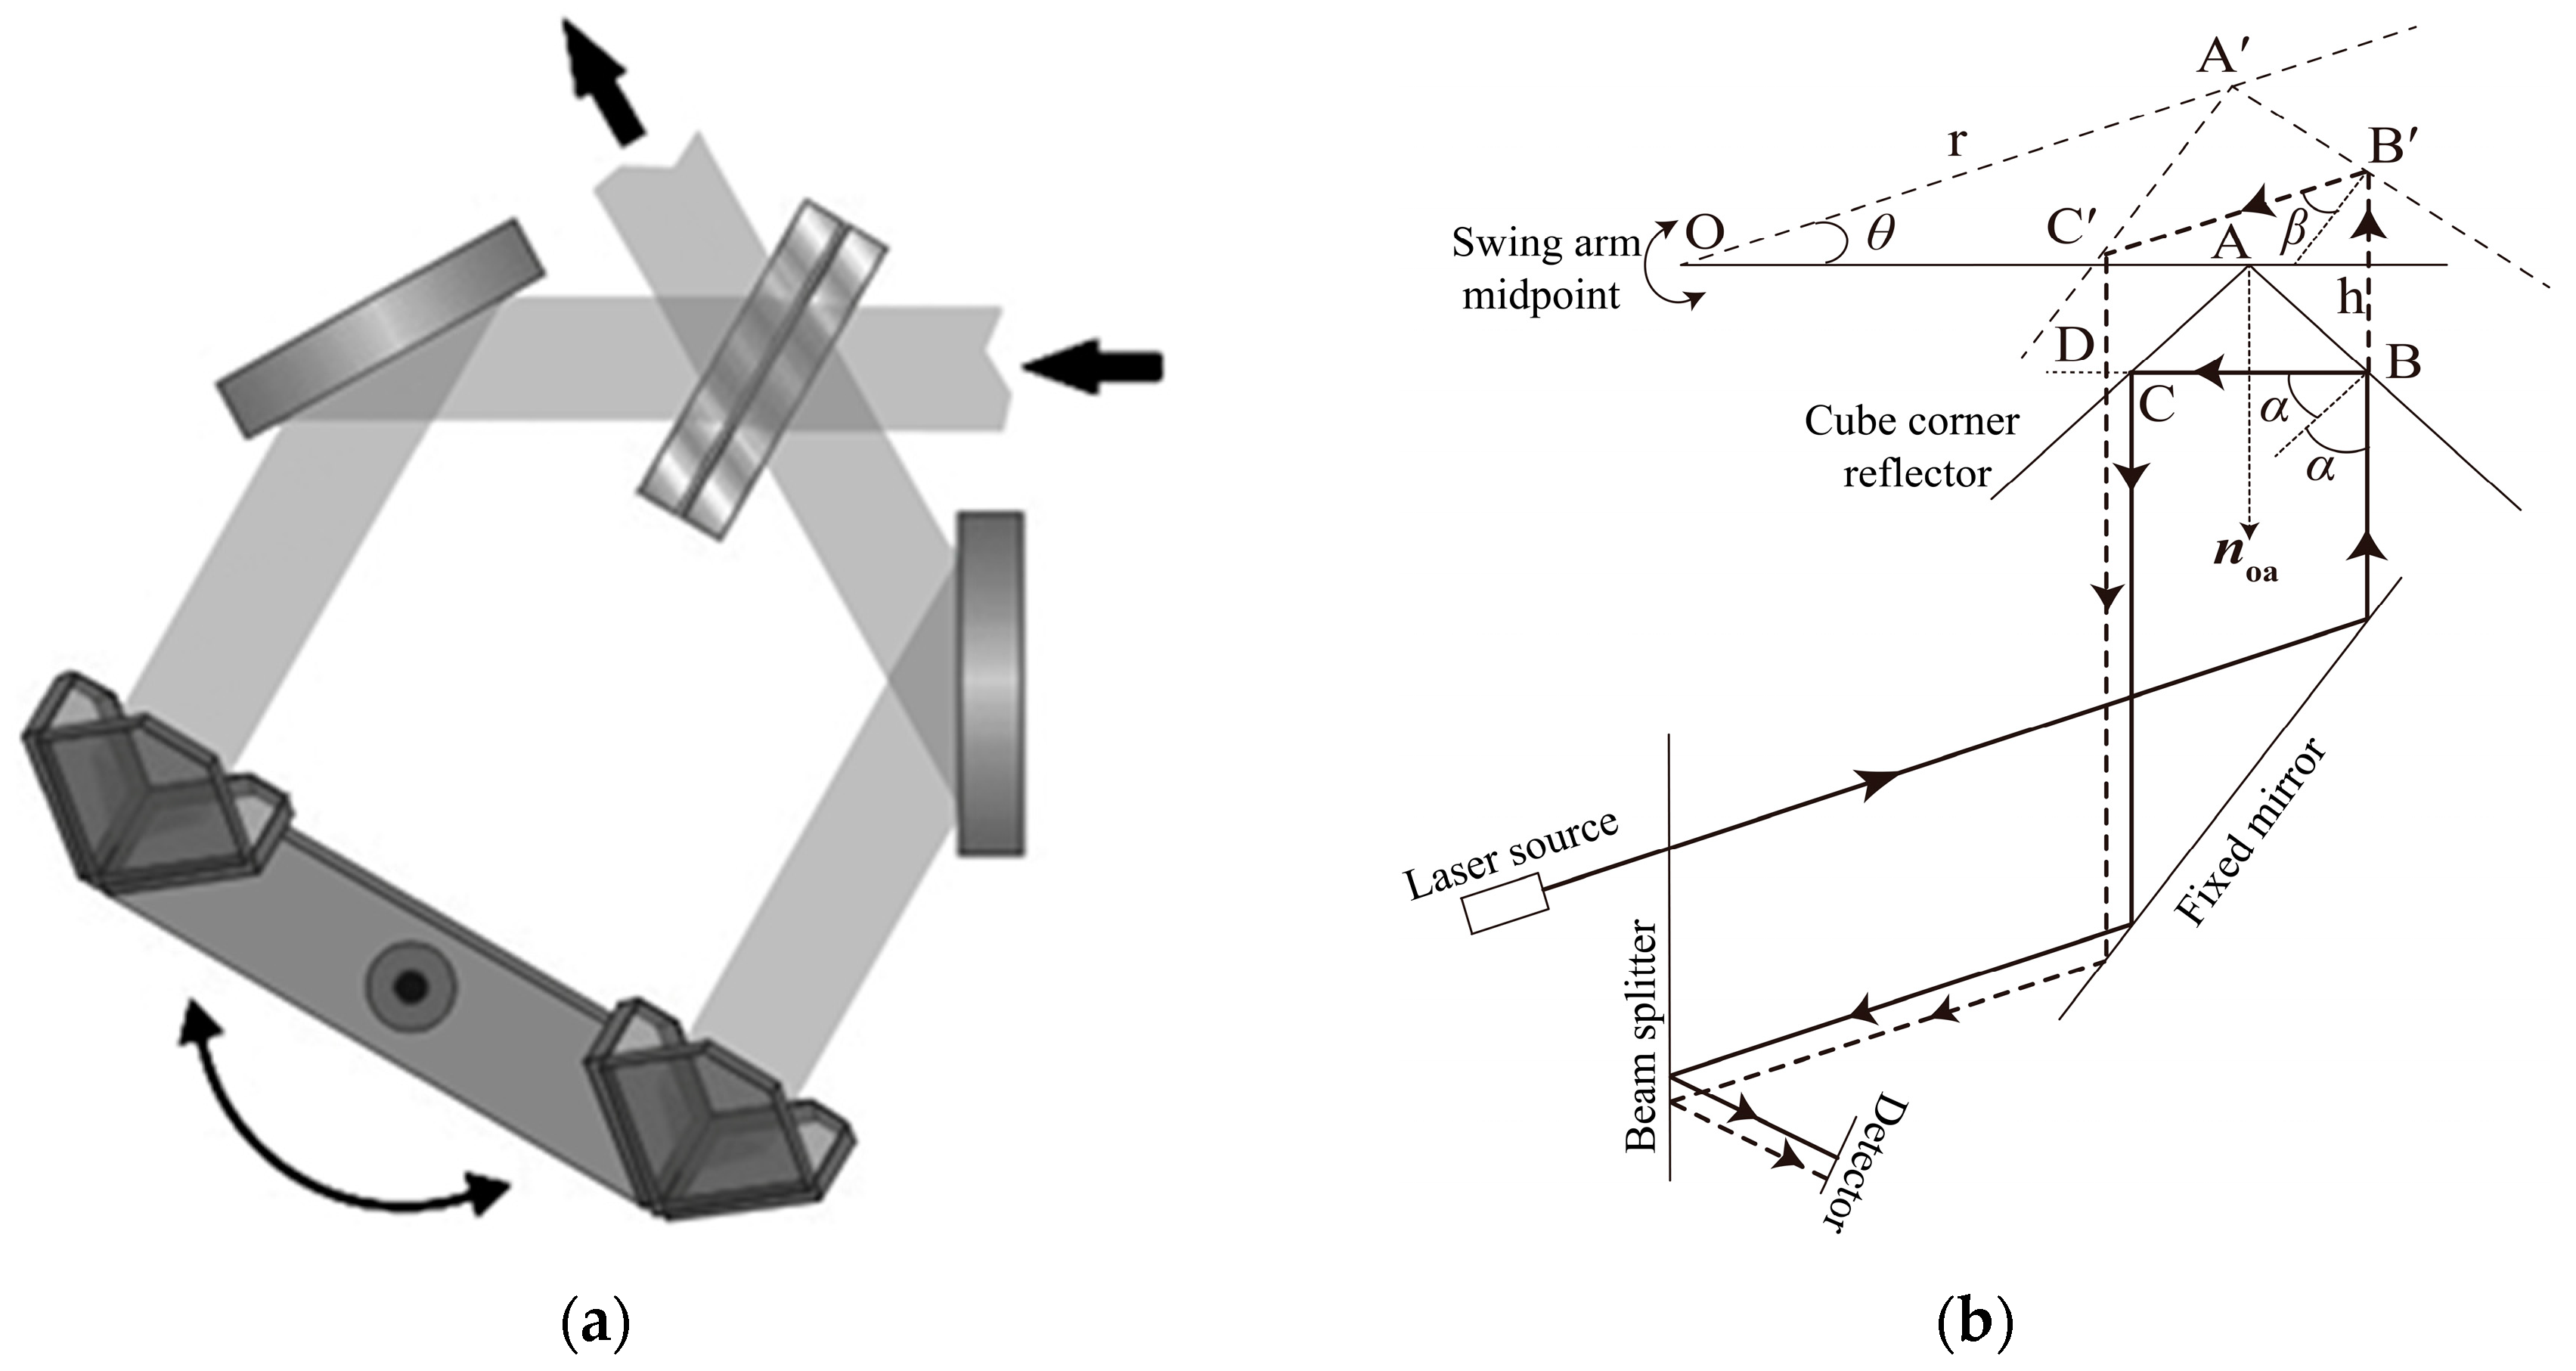
2.1.2. Interferometer Design

To ensure the stability of the spectrometer, the interferometer adopts a double-moving mirror-swinging structure, as shown in Figure 2. The interferometer consists of two cube corner reflectors, two plane fixed mirrors, a beam splitter, and a swing arm. Each cube corner reflector consists of three pieces of gold-coated K9 glass. One side of each K9 glass substrate is polished and coated with gold. K9 glass is a low-cost optical glass with excellent optical performance. The reflectivity of gold film in the NIR, MIR, and FIR bands is extremely high, above 90%, making it an ideal infrared reflective material [23]. Both plane fixed mirrors are also gold-coated K9 glass. Two cube corner reflectors are symmetrically fixed on the swing base of the interferometer. When the swing base rotates back and forth around its axis, a varying OPD is generated between the two coherent light beams reflected back to the beam splitter by the fixed mirrors. The symmetrical swing layout can offset disturbances and enhance the stability of the interferometer. The cube corner reflectors can reduce the requirements of optical path collimation, so the dynamic correction of the moving mirror is not necessary. Moreover, the cube corner reflector can fold the light, so that the moving mirror moves a relatively small distance to obtain a large OPD, making the interferometer more compact. At the same time, the inclination angle of fixed mirrors are changed, so that the angle between the incident and output light is 30°, and the luminous flux is 1.4 times that of the traditional 45° angle, which improves the energy efficiency.
As shown in Figure 2b, point O is the center of the swing arm and point A is the vertex of the corner reflector. Assuming that the swing arm swings θ around point O and reaches point A’, the OPD generated by this movement is
δ = l B B + l B C + l C D l B C
According to their geometric relationship, Equation (4) can be obtained:
l B B = r sin θ ( r + h r cos θ ) tan β + h l B C = r + h r cos θ sin β cos β l C D = l B B l B C cos 2 β l B C = 2 h
where r is the arm length of the swing arm. According to the optical path design in Figure 2b, the light needs to enter and exit the corner mirror twice, and the two sides of the swing arm are symmetrical. As the swing arm swings, the OPD of the interferometer can be obtained as
O P D = 2 δ = 2 2 r sin θ = 4 r sin θ
When the truncation function adopts a rectangular window function, the resolution of the interferometer is expressed as
Δ σ = 1 2 O P D = 1 8 r sin θ
When the resolution of the interferometer is 0.25 cm−1 and the length of the swing arm is 45 mm, the maximum swing angle of the swing arm is 6.379°. The maximum swing angle of the designed double-moving mirror swing interferometer is greater than 6.379°.
The beam splitter in the interferometer is a transmission element in the optical path. Its substrate and film material limit the working band of the interferometer. This spectrometer adopts a switching beam splitter to achieve wide band coverage. A range of 350–8000 cm−1 is covered by a multi-layer germanium metal-coated potassium bromide beam splitter, which maintains a 50/50 transmission and reflection ratio within this band. In addition, a calcium fluoride beam splitter is used in the working band of 4000–13,000 cm−1, and a high-purity silicon beam splitter is used in the working band of 50–600 cm−1. At present, the switching of beam splitters is performed by manually replacing accessories.
In an FTIR spectrometer, the moving mirror is the only component that is constantly moving. The accuracy and stability of the moving mirror’s movement directly determines the performance of the spectrometer. The interferometer module uses a rotary voice coil motor (RVCM) to directly drive the swing mirror. In order to achieve the required control accuracy and stability, the interferometer adopts a linear active disturbance rejection controller (LADRC) with adaptive feedforward compensation [24,25]. The structure of the controller is shown in Figure 3. Results show the stability and tracking accuracy of the control system are effectively improved. The maximum root mean square error of the OPD change rate of this solution can reach 0.7%, which is far less than 2%, meeting the requirements of equal OPD sampling of the interferometer.

2.1.3. Infrared Detector Selection

The proposed FTIR spectrometer is designed with two infrared detector components, which achieve spectrum coverage by switching detectors. InGnAs infrared detectors have a high response to the NIR band, so InGnAs infrared detectors are selected for the 4000–13,000 cm−1 spectral range. As a photovoltaic PIN photodiode, it has a faster response time, higher quantum efficiency, and smaller dark current. DLATGS detectors are selected for the MIR and FIR bands. In view of the limitations of the detector window transmittance, the spectrometer is equipped with two switchable DLATGS detector units, which are covered with KBr windows (350–8000 cm−1) and high-density polyethylene film windows (50–600 cm−1), respectively.

2.2. Electronics System Design

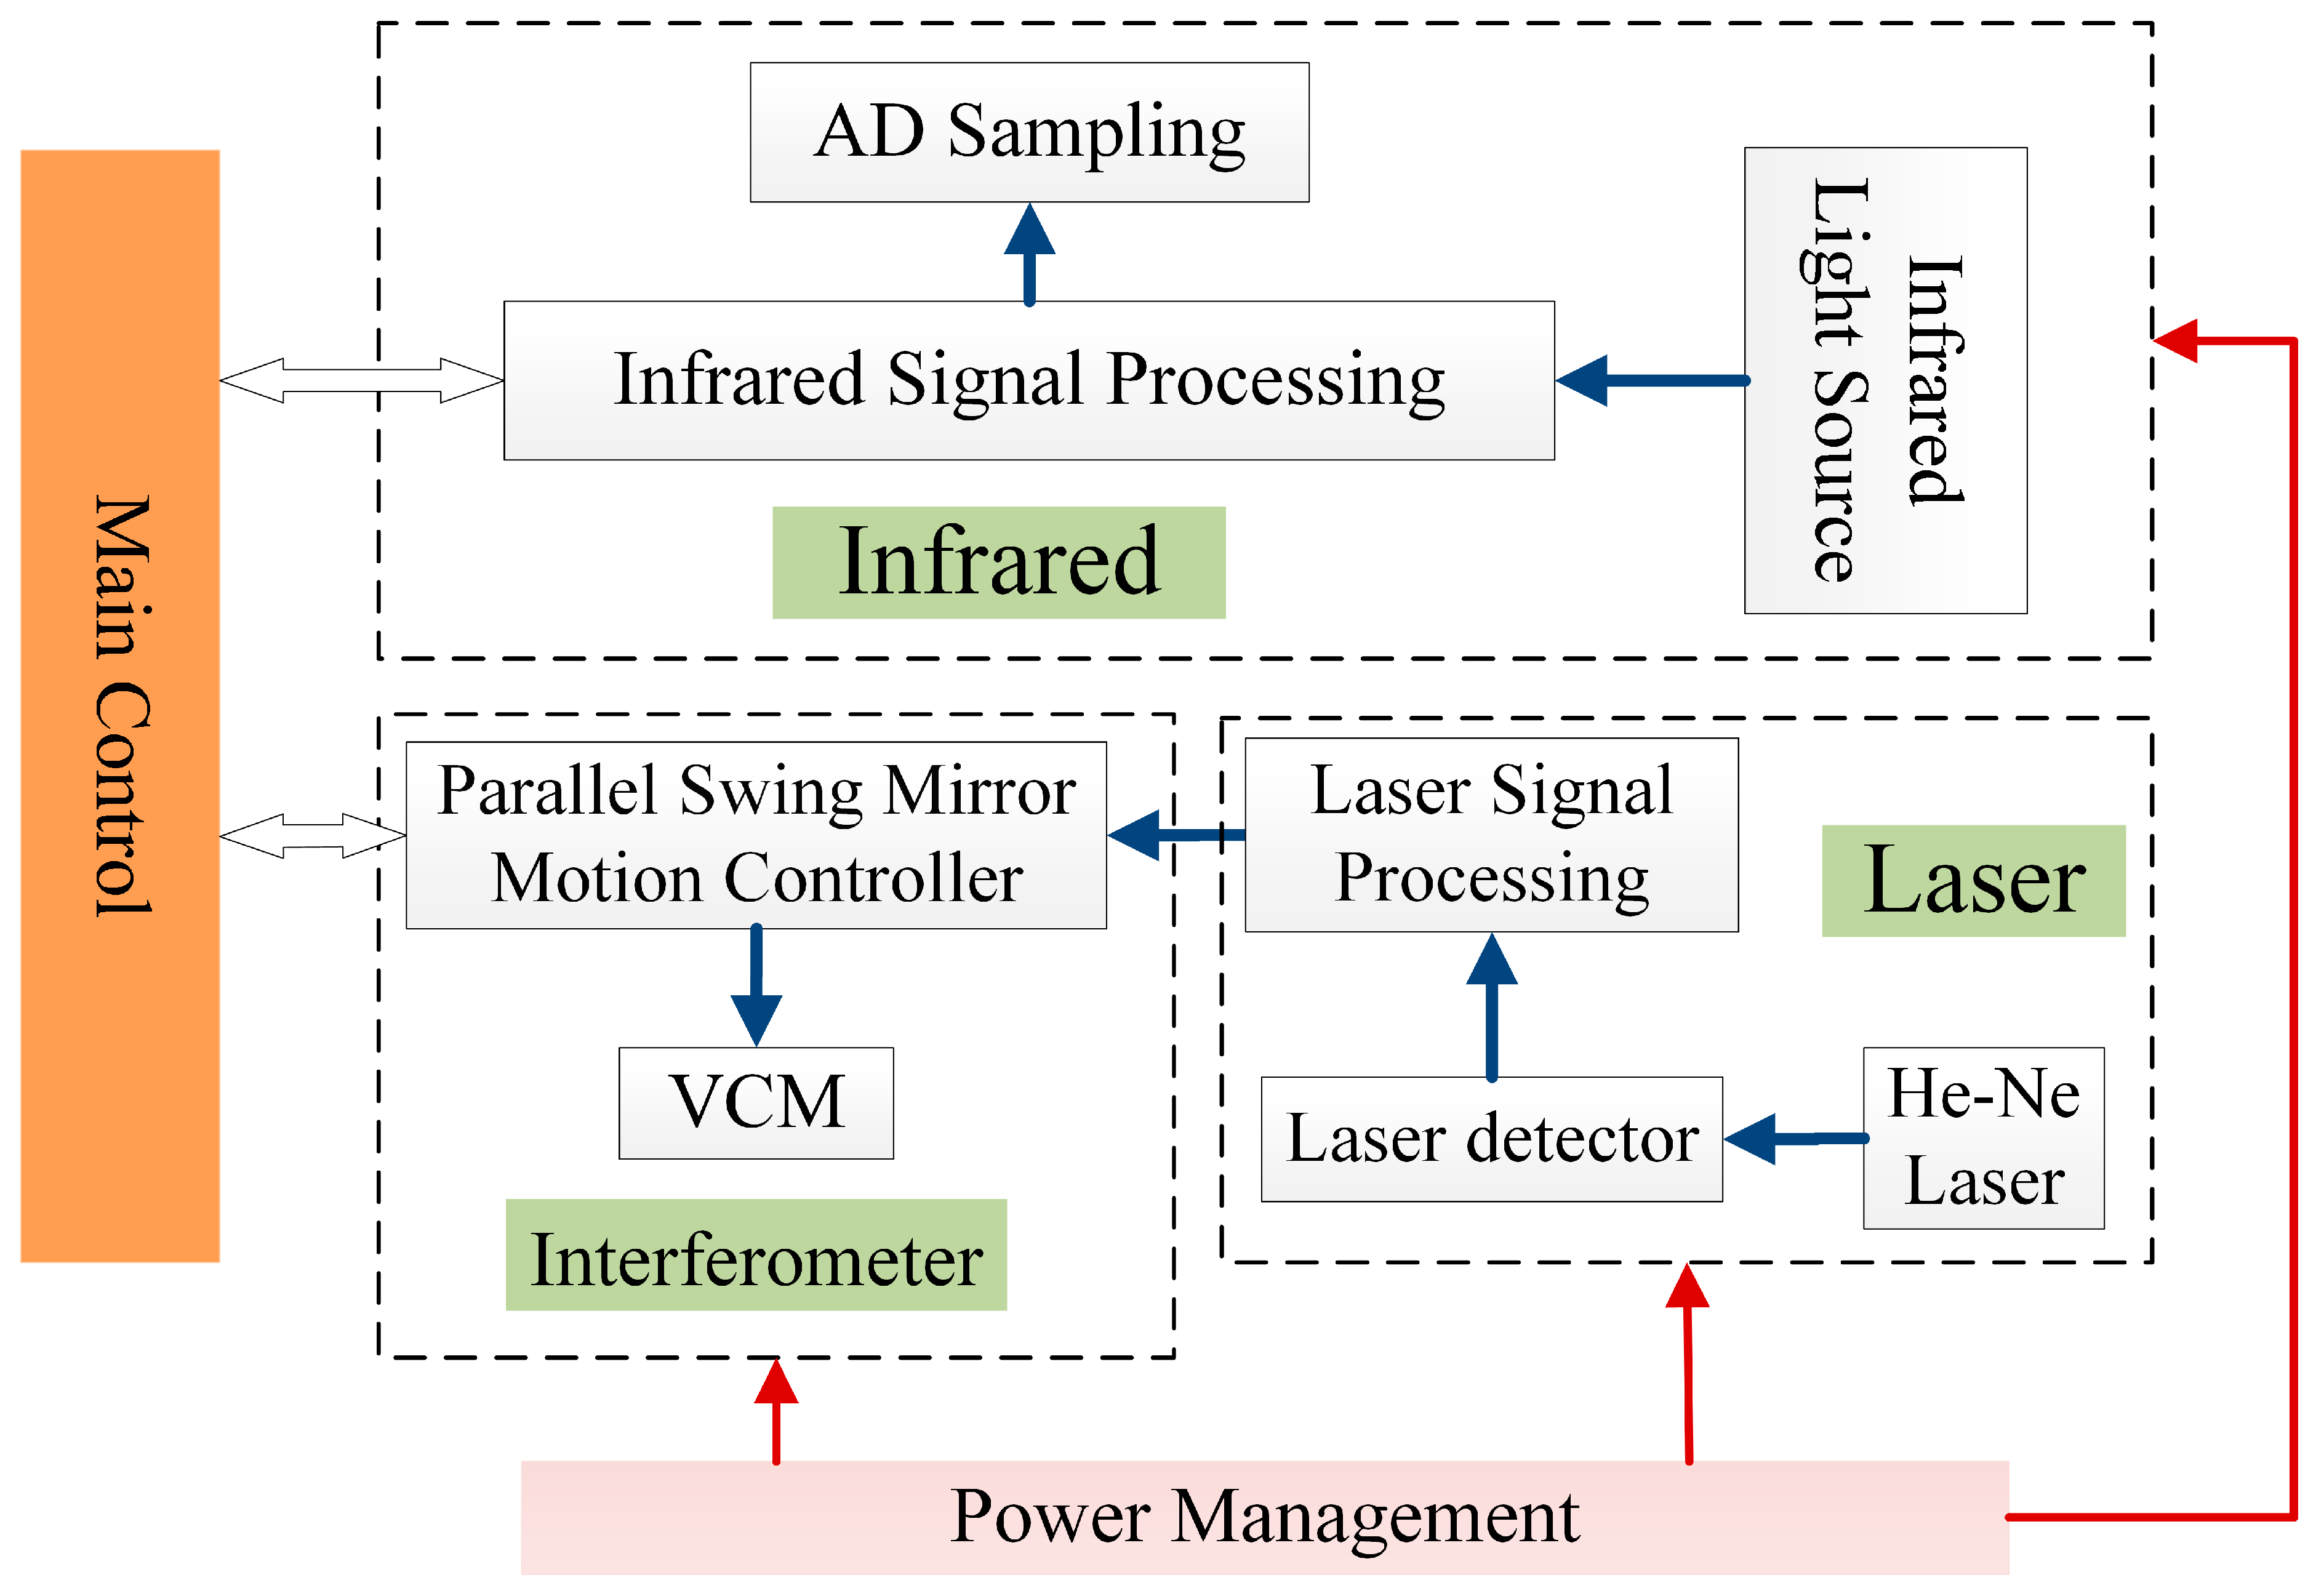
2.2.1. Electronics System Division

In order to ensure lightweight and low power consumption, the electronics system of the ultra-wide-band FTIR spectrometer adopts a distributed design route of digital system integration and analog system integration. As shown in Figure 4, according to the components of this instrument, the electronics system can be divided into six units, namely main control, laser signal processing, parallel swing mirror motion controller, infrared signal processing, AD acquisition, and power management. The six units cooperate with each other to realize the instrument’s functions.
The main control is the core of the proposed FTIR spectrometer, responsible for system instruction parsing and distribution, data preprocessing and transmission, etc. Power management mainly provides different input power supplies for other functional units of the system, and obtains high-quality input voltage through overvoltage protection, surge suppression, AC-DC conversion, DC-DC, and other conversions. The moving mirror motion controller is responsible for the motion control of the moving mirror. Laser signal processing realizes the detection of He-Ne reference laser. After amplification, filtering, and shaping, it is input into the moving mirror motion controller to provide feedback for the change speed of the OPD. Infrared signal processing is responsible for amplifying and filtering the signal detected by the infrared light detector, and for completing the analog-to-digital (AD) conversion through AD sampling and transmitting it to the main control. Finally, the processing of the interference data and inversion calculation of the spectrum is performed by the PC.

2.2.2. High-Speed Data Acquisition and Transmission Interface

The proposed FTIR spectrometer is capable of wide range of spectral measurement with high resolution and large information throughout. At the same time, in order to adapt to the real-time nature and miniaturization of modern equipment, the spectrometer adopts a real-time high-speed data acquisition and transmission system based on ZYNQ and USB 3.0 interface. The system mainly includes the main control module, interface module, and front-end signal input module, as shown in Figure 5.
The front-end signal input module receives raw infrared interference signals, laser interference signals, and other data; the main control module is used to receive data and perform various preprocessing operations, such as filtering and down-sampling. The interface module is used to receive data processed by the main control module, transmit it to the PC through the USB 3.0 interface, receive control instructions sent by the PC, and report the current system status. Compared with PCIe, USB 3.0 interface is more versatile and simple, and most PCs are equipped with USB 3.0 interface. The maximum transmission rate of USB 3.0 can reach 5 Gbps, which is more than 10 times higher than that of USB 2.0, and higher than the transmission rate of single-chip microcomputer or Ethernet port solution among the existing technologies. In addition, the USB 3.0 package size is small, which meets the requirement of miniaturization of the overall system. The communication between the interface module and the host computer is realized by RS422 serial port. The main control uses a heterogeneous platform of FPGA+CPU for data processing, and can perform customized processing of data according to specific needs, such as fast Fourier transform, quantitative analysis, etc. In the future, the size of the spectrometer could be further reduced and the real-time performance of the data could be enhanced.

2.3. Data Acquisition and Processing

The main control FPGA unit receives commands from the PC and controls the spectrometer to work with the corresponding spectral resolution, moving mirror scanning speed, spectral range, and other parameters. At the same time, it receives the collected original infrared interference signal data and the feedback from the moving mirror movement speed data, and forwards them to the PC.
The PC receives the original interference data and moving mirror motion speed data, performs joint processing, and obtains the interference pattern data. The interference pattern data need to undergo a series of processing before FFT processing [26]. First, zero-filling processing is performed, and the zero-filling processing can make the final restored spectrum more detailed. After zero-filling, apodization is performed. Commonly used apodization functions include rectangular window, triangular window, Bessel window, cosine window, Gaussian window, etc. The apodization function can be selected according to the spectral resolution, SNR, and other requirements of the spectrometer. Since the interference pattern after the above processing has good symmetry, the Mertz method is selected to perform phase correction on the interference pattern, and then the final spectrum data are obtained by FFT processing.

3. Experiments and Results

The assembled FTIR spectrometer is shown in Figure 6. The spectrometer adopts a distributed modular design, which mainly includes five parts: the housing, front light path, sample chamber, detection unit, and control and data processing unit. The distributed modular design reduces the direct interference between the optoelectronic modules and is more convenient and beneficial for regional environmental control.
The FTIR analyzes the chemical composition and structural information of a sample by measuring the absorption, transmission, or reflection characteristics of the sample in the infrared band. We verified the performance of the developed FTIR spectrometer through a series of spectral measurement experiments. The developed FTIR spectrometer was placed in a clean, dust-free, vibration-isolated, and electromagnetic interference-free laboratory. The ambient temperature in the laboratory was maintained at 25 °C and the relative humidity was maintained below 60%.

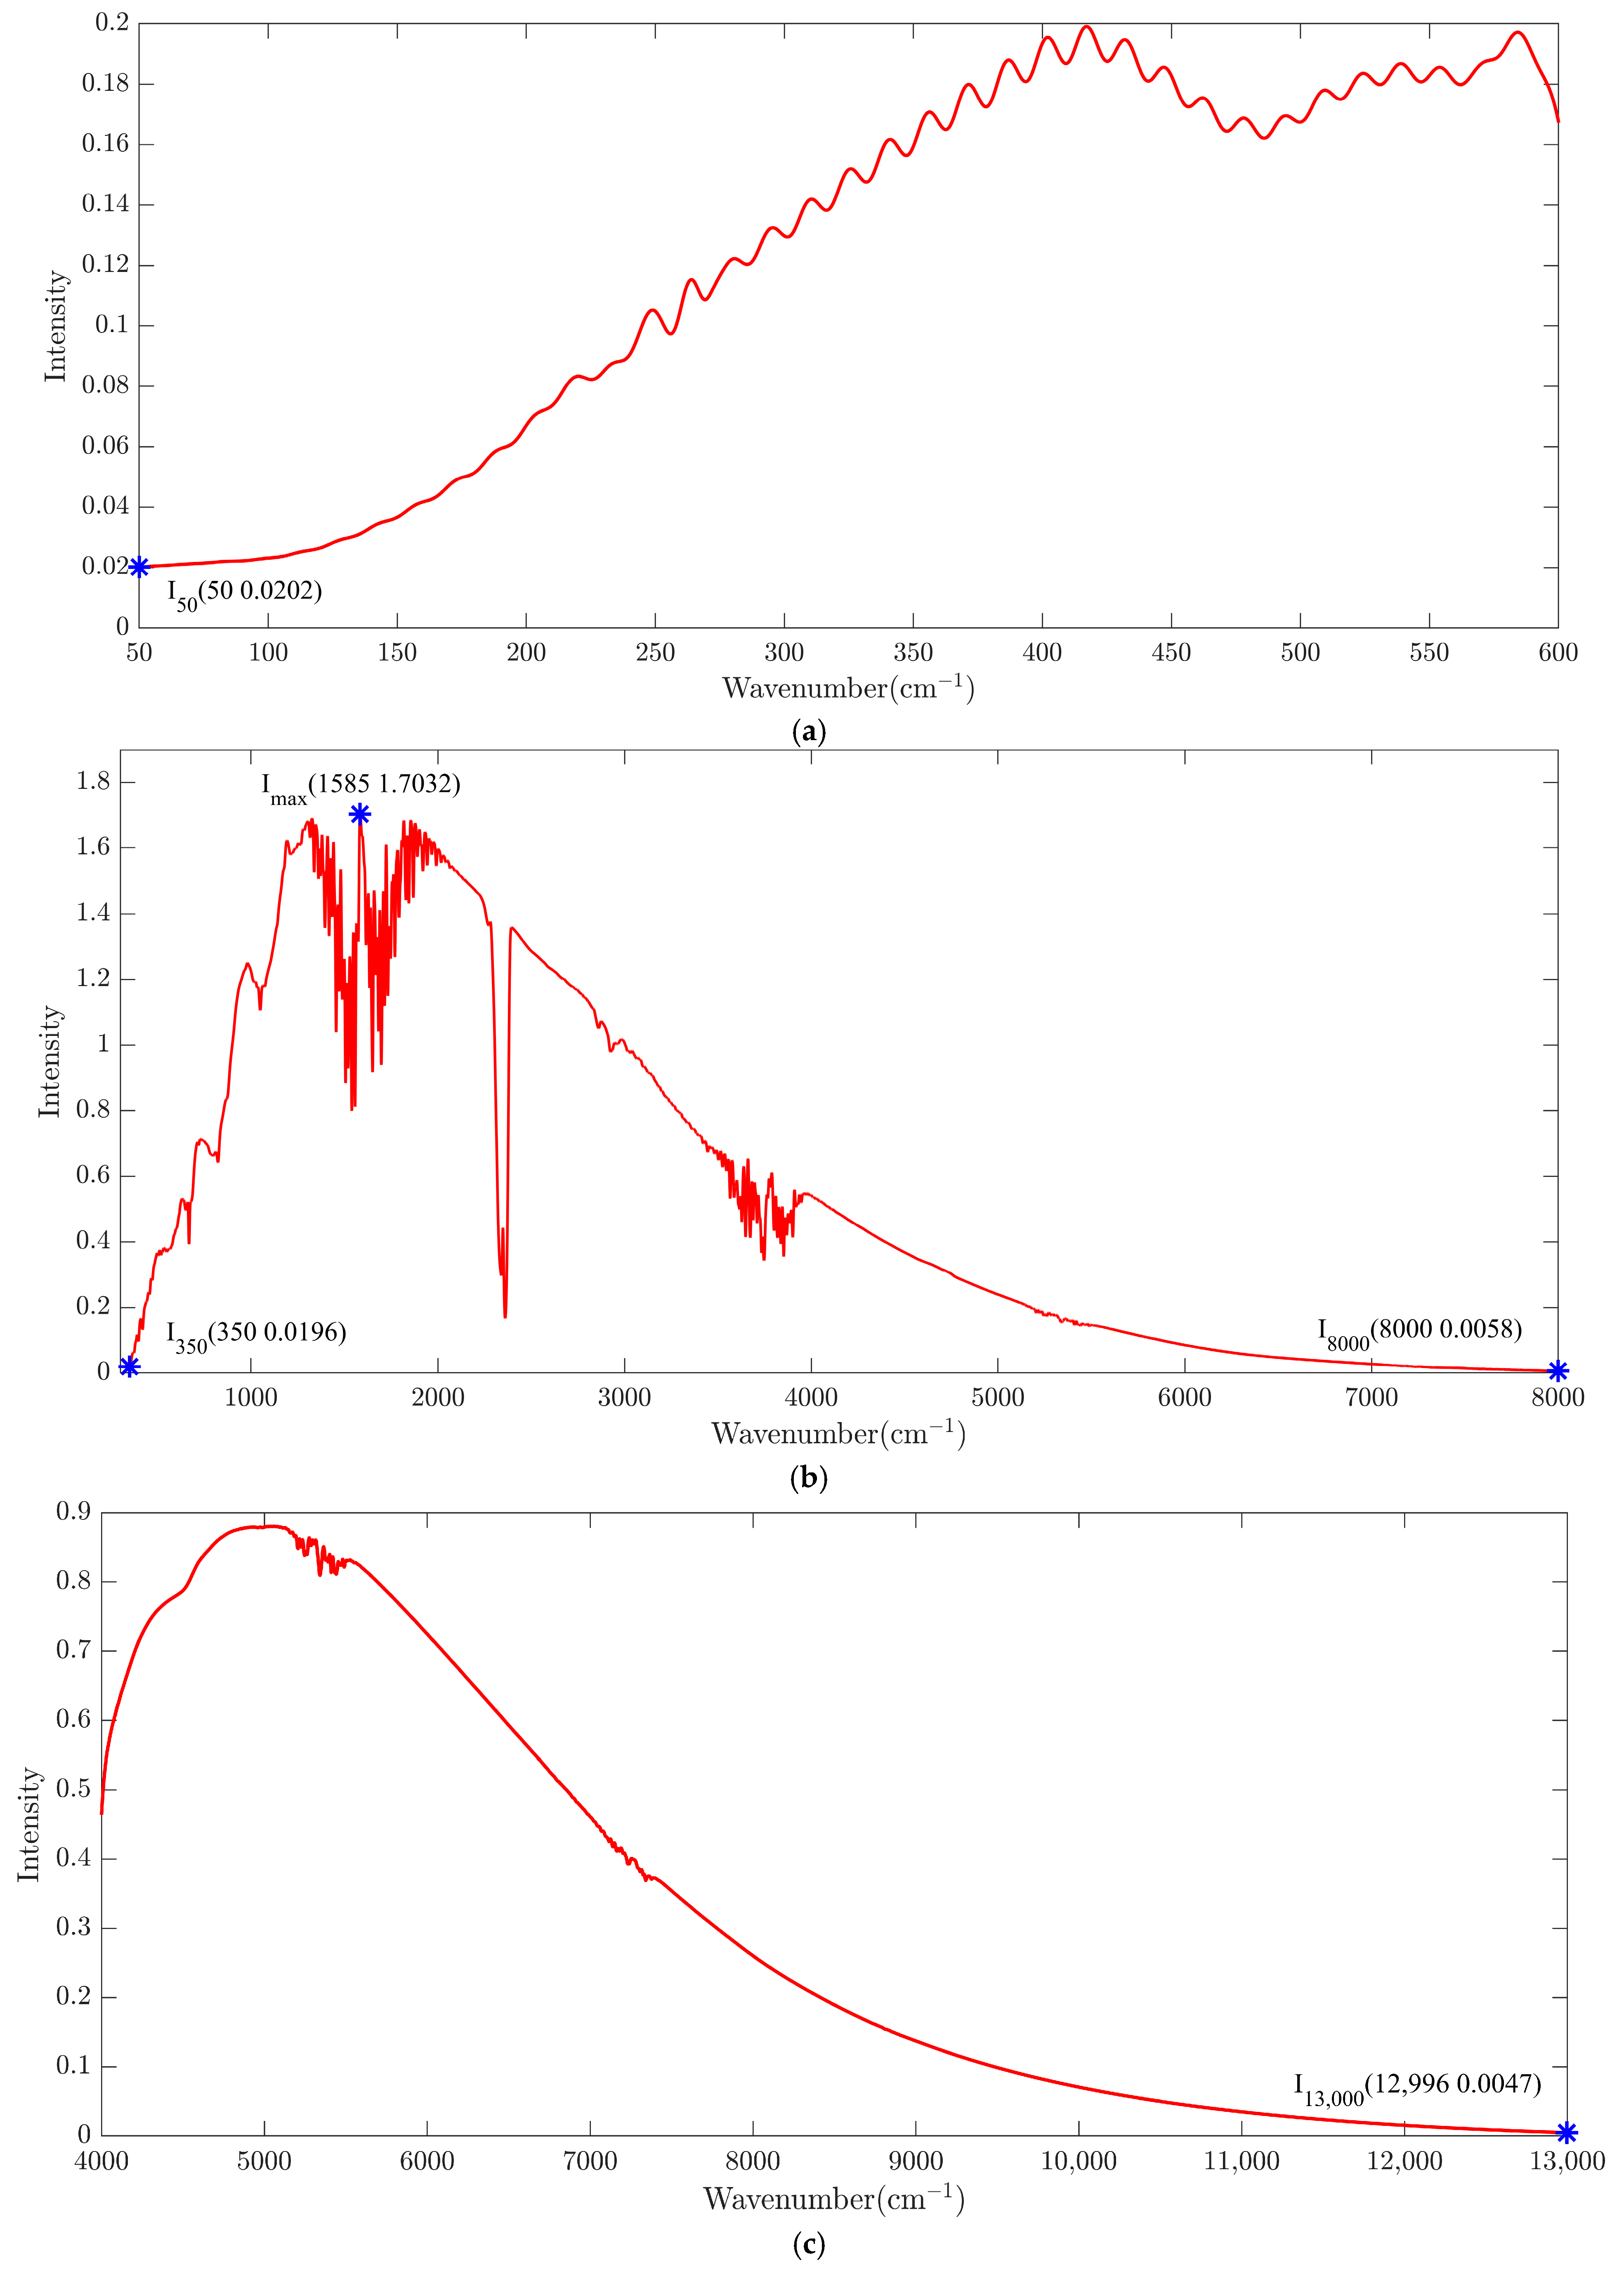
3.1. Spectral Range Measurement

Before using the ultra-wide-band FTIR spectrometer, the spectral range had to be determined. The spectrum of air was measured to verify the spectral range of the spectrometer, and the measurement results are shown in Figure 7. As shown in Figure 7, the ultra-wide-band FTIR spectrometer could effectively detect the NIR band, MIR band, and FIR band, and the spectral range of the spectrometer covered 0.770–200 μm.

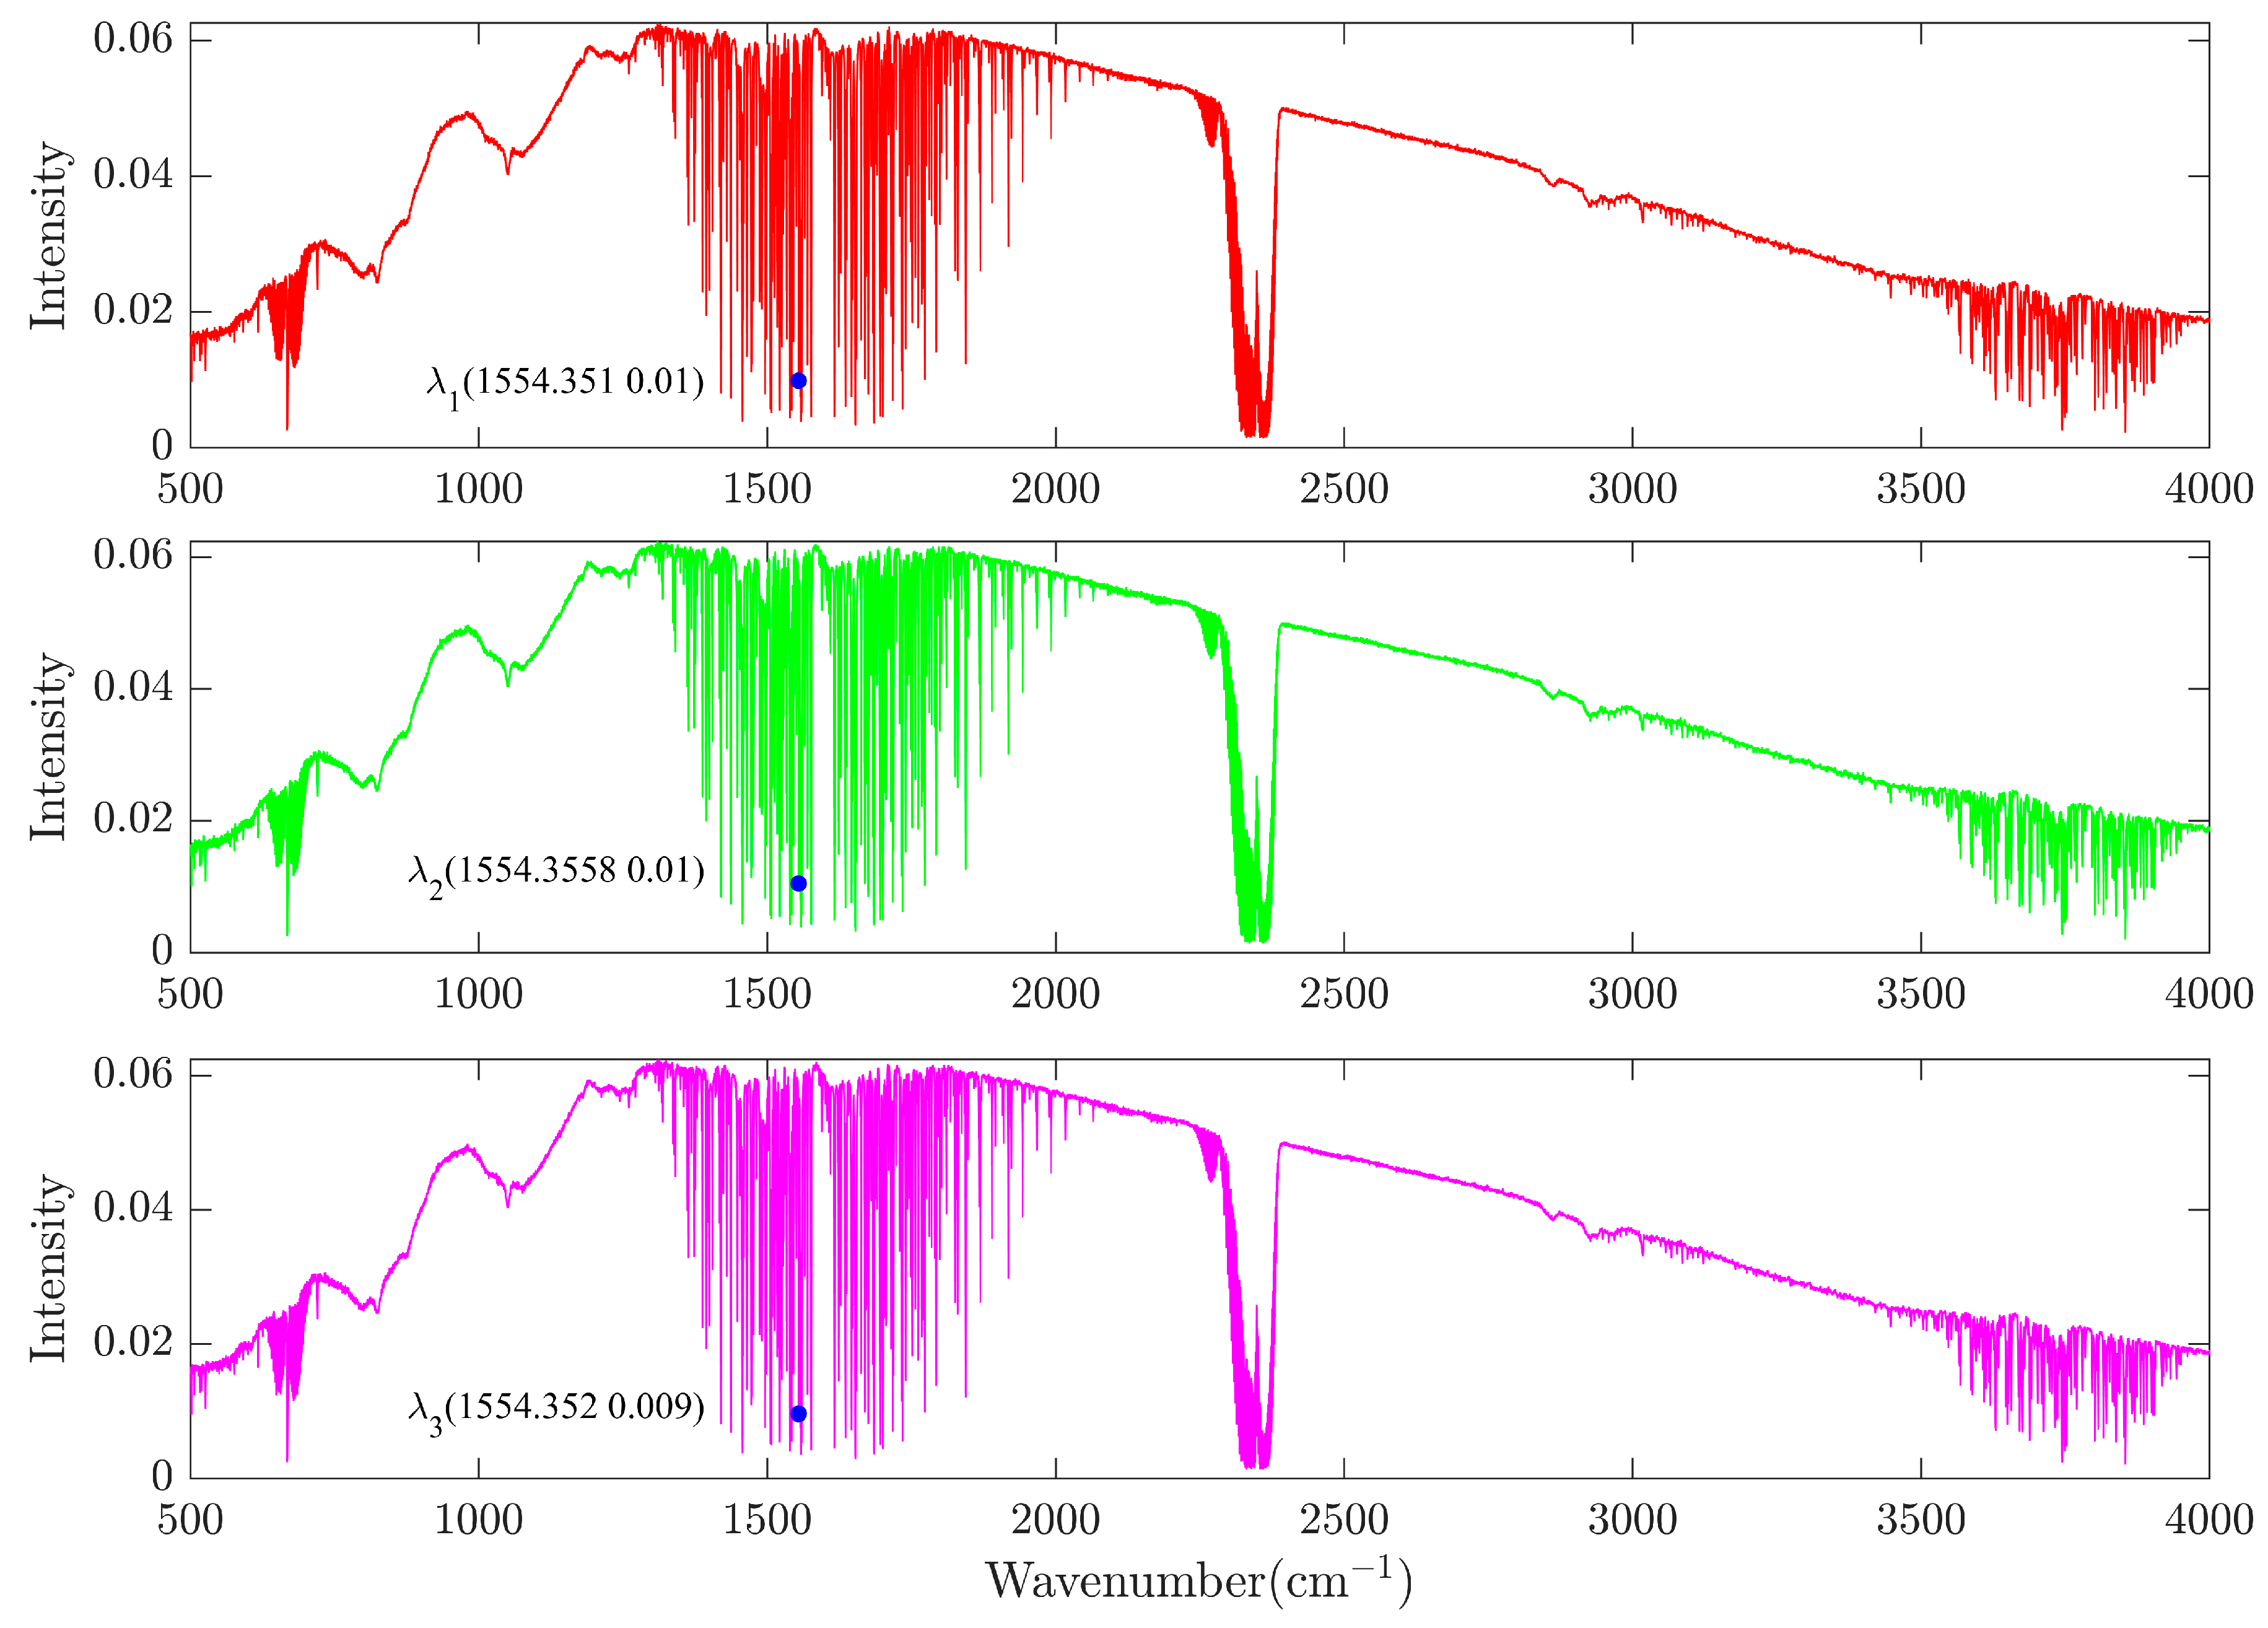
3.2. Spectral Resolution Measurement

The spectral resolution of the FTIR spectrometer is determined by its maximum OPD and the apodization function. Using different apodization functions will result in different spectral resolutions; however, under every condition the spectral resolution is inversely proportional to the maximum OPD [27]. The spectral resolution of the spectrometer has nothing to do with the spectral range. The absorption peak of the CO absorption spectrum is narrow and sharp, its spectral line position is clear, and its sensitivity is high, so the spectral resolution of the proposed FTIR spectrometer was verified by measuring the full width at half maximum (FWHM) of the characteristic absorption peaks of CO gas. A rectangular window function was used as the apodization function. A spectrum of 500–4000 cm−1 was selected for the measurement. The negative-pressure CO gas cell shown in Figure 8 was placed in the sample chamber, and the absorption spectrum of the sample was collected. The FWHM of the absorption characteristic peak was calculated using the software OPUS 7.8.
The absorption spectrum of the CO gas measured is shown in Figure 9, and the FWHM of the characteristic absorption peaks of the CO gas are shown in Table 1.
Combining Figure 9 with Table 1, it can be seen that 2170 cm−1 is a very obvious characteristic peak of CO gas, and its FWHM is less than 0.25 cm−1, indicating that the measured spectral resolution of the proposed FTIR spectrometer reached 0.25 cm−1.

3.3. Wave Number Accuracy Measurement

The wave number accuracy of a spectrometer directly affects the accuracy of the spectral analysis and qualitative identification. The wave number accuracy of the instrument was verified by measuring the characteristic peak position of water vapor. A measurement range of 500–4000 cm−1 was selected, and the peak position of the water vapor spectrum was marked and recorded. The measurement was repeated three times, and the deviation δ from the 1554.353 cm−1 characteristic peak of standard water vapor was calculated according to Equation (7).
δ i = λ i 1554.353
Figure 10 shows the spectrum of the measured water vapor spectrum, and the maximum deviation δ max is 0.003. Therefore, this spectrometer has a very high wave number accuracy.

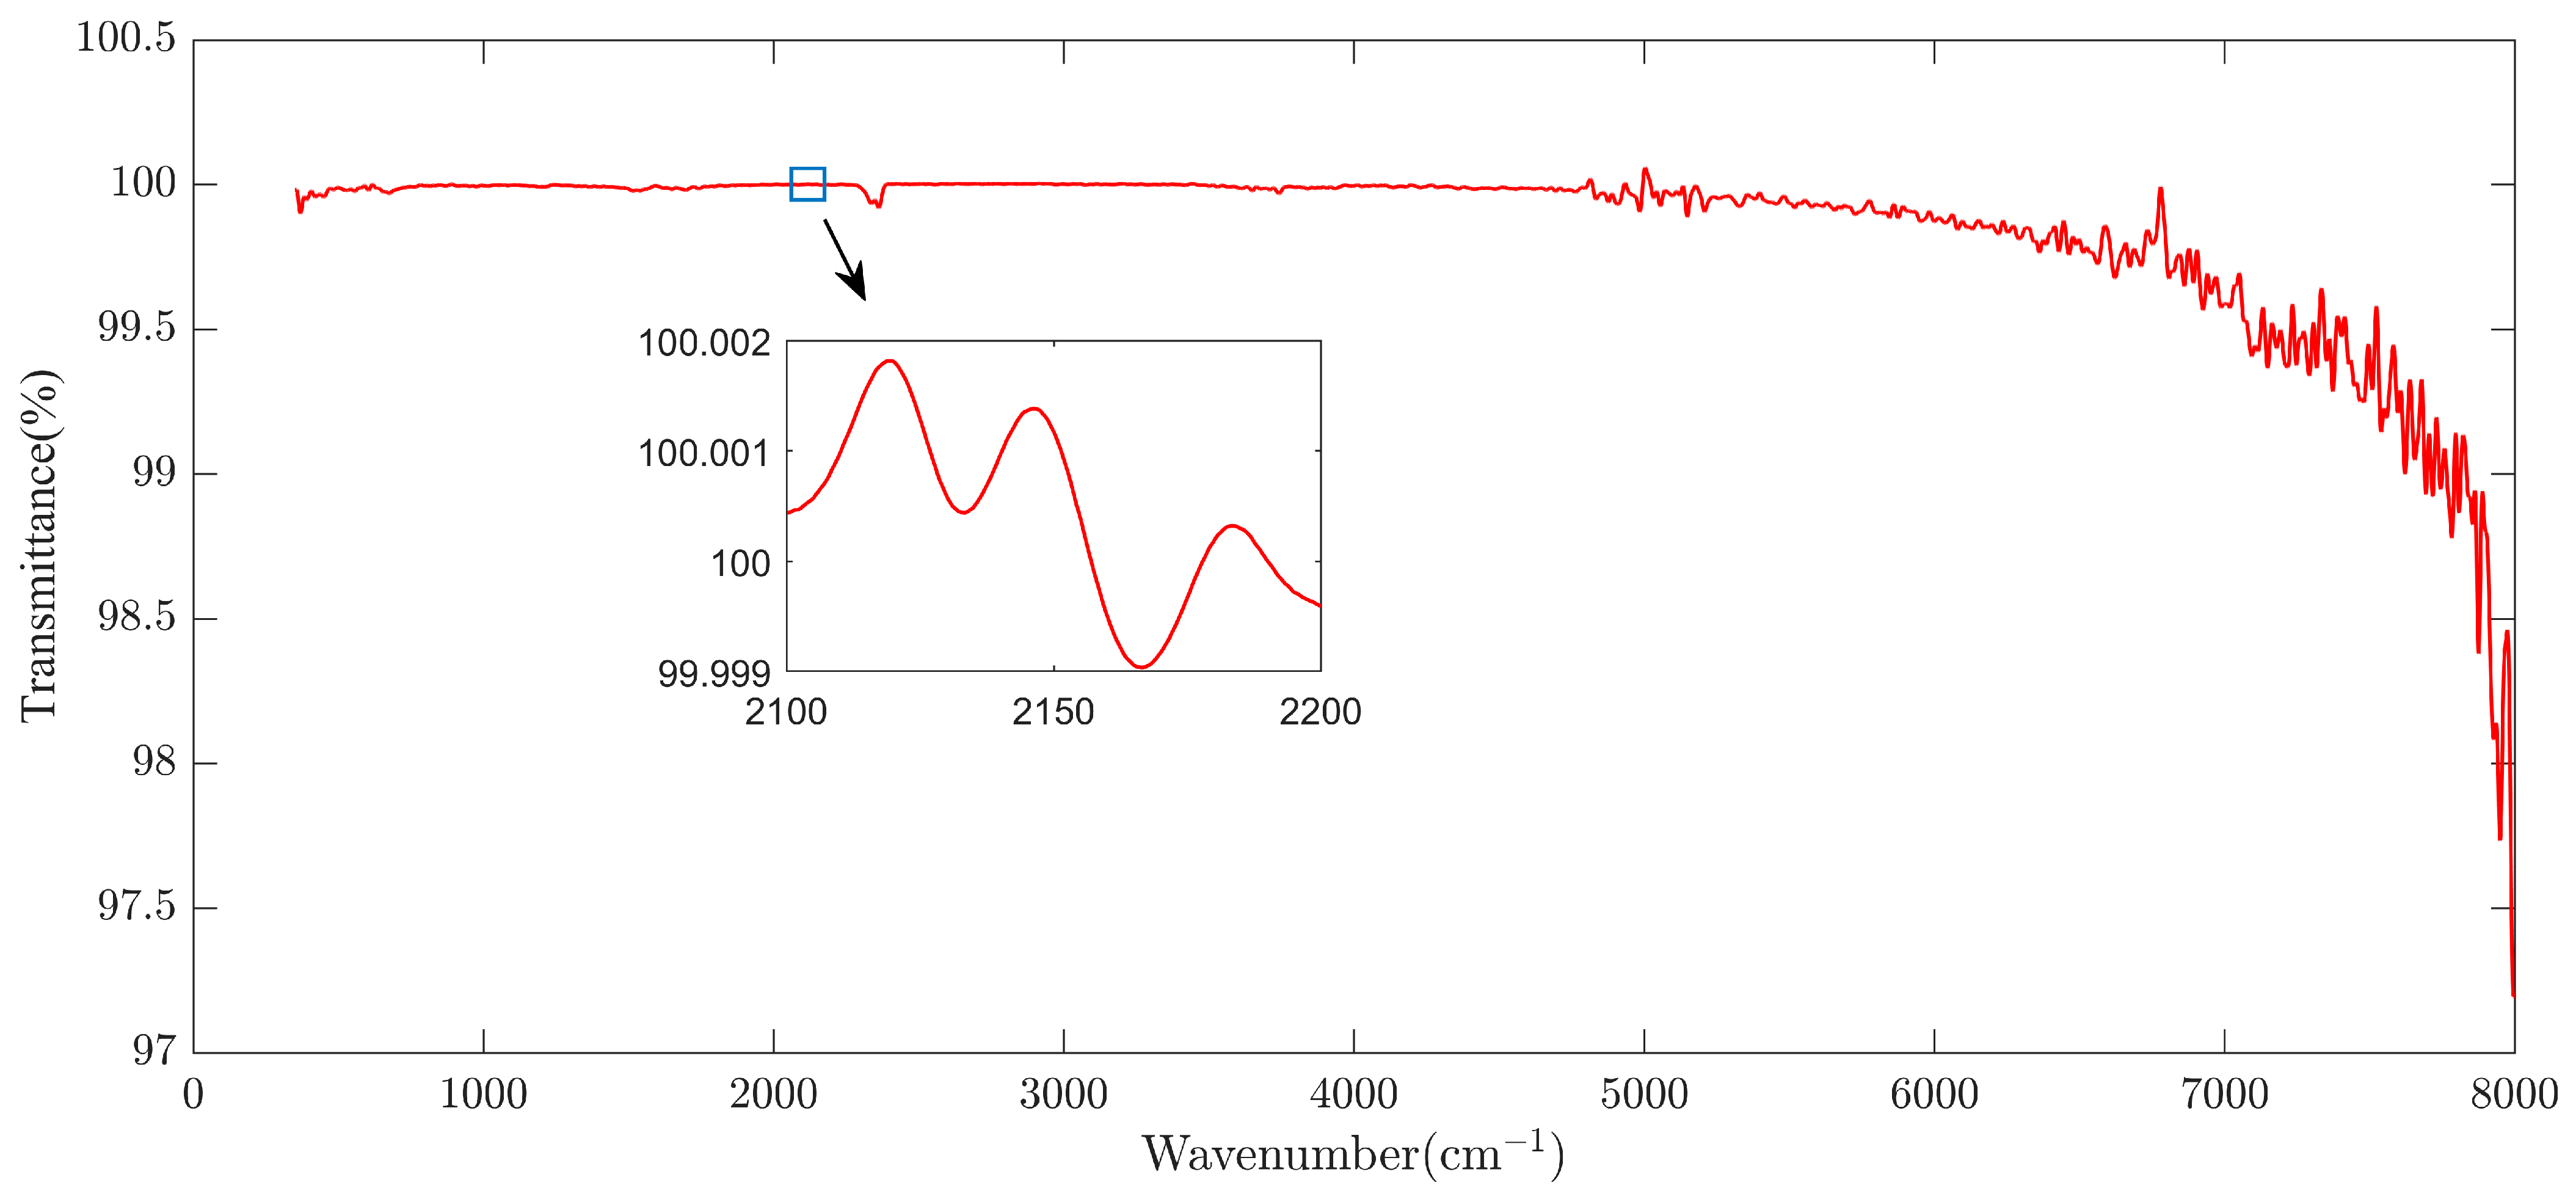
3.4. SNR Measurement

The SNR is a very important technical indicator for measuring the performance of a spectrometer. The proposed FTIR spectrometer used air as the sample, and the spectral resolution of the spectrometer was set to 4 cm−1. The transmission spectrum of the air was continuously collected for 1 min to calculate the SNR of the instrument. In order to prevent moisture and CO2 in the air from affecting the measurement accuracy of the instrument, N2 was used to purge the instrument for one hour before the measurement. Because the background spectrum in the 2100–2200 cm−1 band was clean and the baseline was stable, it was suitable for evaluating the SNR of spectral instruments and met international standards.
As shown in Figure 11, the characteristic peak intervals of moisture and CO2 were avoided, and the spectrum range of 2100–2200 cm−1 was selected to analyze the SNR. The SNR was calculated using OPUS 7.8 software. The SNR calculation principle of OPUS 7.8 is usually based on the following steps: first, select the peak intensity of a characteristic peak in the spectrum as the signal intensity, then select the baseline area without characteristic peaks and calculate the intensity standard deviation of this area as the noise intensity, and finally divide the signal intensity by the noise intensity to obtain the SNR. The SNR was 50,030:1 as calculated by OPUS 7.8, so the SNR of the proposed FTIR spectrometer was better than 50,000:1.

4. Conclusions

This paper introduces the system design of an ultra-wide-band FTIR spectrometer in detail. The overall design of the spectrometer was completed by combining an optical system, an electronic system, and a PC. A secondary imaging scheme was used to constrain the incident light, a two-way switchable light source and three-way switchable detector were set, and a compact and highly stable double-moving mirror swing interferometer was adopted to generate the OPD, thereby achieving full coverage of the band range of 0.770–200 μm. A distributed design route of digital system integration and analog system integration was adopted to reduce the power consumption of the spectrometer, and a high-speed data acquisition and transmission interface was designed to improve the real-time performance of the spectrometer. A series of spectral measurement experiments were designed to verify the ultra-wide-band FTIR spectrometer. The experimental results showed that the developed FTIR spectrometer has an accurate wavenumber, a spectral resolution of 0.25 cm−1, and an SNR better than 50,000:1. A series of performance tests of the proposed FTIR spectrometer showed that the spectrometer can meet most application requirements of a laboratory. This design has important reference significance for the development of high-end FTIR spectrometers. Our next work will focus on a more in-depth characterization of the proposed ultra-wide-band FTIR spectrometer.

Author Contributions

Conceptualization, M.H., W.H. and L.Z.; methodology, L.Z.; writing—original draft preparation, L.Z.; writing—review and editing, S.Y. and F.L.; visualization, Z.Z. and H.G.; project administration, M.H. All authors have read and agreed to the published version of the manuscript.

Funding

This work was supported in part by the National Natural Science Foundation of China (No. 62101533), in part by a Key Deployment of the Chinese Academy of Sciences (No. E3Z204010F), and in part by a fellowship from the China Postdoctoral Science Foundation (Certificate Number: 2023M733581).

Data Availability Statement

All the data used to support the findings of this study are available from the corresponding author upon request.

Conflicts of Interest

The authors declare no conflicts of interest.

References

  1. Cherniienko, A.; Lesyk, R.; Zaprutko, L.; Pawełczyk, A. IR-EcoSpectra: Exploring sustainable ex situ and in situ FTIR applications for green chemical and pharmaceutical analysis. J. Pharm. Anal. 2024, 14, 100951. [Google Scholar] [CrossRef] [PubMed]
  2. Hutchinson, G.; Welsh, C.D.M.; Burés, J. Use of Standard Addition to Quantify In Situ FTIR Reaction Data. J. Org. Chem. 2020, 86, 2012–2016. [Google Scholar] [CrossRef] [PubMed]
  3. Geminiani, L.; Campione, F.P.; Canevali, C.; Corti, C.; Giussani, B.; Gorla, G.; Luraschi, M.; Recchia, S.; Rampazzi, L. Historical Silk: A Novel Method to Evaluate Degumming with Non-Invasive Infrared Spectroscopy and Spectral Deconvolution. Materials 2023, 16, 1819. [Google Scholar] [CrossRef]
  4. Tkachenko, Y.; Niedzielski, P. FTIR as a Method for Qualitative Assessment of Solid Samples in Geochemical Research: A Review. Molecules 2022, 27, 8846. [Google Scholar] [CrossRef]
  5. Lai, M.; Liao, Z.; Yang, R.; Zhou, Z.; Zhong, Q. Mineralogical and Spectral Characteristics of Tanzanite. Spectrosc. Spectr. Anal. 2018, 38, 2872–2876. [Google Scholar]
  6. Tiernan, H.; Byrne, B.; Kazarian, S.G. ATR-FTIR spectroscopy and spectroscopic imaging for the analysis of biopharmaceuticals. Spectrochim. Acta Part A Mol. Biomol. Spectrosc. 2020, 241, 118636. [Google Scholar] [CrossRef]
  7. Zhang, Z.B.; Wang, D.; Qiu, Q.Q.; Gao, Y.Q.; Zhou, W.; Wu, J.; Huang, Z.M. Optical properties of NiMnO4 and Mn1.56Co0.96Ni0.48O4 in broad band from Ultraviolet to far-Infrared. J. Infrared Millim. Waves 2020, 39, 65–67. [Google Scholar]
  8. Barreto, Á.; García, O.E.; Schneider, M.; García, R.D.; Hase, F.; Sepúlveda, E.; Almansa, A.F.; Cuevas, E.; Blumenstock, T. Spectral Aerosol Optical Depth Retrievals by Ground-Based Fourier Transform Infrared Spectrometry. Remote Sens. 2020, 12, 3148. [Google Scholar] [CrossRef]
  9. Feng, Y.T.; Sun, J.; Li, Y.; Wang, S.N.; Bai, Q.L. Broad band spatial heterodyne interferometric spectrometer. Opt. Precis. Eng. 2015, 23, 48. [Google Scholar] [CrossRef]
  10. Sun, C.; Yang, J.; Zhu, J.-W.; Ma, T.-T.; Feng, S.-L.; Song, N.; Guo, X.-Q.; Guo, H.-Z. Optical design of echelle spectrometer with ultra-wide wavelengthrange and high resolution. Opt. Precis. Eng. 2021, 29, 45. [Google Scholar] [CrossRef]
  11. Li, S.; Zheng, X.; Zhai, W. Design of Czerny-Turner spectrometer with wide band. Chin. J. Quantum Electron. 2022, 39, 293. [Google Scholar] [CrossRef]
  12. Zhu, X.M.; Bai, X.Y.; Lin, J.B.; Duan, W.; Deng, Y.Y.; Feng, Z.W.; Zhang, Z.Y.; Yang, X.; Guo, S.F.; Bai, Y. Design of Equal Optical Path Difference Sampling System for Wide Band Fourier Transform Solar Spectrometer. Acta Astron. Sin. 2023, 64, 14. [Google Scholar] [CrossRef]
  13. Song, Y.; Cong, Y.; Wang, B.; Zhang, N. Applications of Fourier transform infrared spectroscopy to pharmaceutical preparations. Expert Opin. Drug Deliv. 2020, 17, 551–571. [Google Scholar] [CrossRef]
  14. Fadlelmoula, A.; Pinho, D.; Carvalho, V.H.; Catarino, S.O.; Minas, G. Fourier Transform Infrared (FTIR) Spectroscopy to Analyse Human Blood over the Last 20 Years: A Review towards Lab-on-a-Chip Devices. Micromachines 2022, 13, 187. [Google Scholar] [CrossRef] [PubMed]
  15. Al-Kelani, M.; Buthelezi, N. Advancements in medical research: Exploring Fourier Transform Infrared (FTIR) spectroscopy for tissue, cell, and hair sample analysis. Ski. Res. Technol. 2024, 30, e13733. [Google Scholar] [CrossRef]
  16. Han, Y.; Han, L.; Yao, Y.; Li, Y.; Liu, X. Key factors in FTIR spectroscopic analysis of DNA: The sampling technique, pretreatment temperature and sample concentration. Anal. Methods 2018, 10, 2436–2443. [Google Scholar] [CrossRef]
  17. Wawrzyniuk, L.; Jóźwicki, R.; Szymański, G.; Rataj, M.; Błęcka, M.; Cichocki, A.; Pietrzak, R. Compact dual-band FTIR spectrometer for atmosphere monitoring. Opto. Electron. Rev. 2015, 23, 208–213. [Google Scholar] [CrossRef]
  18. Moshkin, B.E.; Grigor’ev, A.V.; Shakun, A.V.; Patsaev, D.V.; Zharkov, A.V.; Vagin, V.A. The TIRVIM Fourier Spectrometer for Studying the Martian Atmosphere. Instrum. Exp. Tech. 2018, 61, 130–135. [Google Scholar] [CrossRef]
  19. Ghoname, A.O.; Sabry, Y.M.; Anwar, M.; Saeed, A.; Saadany, B.; Khalil, D.; Piyawattanametha, W.; Park, Y.-H.; Zappe, H. Ultra wide band MIR MEMS FTIR spectrometer. In Proceedings of the MOEMS and Miniaturized Systems XVIII, San Francisco, CA, USA, 2–7 February 2019; Volume 10931, pp. 231–236. [Google Scholar] [CrossRef]
  20. Serdyukov, V.I.; Sinitsa, L.N.; Lugovskoi, A.A.; Emelyanov, N.M. Low-Temperature Cell for Studying Absorption Spectra of Greenhouse Gases. Atmos. Ocean. Opt. 2019, 32, 220–226. [Google Scholar] [CrossRef]
  21. Tian, F.; Li, S.; Wang, P.; Lu, Y. A wide-band interference spectrometer based on bandpass sampling technology. In Proceedings of the ICOSM 2020: Optoelectronic Science and Materials, Hefei, China, 25–27 September 2020. [Google Scholar]
  22. Fufurin, I.L.; Golyak, I.; Bashkin, S.; Knyazev, S.; Timashova, L.; Morozov, A.N.; Cheben, P.; Čtyroký, J.; Molina-Fernández, I. FTIR spectroscopy based on a multipass gas cell and TE cooled HgCdTe sensors for environmental monitoring and defense applications. In Proceedings of the Integrated Optics: Design, Devices, Systems and Applications VI, Online, 19–23 April 2021. [Google Scholar]
  23. Hodgson, J. The optical properties of gold. J. Phys. Chem. Solids 1968, 29, 2175–2181. [Google Scholar] [CrossRef]
  24. Zhi, L.; Huang, M.; Wen, Q.; Gao, H.; Han, W. Design of an Optical Path Scanning Control System in a Portable Fourier Transform Spectrometer Based on Adaptive Feedforward-Nonlinear Proportional-Integral Cascade Composite Control. Actuators 2024, 13, 35. [Google Scholar] [CrossRef]
  25. Zhi, L.; Huang, M.; Han, W.; Wang, Z.; Lu, X.; Bai, Y.; Gao, H. Improved Active Disturbance Rejection Double Closed-Loop Control of a Rotary-Type VCM in a Moving Mirror Control System. Sensors 2022, 22, 3897. [Google Scholar] [CrossRef] [PubMed]
  26. Prunet, S.; Durieu, C.; Journet, B. Signal processing methods to improve the performance of a compact Fourier transform spectrometer. Opt. Eng. 2003, 42, 985–993. [Google Scholar] [CrossRef]
  27. Griffiths, P. Fourier transform infrared spectrometry. Science 1983, 222, 297–302. [Google Scholar] [CrossRef] [PubMed]
Figure 1. Schematic diagram of the front optical system.
Optics 06 00007 g001
Figure 2. Schematic diagram of the optical path of the interferometer: (a) double-moving mirror-swinging structure; (b) relationship between OPD and swing angle.
Optics 06 00007 g002
Figure 3. Adaptive feedforward LADRC structural block diagram.
Optics 06 00007 g003
Figure 4. Division of electronics functional units.
Optics 06 00007 g004
Figure 5. Real-time high-speed data acquisition and transmission system.
Optics 06 00007 g005
Figure 6. The developed ultra-wide-band FTIR spectrometer.
Optics 06 00007 g006
Figure 7. Spectral range measurement: (a) FIR band; (b) MIR band; (c) NIR band.
Optics 06 00007 g007
Figure 8. Negative-pressure CO gas cell.
Optics 06 00007 g008
Figure 9. Absorption spectrum of CO gas.
Optics 06 00007 g009
Figure 10. Spectrum of water vapor.
Optics 06 00007 g010
Figure 11. SNR analysis of the proposed FTIR spectrometer.
Optics 06 00007 g011
Table 1. FWHM of CO gas partial absorption characteristic peaks.
Peak Position (cm−1)Absolute StrengthFWHM (cm−1)
2169.5792.1860.2420
2103.6362.0770.2484
2190.4022.080.2496
2154.9662.0920.2513
2111.9052.1170.2514
2158.6822.1460.2518
Disclaimer/Publisher’s Note: The statements, opinions and data contained in all publications are solely those of the individual author(s) and contributor(s) and not of MDPI and/or the editor(s). MDPI and/or the editor(s) disclaim responsibility for any injury to people or property resulting from any ideas, methods, instructions or products referred to in the content.

