Abstract
Electrochemical biosensors are valued for their sensitivity and selectivity in detecting biological molecules. Having the advantage of generating signals that can be directly or indirectly proportional to the concentration of the target analyte, these biosensors can achieve specificity by utilizing a specific biorecognition surface designed to recognize the target molecule. Electrochemical biosensors have garnered substantial attention, as they can be used to fabricate compact, cost-effective devices, making them promising candidates for point-of-care testing (POCT) devices. This study introduces a label-free electrochemical biosensor employing a gold screen-printed electrode (SPE) to detect lysophosphatidic acid (LPA), a potential early ovarian cancer biomarker. We employed the gelsolin–actin system, previously introduced by our group, in combination with fluorescence spectrometry, as a biorecognition element to detect LPA. By immobilizing a gelsolin–actin complex on an SPE, we were able to quantify changes in current intensity using cyclic voltammetry and differential pulse voltammetry, which was directly proportional to the LPA concentration in the solution. Our results demonstrate the high sensitivity of the developed biosensor for detecting LPA in goat serum, with a limit of detection (LOD) and a limit of quantification (LOQ) of 0.9 µM and 2.76 µM, respectively, highlighting its potential as a promising tool for early-stage diagnosis of ovarian cancer.
1. Introduction
Ovarian cancer is the most lethal gynecological cancer, with a 5 year survival rate of 50%. In 2020, ovarian cancer was one of the five leading causes of death from all cancers in females aged 40–79 years [1]. Ovarian cancer has been named a “silent killer” due to the lack of effective diagnostic methods available at the early stages when the disease is treatable. If diagnosed in the first stage (localized), the 5 year survival rate can be as high as 92.4%, while in the regional and distant stages, it drops to 72.9 and 31.5%, respectively [1,2]. Cancer antigen 125 (CA125) is the only clinically approved biomarker for ovarian cancer diagnosis; however, it is neither specific nor effective enough for early screening. In its early stages, CA125 was found to be elevated in only 50% of patients with a confirmed diagnosis. Moreover, false-positive results were observed in cases such as pregnancy [2].
Lysophosphatidic acid (LPA) is a promising biomarker for ovarian cancer. LPA is a phospholipid involved in a number of cellular processes including cellular proliferation, prevention of apoptosis, cell migration, and more [3,4]. In ovarian cancer cases, malignant ovarian epithelium produces LPA to stimulate growth of cancer cells [5,6]. There has been an increasing interest in LPA as a prospective ovarian cancer biomarker. Not only is it significantly elevated in the first stage of the disease, but it is also more specific and selective than CA125 [6,7,8]. Studies have shown LPA elevation in 90% of patients at stage I of ovarian cancer, as well as the dependency of its concentration on disease progression [3,8]. Notably, several studies found that LPA was not elevated in the cases of breast cancer and leukemia, suggesting its specificity in regard to ovarian cancer [5,6]. While LPA levels do not necessarily differ significantly between patients with benign and malignant tumors, with a few contradicting studies, it holds great potential as an effective biomarker for detecting the presence of ovarian cancer tumors and predicting the disease stage [3,7]. However, the lack of cost-effective and reliable standard techniques for LPA detection has prevented mass clinical trials and clinical approval of LPA as an ovarian cancer biomarker. Traditional analytical techniques like gas chromatography–mass spectrometry have been employed to quantify LPA levels in serum. However, these methods have not been widely used for large-scale screening due to their time-consuming nature, high cost, and the need for specialized technicians [9,10,11].
Electrochemical biosensors have emerged as powerful tools for detecting biological molecules, offering advantages in terms of selectivity, sensitivity, and specificity [9,12,13,14,15,16,17,18]. Their affordability and ease of use make them appealing in the context of point-of-care testing (POCT) devices [19]. The main challenge in biosensor technology is the issue of non-specific adsorption (NSA) when interacting with biological fluids [20,21]. This issue becomes especially pronounced on gold surfaces. Thiol chemistry, which is used to create a self-assembled monolayer (SAM) for bio-functionalization, can also contribute to NSA, as any biomolecules containing thiol groups in biofluids may bind to the gold electrode, causing false results [22]. To address the issue of NSA, we incorporated a newly synthesized linker, 3-dithiothreitol propanoic acid (DTTCOOH), which our research team recently introduced, demonstrating its promising antifouling properties using quartz crystal microbalance (QCM) [22]. The formation of the SAM of this linker establishes a “water barrier”, as the dithiol structure enhances the hydration network within the SAM [23]. In this study, we examined the antifouling properties of DTTCOOH in developing electrochemical biosensors. We employed the gelsolin–actin system, which was introduced by our group, as the biorecognition element for detecting LPA [24]. This system was used to develop a method based on fluorescence spectroscopy capable of detecting LPA with a limit of detection (LOD) of 5 μM [24,25]. We also used this system to develop an affinity-based electrochemical biosensor for LPA detection, achieving an LOD of 0.7 μM [26]. The biosensor fabrication involved the use of medical-grade stainless steel as the working electrode, an unconventional yet effective material choice, coupled with silane-based interfacial chemistry [26].
In this study, we introduced a cost-effective strategy for immobilizing the gelsolin–actin system through thiol-based interfacial chemistry using screen-printed electrodes (SPE). The synthesis of the thiol-based linkers is simpler, and does not require specific precautions compared to silane-based linkers. Silane-based linkers are sensitive to oxygen and water; therefore, they require a glovebox to synthesize them. Using thiol-based chemistry has the advantages of providing a more robust synthesis method, thereby reducing the cost and time for developing the biosensor.
2. Materials and Methods
2.1. Materials and Reagents
All materials were purchased from Sigma-Aldrich, unless otherwise specified. Gelsolin plasmids were provided by Professor Robert Robinson of the University of Singapore, and the first three domains of gelsolin (gelsolin) were synthesized from plasmids, as reported by Franier, D.L. et al. [24]. Actin from rabbit muscle was purchased from Alfa Aesar by Thermo Fisher Scientific, United States. All the aqueous solutions were prepared using Milli-Q water.
2.2. Synthesis of the Linker
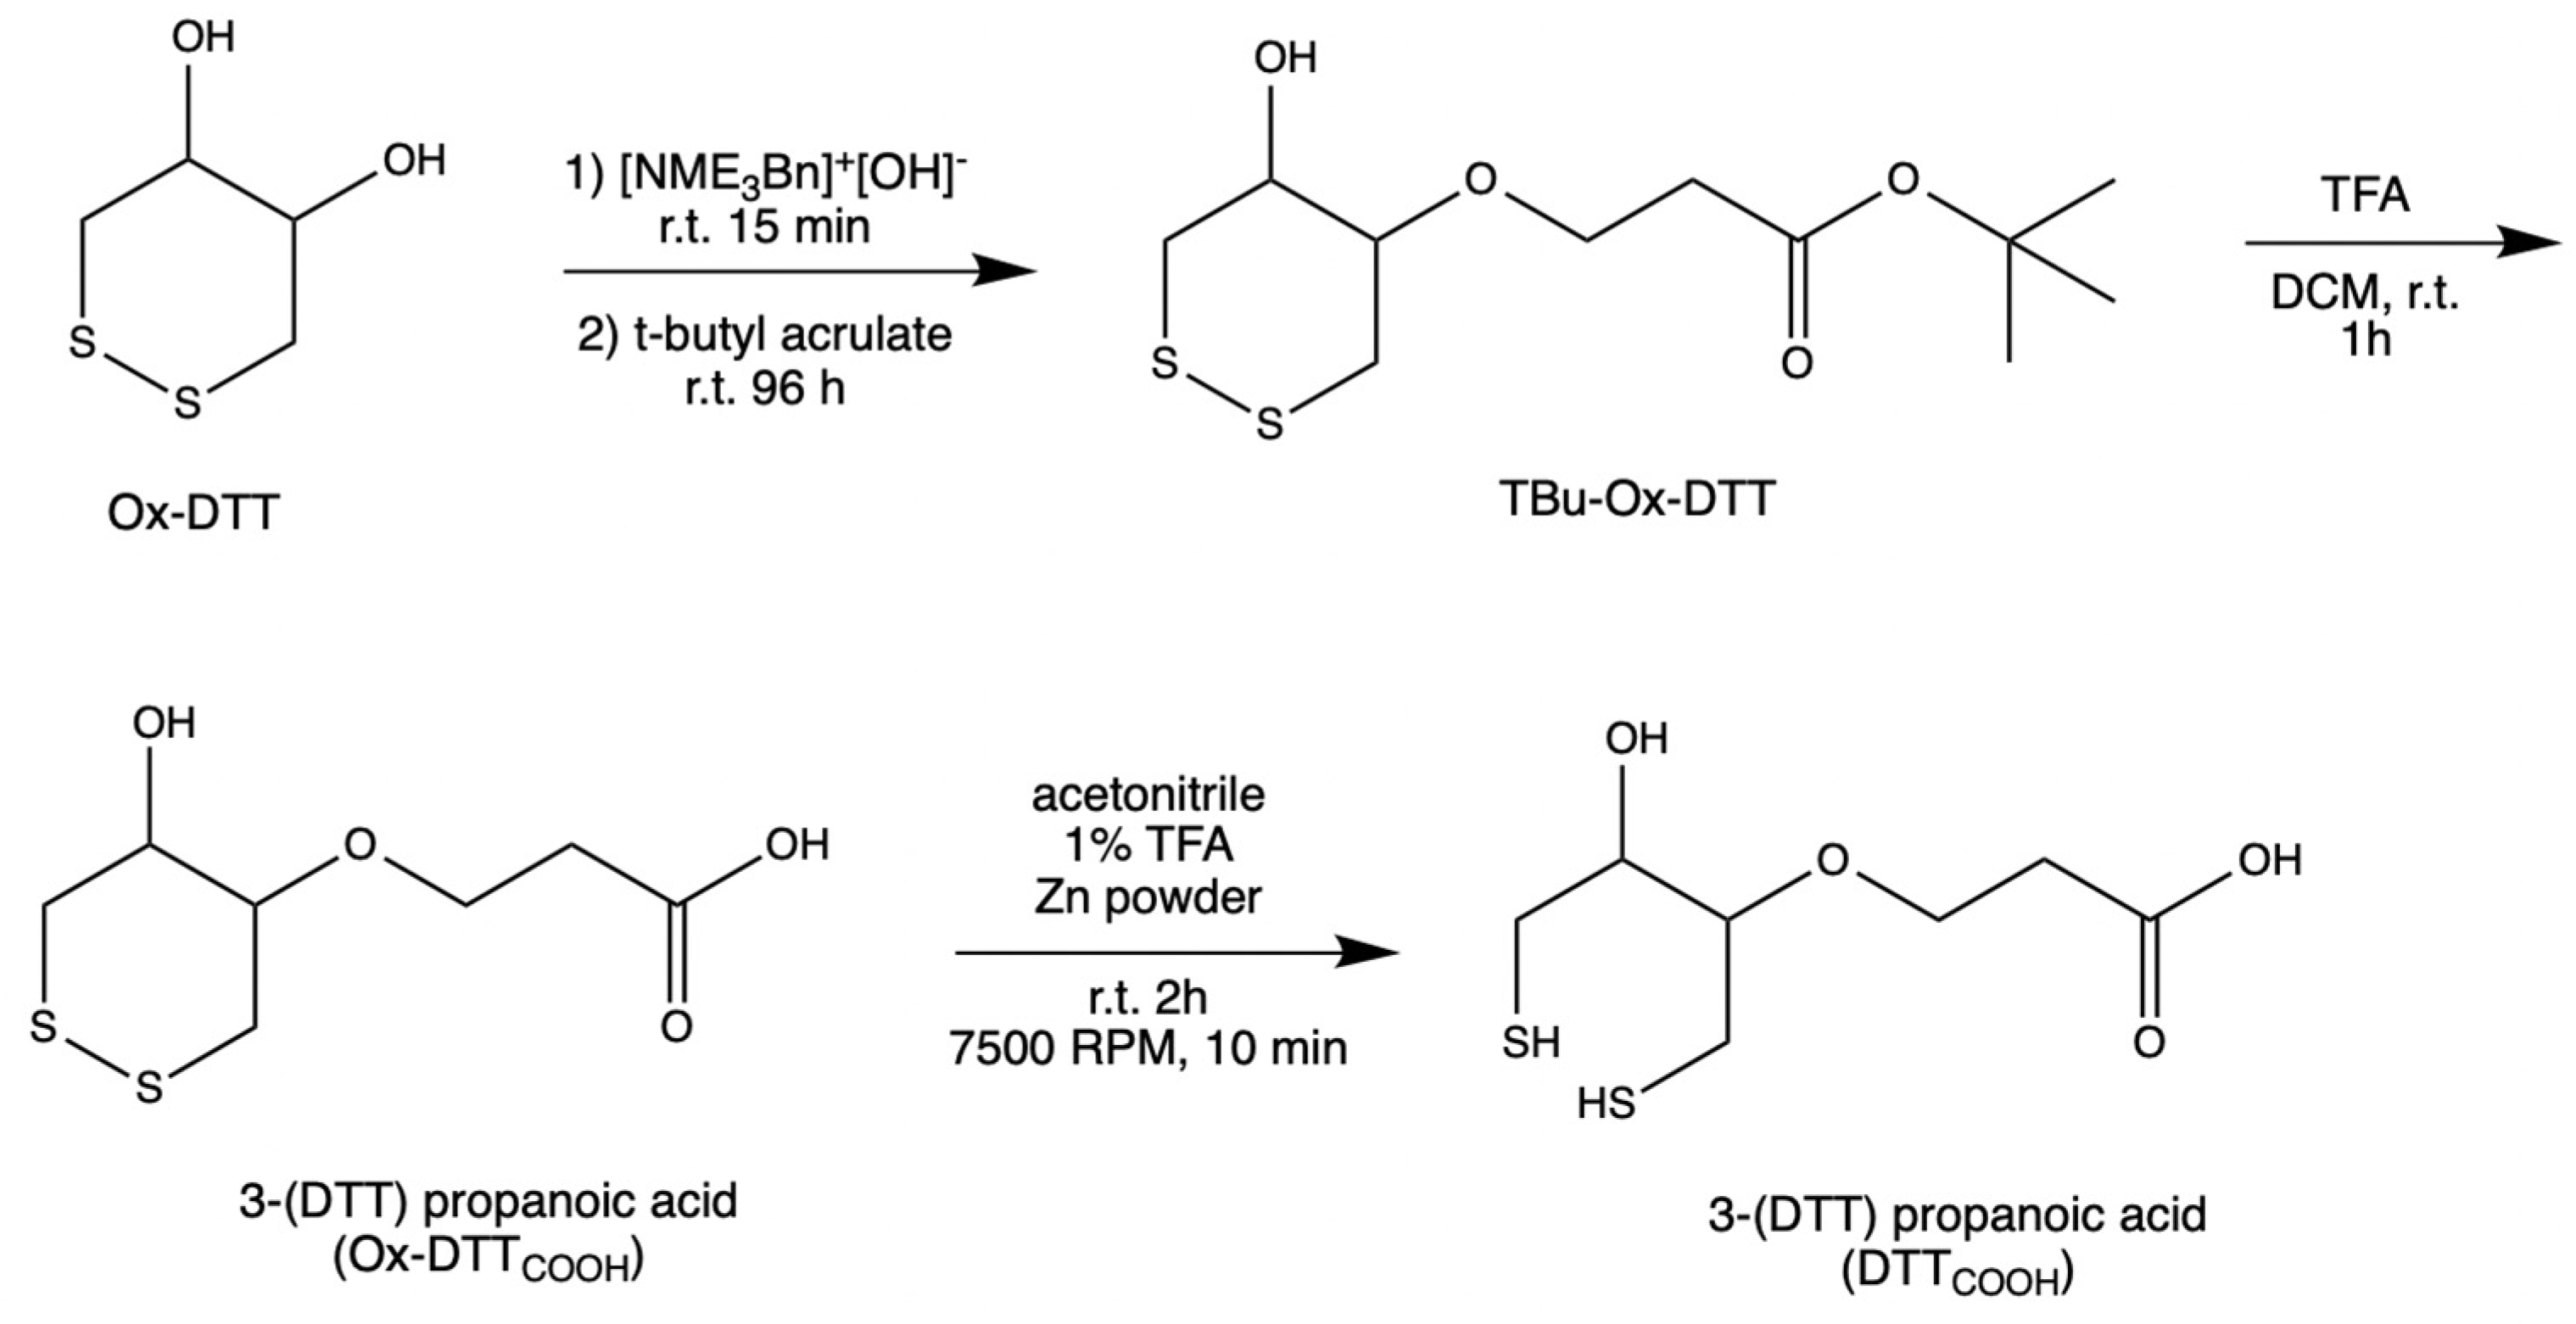
DTTCOOH was synthesized (Figure 1) by optimizing the procedure that was reported by Spagnolo et al. [22]. To provide a mild chemical reaction instead of applying a temperature of 58–60 °C, the reaction was performed at room temperature for 96 h.
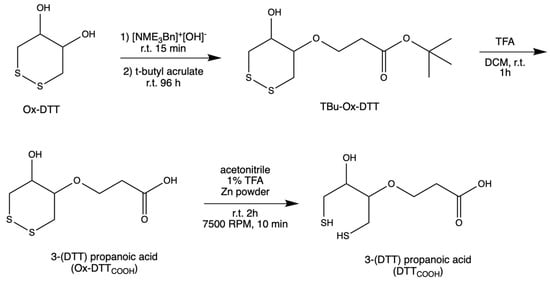
Figure 1.
Steps in the synthesis of DTTCOOH from Ox–DTT.
An oven-dried flask was used to concentrate N-benzyltrimethylammonium hydroxide (40% w/w in methanol, 600 μL, 3 mmol) under vacuum. After cooling to room temperature, a solution of ox–DTT (200 mg, 1.3 mmol) in acetonitrile (60 mL) was added to the flask. The reaction mixture was stirred at room temperature for 15–30 min. Then, tert-butyl acrylate (287 μL, 1.9 mmol) was added to the solution and stirred for 96 h at room temperature under an inert atmosphere, and then was monitored with TLC (3:1 and 1:1 v/v hexane/ethyl acetate). TLC plates were run with various ratios of hexane and ethyl acetate to choose the right conditions for subsequent flash chromatography analysis. It was determined that the 3:1 v/v hexane/ethyl acetate was the optimal condition. Flash chromatography was performed using high-grade silica gel (60 Å pore size, 200–400 mesh) and yielding 63.5% tert-butyl 3(DTT)propanoate (TBu–Ox–DTT) (127 mg, 453 μM). TBu–Ox–DTT (127 mg, 453 μmol) was then mixed with trifluoroacetic acid (316.4 μL) and dissolved dichloromethane (9 mL). The solution was then stirred for 60–90 min at room temperature. The product was obtained by evaporating trifluoroacetic acid under reduced pressure yielding 51% 3–(DTT) propanoic acid (Ox–DTTCOOH) (65 mg, 289.8 μmol).
Ox–DTTCOOH (32.5 mg, 144.9 μmol) was dissolved in a solution of 1% trifluoroacetic acid in acetonitrile (12 mL) and mixed with zinc powder. The solution was stirred at room temperature for 2 h, then centrifuged at 7500 RPM for 10 min. The supernatant was concentrated under reduced pressure, yielding 81.8% 3–(DTT) propanoic acid (DTTCOOH) (26.6 mg, 111.75 μmol). 13C NMR (Figure S1) and 1H NMR spectra were obtained to confirm the structure of the final product.
2.3. Electrochemical Measurements
All electrochemical experiments were conducted using a CHI440A electrochemical workstation (CH Instruments, Austin, TX, USA) and disposable screen-printed gold electrodes (SPEs). The SPEs (220 AT), which employed gold nanotube inks and underwent high-temperature curing, were purchased from DropSense Metrohm, Llanera (Asturias), Spain. The electrode consisted of a gold working electrode (4 mm diameter), a gold auxiliary electrode, and a silver reference electrode. The electrochemical measurements were performed by immersing the electrodes in 10 mL aqueous solutions of 10 mM K4[Fe(CN)6]/K3[Fe(CN)6] as redox probes containing 0.5 M KCl as a supporting electrolyte. Cyclic voltammetry (CV) and differential pulse voltammetry (DPV) were employed to monitor the current response as a function of applied potential. CV measurements were started at the open circuit potential (OCP) with positive initial scan polarity and a 5 s quiet time. A scan rate of 0.3 V/s was applied, unless otherwise mentioned. The DPV measurements were performed with the increment potential of 0.004 V, amplitude of 0.05 V, pulse width of 0.05 s, and pulse period 0.5 s. DPV measurements started with negative or positive initial scan polarity and 2 s quiet time with sensitivity of 5 × 10⁻⁴ A/V.
2.4. Surface Modification of Screen-Printed Electrodes
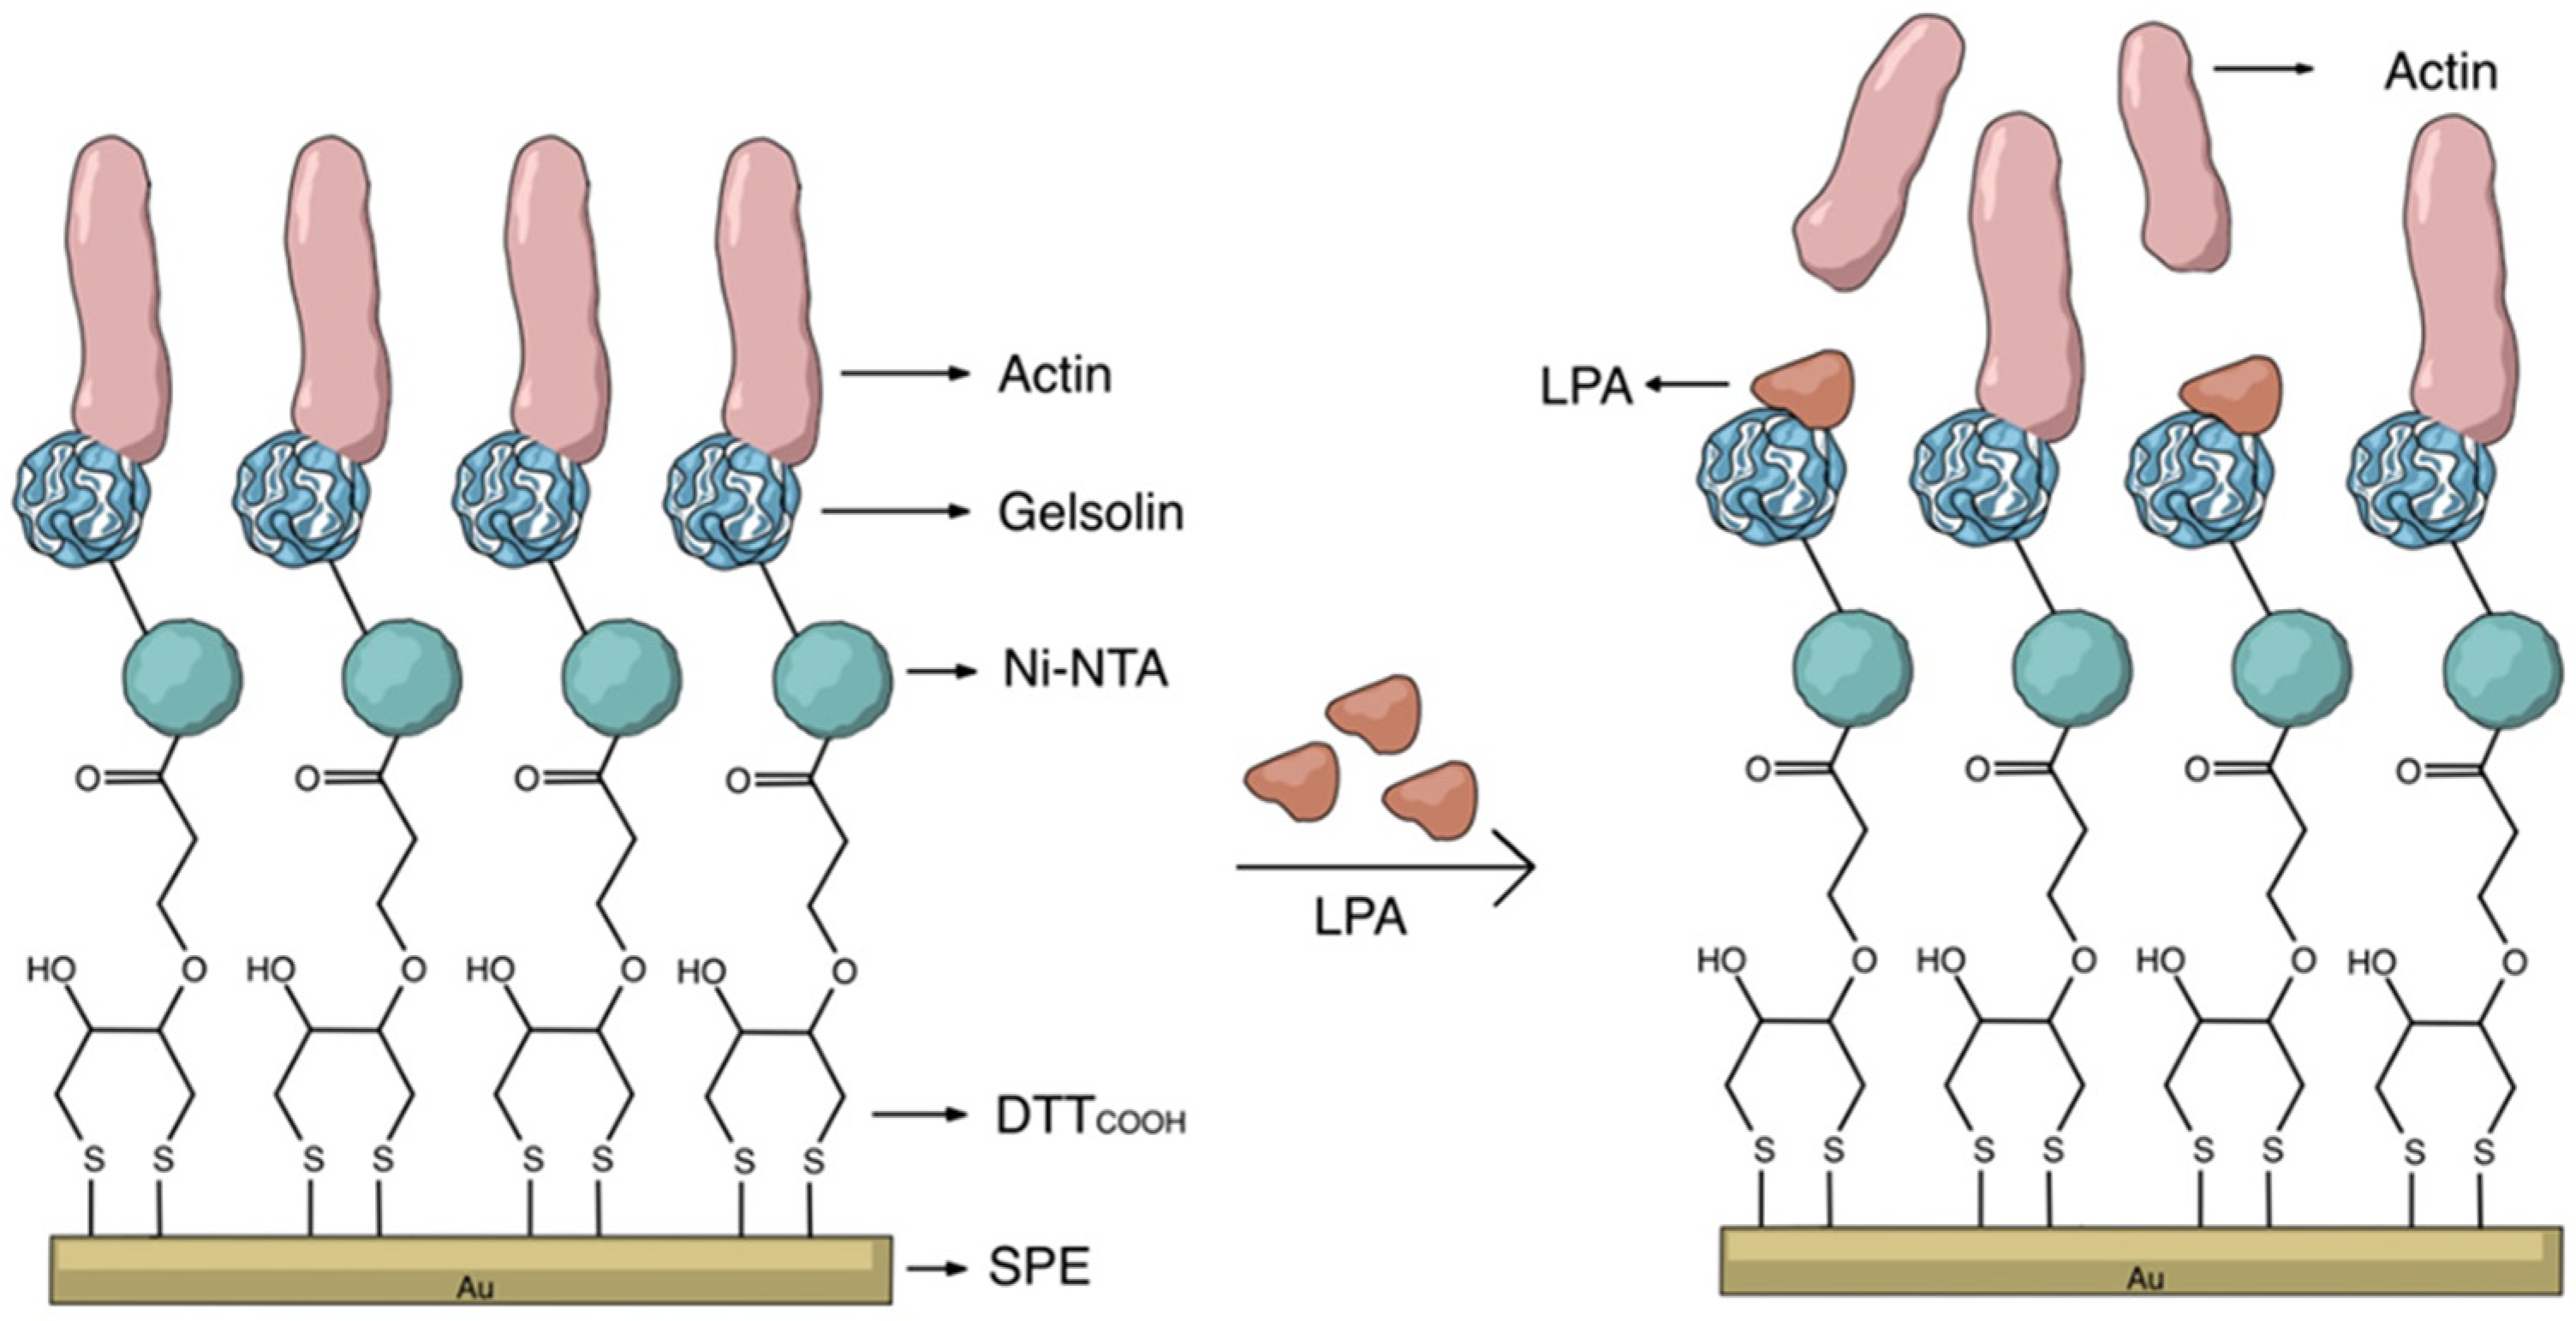
SPE modification was conducted by directly applying 10 μL of various reagents onto the working electrode surface through an incubation process. Two different linkers, 11-mercaptoundecanoic acid (MUA) and 3-dithiothreitol propanoic acid (DTTCOOH), were used to immobilize the gelsolin–actin system on the SPE. The SPEs were modified by either a 2 mM MUA aqueous solution containing 30% ethanol or a 3 mM DTTCOOH aqueous solution containing 13% EtOH and 7 mM KOH. The SPEs were then allowed to incubate overnight to form a SAM composed either of MUA or DTTCOOH, which functioned as linkers. Then, electrodes were modified with an aqueous solution of N-hydroxysuccinimide (NHS) and 1-Ethyl-3-(3-dimethylaminopropyl) carbodiimide (EDC) (NHS/EDC: 20 mM NHS and 50 mM EDC) for 35 min. Following this, electrodes were incubated in Nα,Nα-bis (carboxymethyl)-L-lysine and NiCl2 (Ni-NTA) (2 mg/mL) in phosphate-buffered saline buffer (PBS pH 7.4) overnight. Then, the modified SPEs were introduced to the gelsolin–actin complex (0.01 mg/mL in PBS pH 7.4) for 1 h. Prior to this, the gelsolin–actin complex was prepared by preincubating actin and gelsolin in a fridge for 1 hr. We use a polyhistidine-tagged gelsolin that effectively binds to Ni-NTA via the imidazole rings of histidine residues. This binding occurs due to the additional free coordination sites on the Ni2+ in Ni-NTA, which are occupied by the imidazole ring of histidine acting as a ligand.
After this, the modified SPEs were exposed to LPA solution with concentration between 0.01 and 10 μM LPA in either PBS or goat serum. To remove all the unbounded and loosely bound molecules from the surface after each step of the modification, SPEs were first rinsed thoroughly with the compatible solvent. Then, they were rinsed with copious amounts of Milli-Q water to remove any residual solvent. Finally, they were dried under a nitrogen stream to ensure that they were completely dry before being used for further modification or analysis.
2.5. Surface Characterization
Each step of SPE modification was monitored by performing CV and DPV using 10 mM K4[Fe(CN)6]/K3[Fe(CN)6] as an external redox probe containing 0.5 M KCl as a supporting electrolyte. Successfully modified electrodes were then used to measure LPA in either buffer or goat serum. In addition to electrochemical measurements, contact angle goniometry was used for surface characterization. The contact angle goniometry experiments were conducted to assess the hydrophobicity of the electrode surface following each modification step. A KSV CAM 101 contact angle goniometer (KSV Instruments Ltd., Helsinki, Finland) was employed, with deionized water as the testing liquid in standard atmospheric conditions. To prevent water evaporation, the angle between the droplet and the electrode was measured immediately.
3. Results and Discussion
To fabricate the electrochemical biosensor, we used DTTCOOH, which was recently introduced by our group and showed promising antifouling properties [23]. This novel thiol linker is a derivative of DTT, with a modification that replaces one hydroxyl group with propanoic acid. This alteration enables the immobilization of probes through NHS/EDC reactions. The formation of SAM facilitates the creation of a “water barrier”, as the dithiol structure enhances the hydration network by providing distance between the propanoic acid chains within the SAM. As a result, the surface area available for interfacial water molecules increases. The antifouling properties of DTTCOOH against untreated human serum were validated using the quartz crystal microbalance (QCM) [22]. In this study, we compared the effectiveness of this new linker with the MUA, a linear thiol molecule, for developing a label-free electrochemical biosensor using gold SPEs. We showed that this linker provides a comparable antifouling property compared to the silane-based linker that we recently used to develop an affinity-based electrochemical biosensor for LPA detection [26]. The simplicity of synthesis and reduced requirements for thiol-based linkers compared to silane-based linkers led to improvements in cost and time for biosensor development. By taking an advantage of the affinity-based gelsolin–actin system, we engineered a label-free electrochemical biosensor for precise LPA detection [23,25]. Unlike the fluorescence methods that were reported before [24], this biosensor exhibits higher sensitivity and does not require complex instrumentation. SPEs offer a unique set of features that make them suitable for biosensor applications, including their affordability, user-friendliness, and minimal sample volume requirements. Moreover, using SPE offers a miniaturized solution, suitable for the fabrication of compact POCT devices [9,19,26]. These features position SPE as an ideal candidate for mass production and commercialization [12,13,14,15,27].
3.1. Characterization of Biorecognition Surface
The key to constructing electrochemical biosensors lies in developing an effective biorecognition surface. Figure 2 illustrates the layers of the surface modification to create an effective biorecognition surface on the SPEs for LPA detection. To characterize the surface at each stage of SPEs modification, we employed CV and DPV. Figure S2 illustrates the scan rate study of the unmodified gold SPE which employed [Fe(CN)6]3−/4− as the redox probe. Although the CN− may react with gold, forming Au(CN)2− and causing some drift from an ideal reversible redox reaction, this study indicates that the redox process is diffusion controlled, confirming that the electrode’s surface is not involved in electron transfer.
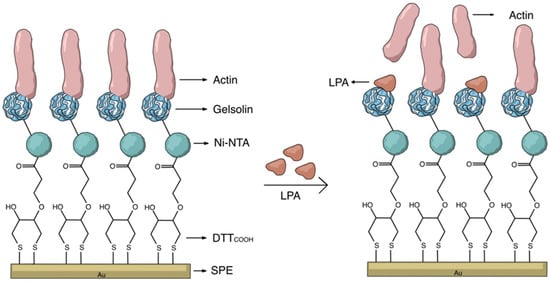
Figure 2.
Schematic representation of the label-free electrochemical biosensor for LPA detection.
3.1.1. Study of the Effect of pH
Since the acidity of solution can significantly impact the molecular–surface interaction, we studied the effect of pH on immobilization of DTTCOOH on the SPE surface. Figure 3 shows the changes in current after incubation of SPEs in DTTCOOH at pH 4, 7, and 10. Carboxyl and thiol groups in DTTCOOH have pKa values of 4.8 and 8.6, respectively. Therefore, at pH 10, both are deprotonated, forming carboxylate (COO−) and thiolate (S−) ions, respectively. At pH 7, the carboxyl group is fully deprotonated, while the thiol group may partially exist in its deprotonated form due to its higher pKa value. At pH 4, both groups are fully protonated. The stronger binding affinity of thiolate ions (-S−) to the gold surface, in comparison to that of protonated thiols (-SH), explains the minimal changes in current observed after an overnight incubation at pH 4, indicating ineffective binding under acidic conditions due to protonation of the thiol group. Consequently, the greater changes in current at pH 10 and, to a slightly lesser extent, at pH 7 can be attributed to the deprotonation of the thiol group under these conditions, resulting in a more robust covalent bond between the linker and the gold surface. The fact that deprotonated thiolate ions form stronger and more stable bonds with the gold surface justify the preference for pH 7, which is closer to physiological levels and exhibits a lower standard deviation (1.98%) compared to pH 10 (3.60%), which indicates a more consistent interaction between the linker and the surface. Therefore, we chose pH 7 for subsequent experiments. These results align with those reported previously by Xue, Y. et al. [28].
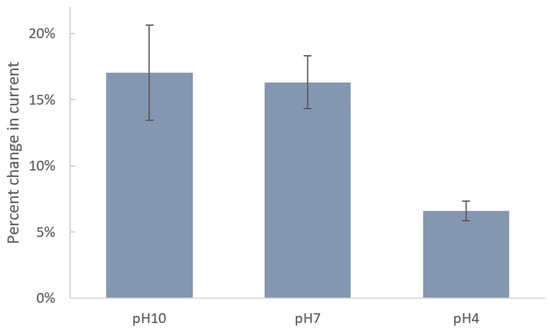
Figure 3.
Bar chart shows the percentages of decrease in current of SPEs after modification with 4 mM DTTCOOH at pH 10, 7, and 4 using DPV. Error bars represent the standard deviation of three replicates.
3.1.2. Development of the Biorecognition Surface
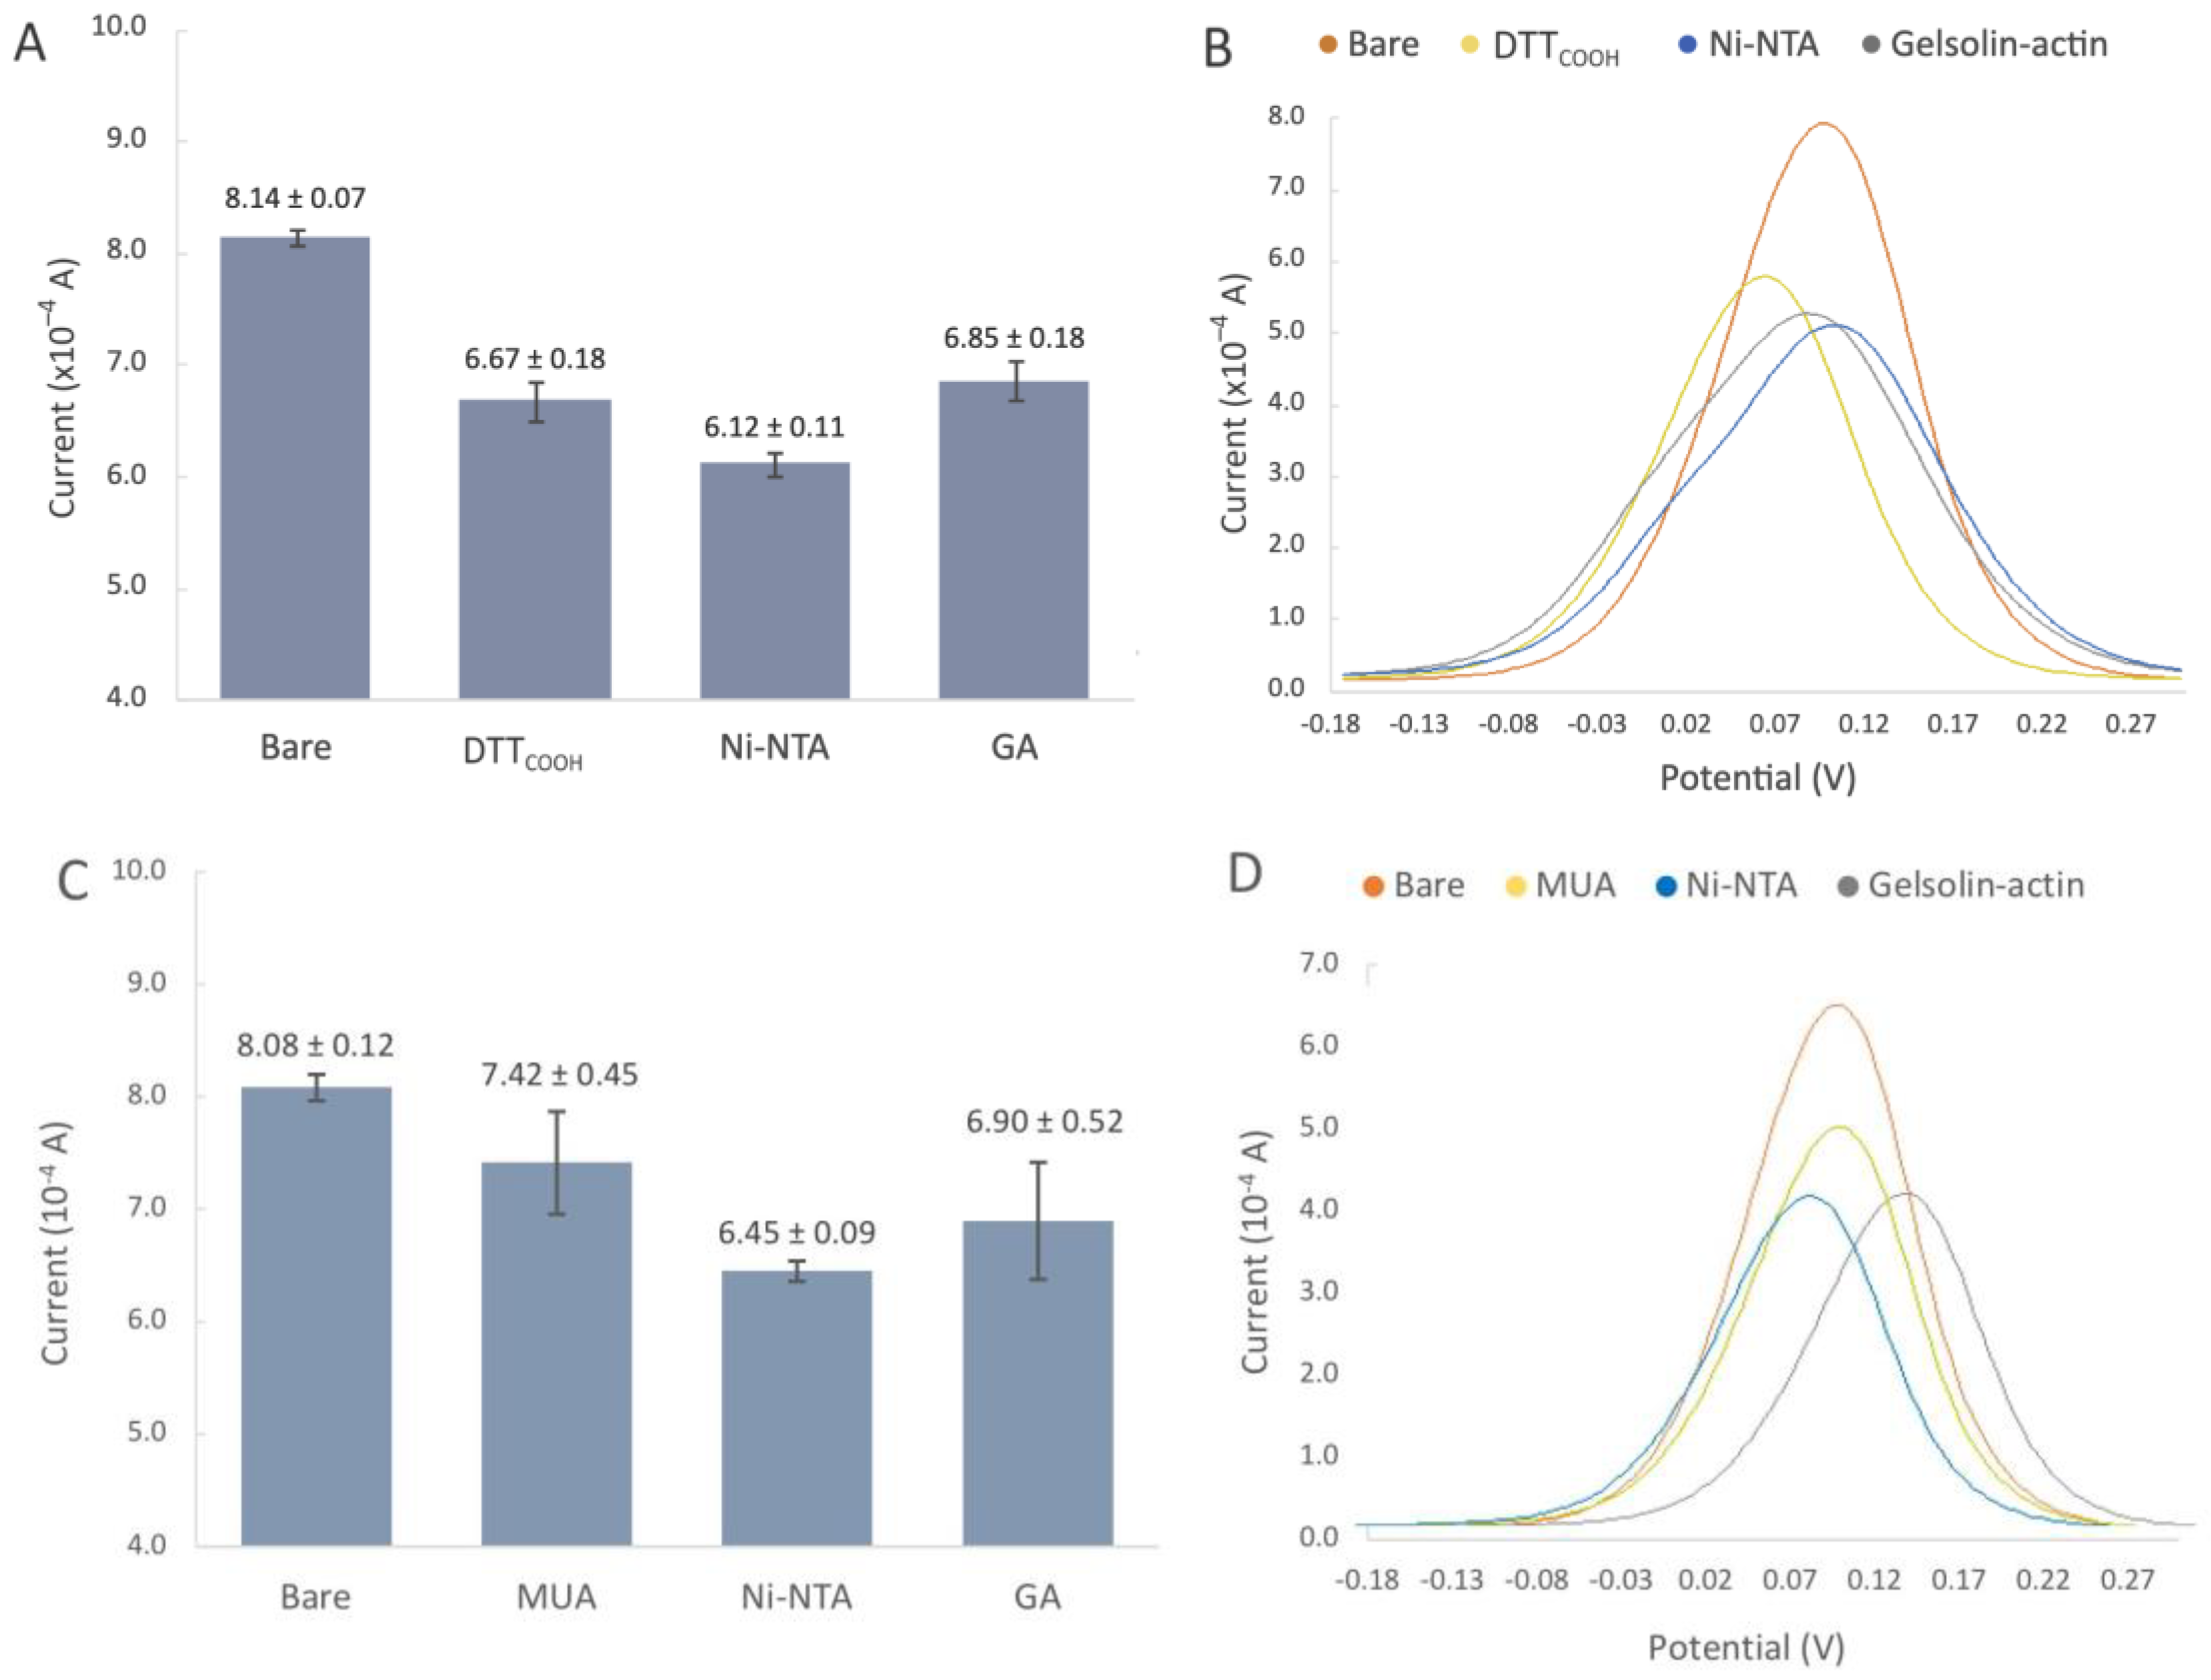
The SPEs were initially modified with either MUA or DTTCOOH to create a SAM, acting as the linker to immobilize NHS/EDC, followed by subsequent modifications with Ni-NTA, and gelsolin–actin complex. The NHS/EDC are commonly used as cross-linking agents in surface modification. EDC is a crosslinker that activates the terminal carboxyl groups of the thiol linker to form reactive O-acylisourea intermediates. This intermediate is susceptive to nucleophilic attack by NHS, and forms a stable amide bond with the original carboxyl groups. The EDC by-product is a soluble urea derivative that can be easily removed from the surface. The resulting semi-stable NHS ester facilities the immobilization of Ni-NTA on the surface. Figure 4C shows the changes in current after modification with MUA, which is a linear thiol-based linker. In contrast, the incubation with DTTCOOH (Figure 4 and Figure S4) displays a more reproducible surface modification. Our previous study, employing a quartz crystal microbalance, demonstrated that DTTCOOH provides superior surface coverage and antifouling properties compared to MUA, possibly due to the additional thiol group [23]. This structure could potentially prevent surface crowding when subsequent modifications are introduced with larger molecules of gelsolin and actin.
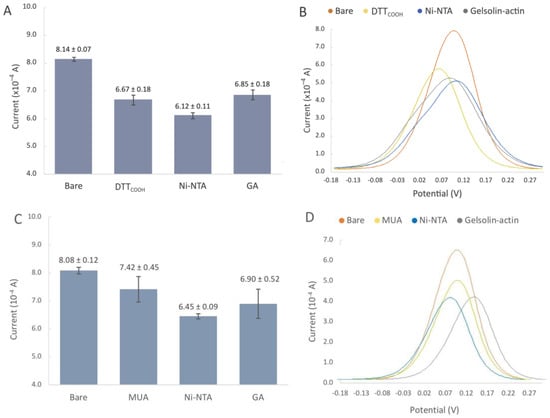
Figure 4.
(A,B) Biorecognition surface with DTTCOOH. (A) Bar chart of bare gold electrodes and after modification with DTTCOOH, Ni-NTA, gelsolin-actin. Error bars represent the standard deviation of three replicates. (B) Representative differential pulse voltammogram of bare SPEs, and after modification with DTTCOOH, Ni-NTA, and gelsolin–actin. (C,D) Biorecognition surface with MUA. (C) Bar chart of bare gold electrodes and after modification with MUA, Ni-NTA, gelsolin-actin. Error bars represent the standard deviation of three replicates. (D) Representative differential pulse voltammogram of bare SPEs, and after modification with MUA, Ni-NTA, and gelsolin–actin.
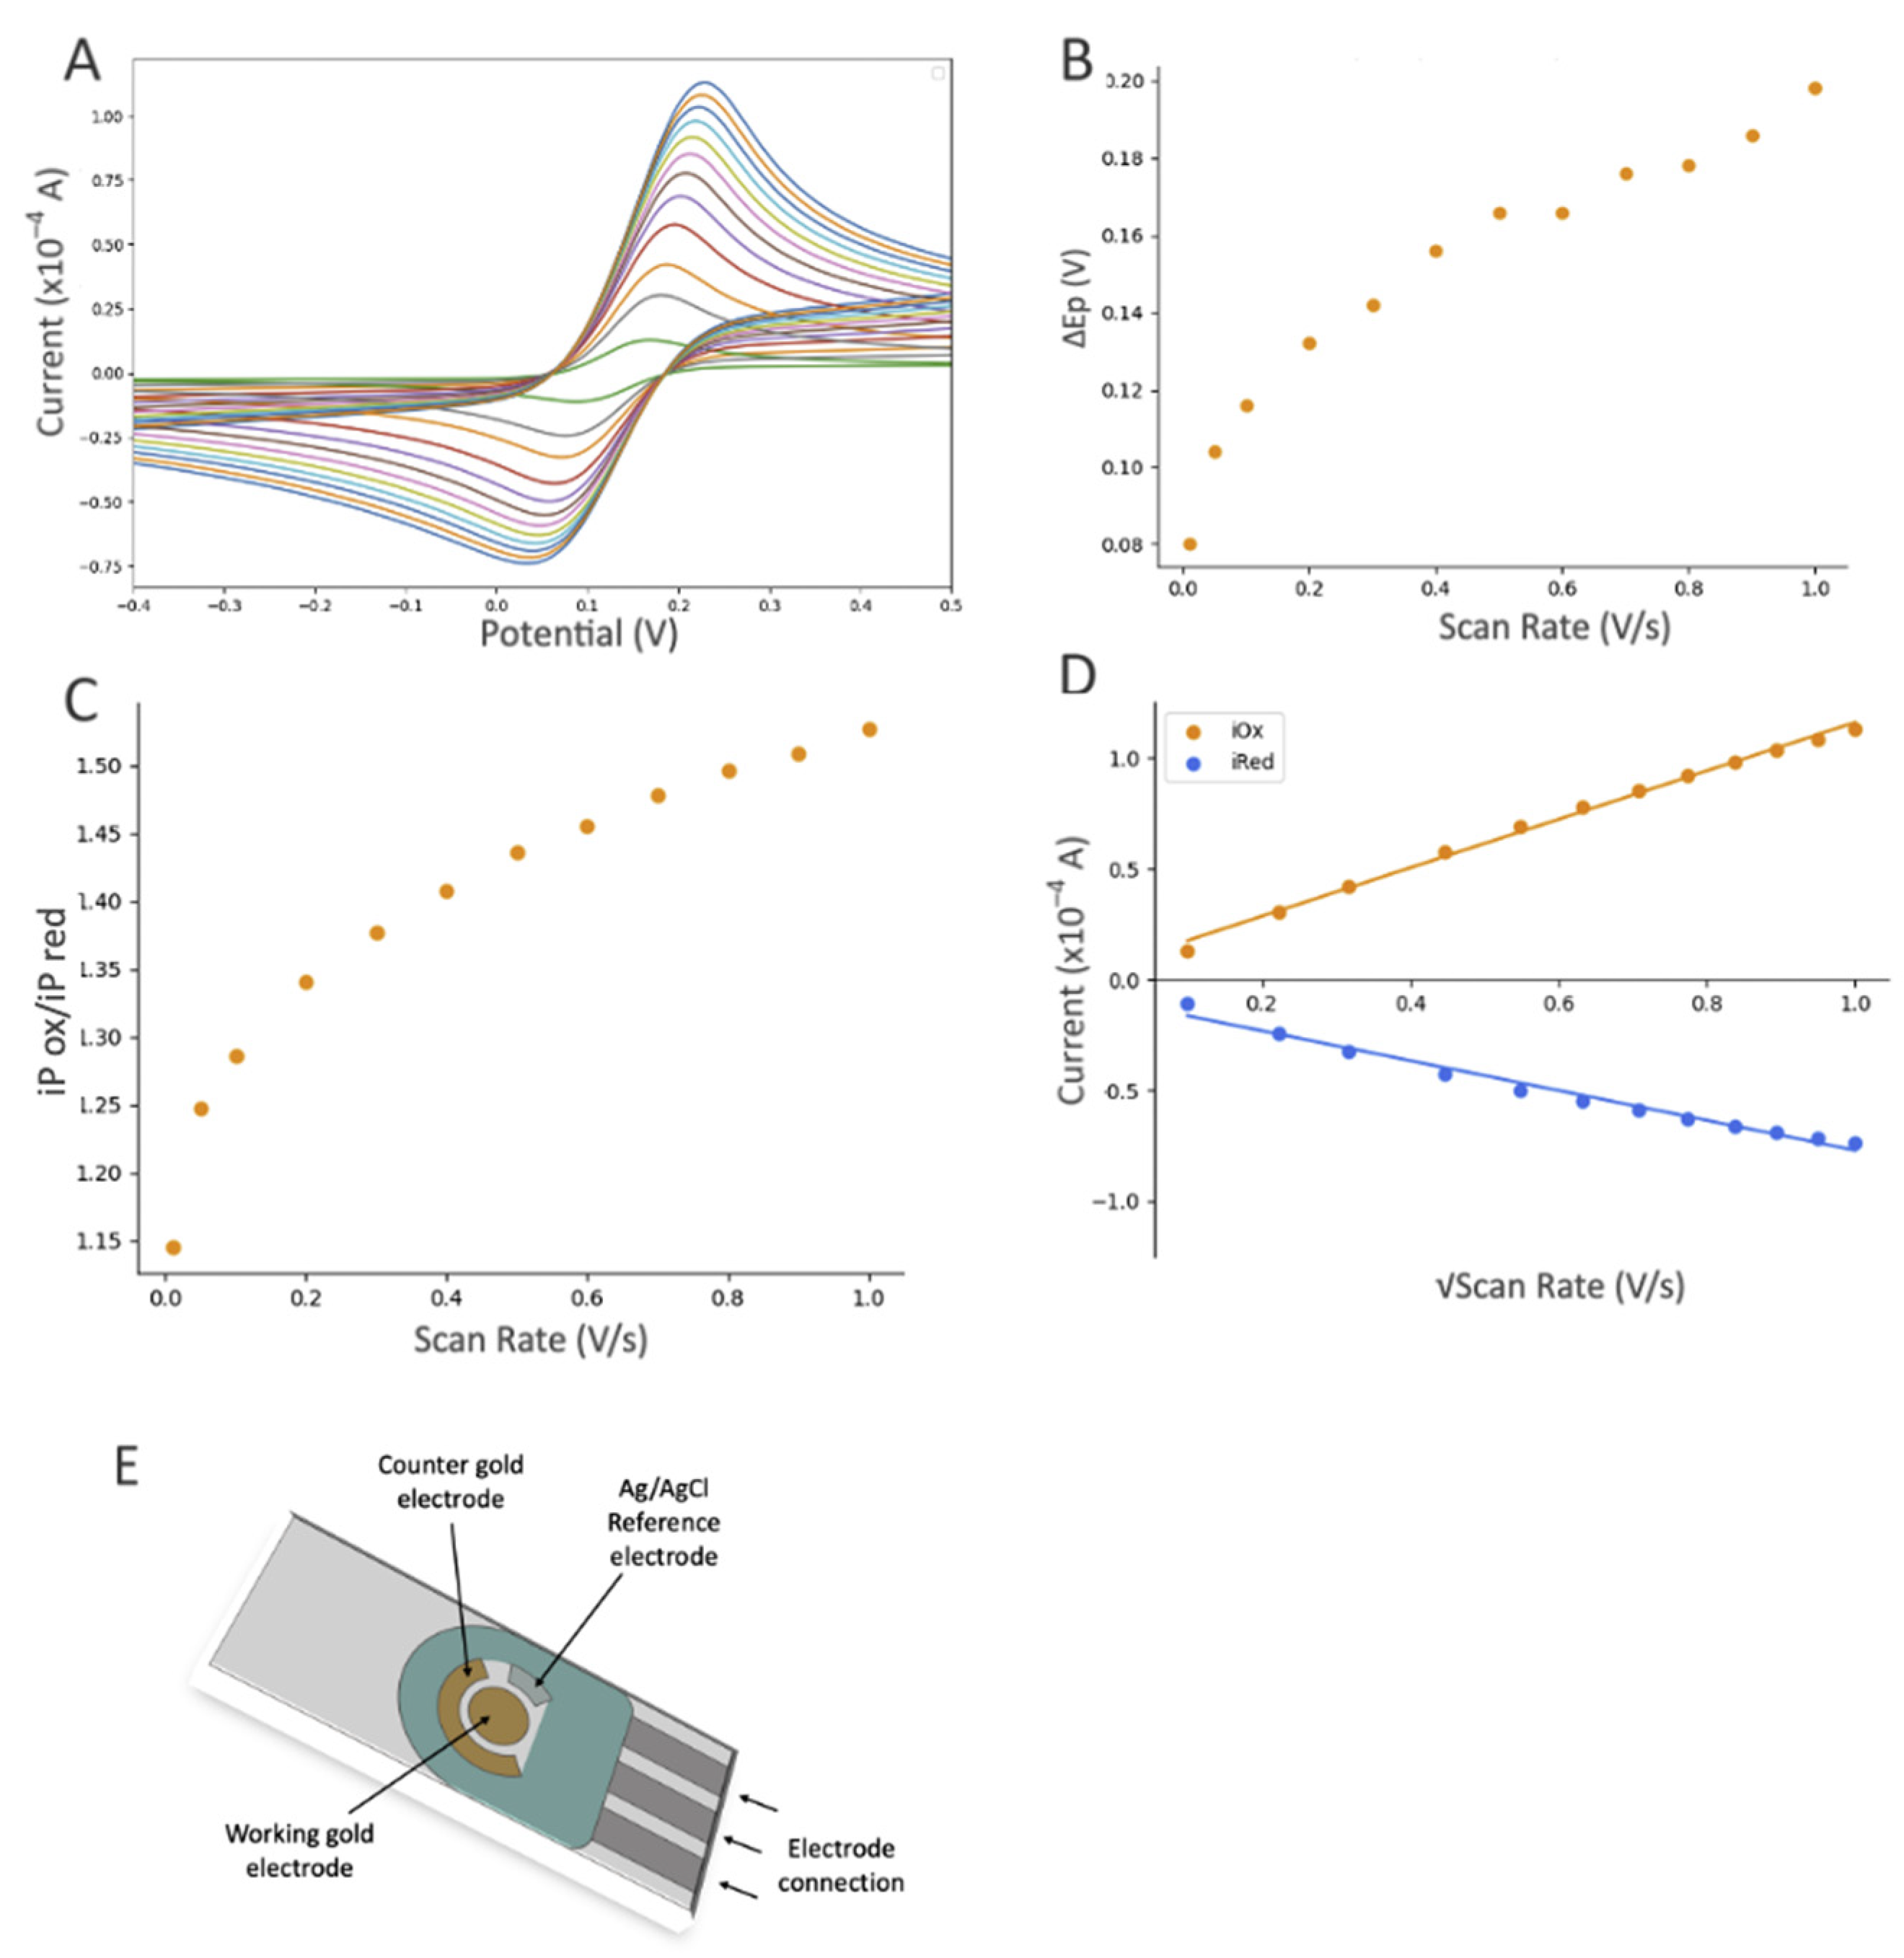
The decrease in the current after linker modification provided substantial evidence for the successful immobilization of the linker on the gold surface. Furthermore, using a Randles–Sevcik equation (assuming all parameters in the equation except current and surface area remain the same after modification) and the average oxidation peaks from Figure 4A,C, we were able to estimate the surface coverage of DTTCOOH and MUA to be 18.06% and 8.16%, respectively. As such, DTTCOOH has a better estimated surface coverage by more than 10%, supporting the previous statement. Further modification with Ni-NTA resulted in a slight decrease in the current, which is believed to be associated with Ni-NTA’s potential participation in the redox process, and was previously observed on the stainless steel electrode [25]. This hypothesis was confirmed though a CV scan rate investigation (Figure S3), which showed a linear correlation between the current and both the scan rate and the square root of the scan rate at scan rates above 0.2 V/s. This suggests that both diffusion and adsorption (see Figure S3B) are involved in the electron transfer process.
Modification with the gelsolin–actin complex resulted in a slight current increase (Figure 4A). Although both gelsolin and actin are large proteins and have a higher coverage on the electrode surface, this increase is due to the redox activity of actin that has been previously observed in physiological and pathological conditions [29,30,31]. This redox activity of actin might arise from the direct oxidation or reduction in its amino acid constituents, such as tyrosine, histidine, cysteine, tryptophan, and methionine [32,33]. The scan rate study showed that adsorption is also involved in electron transfer, suggesting the participation of actin on electron transfer (Figure 5 and Figure S3C). This redox behavior on the modified electrode was also reported before [26].
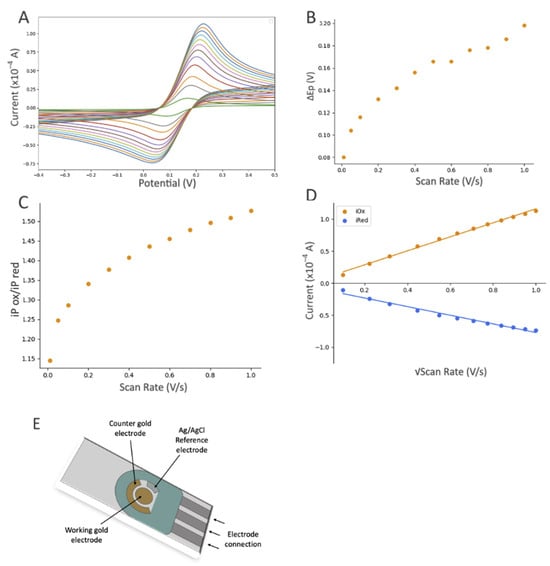
Figure 5.
The influence of scan rate based on the electrochemical response (CV) of the gold SPE after modifications with DTTCOOH, Ni-NTA, and gelsolin–actin using 10 mM [Fe(CN)6]3−/4− as the redox probe, which contained 0.5 M KCl as the supporting electrolyte. CV experiments started at open circuit potential (OCP), with positive initial scan polarity and varying scan rate from 0.01 to 1.0 V/s. (A) Cyclic voltammograms at different scan rates, (B) graph of the peak potential separation (ΔEP = EP(ox) − EP(red)) vs. scan rate, (C) graph of iP(ox)/iP(red) vs. scan rate, and (D) graph of current vs. square root of scan rate, with linear equation of y = 10.761x + 1.0018 and R2 = 0.9922 for the oxidation signals (orange dots), and linear equation of y = −7.071x − 1.4545 and R2 = 0.9626 for reduction signals (blue dots). (E) Schematic illustration of a screen-printed electrode with a gold working electrode (4 mm diameter), a gold auxiliary electrode, and a silver reference electrode (EStandard Hydrogen Electrode (SHE) = EAg/AgCl + 0.197 V).
3.1.3. Study of the Hydrophobicity of the Biorecognition Surface
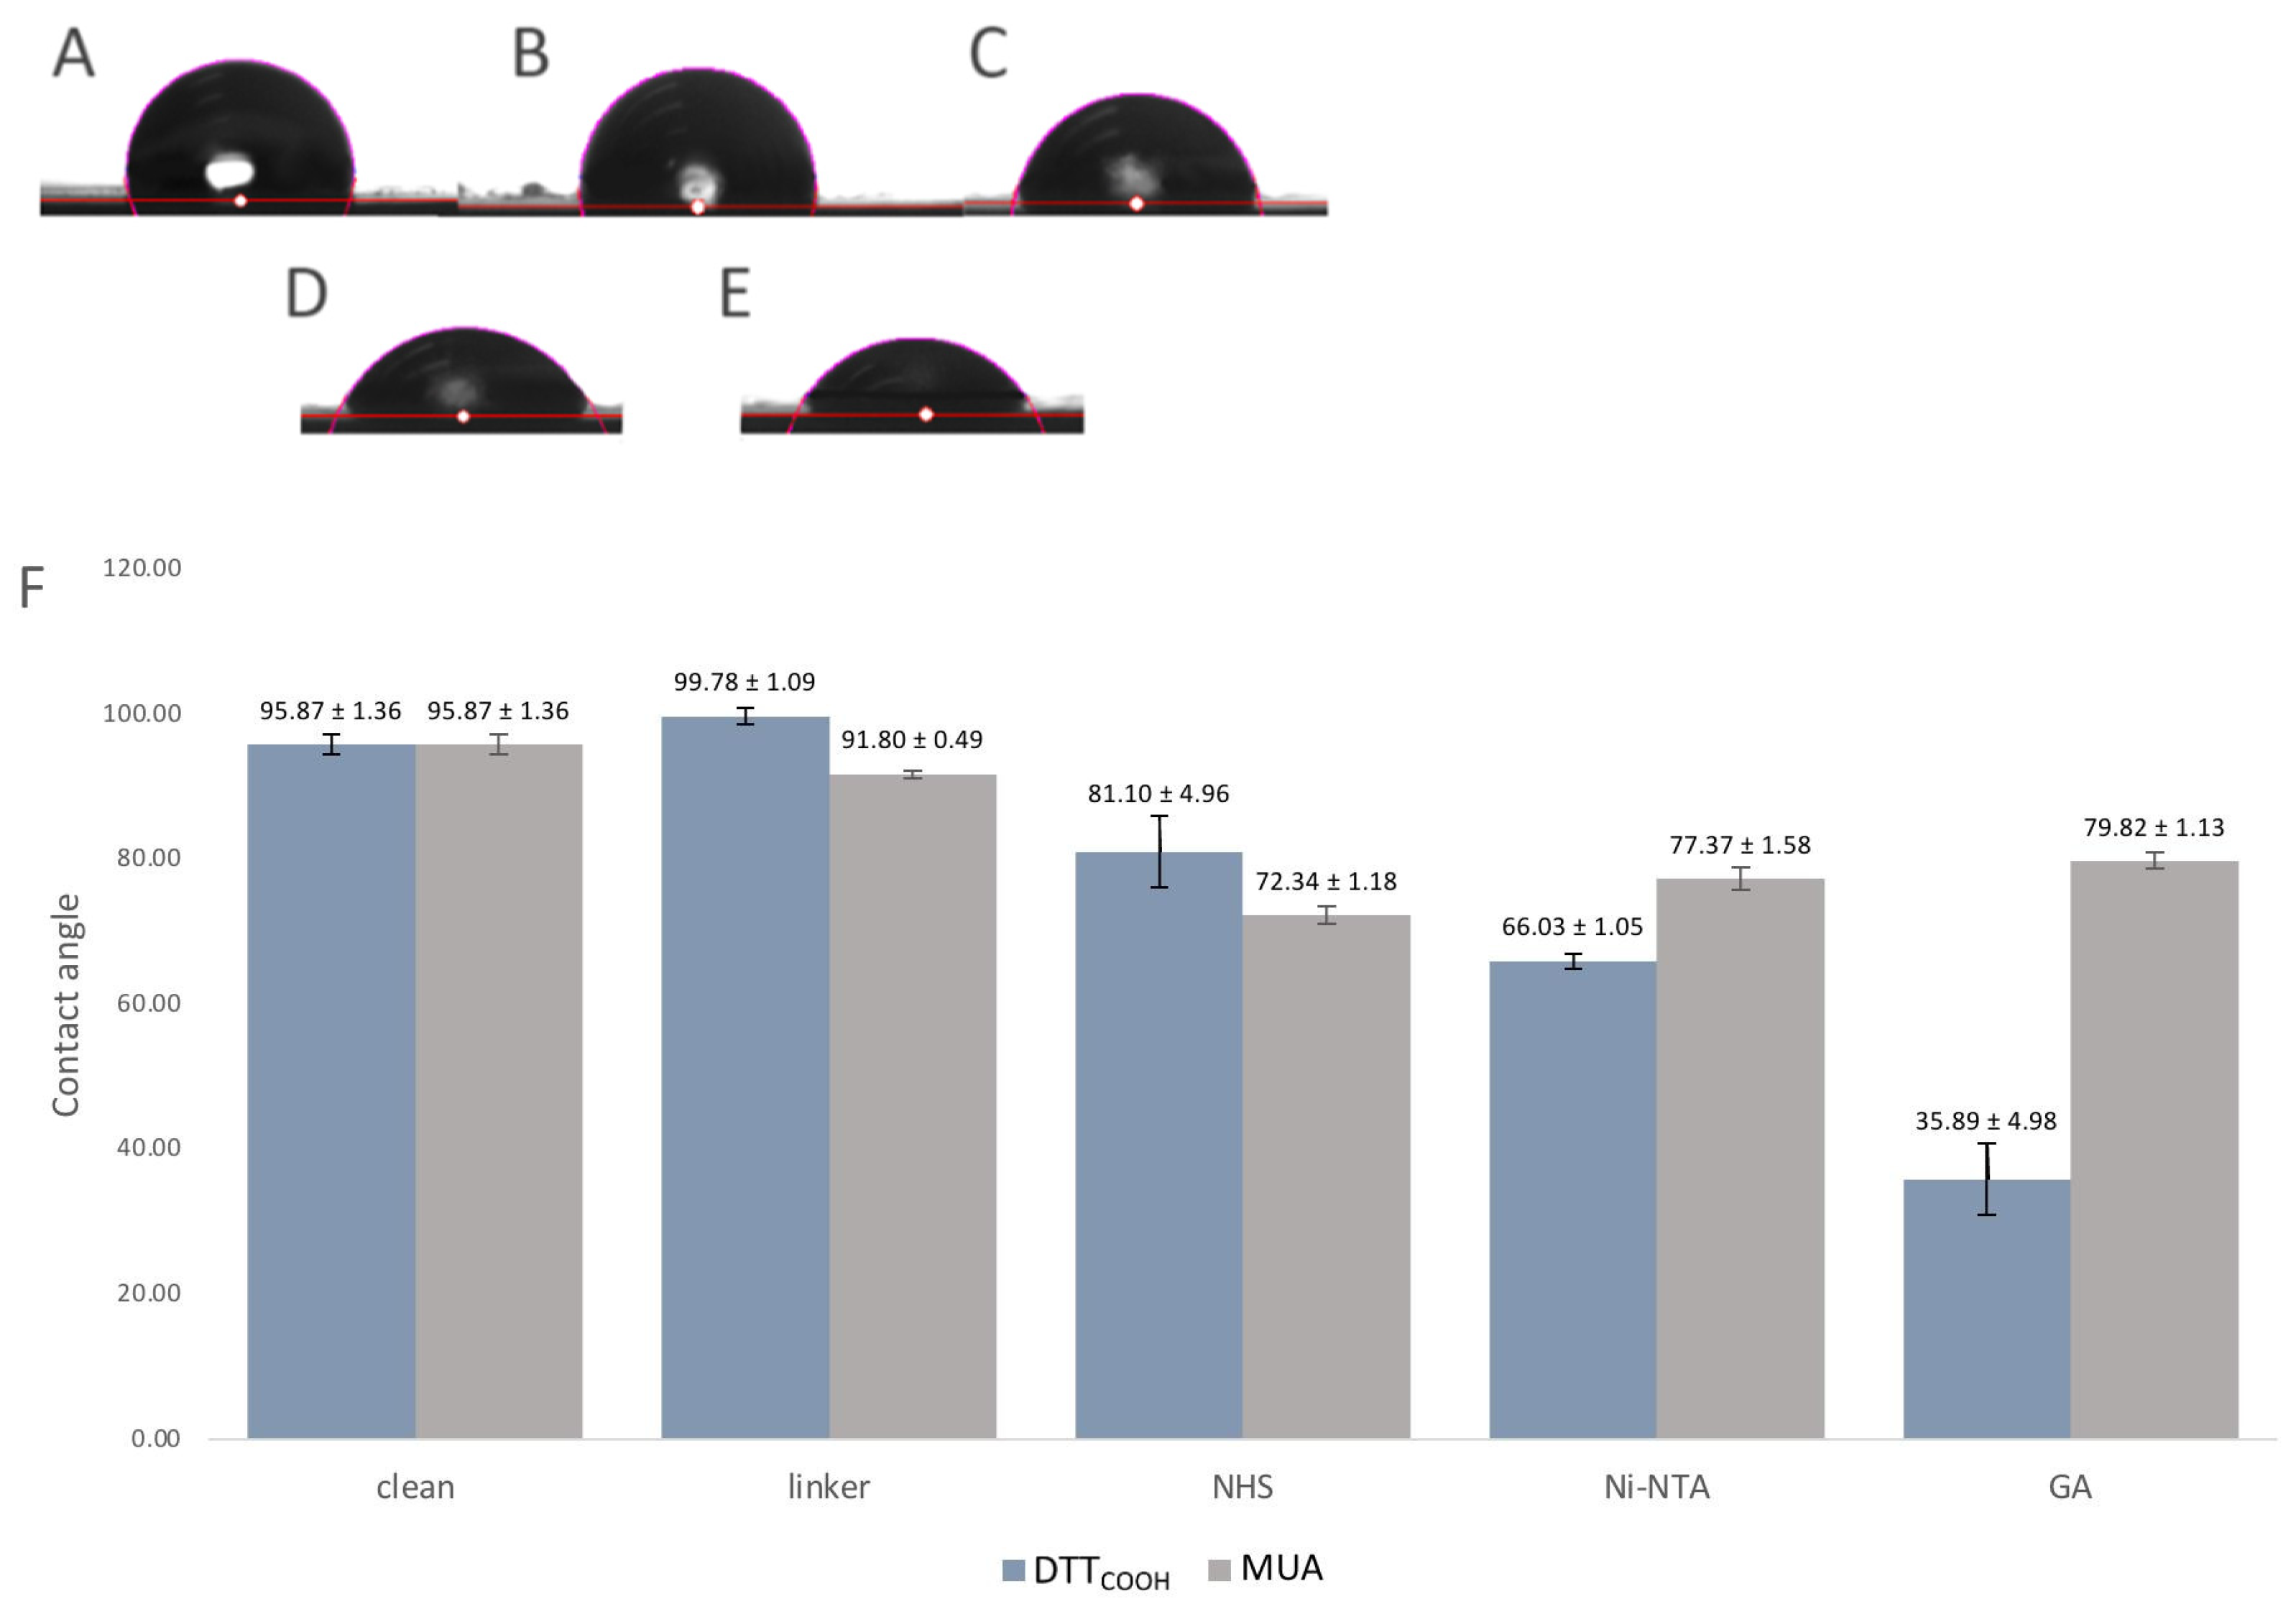
Surface hydrophobicity often changes through surface modifications, indicating how much this surface repels water molecules, and can be used to observe the changes to the surface chemistry. For that reason, the contact angles between a water droplet and a solid surface were used as an indicator of surface hydrophobicity and modifications. The contact angle measurement is a widely accepted method for studying surface wettability and hydrophobicity. A higher contact angle indicates enhanced hydrophobicity, implying that the surface is less wettable by water. Figure 6 illustrates the contact angles of the SPEs following each modification step. Introduction of DTTCOOH to the surface resulted in a slightly increased contact angle compared to the bare gold surface, which may be due to the hydrophobic nature of the molecule. In contrast, the SPE modified with MUA exhibited less hydrophobicity, indicating the linear immobilization of MUA and the exposure of carboxylic acid groups on the surface (Figure 6F). Subsequent modification with NHS/EDC and Ni-NTA led to a further reduction in the contact angle, likely due to the polarity of NHS and the ionic charges on Ni-NTA. The gelsolin–actin complex on the surface significantly increased its hydrophilicity, as evidenced by the decrease in contact angle (35.89 ± 4.98°), confirming successful surface modification. Notably, the SPE surface exhibited less hydrophilicity (Figure 3SB, contact angle 79.8 ± 1.13°) when MUA was employed as the linker for immobilizing gelsolin–actin. The higher contact angle observed when using MUA compared to DTTCOOH may indicate lesser immobilization of gelsolin–actin, leading to less hydrophilicity. This observation provides further confirmation of the superior effectiveness of DTTCOOH in developing the biosensor compared to MUA.

Figure 6.
(A–E) Images of the contact angle measurements of (A) bare SPE, (B) after modification with DTTCOOH, (C) NHS/EDC, (D) Ni-NTA, and (E) gelsolin–actin. (F) Bar chart shows the contact angle of bare SPEs and after modification with DTTCOOH or MUA, NHS/EDC, Ni-NTA, and gelsolin–actin. Error bars represent the standard deviation of three replicates.
3.2. Evaluation of the Electrochemical Biosensor Performance
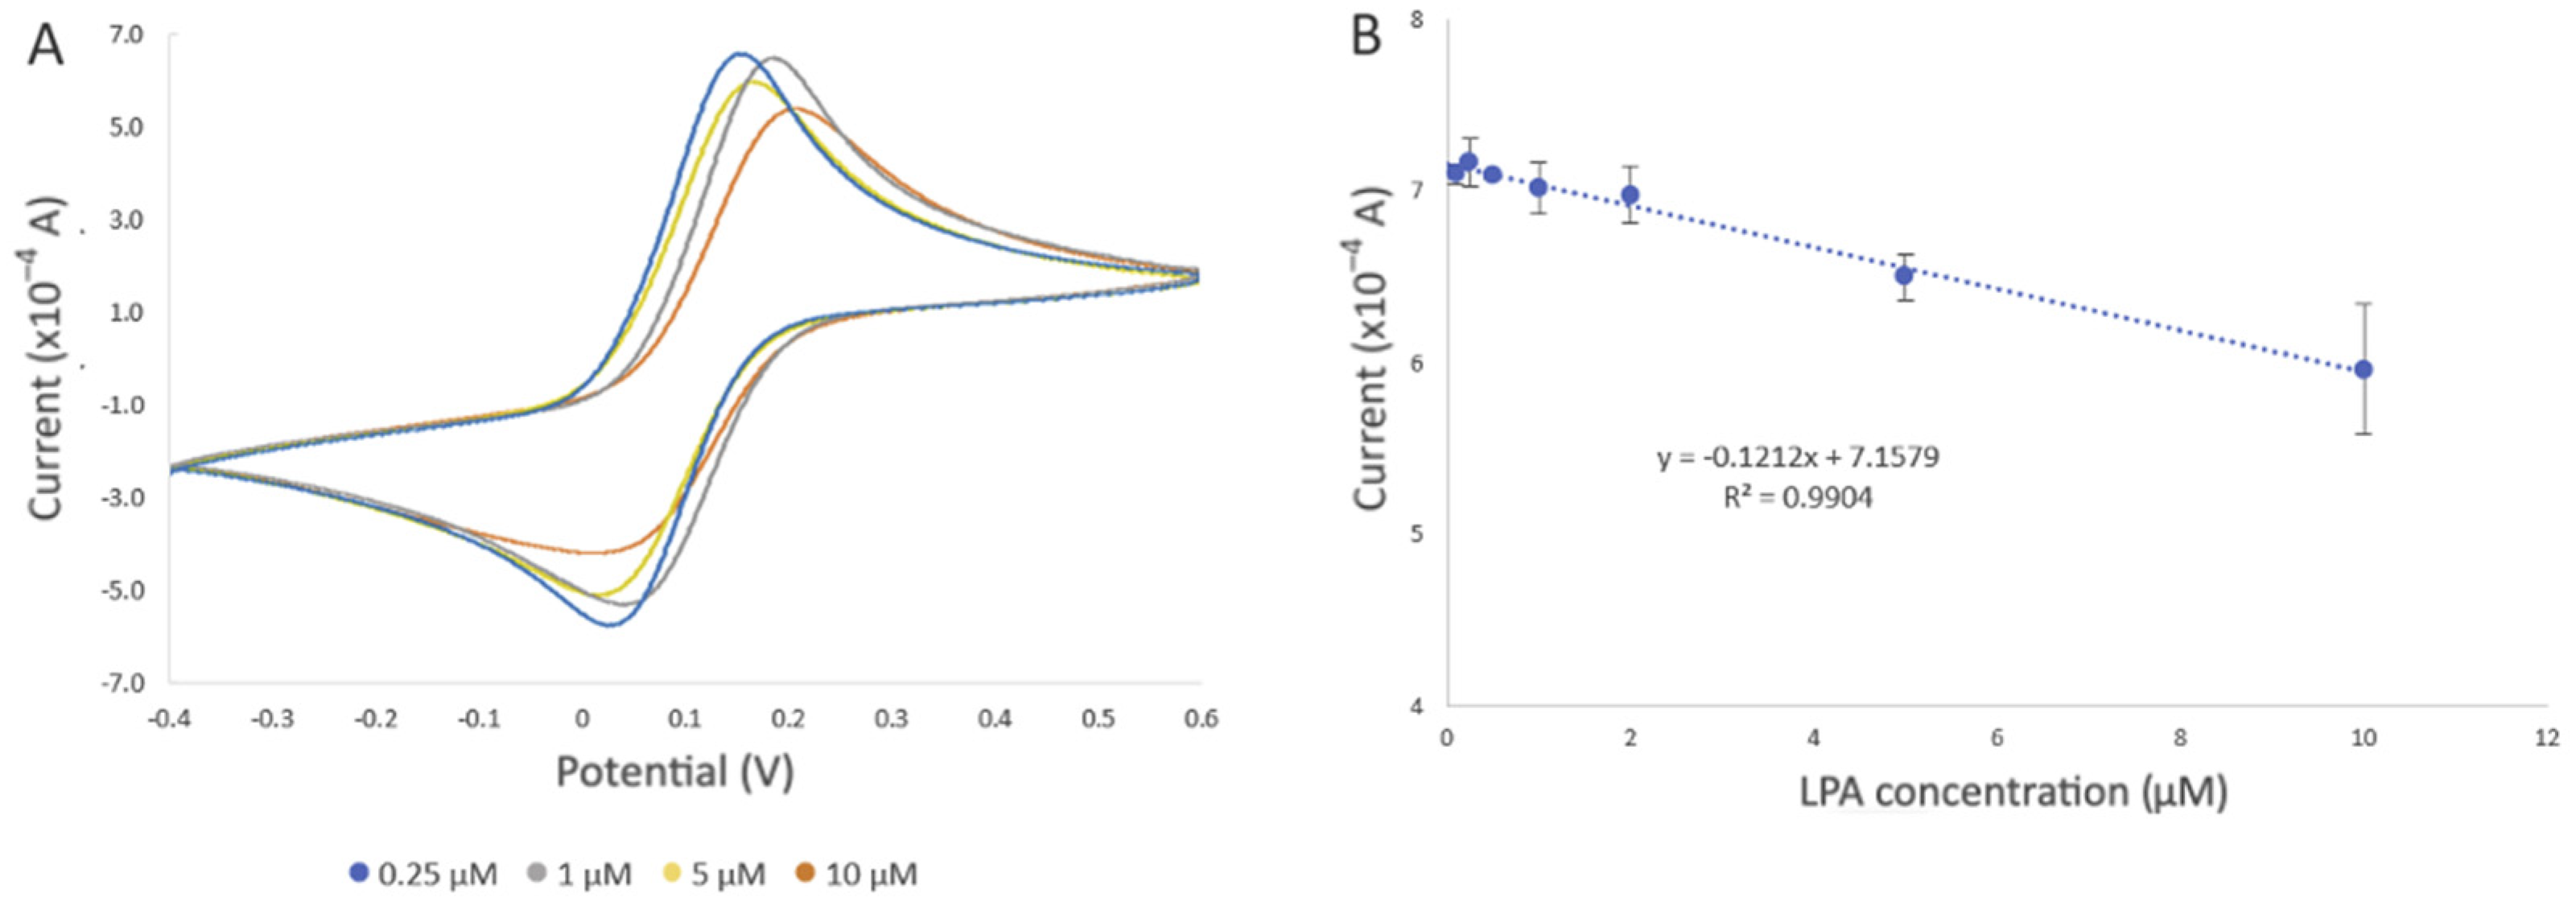
The performance of the developed biosensor was evaluated by detecting different concentrations of LPA in the buffer solution and goat serum. Figure 7A displays the cyclic voltammograms of the developed biosensor upon exposure to LPA concentrations ranging from 0.1 to 10 µM, under optimal experimental conditions in a PBS solution. After incubation of the developed biosensor in the LPA solution, LPA displaces actin in the gelsolin–actin complex due to its higher affinity toward gelsolin. Given that the molecular weight of LPA (436 Da) is smaller than that of actin (42 kDa), it was expected that binding LPA would result in a more efficient electron transfer between the solution and the modified electrode. In CV and DPV, this would appear as an increase in the current. Contrary to our belief, the results showed a decrease in the current after exposing the developed biosensor to LPA. As was previously reported, actin can exhibit some redox activity [26]. As such, participation of redox-active amino acids within the actin structure in the electron transfer process at the electrode surface was validated through a scan rate study (Figure 5 and Figure S3C), as discussed in Section 3.1.2. It is also probable that LPA molecules, upon binding to the biorecognition surface, may create a barrier or hinder access to active sites essential for electron transfer. This interference could disrupt the efficient flow of electrons between the solution and the electrode, thereby contributing to the observed decrease in current intensity. This observation confirmed that the replacement of actin by LPA, which lacks redox activity, could result in the decreased electroactivity and a subsequent reduction in current intensity.
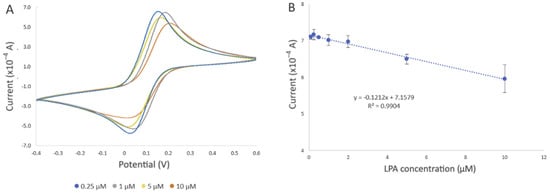
Figure 7.
Evaluation of the developed electrochemical biosensor using different LPA concentrations in PBS. All electrochemical experiments were carried out in 10 mM [Fe(CN)6]3−/4− as the redox probe, which contained 0.5 M KCl as the supporting electrolyte, using SPE with a gold working electrode (4 mm diameter), a gold auxiliary electrode, and a silver reference electrode (EStandard Hydrogen Electrode (SHE) = EAg/AgCl + 0.197 V). (A) Representative cyclic voltammogram of the developed biosensor after incubation in 0.25 µM (blue line), 1 µM (grey line), 5 µM (yellow line), and 10 µM (orange line) LPA solution for 20 min at room temperature. (B) Changes in current intensity obtained from CV were used to draw the calibration curve. The error bars represent three replicate measurements.
In addition to the change in the current intensity, we also observed variations in peak potentials (Figure 7A), which became more pronounced when the biosensor was exposed to 10 µM LPA. This could be due to the displacement of actin by LPA, altering the electrochemical behavior of the SPE. Such changes affect the electron transfer kinetics and, consequently, the redox reaction of [Fe(CN)6]3−/4− occurring at the electrode interface, leading to shifts in the peak potentials [33].
The decrease in current was also observed with increased LPA concentration, which further confirmed the involvement of actin in the electron transfer process. Evaluation of the biosensor with different concentrations of LPA revealed a negative correlation between current intensity and LPA concentration (R2 = 0.9904) (Figure 7B). The estimated limit of detection (LOD) was 0.99 µM, along with a limit of quantification (LOQ) of 3.0 µM (refer to the SI for LOD and LOQ calculation), and a standard error of the predicted y-value for each x in a regression (STEYX) of 0.3899. These data were determined through Regression Analysis, with a maintained a 98% confidence level (Figure 7B).
Evaluation of the Performance of the Developed Biosensor in Goat Serum
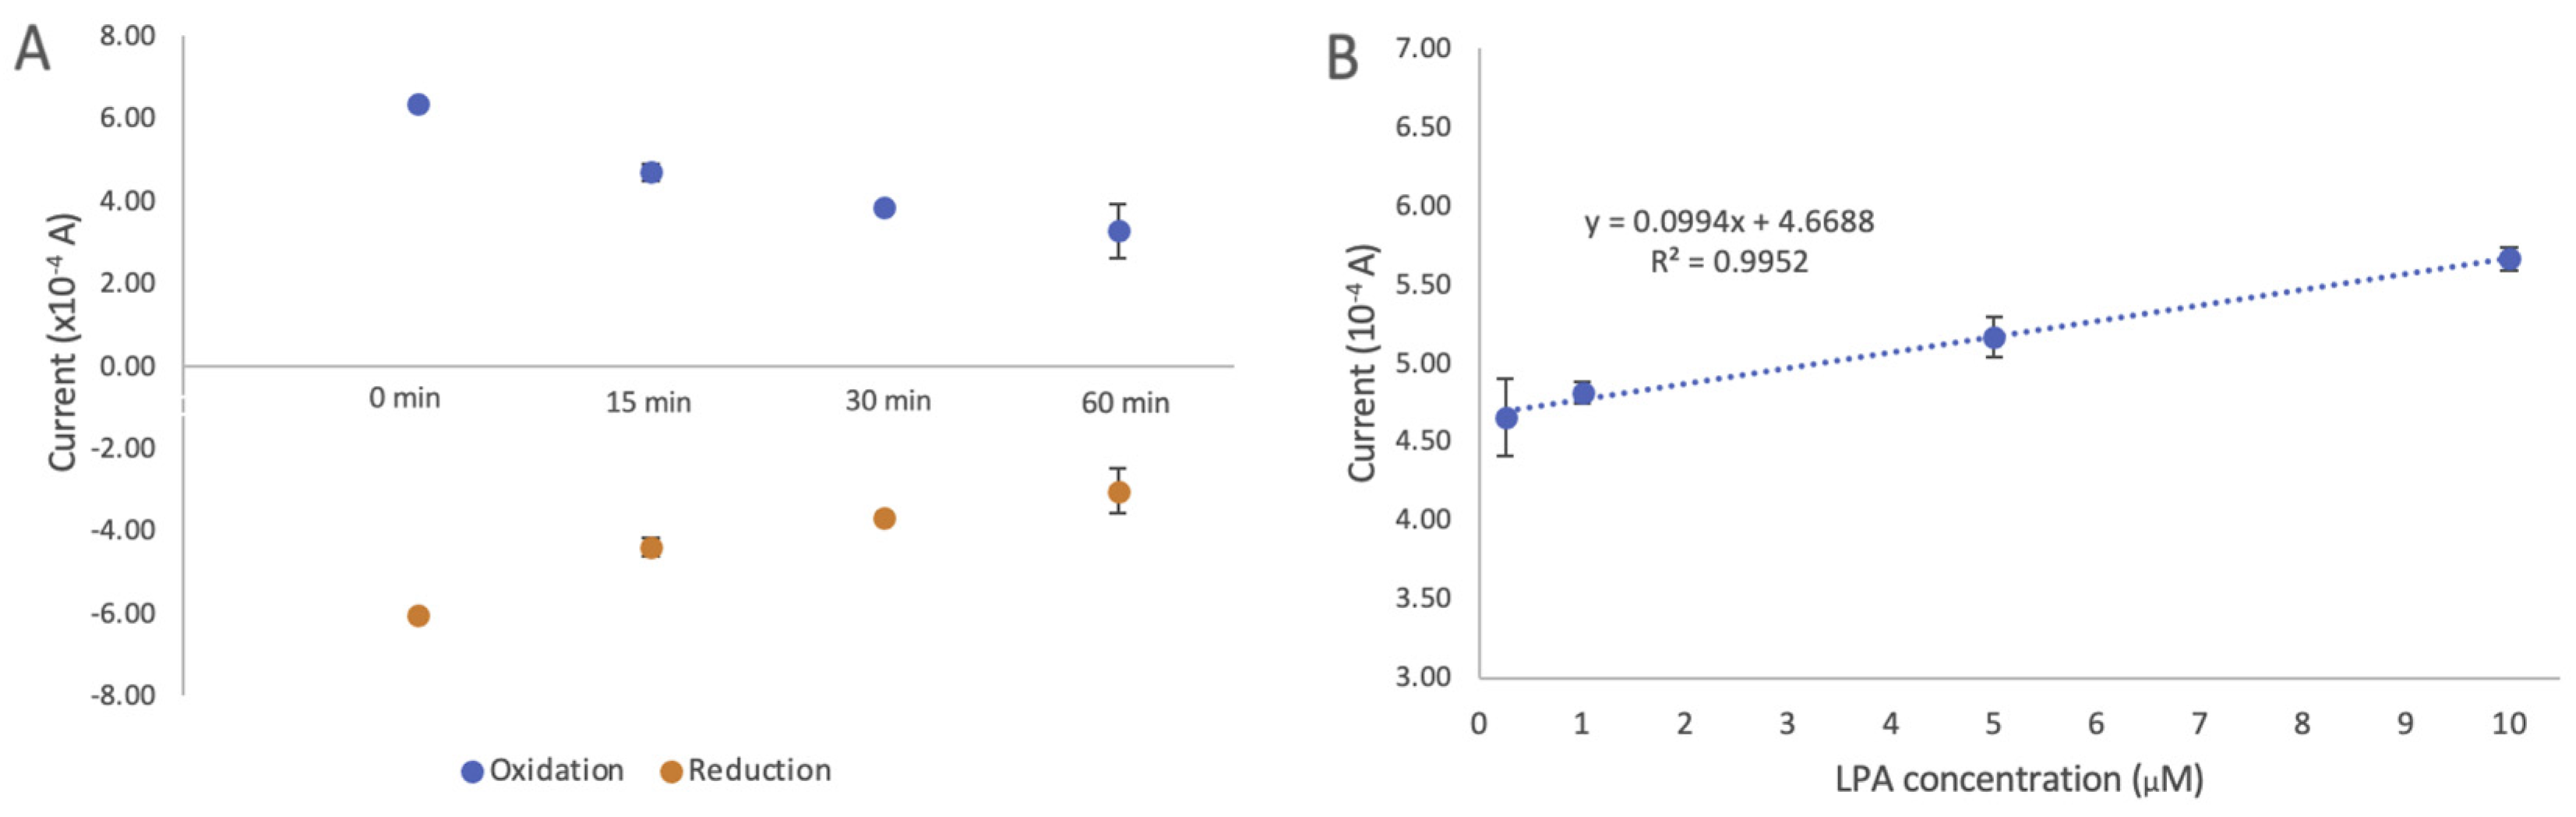
One of the important factors in determining the effectiveness of a given biosensor is its antifouling property in biofluidic samples. We assessed the antifouling of the developed biosensor by comparing the changes in current after modification with DTTCOOH (Figure S5) and the developed biosensor in goat serum. Figure 8A illustrates the changes in current after incubating the developed biosensor in goat serum for 15, 30, and 60 min at room temperature. The results demonstrated that after 15 min, the intensity of the signal dropped by 16.7% in the oxidation signal, but stayed constant for another 30 min with only 0.36% change. A more pronounced decrease was observed after 1 h, with the oxidation signal dropping by 21.9%. The initial drop in the signal after 15 min of incubation could be an indication of certain components of goat serum interacting with actin. While we did not individually assess the effects of each interference, this observation suggests that none of the interferences present in the serum significantly affected the current. This result indicates a significant improvement in antifouling properties when DTTCOOH is used as a linker.
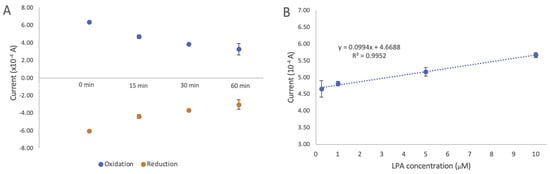
Figure 8.
(A) Changes in cyclic voltammetry current intensity after incubation of the developed biosensor in goat serum for 15, 30, and 60 min. (B) Evaluation of developed electrochemical biosensor using different LPA concentrations (0.25, 1, 5, and 10 µM) in goat serum. Changes in current intensity obtained using cyclic voltammetry were used to draw the calibration curve. The estimated LOD of 0.9 µM and LOQ of 2.76 µM with STEYX (standard error of the predicted y-value for each x in a regression) of 0.0378 were calculated using regression analysis with a 98% confidence level. The error bars represent the standard deviation of three replicates.
The linear correlation between the oxidation current and the LPA concentration (0.01–10 µM) is illustrated in Figure 8B. A linear regression coefficient of 0.9644 was reached, and the limits of detection (LOD) and quantification (LOQ) were calculated to be 0.9 µM and 2.76 µM, respectively (details on LOD and LOQ calculation can be found in the SI). The standard error of the predicted y-value for each x in a regression (STEYX) was determined to be 0.0378, based on a Regression Analysis with a 98% confidence level. Since these LOD and LOQ values are close to those obtained for LPA in the buffer, this further confirms the antifouling properties of the developed biosensor, making it a suitable screening alternative for LPA in human serum. This result also indicates that the developed biosensor does not show any response to other components of goat serum.
A study with 100 healthy volunteers found that LPA levels range from 0.14–1.64 μM [34]. Another study with 27 healthy volunteers and 51 patients with a benign ovarian tumor found that their respective median LPA levels were 1.86 and 6.82 μM [3]. Separate research indicates that, in cases of OC, LPA levels are significantly higher that these of healthy individuals, ranging from 5.4 to 200 μM [35]. Given these findings, the obtained LOD and LOQ fall within the range of LPA levels observed in healthy individuals and the early stages of OC, confirming the potential of the developed biosensor for OC screening.
Interestingly, unlike the measurements conducted in the buffer solution, a positive trend emerged in the presence of goat serum. We hypothesized that the presence of goat serum altered the behavior of the SAM on the electrode surface, consequently reducing or inhibiting the involvement of actin in the electron transfer process. This effect might be attributed to the oxidative species present in the goat serum, which could potentially oxidize amino acids, such as cysteine and methionine, that are known to be particularly vulnerable residues in actin [31,32,36,37]. There is also a possibility that redox-active species present in goat serum could influence the electrochemical properties of the electrode. Comparing the current of the developed biosensor after exposing to the buffer solution and goat serum in the absence of LPA (blank solutions) suggests that components of goat serum may directly block the electrode, possibly due to hydrophobic components, despite the presence of the “water barrier” introduced during the modification process. Given that LPA is a smaller molecule compared to actin, its replacement within gelsolin–actin on the surface led to an increase in current. Further studies need to be carried out to investigate the mechanism of the electron transfer and the role of goat serum in this process.
Table 1 shows the previously reported assays for detecting LPA, indicating that the developed biosensor has a comparable LOD with those of other methods. While the demonstrated LOD values in serum are slightly higher than those of the electrochemical biosensor that we developed before (Table 1), this method is more cost effective. With the minimal amount of the sample required, and a low associated standard deviation, it has a greater potential for miniaturization than the alternatives shown. This can open the window for a quicker and more available preliminary ovarian cancer screening.

Table 1.
Reported methods for LPA detection, their LOD, and linear range.
4. Conclusions
Electrochemical biosensors have a great potential to be used as effective clinical diagnosis tools due to their exceptional sensitivity, rapid response, and potential for miniaturization. In this study, we developed a sensitive label-free electrochemical biosensor while addressing the current challenges of NSA associated with gold surfaces. By using a new linker, DTTCOOH, we successfully engineered a SAM on the gold surface less prone to fouling compared to MUA, a linear thiol linker. Using an affinity-based gelsolin–actin system, we developed a biorecognition surface tailored for LPA detection. Our developed biosensor showed a higher sensitivity compared to the previously reported fluorescence method, achieving the LOD and LOQ of 0.9 µM and LOQ of 2.76 µM in goat serum, which is within the threshold of ovarian cancer diagnosis at early stages. Furthermore, the utilization of thiol chemistry is less challenging compared to silane chemistry, which we previously used to develop an electrochemical biosensor for LPA detection. Unlike silane-based linkers, thiols are not sensitive to oxygen and water, presenting a more practical approach to surface modification. Without the need of complex instrumentation and time-consuming sample preparation, the miniaturized design of the developed biosensor further demonstrates its potential for compact POCT device fabrication. This study presents a proof of concept of using SPE to detect LPA. Future work will evaluate the selectivity and sensitivity of the developed biosensor using human serum. It is crucial to examine the stability and shelf-life of the developed biosensor in order to use it for clinical trials. While stability testing to determine the shelf life was not conducted in this proof-of-concept work, the stability of the modified SPE in an electrochemical environment was assessed by conducting at least seven CV cycles after each modification step. Furthermore, prior research has suggested that surfaces with a thiolate SAM bound to NTA can exhibit stability. This suggests that we could pre-functionalize these surfaces in advance and then further modify them with proteins just before detection, potentially reducing the overall preparation time. It is worth mentioning that understanding the surface chemistry of modified electrodes can open a new direction for designing new electrochemical biosensors with better performance.
Supplementary Materials
The following supporting information can be downloaded at: https://www.mdpi.com/article/10.3390/electrochem5020015/s1, Figure S1: Carbon-13 Nuclear Magnetic Resonance (13C NMR) spectra of 3-(DTT)propanoic acid (DTTCOOH). 13C NMR (126 MHz, CDCl3): δ 171.85 (C7), 81.66 (C2), 77.36 (C1), 65.59 (C5), 40.59 (DCM), 35.91 (C6), 29.84 (C3), and 28.21 (C4). Figure S2: Evaluation of performance of a screen-printed gold electrode using 10 mM [Fe(CN)6]3−/4− as the redox probe containing 0.5 M KCl as the supporting electrolyte. (A–D) Study the influence of scan rate on the CV electrochemical response of the bare electrode. CV experiments started at open circuit potential (OCP), with positive initial scan polarity and varying scan rate from 0.01 to 1.0 V/s. (A) Cyclic voltammograms and (B) graph of the peak potential separation (ΔEP = EP(ox) − EP(red)) vs. scan rate, (C) graph of iP(ox)/iP(red) vs. scan rate, and (D) graph of current vs. square root of scan rate with linear equation of y = 12.71x + 0.6208 and R2 = 0.9977 for the oxidation signals and linear equation of y = −11.321x − 0.7698 and R2 = 0.9952. Figure S3: The influence of scan rate based on the electrochemical response (CV) of the gold SPE after modifications with DTTCOOH, Ni-NTA, and gelsolin–actin using 10 mM [Fe(CN)6]3−/4− as the redox probe containing 0.5 M KCl as the supporting electrolyte, plotted as a function of scan rate. CV experiments started at open circuit potential (OCP), with positive initial scan polarity and varying scan rate from 0.01 to 1.0 V/s. (A) DTTCOOH, (B) Ni-NTA, and (C) gelsolin–actin.
Author Contributions
Conceptualization, M.T. and S.A.; methodology, N.I., S.A., E.C. and S.S.; validation, N.I., S.A. and E.C.; formal analysis, N.I. and L.F.; investigation, N.I. and L.F.; resources, M.T.; writing—original draft preparation and editing, N.I.; writing—review and editing, S.A., E.C. and M.T.; supervision, M.T. and S.A.; funding acquisition, M.T. All authors have read and agreed to the published version of the manuscript.
Funding
This research was funded by Canadian Institutes of Health research through the Project Grant PJT 180421.
Institutional Review Board Statement
Not applicable.
Informed Consent Statement
Not applicable.
Data Availability Statement
The original contributions presented in the study are included in the article/Supplementary Material, further inquiries can be directed to the corresponding author/s.
Acknowledgments
The authors would like to express gratitude to Katarina Dovoudian and Navina Lotay for assisting in the preparation of the LPA solution and guidance. The authors acknowledge the financial support from the Faculty of Arts and Science, University of Toronto, through the Arts & Science Undergraduate Summer Research Fellowship Program. S.P acknowledge the financial support from the European Union’s Horizon 2020 research and innovation program through the Marie Sklodowska-Curie grant agreement and Science Agency VEGA.
Conflicts of Interest
The authors declare no conflicts of interest.
References
- SEER*Explorer: An Interactive Website for SEER Cancer Statistics [Internet]. Surveillance Research Program, National Cancer Institute. Data Source(s): SEER Incidence Data, November 2022 Submission (1975–2020), SEER 22 Registries (Excluding Illinois and Massachusetts). Expected Survival Life Tables by Socio-Economic Standards. 2023. Available online: https://seer.cancer.gov/statistics-network/explorer/ (accessed on 3 April 2023).
- Stewart, C.; Ralyea, C.; Lockwood, S. Ovarian Cancer: An Integrated Review. Semin. Oncol. Nurs. 2019, 35, 151–156. [Google Scholar] [CrossRef] [PubMed]
- Sedláková, I.; Vávrová, J.; Tošner, J.; Hanousek, L. Lysophosphatidic Acid (LPA)—A Perspective Marker in Ovarian Cancer. Tumor Biol. 2011, 32, 311–316. [Google Scholar] [CrossRef] [PubMed]
- Aoki, J. Two Pathways for Lysophosphatidic Acid Production. Biochim. Biophys. Acta BBA-Mol. Cell Biol. Lipids 2008, 1781, 513–518. [Google Scholar] [CrossRef] [PubMed]
- Fang, X. Lysophosphatidic Acid Is a Bioactive Mediator in Ovarian Cancer. Biochim. Biophys. Acta BBA-Mol. Cell Biol. Lipids 2002, 1582, 257–264. [Google Scholar] [CrossRef] [PubMed]
- Xu, Y. Lysophosphatidic Acid as a Potential Biomarker for Ovarian and Other Gynecologic Cancers. JAMA 1998, 280, 719. [Google Scholar] [CrossRef]
- Pozlep, B.; Meleh, M.; Kobal, B.; Verdenik, I.; Osredkar, J.; Kralj, L.Z.; Meden-Vrtovec, H. Use of Lysophosphatidic Acid in the Management of Benign and Malignant Ovarian Tumors. Eur. J. Gynaecol. Oncol. 2007, 28, 394–399. [Google Scholar] [PubMed]
- Sedlákova, I.; Vávrová, J.; Tosner, J.; Hanousek, L. Lysophosphatidic acid in ovarian cancer patients. Ceska Gynekol. 2006, 71, 312–317. [Google Scholar] [CrossRef] [PubMed]
- Choudhary, M.; Arora, K. Electrochemical Biosensors for Early Detection of Cancer. In Biosensor Based Advanced Cancer Diagnostics; Elsevier: Amsterdam, The Netherlands, 2022. [Google Scholar] [CrossRef]
- Tokumura, A.; Harada, K.; Yoshioka, Y.; Tsukatani, H.; Handa, Y. Analyses of Lysophosphatidic Acids by Gas Chromatography Mass Spectrometry without Hydrolytic Pretreatment. Biomed. Mass Spectrom. 1984, 11, 167–171. [Google Scholar] [CrossRef] [PubMed]
- Chen, Y.-L.; Xu, Y. Determination of Lysophosphatidic Acids by Capillary Electrophoresis with Indirect Ultraviolet Detection. J. Chromatogr. B Biomed. Sci. Appl. 2001, 753, 355–363. [Google Scholar] [CrossRef] [PubMed]
- Paimard, G.; Ghasali, E.; Baeza, M. Screen-Printed Electrodes: Fabrication, Modification, and Biosensing Applications. Chemosensors 2023, 11, 113. [Google Scholar] [CrossRef]
- Renedo, O.D.; Alonso-Lomillo, M.A.; Martínez, M.J.A. Recent Developments in the Field of Screen-Printed Electrodes and Their Related Applications. Talanta 2007, 73, 202–219. [Google Scholar] [CrossRef] [PubMed]
- Mincu, N.-B.; Lazar, V.; Stan, D.; Mihailescu, C.M.; Iosub, R.; Mateescu, A.L. Screen-Printed Electrodes (SPE) for In Vitro Diagnostic Purpose. Diagnostics 2020, 10, 517. [Google Scholar] [CrossRef] [PubMed]
- Foster, R.; Cassidy, J.; O’Donoghue, E. Electrochemical Diagnostic Strip Device for Total Cholesterol and Its Subfractions. Electroanalysis 2000, 12, 716–721. [Google Scholar] [CrossRef]
- Shumyantseva, V.; Deluca, G.; Bulko, T.; Carrara, S.; Nicolini, C.; Usanov, S.A.; Archakov, A. Cholesterol Amperometric Biosensor Based on Cytochrome P450scc. Biosens. Bioelectron. 2004, 19, 971–976. [Google Scholar] [CrossRef] [PubMed]
- Li, G.; Liao, J.M.; Hu, G.Q.; Ma, N.Z.; Wu, P.J. Study of Carbon Nanotube Modified Biosensor for Monitoring Total Cholesterol in Blood. Biosens. Bioelectron. 2005, 20, 2140–2144. [Google Scholar] [CrossRef]
- Zhang, H.; Ke, H.; Wang, Y.; Li, P.; Huang, C.; Jia, N. 3D Carbon Nanosphere and Gold Nanoparticle-Based Voltammetric Cytosensor for Cell Line A549 and for Early Diagnosis of Non-Small Cell Lung Cancer Cells. Microchim. Acta 2019, 186, 39. [Google Scholar] [CrossRef] [PubMed]
- Garcia, P.T.; Guimarães, L.N.; Dias, A.A.; Ulhoa, C.J.; Coltro, W.K.T. Amperometric Detection of Salivary α-Amylase on Screen-Printed Carbon Electrodes as a Simple and Inexpensive Alternative for Point-of-Care Testing. Sens. Actuators B Chem. 2018, 258, 342–348. [Google Scholar] [CrossRef]
- Lichtenberg, J.Y.; Ling, Y.; Kim, S. Non-Specific Adsorption Reduction Methods in Biosensing. Sensors 2019, 19, 2488. [Google Scholar] [CrossRef] [PubMed]
- Choi, S.; Chae, J. Methods of Reducing Non-Specific Adsorption in Microfluidic Biosensors. J. Micromech. Microeng. 2010, 20, 075015. [Google Scholar] [CrossRef]
- Turell, L.; Radi, R.; Alvarez, B. The Thiol Pool in Human Plasma: The Central Contribution of Albumin to Redox Processes. Free Radic. Biol. Med. 2013, 65, 244–253. [Google Scholar] [CrossRef]
- Spagnolo, S.; Davoudian, K.; Ahmadi, S.; Chan, E.; Hianik, T.; Thompson, M. Thiol-Based Probe Linker with Antifouling Properties for Aptasensor Development. Chemosensors 2022, 10, 435. [Google Scholar] [CrossRef]
- De La Franier, B.; Thompson, M. Detection of the Ovarian Cancer Biomarker Lysophosphatidic Acid in Serum. Biosensors 2020, 10, 13. [Google Scholar] [CrossRef] [PubMed]
- Goetzl, E.J.; Lee, H.; Azuma, T.; Stossel, T.P.; Turck, C.W.; Karliner, J.S. Gelsolin Binding and Cellular Presentation of Lysophosphatidic Acid. J. Biol. Chem. 2000, 275, 14573–14578. [Google Scholar] [CrossRef] [PubMed]
- Ahmadi, S.; Lotay, N.; Thompson, M. Affinity-Based Electrochemical Biosensor with Antifouling Properties for Detection of Lysophosphatidic Acid, a Promising Early-Stage Ovarian Cancer Biomarker. Bioelectrochemistry 2023, 153, 108466. [Google Scholar] [CrossRef] [PubMed]
- Farzin, L.; Shamsipur, M. Recent Advances in Design of Electrochemical Affinity Biosensors for Low Level Detection of Cancer Protein Biomarkers Using Nanomaterial-Assisted Signal Enhancement Strategies. J. Pharm. Biomed. Anal. 2018, 147, 185–210. [Google Scholar] [CrossRef] [PubMed]
- Xue, Y.; Li, X.; Li, H.; Zhang, W. Quantifying Thiol–Gold Interactions towards the Efficient Strength Control. Nat. Commun. 2014, 5, 4348. [Google Scholar] [CrossRef] [PubMed]
- Rubio, C.P.; Cerón, J.J. Spectrophotometric Assays for Evaluation of Reactive Oxygen Species (ROS) in Serum: General Concepts and Applications in Dogs and Humans. BMC Vet. Res. 2021, 17, 226. [Google Scholar] [CrossRef]
- Ghasemi, A.; Zahediasl, S.; Azizi, F. Reference Values for Serum Nitric Oxide Metabolites in an Adult Population. Clin. Biochem. 2010, 43, 89–94. [Google Scholar] [CrossRef] [PubMed]
- Xu, Q.; Huff, L.P.; Fujii, M.; Griendling, K.K. Redox Regulation of the Actin Cytoskeleton and Its Role in the Vascular System. Free Radic. Biol. Med. 2017, 109, 84–107. [Google Scholar] [CrossRef] [PubMed]
- Rouyère, C.; Serrano, T.; Frémont, S.; Echard, A. Oxidation and Reduction of Actin: Origin, Impact In Vitro and Functional Consequences In Vivo. Eur. J. Cell Biol. 2022, 101, 151249. [Google Scholar] [CrossRef] [PubMed]
- Nicholson, R.S. Theory and Application of Cyclic Voltammetry for Measurement of Electrode Reaction Kinetics. Anal. Chem. 1965, 37, 1351–1355. [Google Scholar] [CrossRef]
- Michalczyk, A.; Budkowska, M.; Dołęgowska, B.; Chlubek, D.; Safranow, K. Lysophosphatidic acid plasma concentrations in healthy subjects: Circadian rhythm and associations with demographic, anthropometric and biochemical parameters. Lipids Health Dis. 2017, 16, 140. [Google Scholar] [CrossRef] [PubMed]
- Westermann, A.M.; Havik, E.; Postma, F.R.; Beijnen, J.H.; Dalesio, O.; Moolenaar, W.H.; Rodenhuis, S. Malignant Effusions Contain Lysophosphatidic Acid (LPA)-like Activity. Ann. Oncol. 1998, 9, 437–442. [Google Scholar] [CrossRef] [PubMed]
- Wilson, C.; Terman, J.R.; González-Billault, C.; Ahmed, G. Actin Filaments-A Target for Redox Regulation: F-Actin as a Target of Redox Signaling. Cytoskeleton 2016, 73, 577–595. [Google Scholar] [CrossRef] [PubMed]
- Hung, R.-J.; Pak, C.W.; Terman, J.R. Direct Redox Regulation of F-Actin Assembly and Disassembly by Mical. Science 2011, 334, 1710–1713. [Google Scholar] [CrossRef] [PubMed]
- Jiang, T.; Lu, N.; Yang, J.; Hang, Y.; Wang, J.; Zhao, P.; Hua, J. Dibenzo[a,c]Phenazine-Derived near-Infrared Fluorescence Biosensor for Detection of Lysophosphatidic Acid Based on Aggregation-Induced Emission. RSC Adv. 2015, 5, 102863–102867. [Google Scholar] [CrossRef]
- Zheng, Z.; Geng, W.-C.; Gao, J.; Wang, Y.-Y.; Sun, H.; Guo, D.-S. Ultrasensitive and Specific Fluorescence Detection of a Cancer Biomarker via Nanomolar Binding to a Guanidinium-Modified Calixarene. Chem. Sci. 2018, 9, 2087–2091. [Google Scholar] [CrossRef] [PubMed]
- Tarannum, N.; Kumar, D.; Agrawal, R.; Verma, Y. Selectively Imprinted Β-cyclodextrin Polymer for Colorimetric Assay of Lysophosphatidic Acid for Point of Care Detection of Ovarian Cancer. ChemistrySelect 2022, 7, e202202027. [Google Scholar] [CrossRef]
- Wang, Y.; Pei, H.; Jia, Y.; Liu, J.; Li, Z.; Ai, K.; Lu, Z.; Lu, L. Synergistic Tailoring of Electrostatic and Hydrophobic Interactions for Rapid and Specific Recognition of Lysophosphatidic Acid, an Early-Stage Ovarian Cancer Biomarker. J. Am. Chem. Soc. 2017, 139, 11616–11621. [Google Scholar] [CrossRef] [PubMed]
- Chen, X.; Gui, W.; Liu, H.; Ma, Q. A Novel CuZnInS Quantum Dot-Based ECL Sensing System for Lysophosphatidic Acid Detection. Analyst 2017, 142, 4142–4149. [Google Scholar] [CrossRef] [PubMed]

Disclaimer/Publisher’s Note: The statements, opinions and data contained in all publications are solely those of the individual author(s) and contributor(s) and not of MDPI and/or the editor(s). MDPI and/or the editor(s) disclaim responsibility for any injury to people or property resulting from any ideas, methods, instructions or products referred to in the content. |
© 2024 by the authors. Licensee MDPI, Basel, Switzerland. This article is an open access article distributed under the terms and conditions of the Creative Commons Attribution (CC BY) license (https://creativecommons.org/licenses/by/4.0/).