Abstract
The influence of the component composition of coal batches and the final temperature of the coking process on the resistivity of coke was studied. Taking into account that the resistivity and reactivity are influenced by some common factors, such as the temperature level and coke readiness, which indicates the orderliness of its structure, the relationship between these indicators was established. The electrical resistivity can be considered a cumulative characteristic of coke properties, as evidenced by the mathematical dependencies of the change electrical resistance on the ash content, sulfur content, volatile yield, and petrographic composition. Analysis of the dependencies and their statistical evaluation indicate that the studied relationships are characterized by high values of correlation (0.6–0.84). The proposed regression equations can be recommended for optimizing the component composition and quality of production batches, given their significant impact on the resistivity of coke. This is especially relevant when coke is used in electrothermal processes, since the productivity and the electrical and thermal efficiency of the furnace depends on the resistivity of the coke in electrochemical processes in which carbon materials are used as anodes and lining elements and in the production of capacitor technology. As the resistivity test requires much less time to perform than the reactivity test, it can be considered as an alternative approach to the reactivity testing currently performed for quality control purposes.
1. Introduction
The quality of coke charged to a blast furnace is one of the most important parameters determining successful operation of the furnace. The requirements for coke quality can be summarized as follows:
- -
- To ensure maximum energy intensity and optimal reactivity, coke should contain a maximum amount of carbon and a minimum amount of ash;
- -
- To ensure a uniform distribution of gases across the blast furnace cross-section by sieve (particle size distribution), coke must be uniform in size, have a minimum content of small (less than 25 mm) and large (more than 80 mm) fractions, and have high strength in cold and hot conditions;
- -
- In addition, to reduce environmental pollution and the quantity of auxiliary reagents, coke should contain a minimum sulfur content [1,2].
The physical properties of coke include its microstructure, actual and apparent density, porosity, electrical conductivity, electrical resistance, structural strength, abrasive hardness, and thermal characteristics (heat capacity, calorific value, thermal conductivity) [1]. At the same time, physical properties are determined by the structure of the coke substance. In turn, the degree of carbonization and properties of raw materials and the influence of technological parameters of the coking process determine the carbon structure of coke and its metallurgical characteristics [1,2].
The most important characteristics of coke used in electrochemical and electrothermal processes are reactivity, electrical conductivity (specific electrical resistivity), thermal stability, and technical analysis indicators (ash content, volatile matter yield). In electrothermal processes, coke serves as a reducing agent. The electrical resistivity of coke significantly affects the performance of the electric furnace, electricity consumption, and the degree of elemental recovery from ores. An increase in the specific electrical resistance increases the productivity and thermal and electrical efficiency of the furnace [1].
The molecular structure of the organic mass of coke is determined by the final process temperature. It is quantitatively characterized by X-ray diffraction analysis using the following indicators: d002—the average distance between adjacent planes in adjacent blocks; Cb—the fraction of carbon contained in the block structures, %; La—the average size of coherent blocks normal to the planes of carbon layers, nm; Lc—the average size of the carbon layers in the plane, nm [1].
Works [3,4] report that the heat treatment of coal feedstocks at 1200 °C causes an increase in crystallite size from ~5.9–6.5 to ~7.8–10 Å, which in turn causes an increase in aromaticity from 58–72% to 75–82%. At the same time, changes in the interlayer distance were also recorded. It decreased by 1.14–1.7% for raw materials and by 5.4–8.3% for heat-treated coal.
The study of coke structure is based on the study of coke carbon, the distribution of carbon atoms in hybrid states, and the degree of ordering, i.e., the ratio of ordered and disordered carbon. Coal exhibits dielectric properties [5], which is explained by the large number of σ-bonds formed by the carbon atom in the sp3 hybridization state. Under the influence of high temperatures in the process of coking and deep cracking, macromolecules are practically deprived of side chains, which leads to the formation of condensed polyaromatic structures containing carbon in sp hybridization.
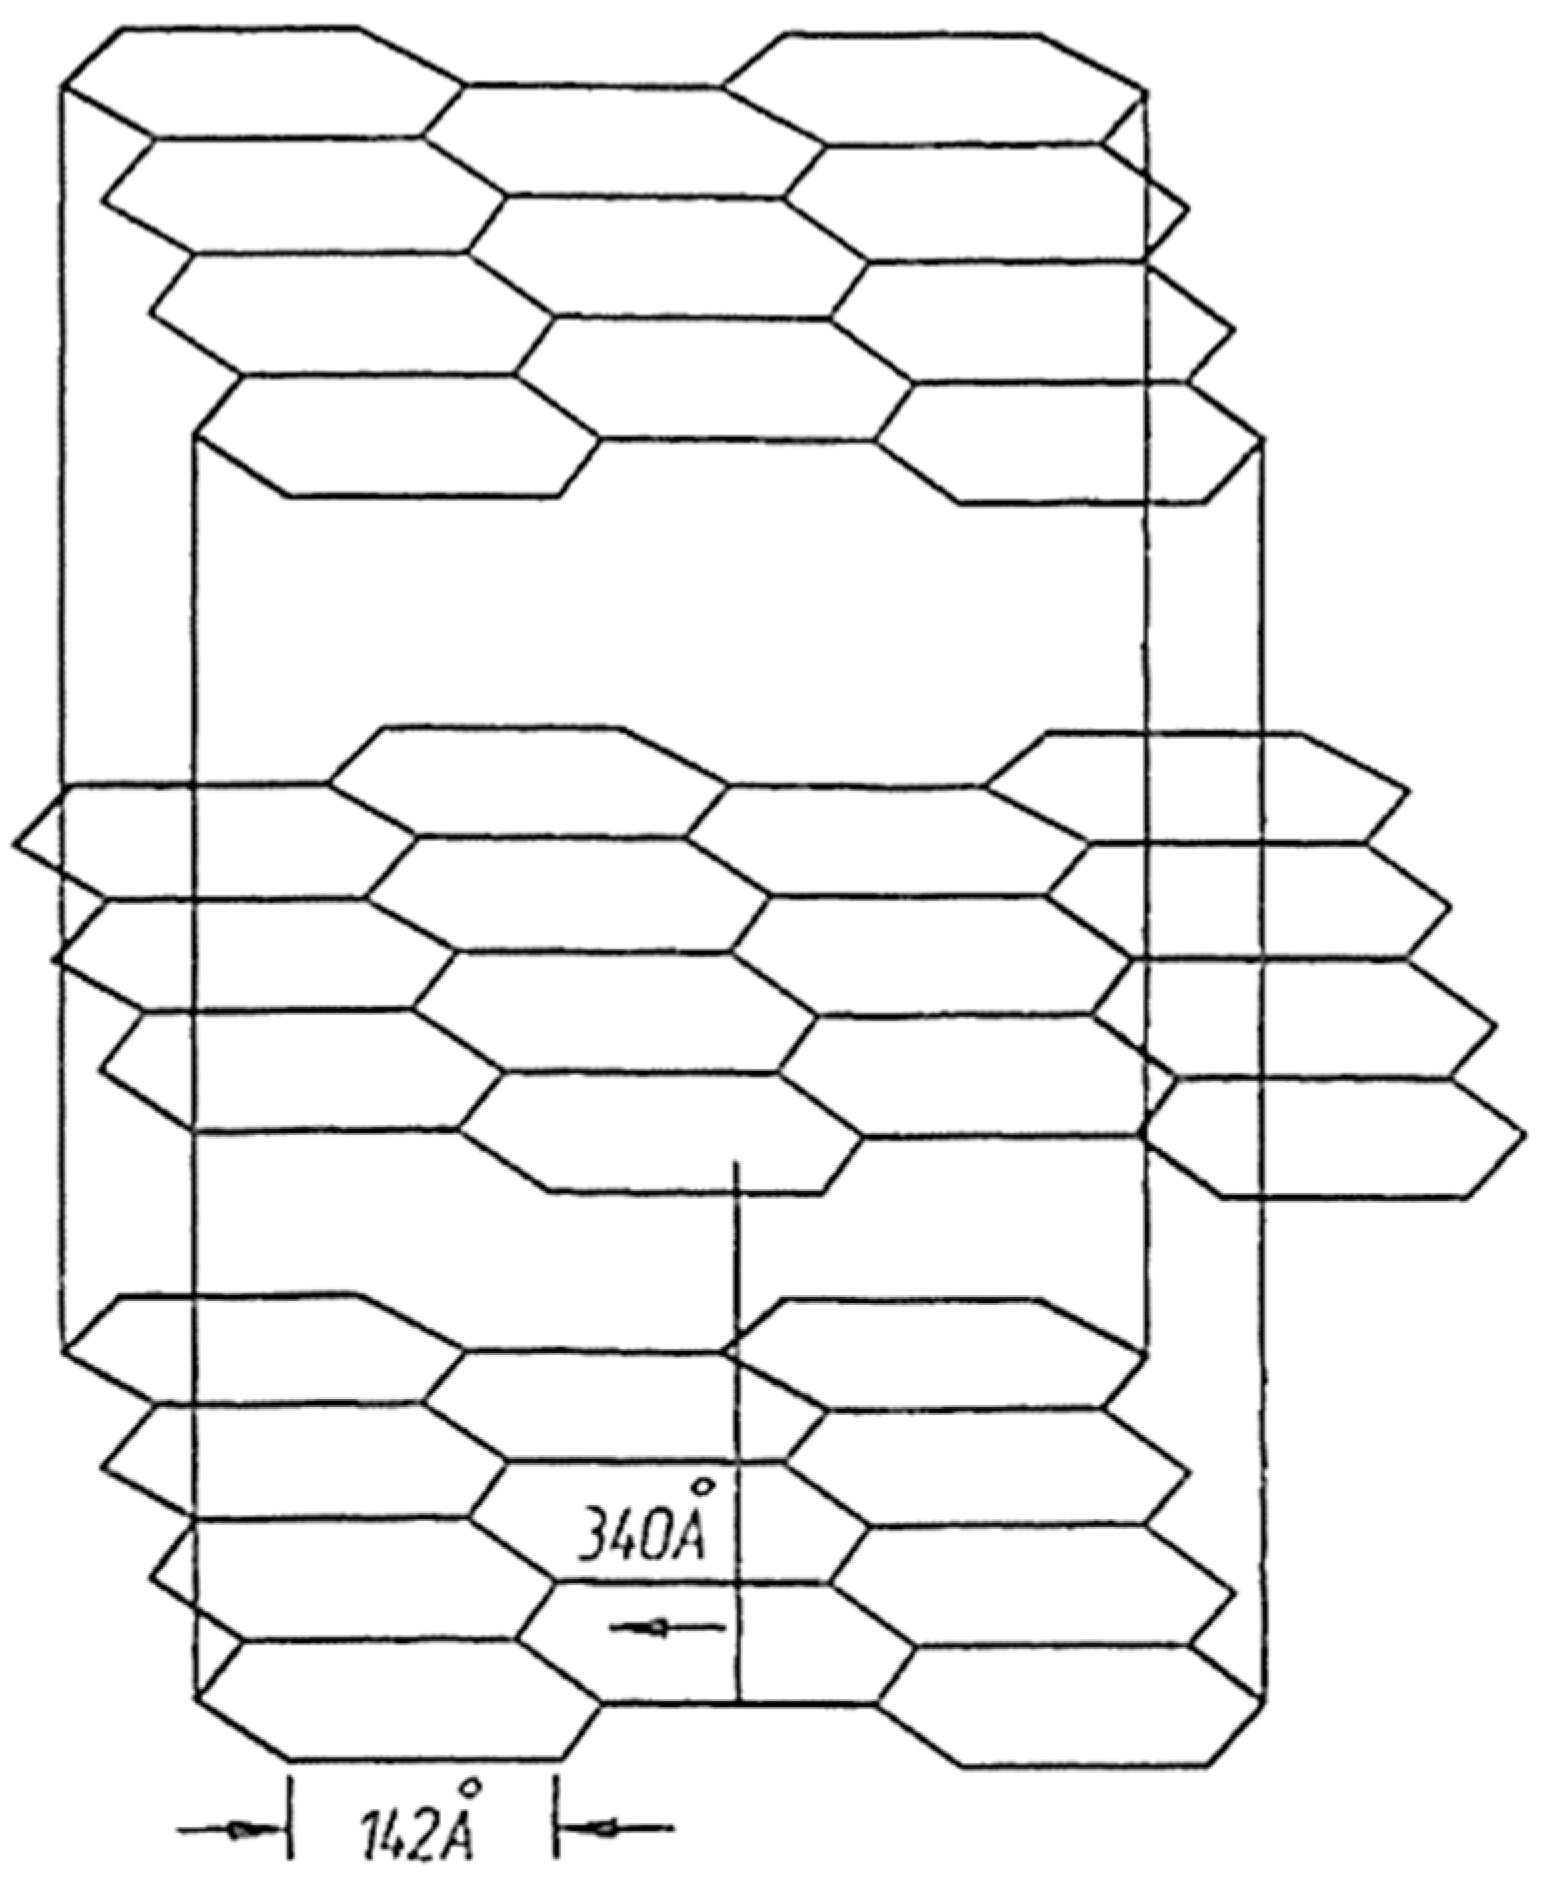
This improves the orderliness of the coke structure, bringing it closer to the structure of graphite (Figure 1), whose single crystals consist of a large number of parallel layers formed by hexagons of carbon atoms. In the interlayer space, π electrons form a single unified electron cloud with sufficient mobility. This explains the high electrical conductivity of carbon materials.

Figure 1.
Scheme of graphite structure [1].
Thus, the degree of orderliness of the structure of carbonaceous materials can be controlled by the value of the resistivity.
Given that the resistivity is considered an indicator of the structural features of carbon materials, its value will be determined by both the raw material factors and the influence of coking technology. This paper is devoted to substantiating the correlation between the resistivity of a material and the orderliness of its structure.
2. Materials and Methods
Coal blends were used for this research, the component compositions of which are given in Table 1. The main characteristics and technological properties of the coal blends (according to the data of proximate analysis and plastometric and petrographic analyses) are given in Table 2. The technical characteristics of the coke ovens and the coking process parameters (period and temperature) under the conditions of coke production at the Dnipro Metallurgical Plant (Dnipro, Ukraine) are presented in Table 3 and Table 4, respectively.

Table 1.
Compositions of coal batches.
Table 2.
Proximate, plastometric, and petrographic analyses of coal batches.
Table 3.
Technical characteristics of coke ovens.
Table 4.
Coking conditions of coal batches.
Standardized methods were used to determine the characteristics of the coal raw materials:
- -
- State standard of Ukraine 4096-2002 “Brown coal, hard coal, anthracite, combustible shale and coal briquettes. Methods of sample selection and preparation for laboratory tests” [6];
- -
- ISO 1171-97 “Solid mineral fuels. Methods for determination of ash” [7];
- -
- ISO 589-81 “Hard coal—Determination of total moisture” [8];
- -
- ISO 562:2010 “Hard coal and coke. Determination of volatile matter” [9]
- -
- ISO 334:2020 “Coal and coke. Determination of total sulfur. Eschka method” [10]
- -
- ISO 7404-3-84 “Methods for the petrographic analysis of bituminous coal and anthracite—Part 3: Method of determining maceral group composition” [11];
- -
- ISO 7404-5-85 “Methods for the petrographic analysis of coals—Part 5: Method of determining microscopically the reflectance of vitrinite” [12];
- -
- State standard of Ukraine 7722:2015 “Hard coal. Method of Determining Plastometric Characteristics” [13].
Coal ranks were specified in accordance with the current State Standard of Ukraine 3472-2015 (G—gas coal, GZhP—gas bituminous poorly clinkering coal, GF—gas bituminous coal, Zh—bituminous coal, K—coke coal, PS—poorly clinkering coal, KS—coking poorly clinkering coal) [14].
Resistivity is a physical quantity that characterizes the ability of a substance to prevent the passage of an electric current through it. The resistivity of the coke was determined according to the DSTU 8831:2019 Coke Method for determining the resistivity of coal coke powder [15], which establishes a method for measuring the resistivity of coal coke powder in the range from 0.05 Ω·cm to 0.5 Ω·cm.
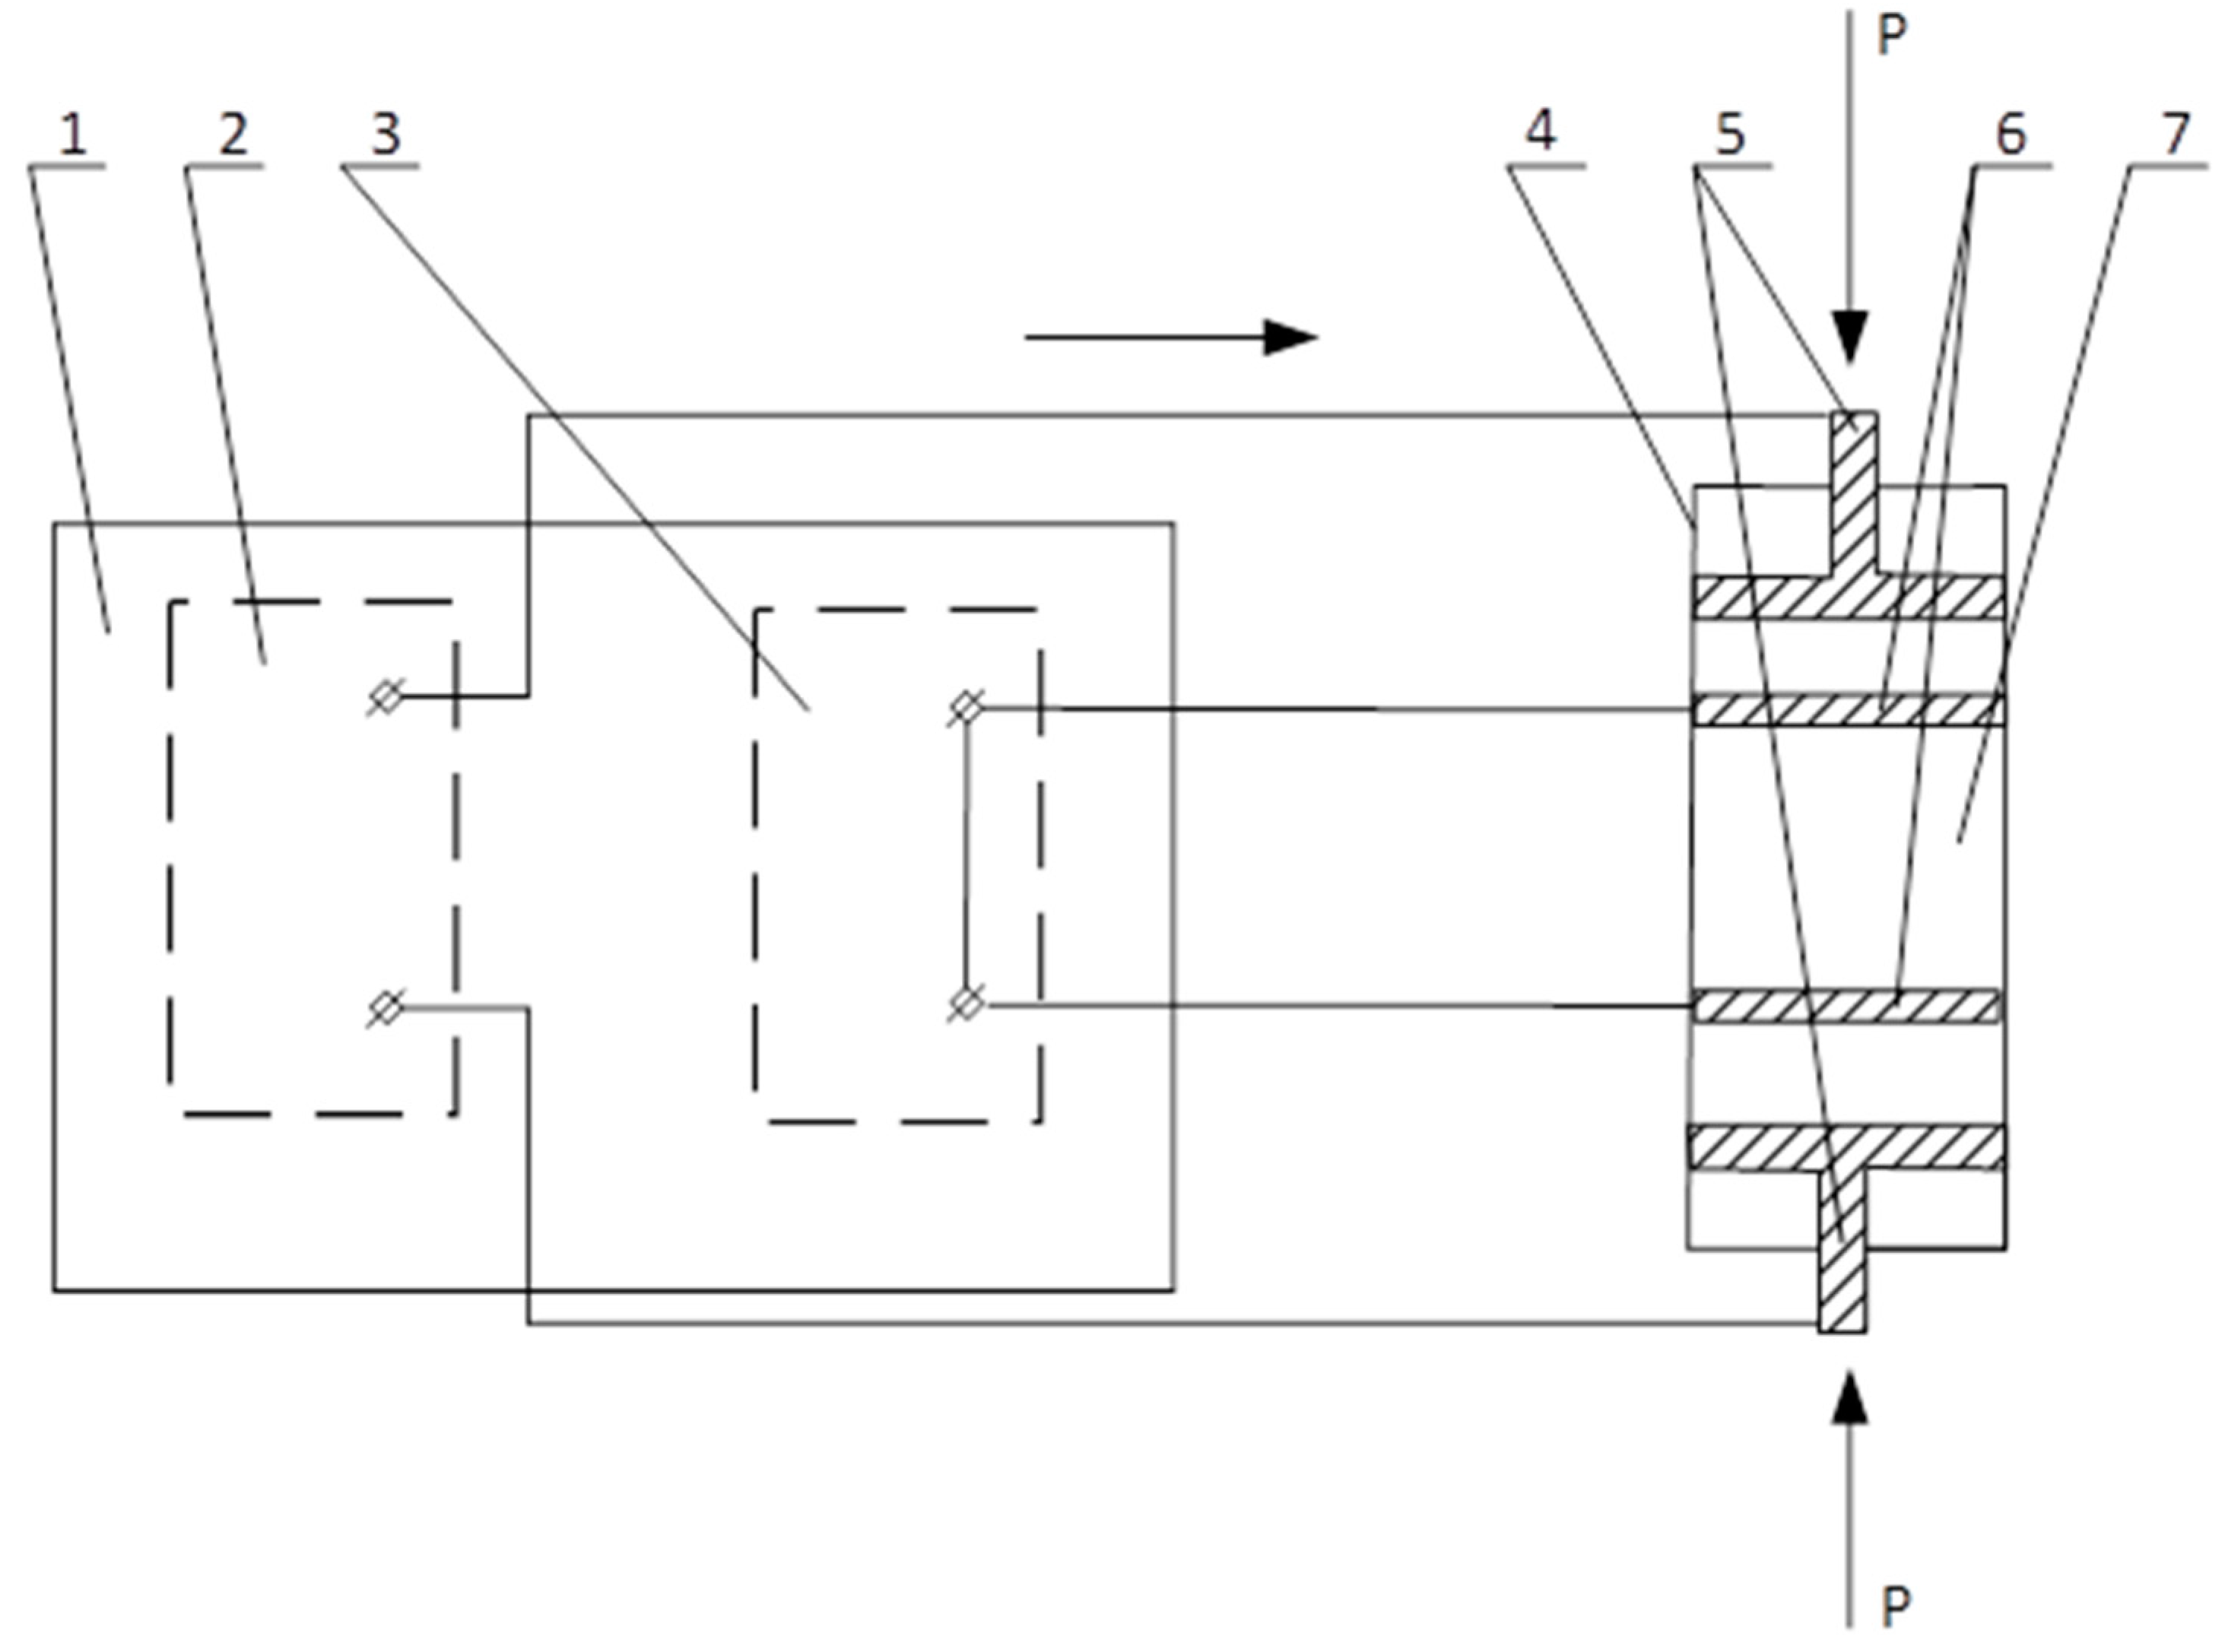
The two-probe method of measuring the resistivity of coke is as follows: a current (2) is passed through a cylindrical coke sample (7), to which current electrodes (5) are pressed, and the voltage drop on the sample during the current passage is measured (Figure 2).

Figure 2.
Block diagram of the device for measuring the electrical resistance of coke powder: (1) measuring unit; (2) source of stabilized current; (3) digital measuring device; (4) two-probe measuring matrix; (5) current electrodes; (6) measuring electrodes; (7) coke sample.
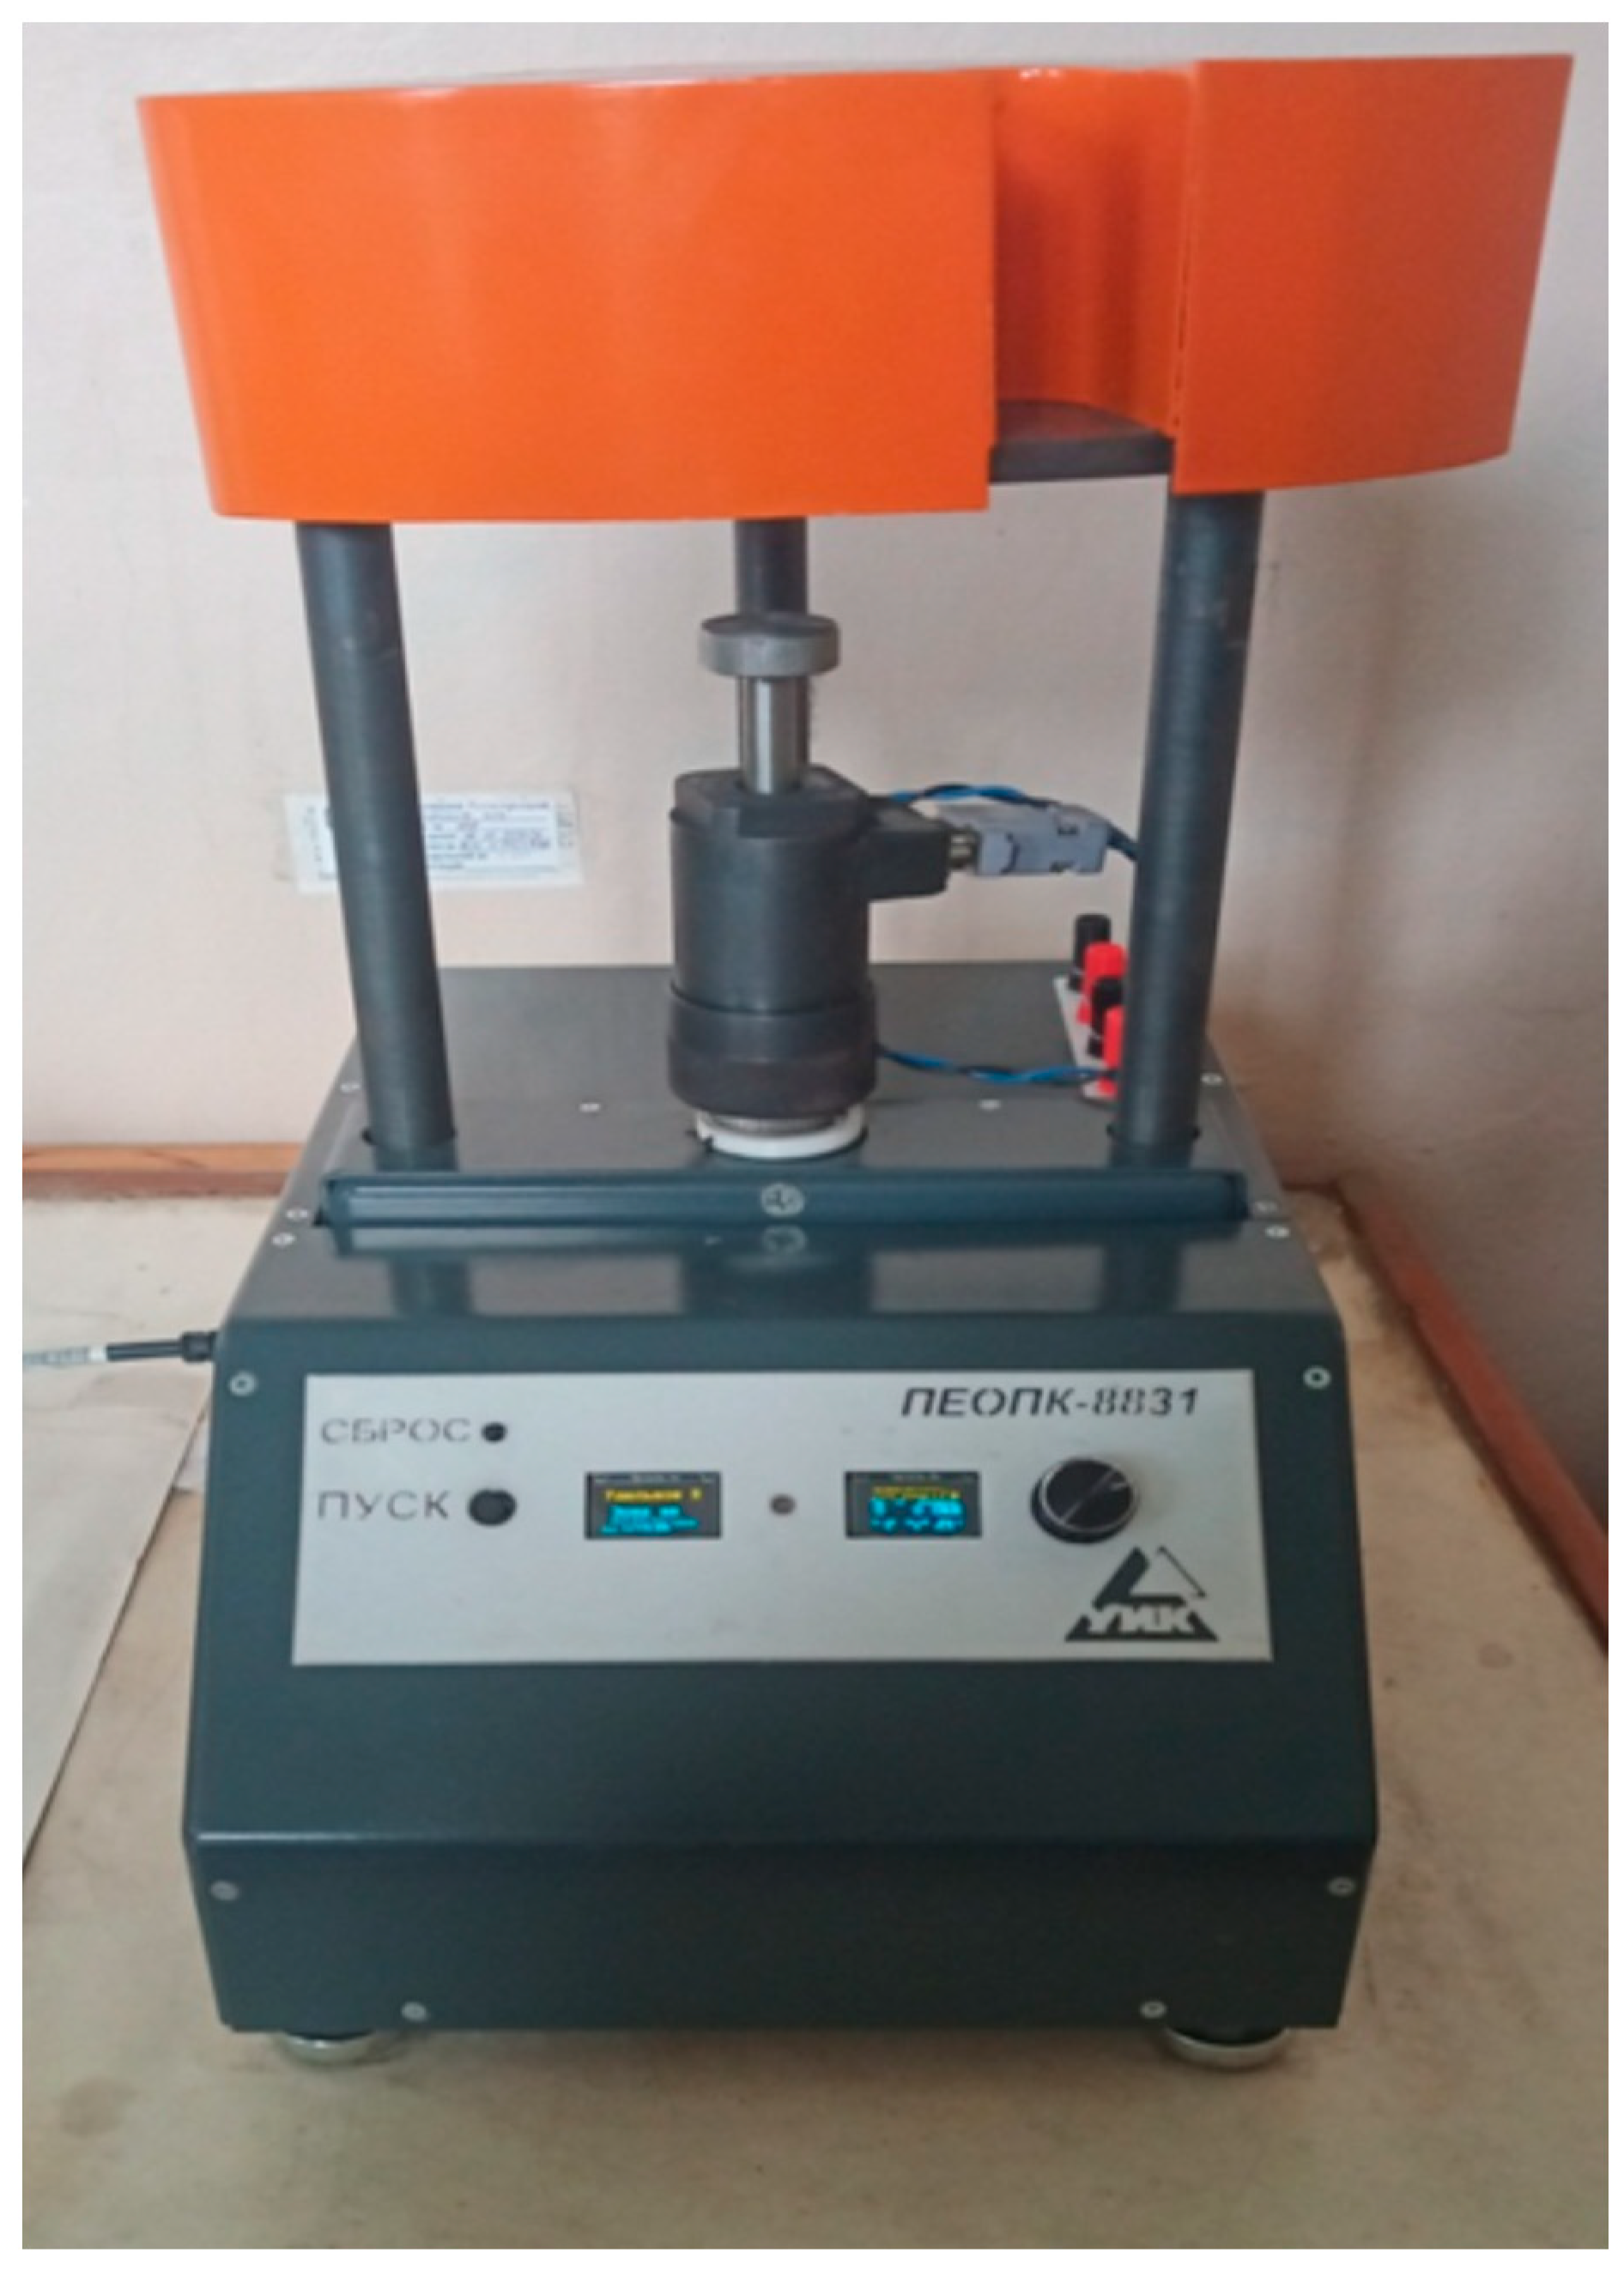
The installation is shown in Figure 3.

Figure 3.
Installation for determination of electrical resistivity.
The coke sample was ground to an analytical powder. Excessive crushing is unacceptable: the contents of the class <0.05 mm should not exceed 40%. The powder selected for measurement was dried in an oven at a temperature of (140 ± 5) °C to a constant mass. The lower current electrode was inserted into the measuring channel of the matrix, and a sample of the coke powder under study weighing (3.000 ± 0.007) g was carefully poured into the channel through a funnel. The upper current electrode was inserted into the measuring channel of the matrix. The measuring matrix was placed on a jacking platform between the bearing surfaces of the press and the Π-shaped bed. The cylindrical heel of the lower current electrode should be in the groove of the reference contact. After installing the die in the press, the jack screw was tightened, and several strokes of the jack were made until the upper current electrode rested against the bed. The handle of the hydraulic press was used to raise the rod to the stop <manometer> in the upper part of the press base. The exposure time of the sample under pressure is determined by the time during which the measurements show a value of electrical resistivity that practically does not change; for analytical coke powders, the defined exposure time is from l min to 2 min. The measurement results were recorded.
Measurement of the resistivity makes it possible to assess the degree of readiness (calcination) of coal coke and the peculiarities of its molecular structure. In general, a more calcined coke will have a lower resistivity if other parameters, such as the particle size, are the same. The method is based on measuring the voltage drop when a direct current passes through a compressed column of coke with a particle size of less than 0.2 mm. The resistivity (ρ, Ω·cm) is calculated by the formula:
where S is the cross-sectional area of the sample, cm2; L is the distance between the probes, cm; U is the voltage drop, V; I is the current, A.
The measurement result is the arithmetic mean of the results of parallel measurements.
This study on coking was carried out under the conditions of coke production at the Dnipro Metallurgical Plant. The existing furnace stock of the enterprise was created during the technical re-equipment in the 1980s. Coke oven batteries Nos. 4 and 5 were put into operation in 1985, and batteries Nos. 1 and 2—in 1988. At present, coke oven battery No. 2 is shut down for hot preservation (the temperature in the control verticals is maintained at 1000 °C). There are three coke oven batteries in operation—Nos. 1, 4, and 5. The technical characteristics of the coke ovens are shown in Table 3.
The following Table 4 illustrates the parameters of the coking process under the conditions of coke production at the Dnipro Metallurgical Plant (period and temperatures in the control verticals).
3. Results
The thermomechanical properties were determined according to the standard method ISO 18894:2006 “Coke. Determination of coke reactivity index (CRI) and coke strength after reaction (CSR)” [16].
These coke quality indicators are presented in Table 5.
Table 5.
Coke characteristics.
The relationship between the quality indicators of coal raw materials (Table 1, Table 2, Table 3 and Table 4) and the coke electrical resistivity was characterized by even correlation coefficients. These are presented in Table 6.
Table 6.
Correlation coefficients.
Based on the analysis of the main technological properties of coal batches and coke characteristics, we built the following dependencies (Figure 4, Figure 5, Figure 6, Figure 7, Figure 8 and Figure 9):

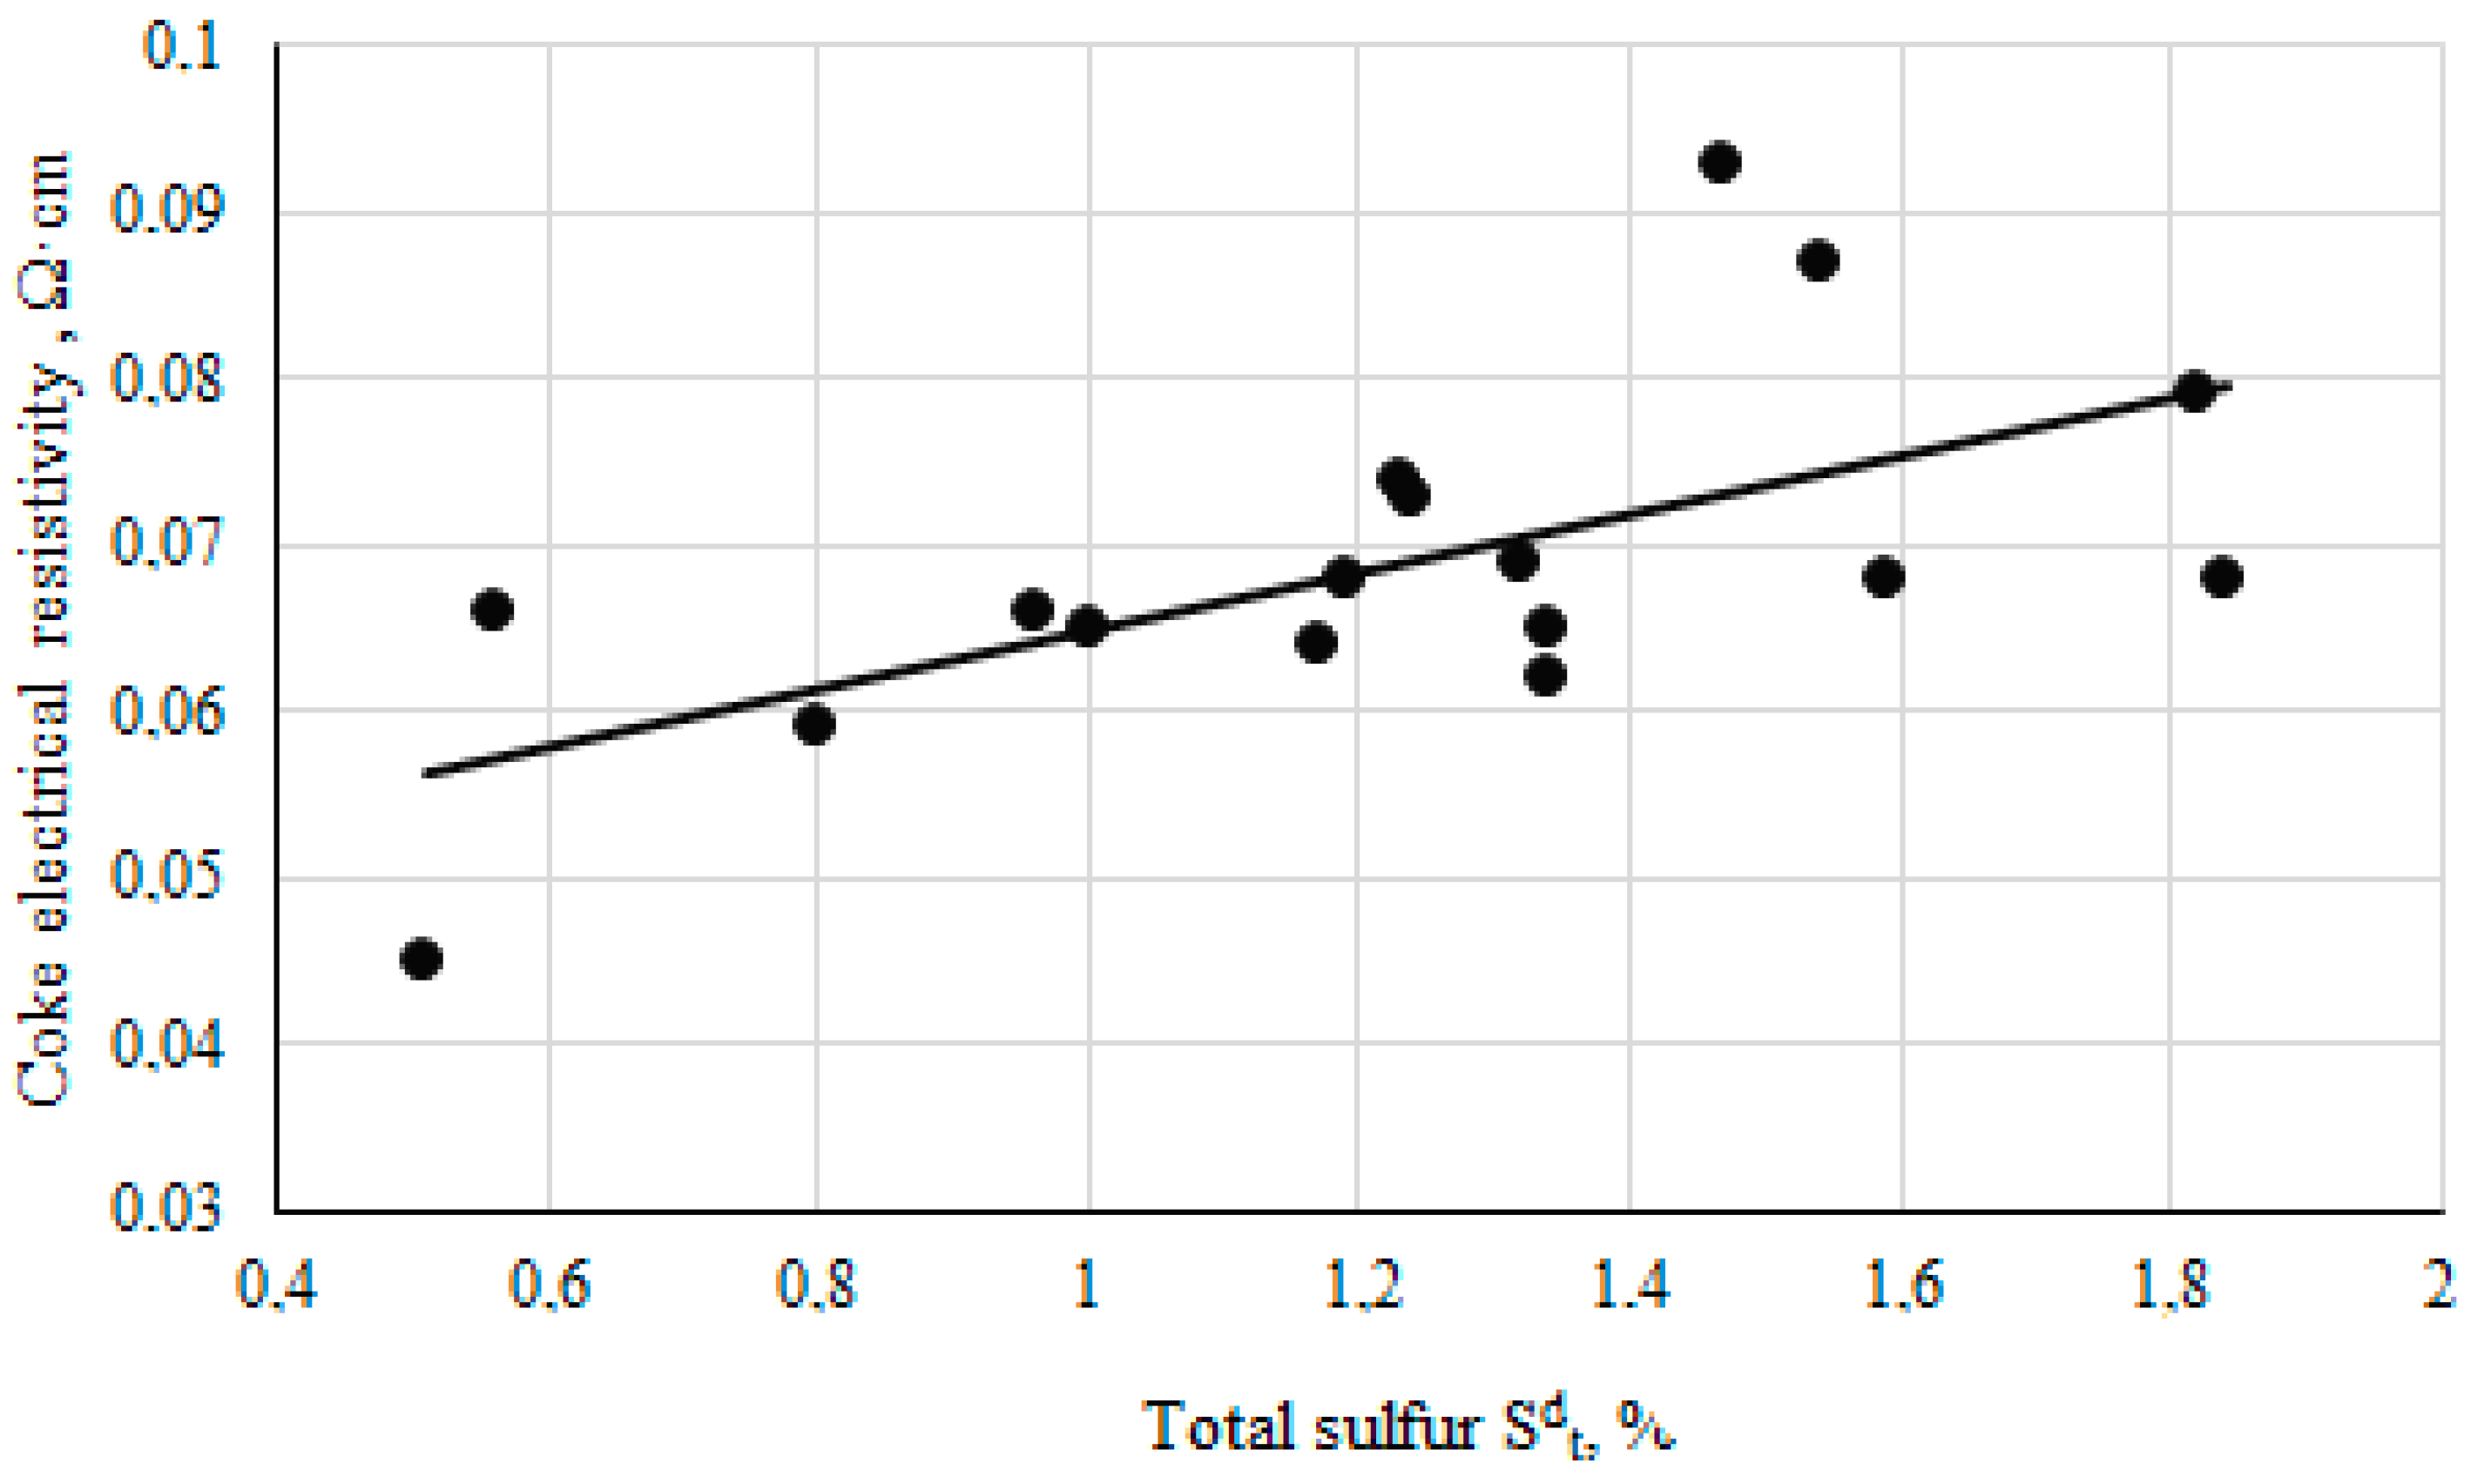
Figure 4.
Dependence of coke electrical resistivity on the total sulfur (Sdt) of the batches.
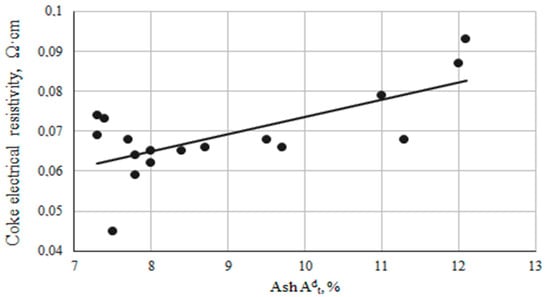
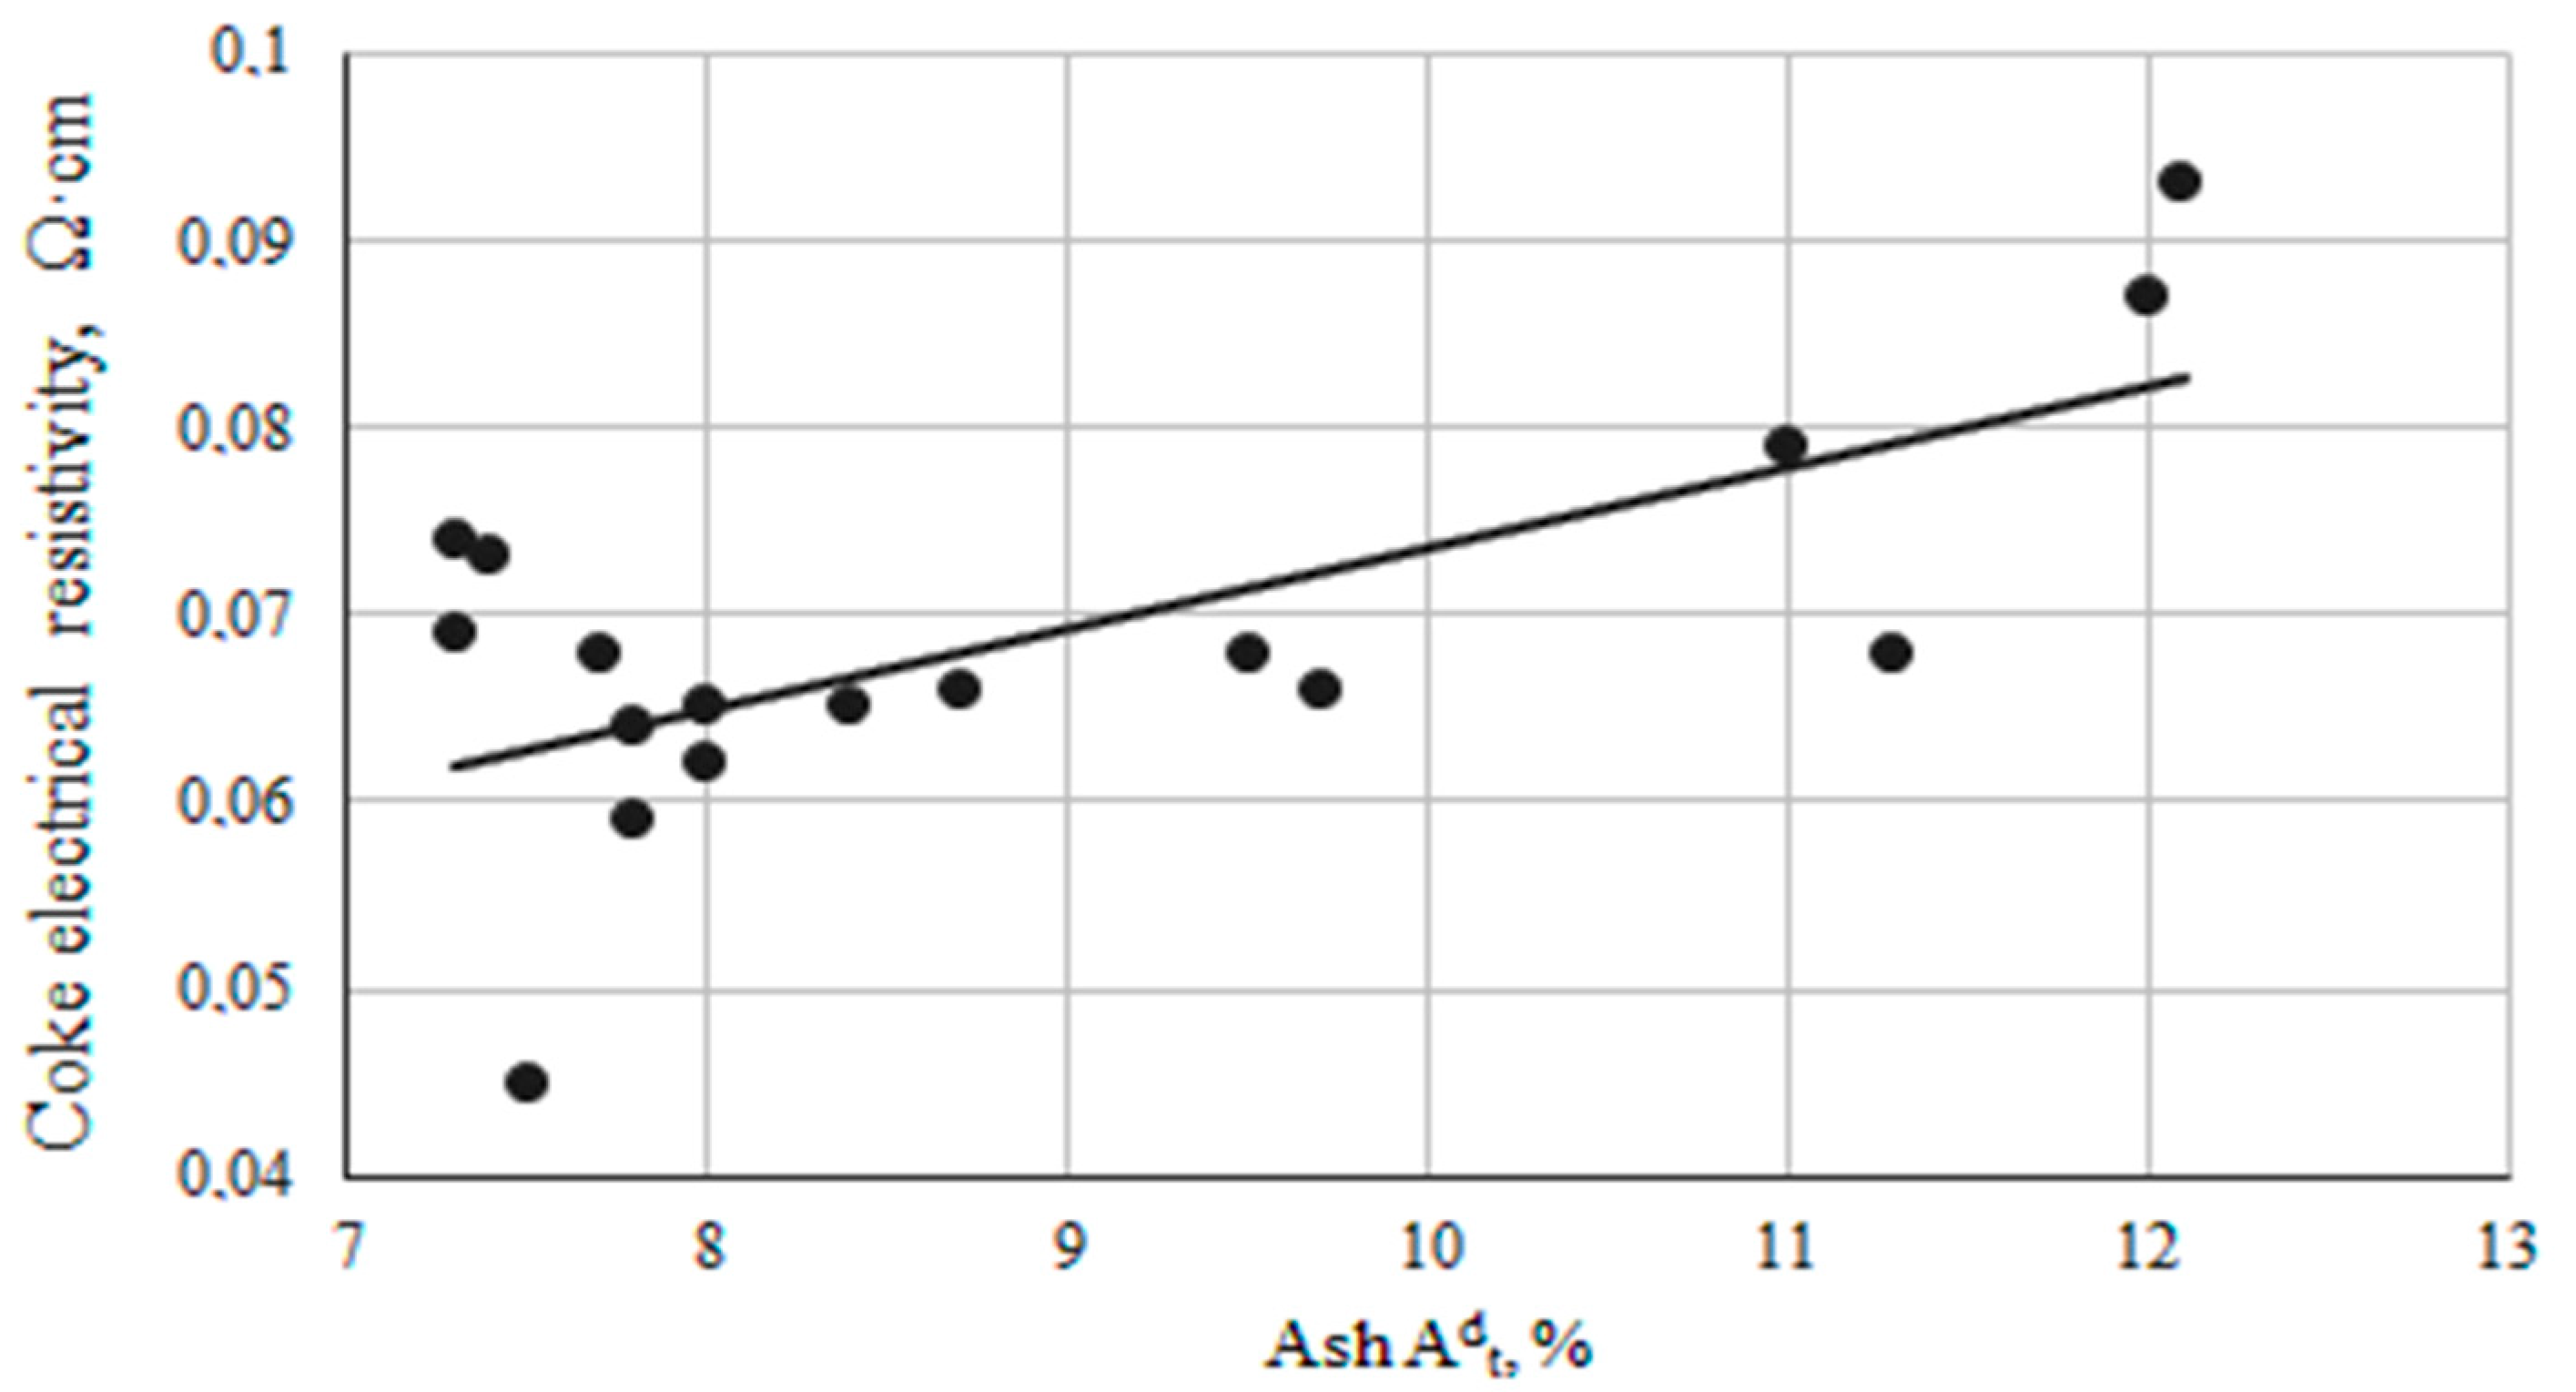
Figure 5.
Dependence of coke electrical resistivity on the ash (Adt) of the batches.
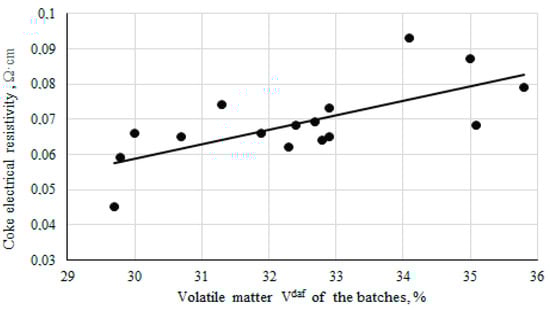
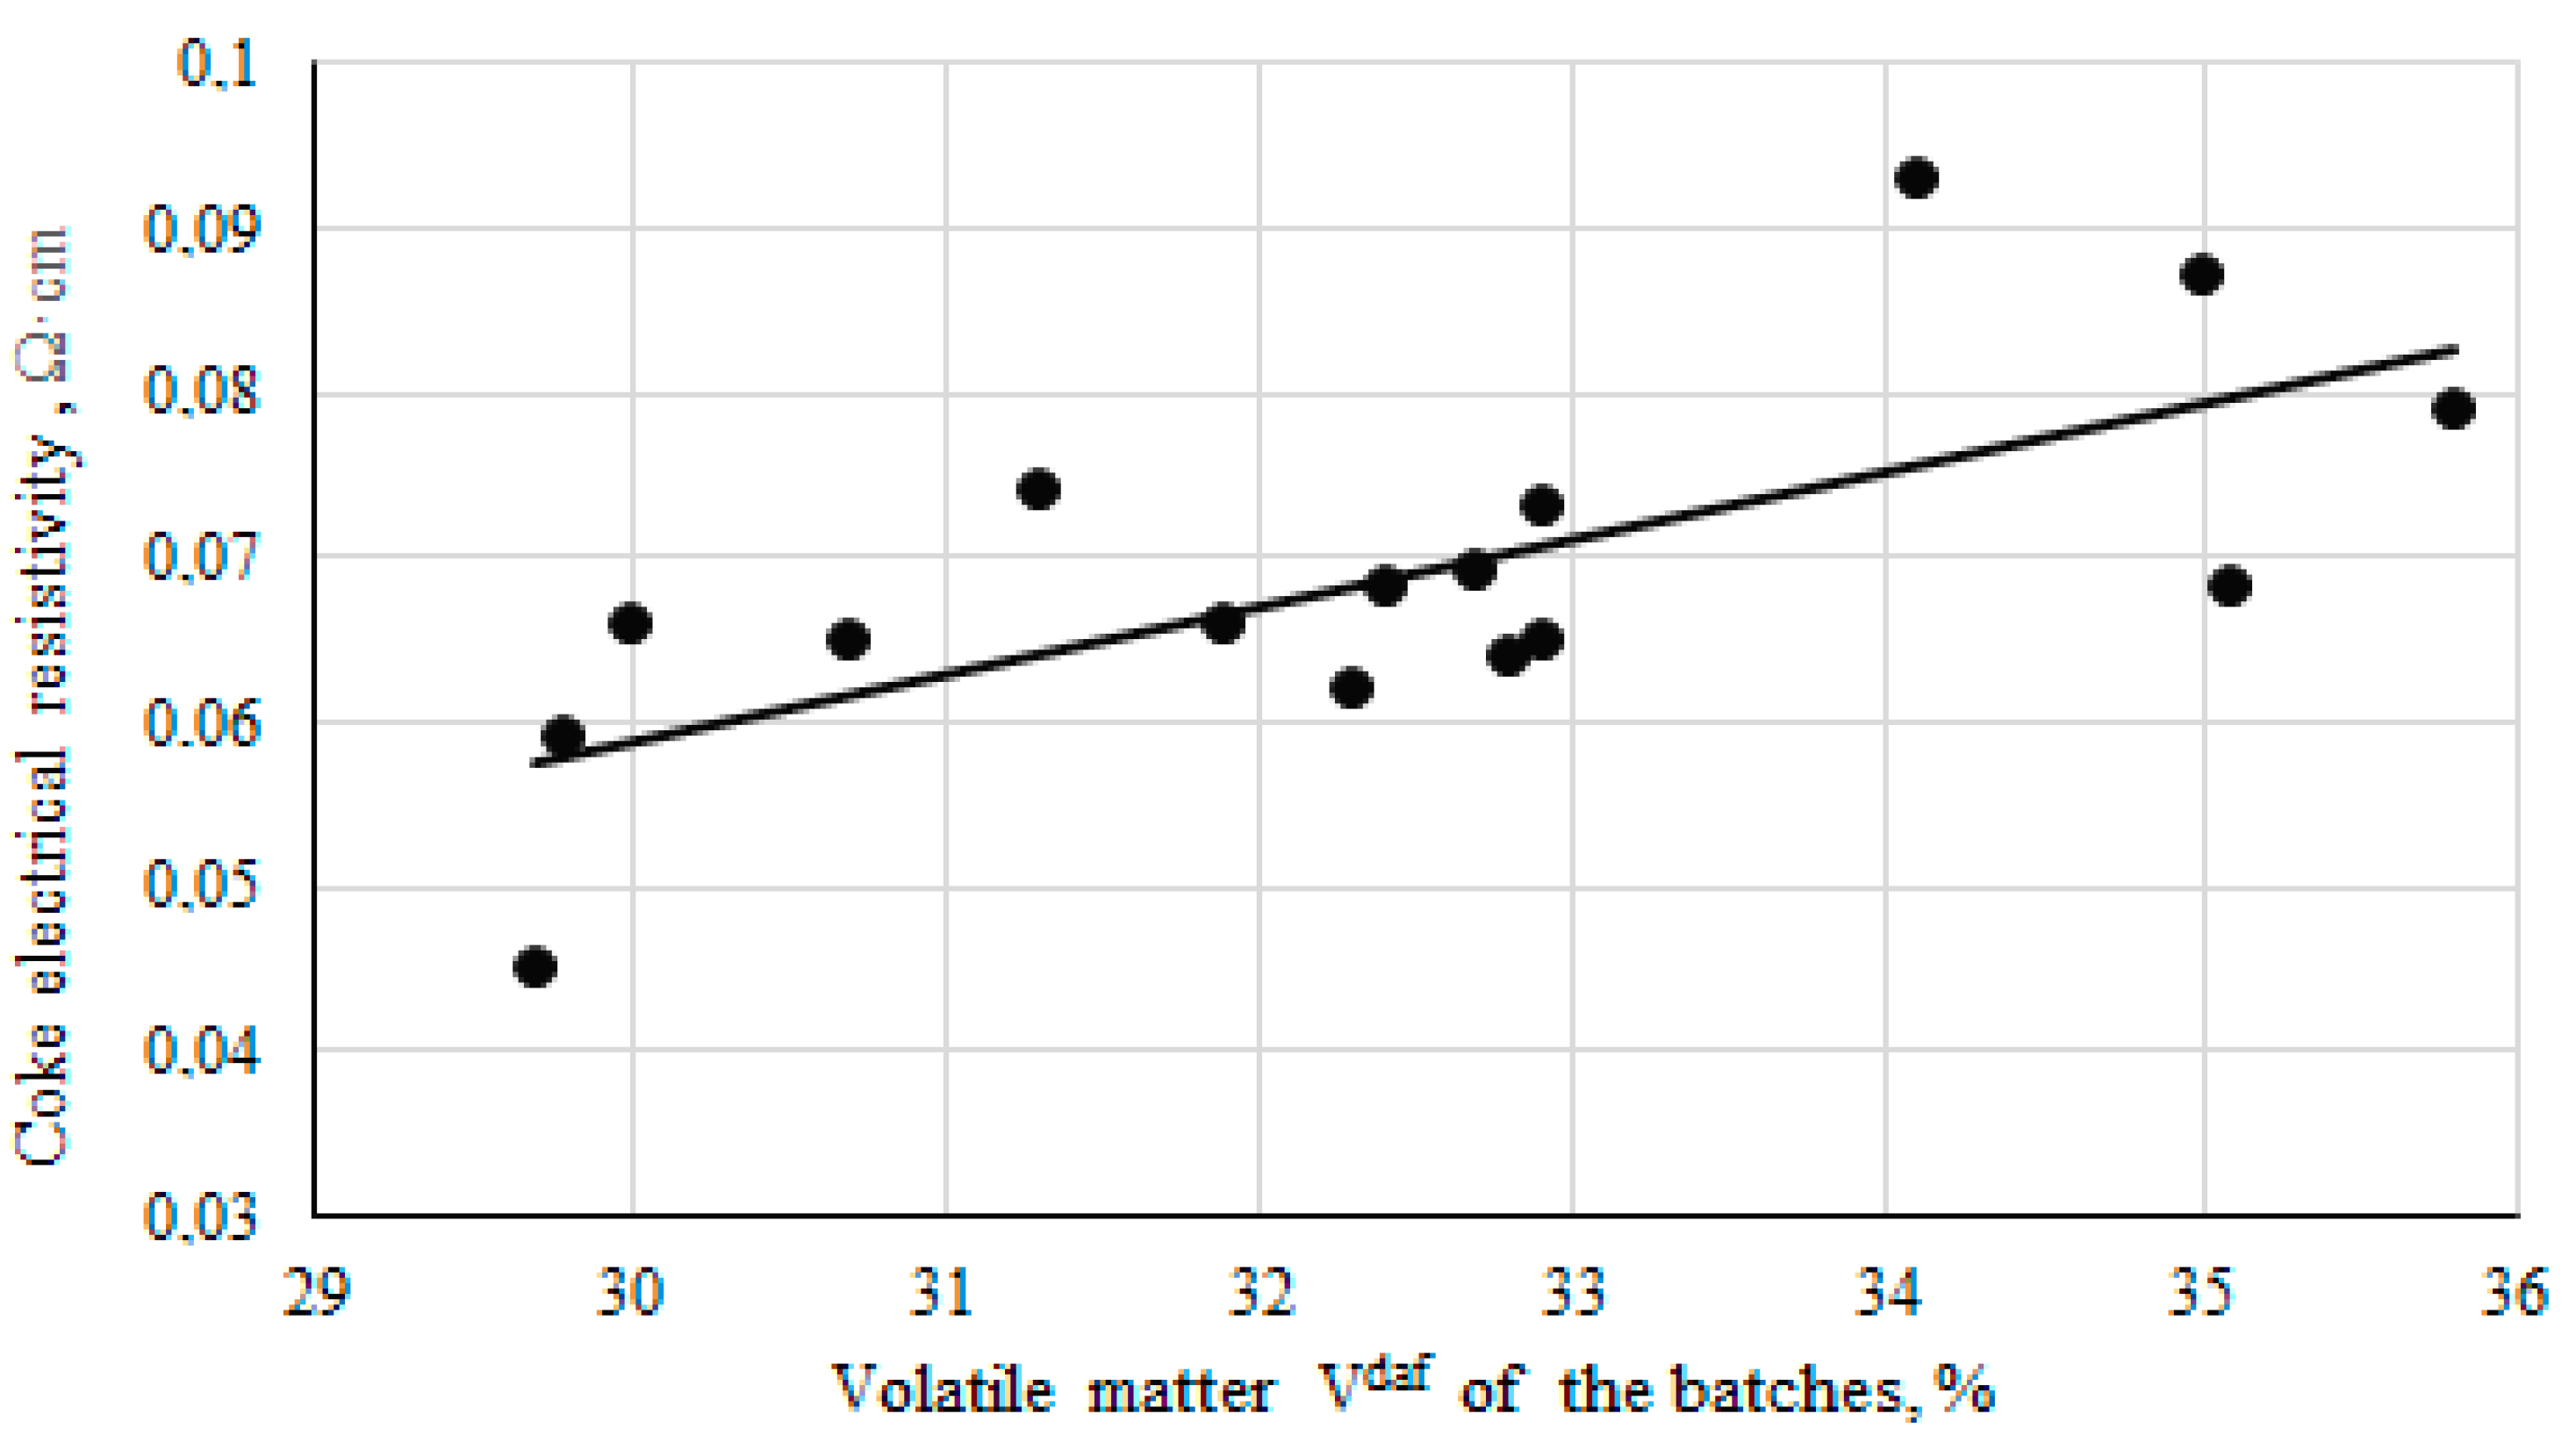
Figure 6.
Dependence of coke electrical resistivity on the volatile matter (Vdaf) of the batches.
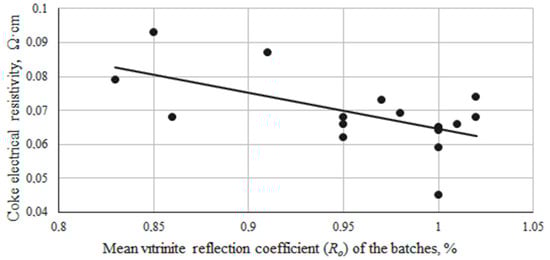
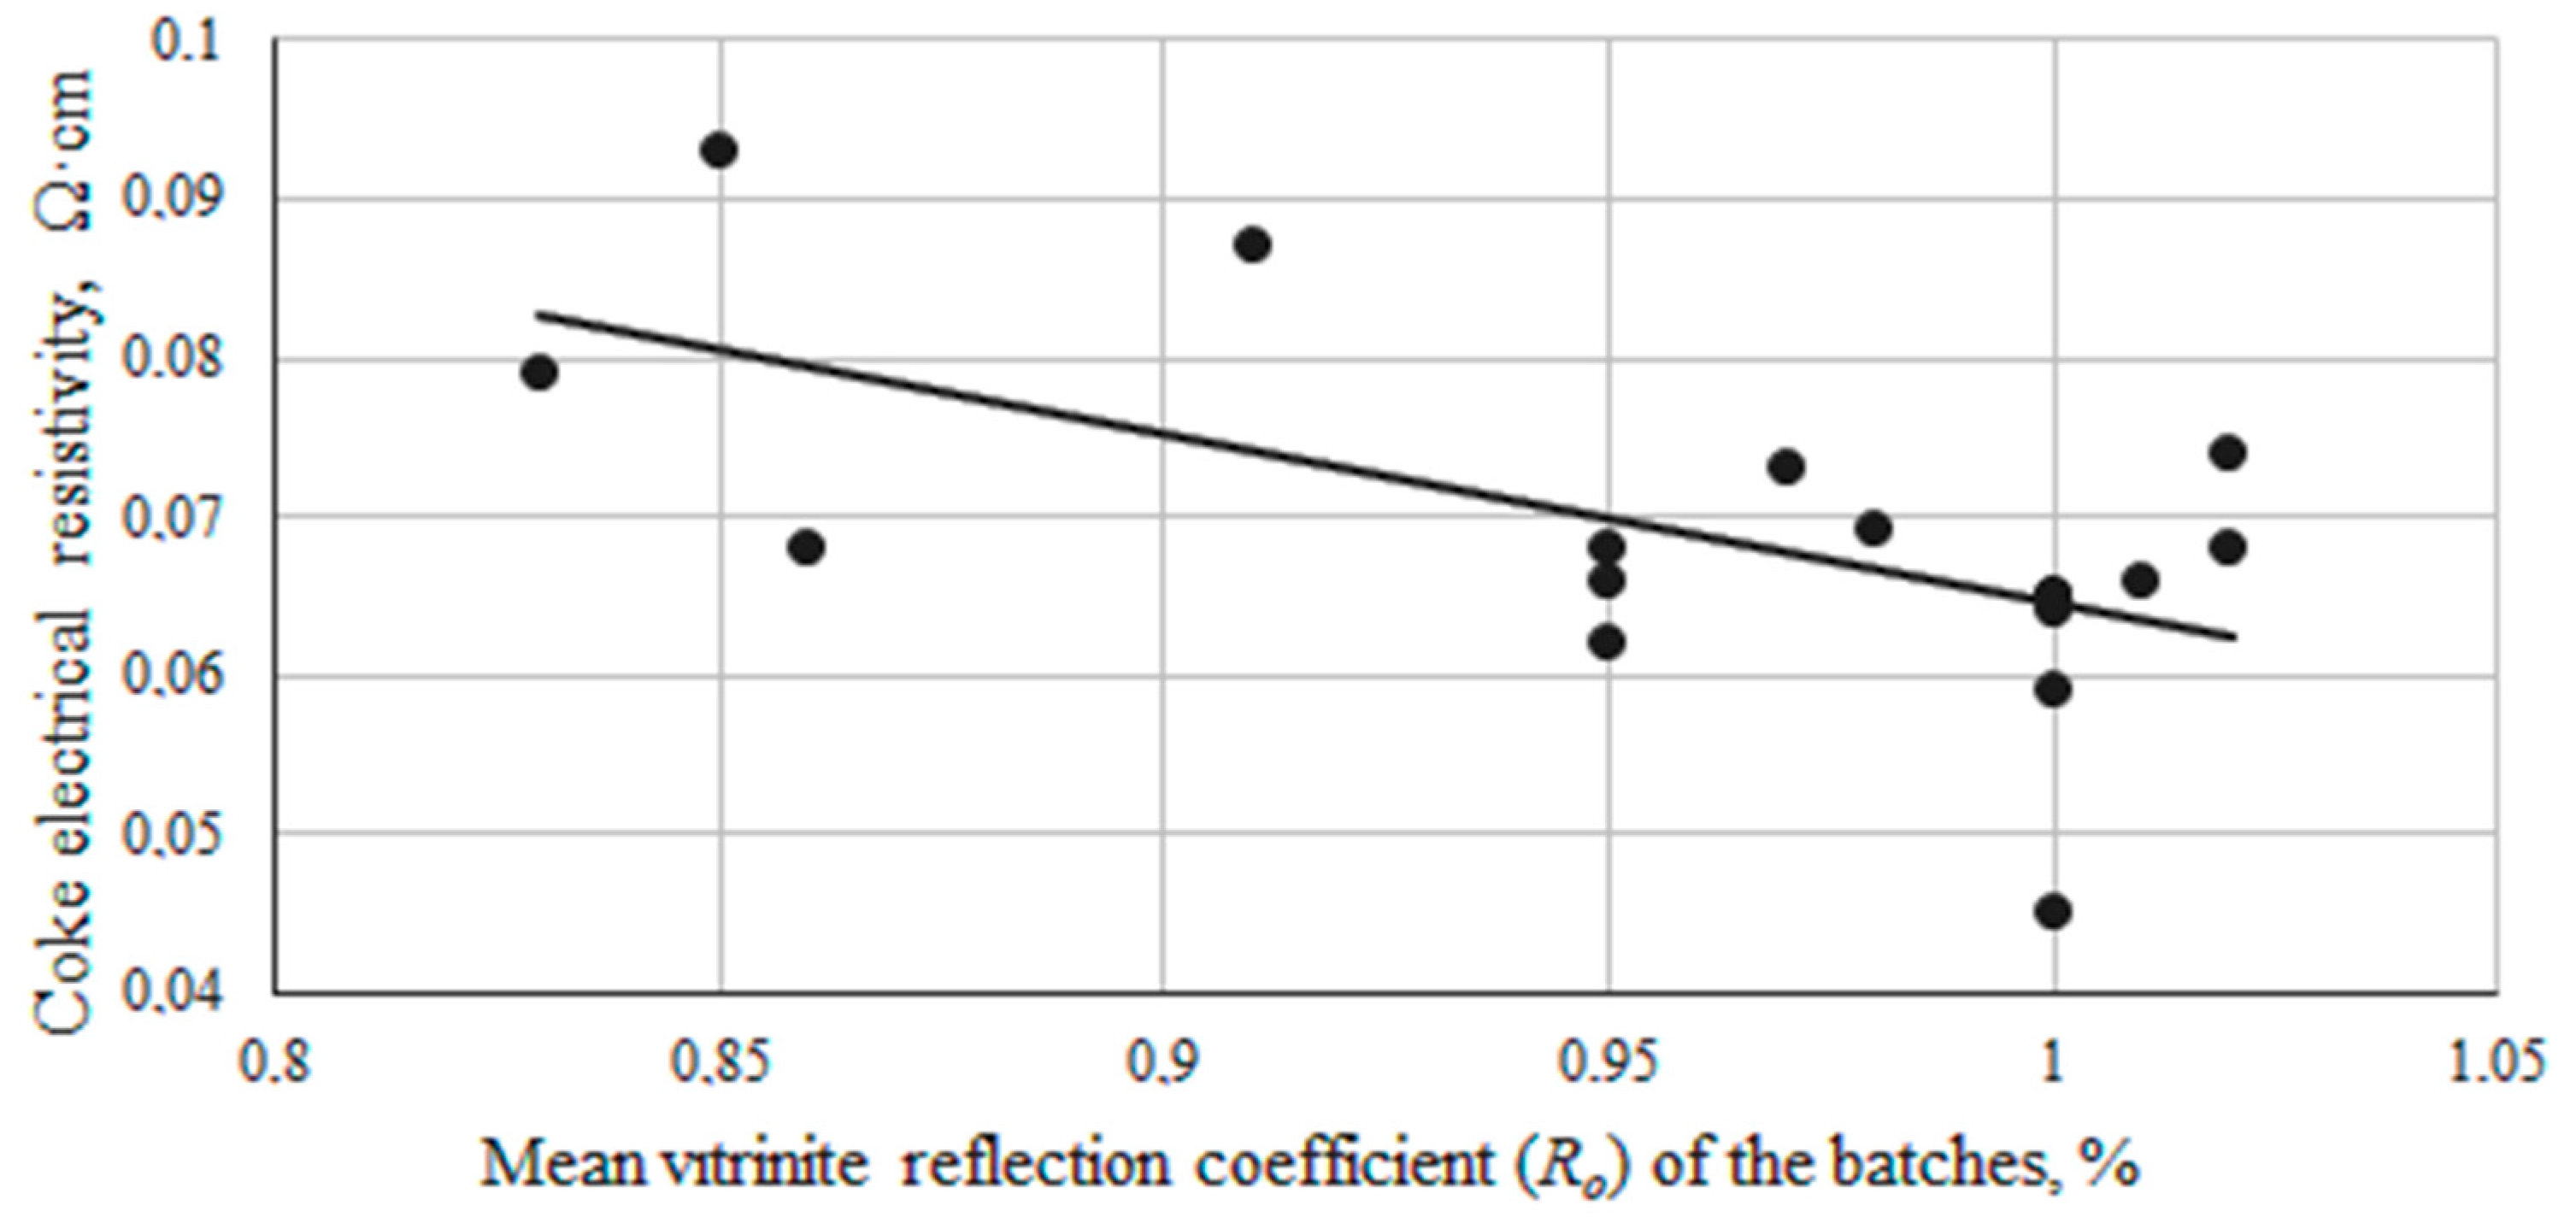
Figure 7.
Dependence of coke electrical resistivity on the mean vitrinite reflection coefficient (Ro) of the batches.
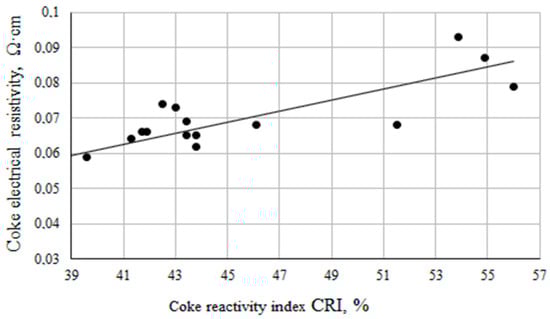
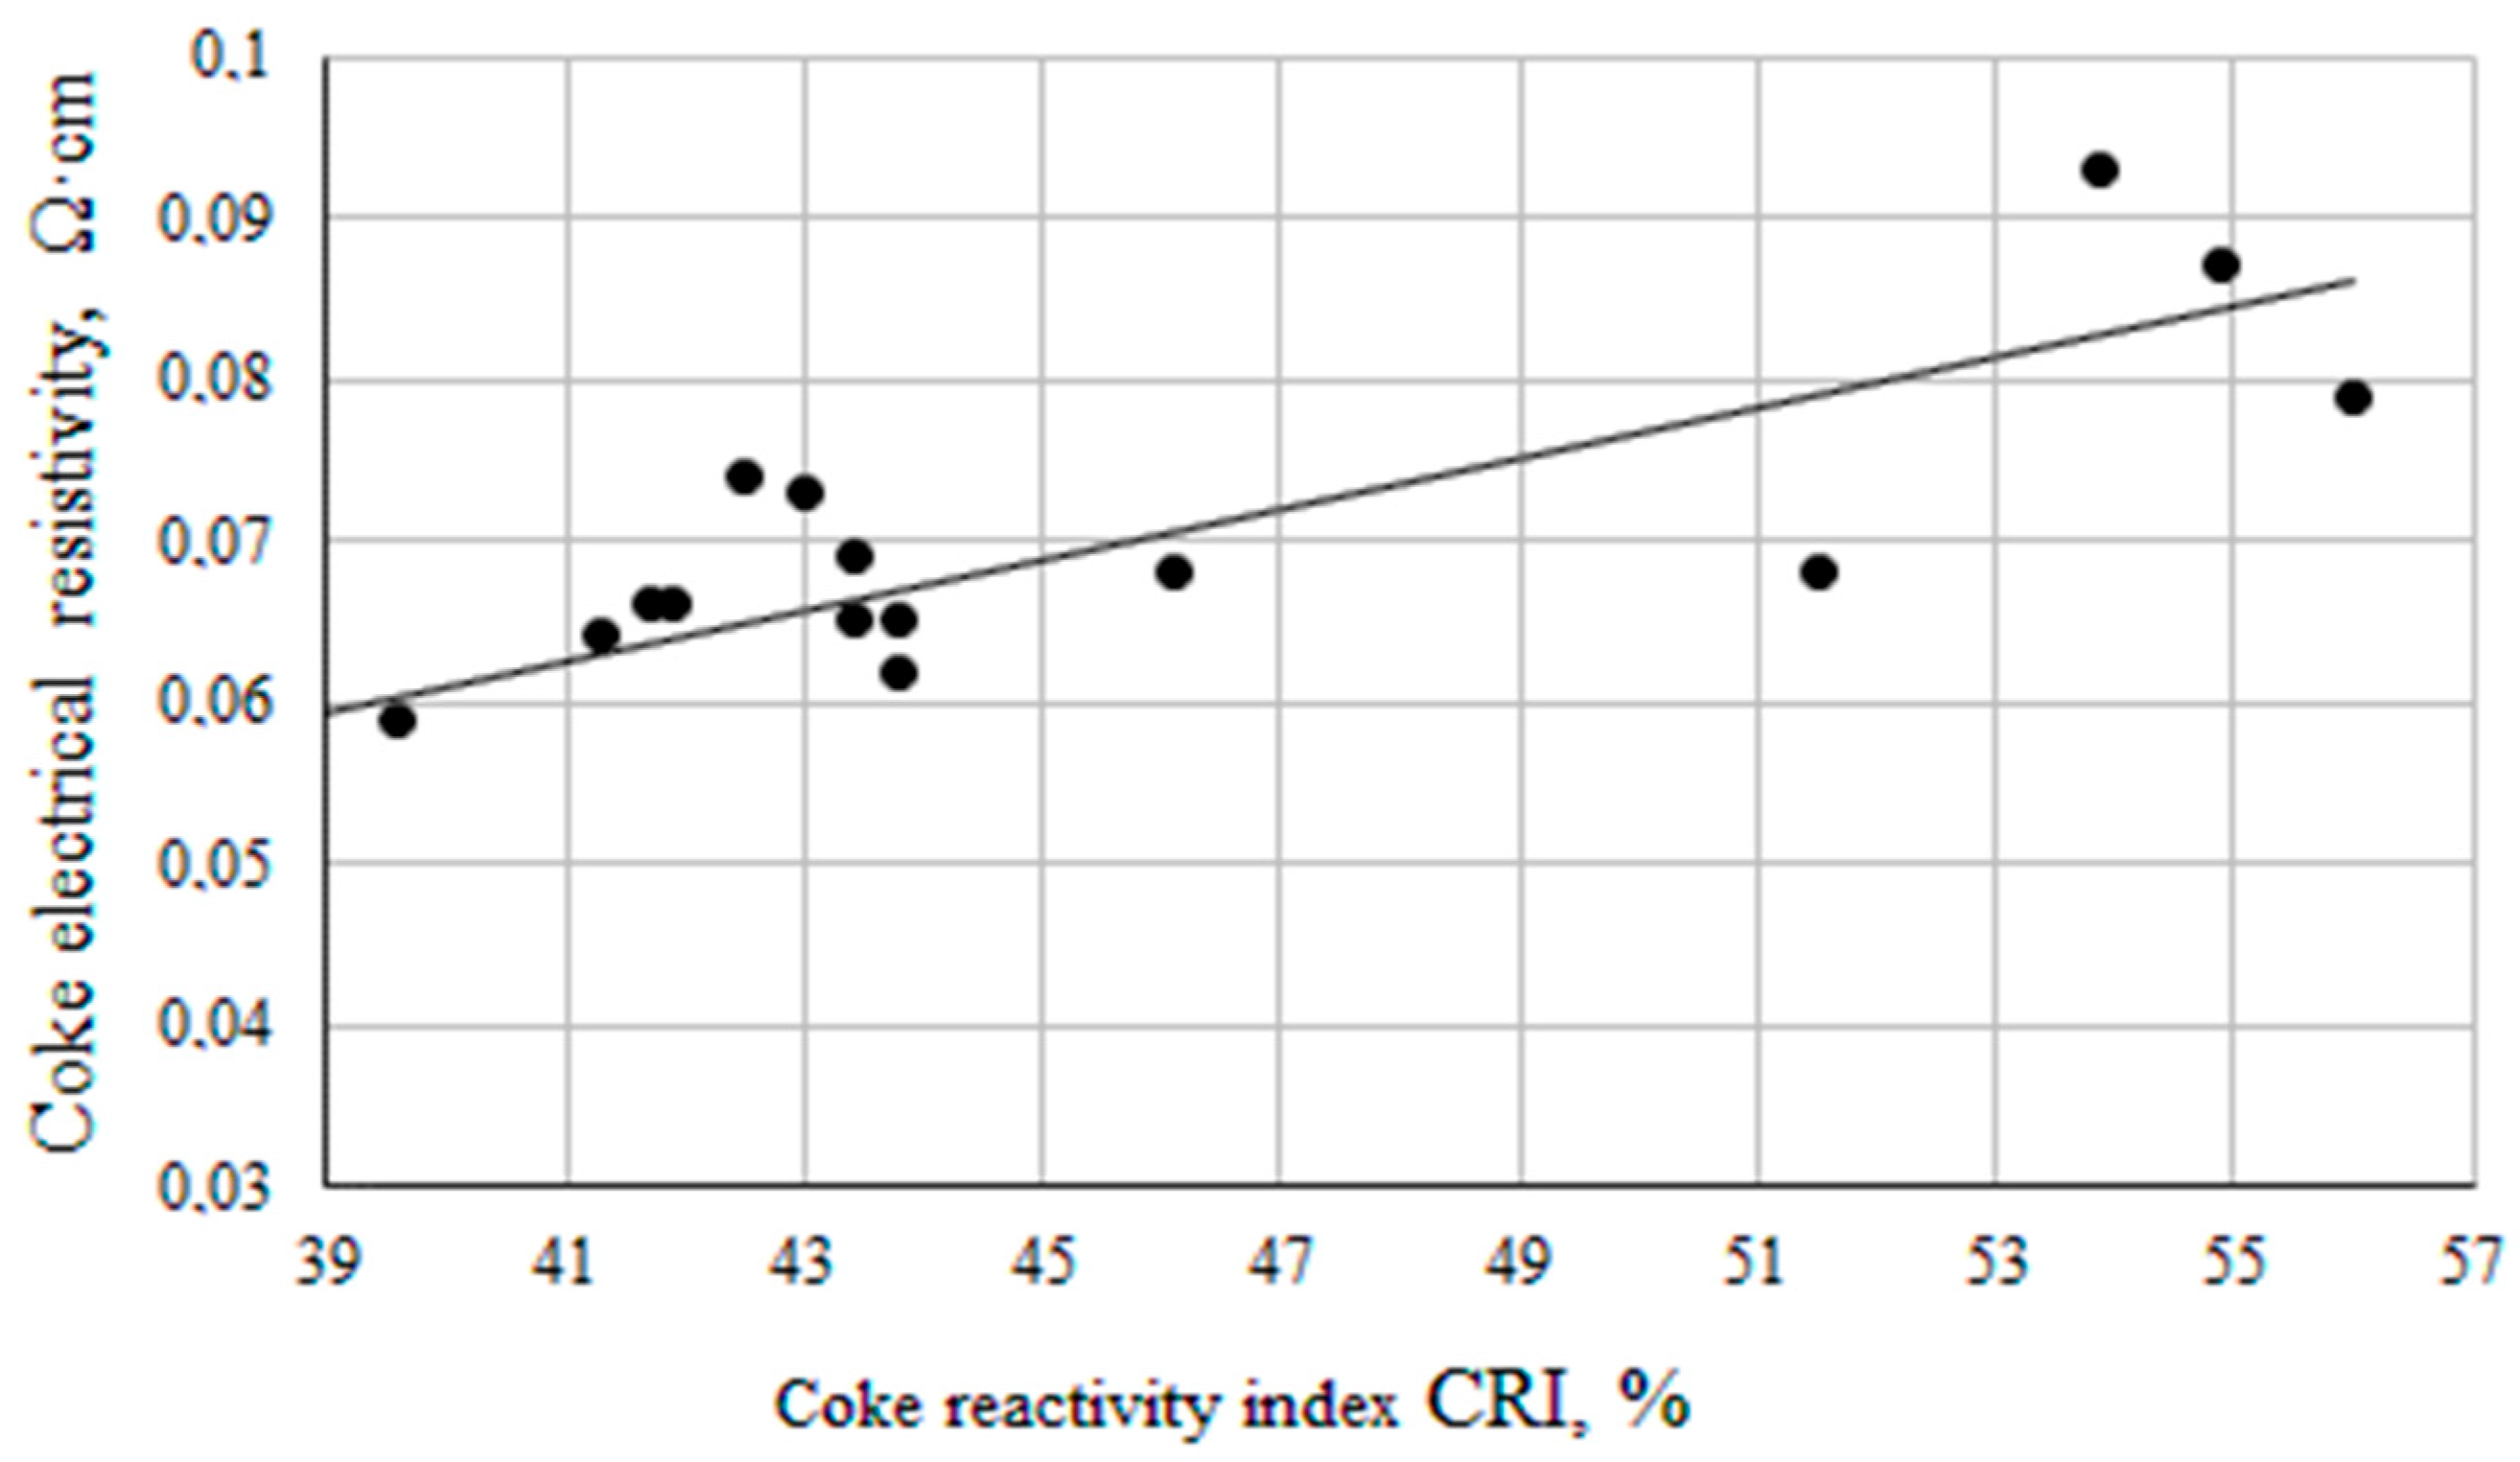
Figure 8.
Relationship between the coke electrical resistivity and the coke reactivity index.
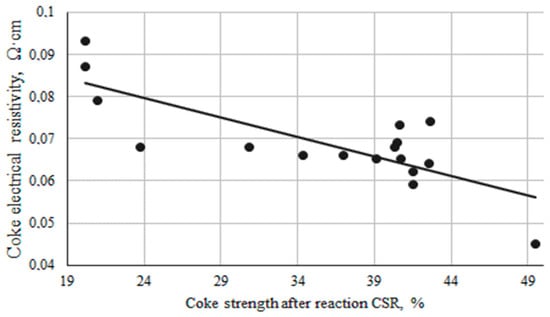
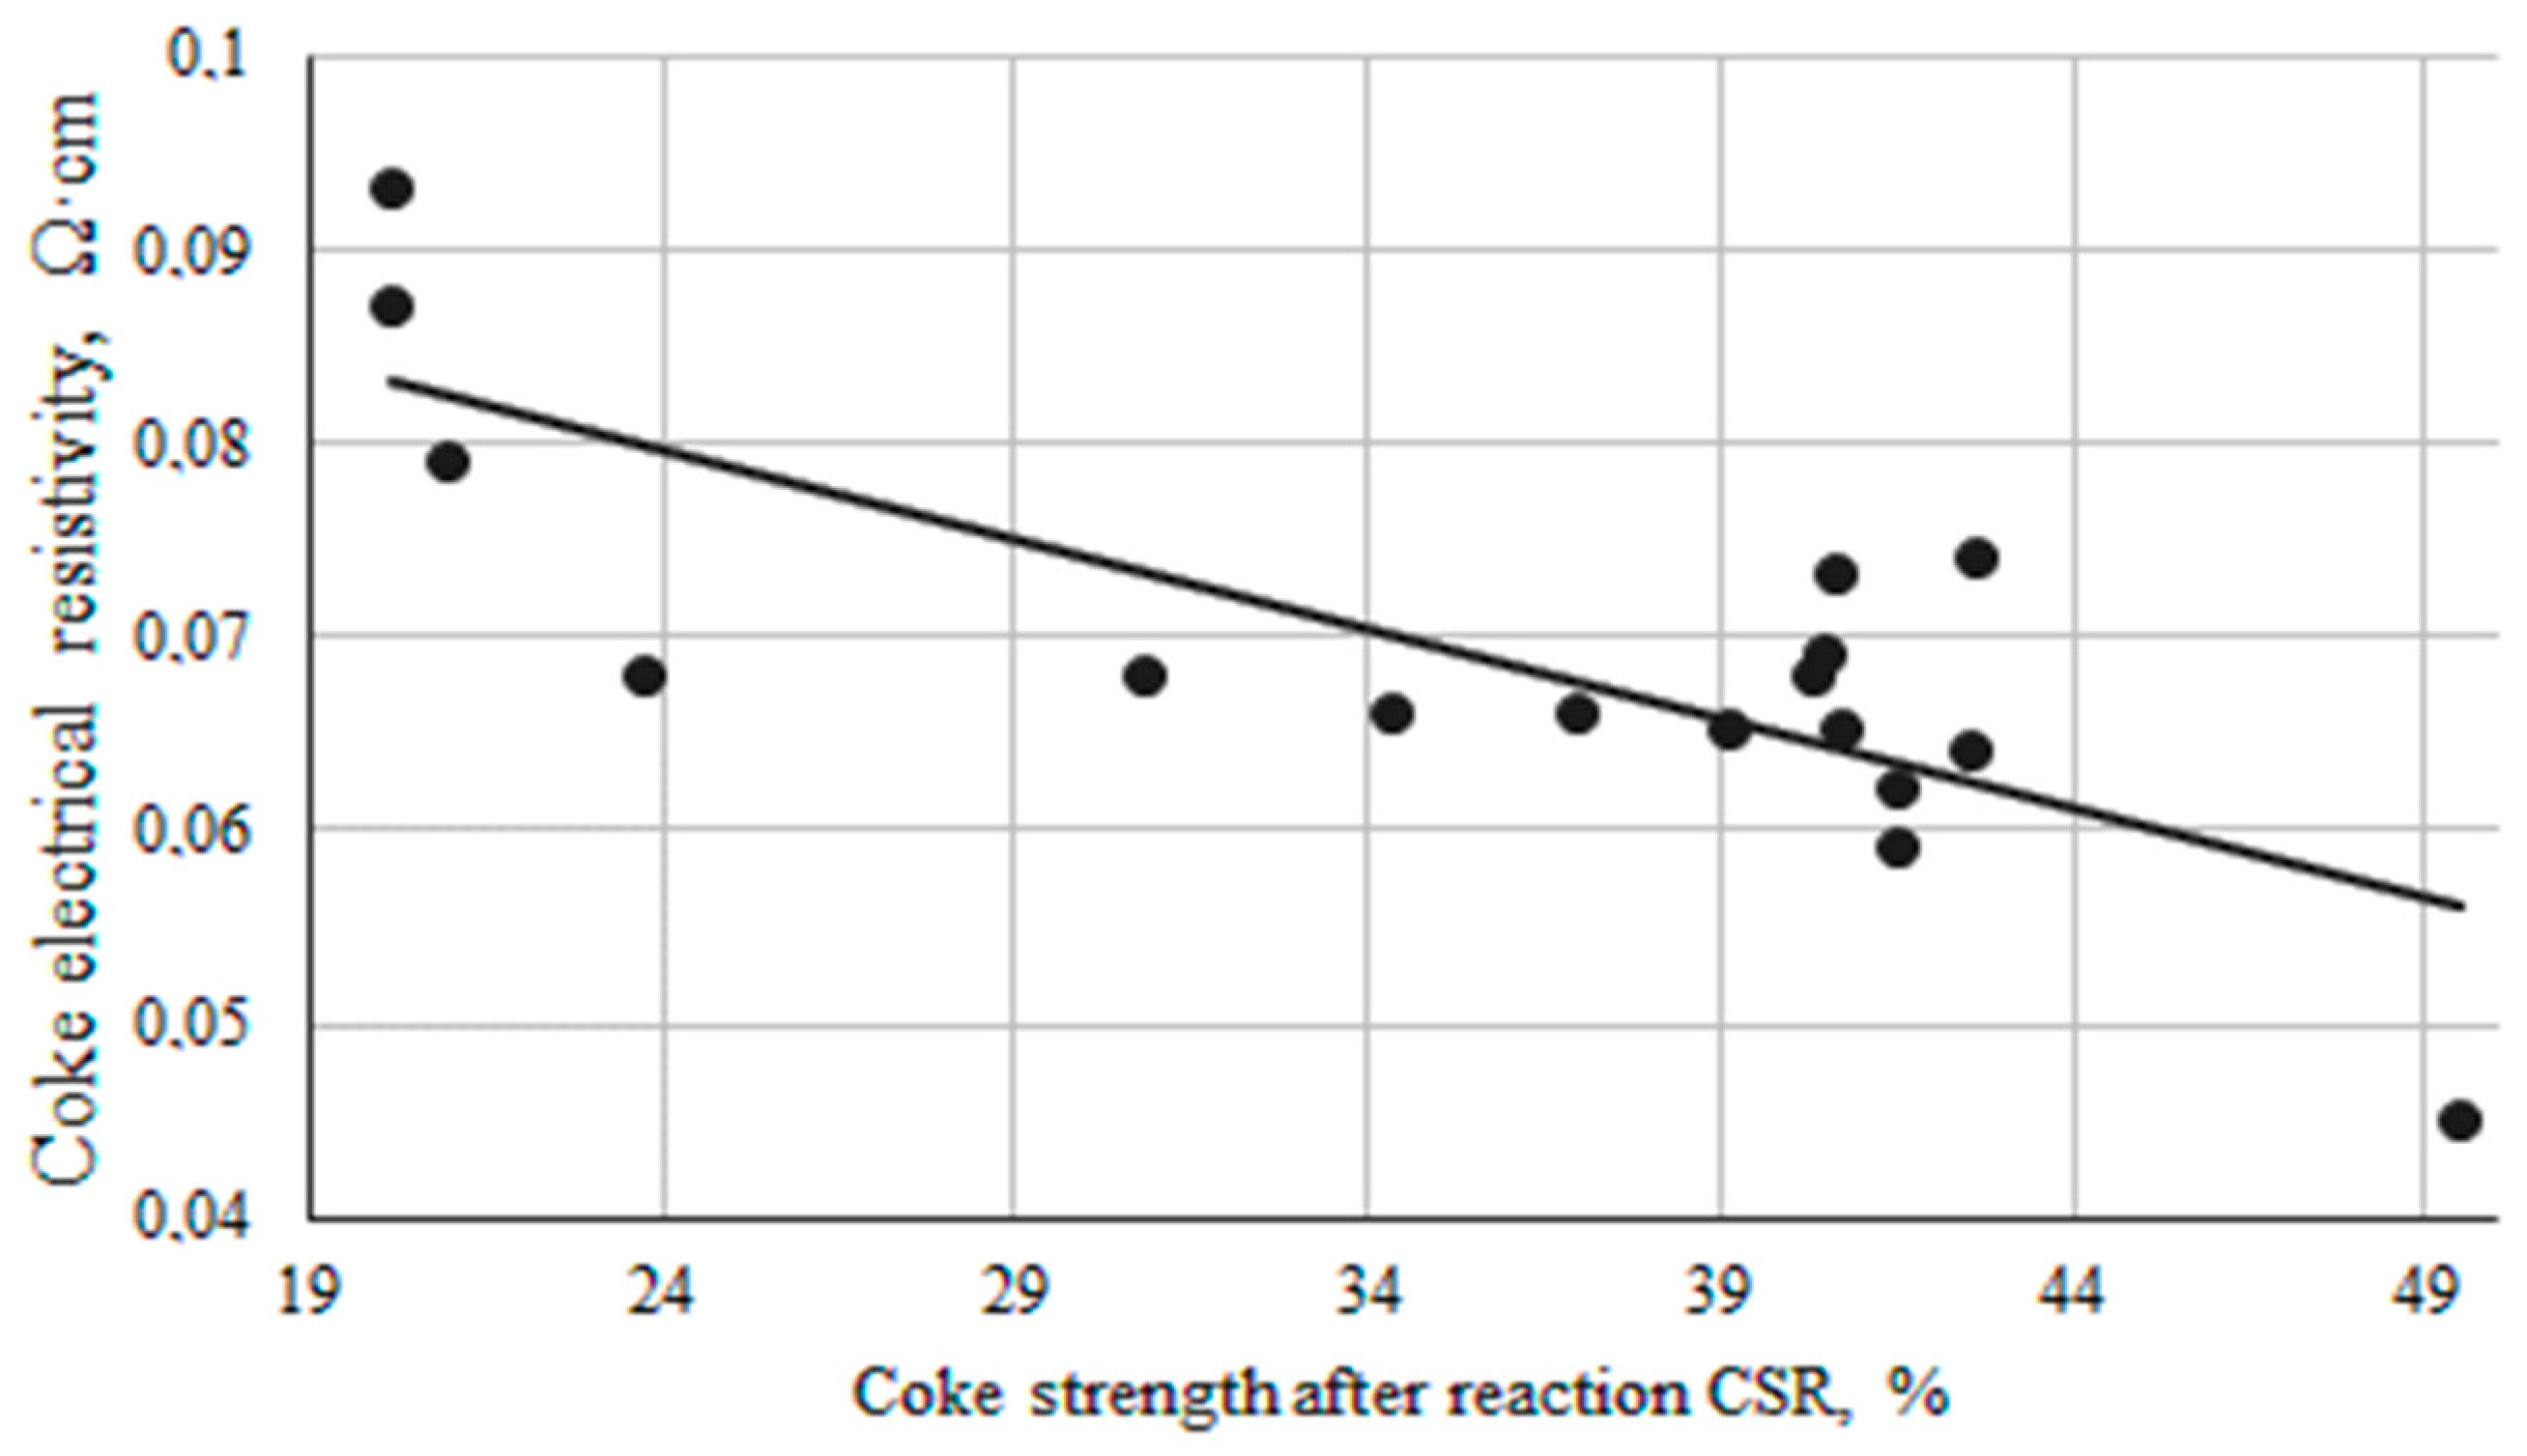
Figure 9.
Relationship between the coke electrical resistivity and the coke strength after reaction.
It was established that an increase of 1% in the contents of total sulfur (), volatile matter (, and ash of the coal raw materials led to logical increases in the resistivity of coke of 0.0176 Ω·cm, 0.0041 Ω·cm, and 0.0043 Ω·cm, respectively.
An increase in the degree of metamorphism, according to the mean vitrinite reflection coefficient, led to an increase in the resistivity of 0.0013 Ω·cm for each percent .
An increase in the degree of coke readiness and an increase in the degree of orderliness of its structure led to a decrease in the coke resistivity. Thus, an increase in the coke strength after reaction (CSR) of 1% will lead to a decrease in the resistivity of 0.0019 Ω·cm. And a 1% decrease in the coke reactivity index will lead to an increase in the resistance of 0.0016 Ω·cm.
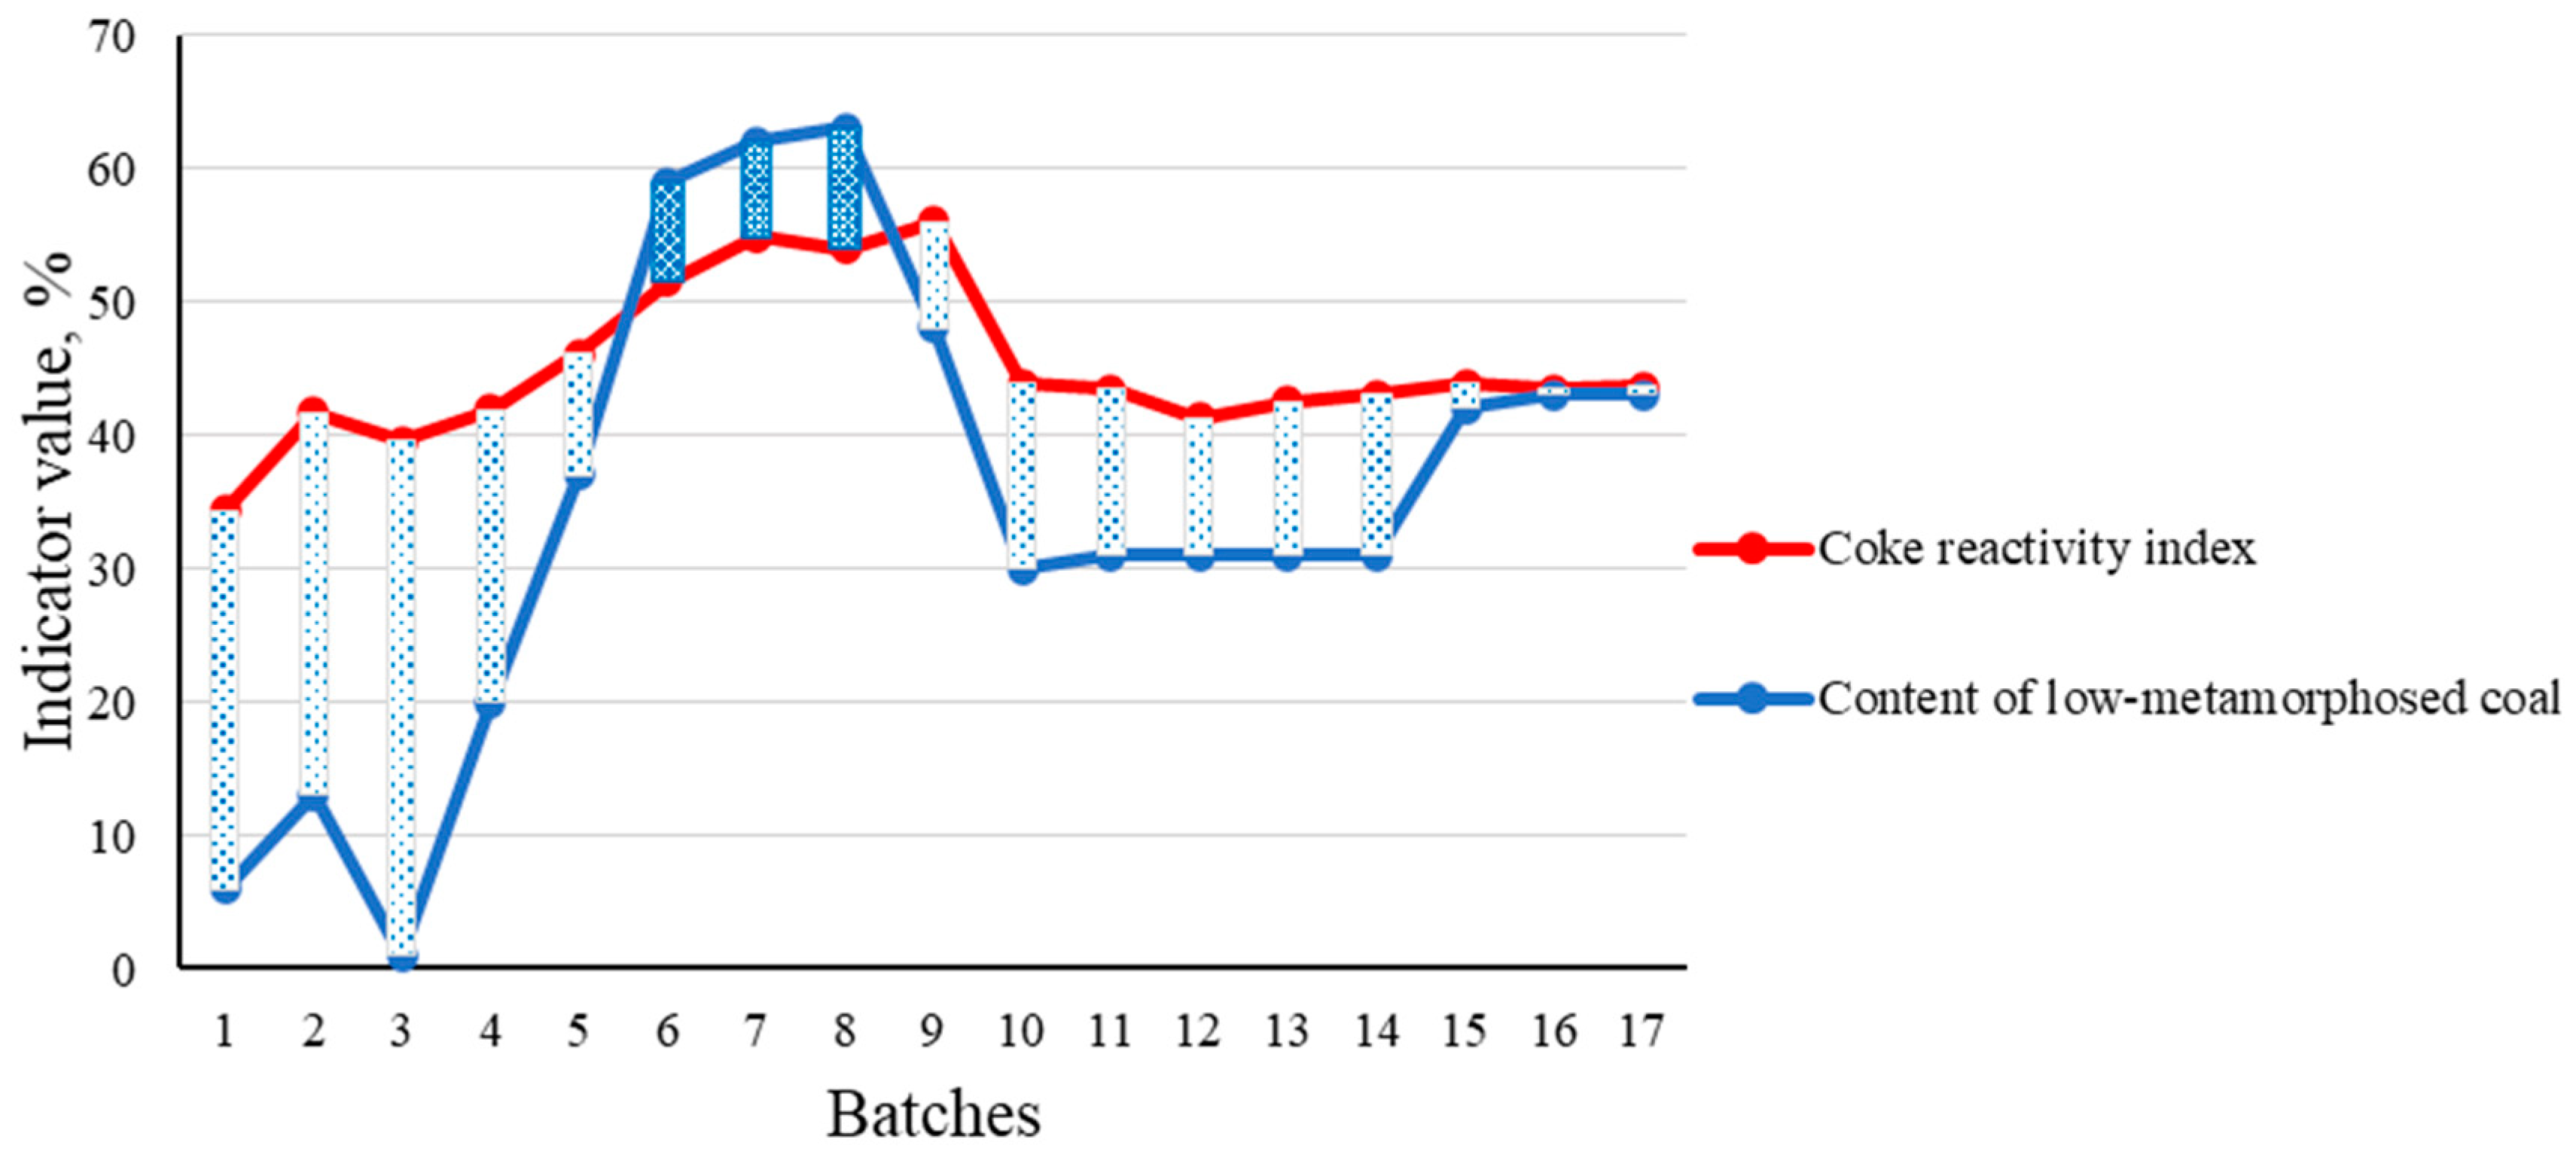
Analyzing the data of the experimental blends, it can be noted that the component composition, namely the amount of gas group coal, differed significantly. Thus, for samples 6–9, the maximum contents of G1, G2, and GZhP coals can be observed, which ranged from 42 to 63%. Simultaneously, with the increase in the content of gas coal, the coke reactivity index obtained from these batches increased, which can be observed in the graphs shown in Figure 9. For the samples with the highest content of low-metamorphosed coal (6–9), the highest values of electrical resistivity were observed.
The best indicators of the thermochemical properties of coke in terms of the strength after reaction with CO2 (CSR) and the coke reactivity index (CRI) were obtained when coking three samples of the experimental batch. In this case, there was an optimal content (66%) of coal grades (GZh + Zh + K), characterized by optimal clinkering and coking properties. When coking variants 6–9 of the experimental blends, the worst coke quality parameters were obtained (CSR 20.2–23.8%, CRI 53.9–56%). This was due to the deterioration of the grade composition of the coal batch due to a decrease in the proportion of bituminous coal and an increase in the low-metamorphosed coal (42–63%). As a result, a decrease in the vitrinite reflection index and a shift in the plasticity interval toward lower temperatures occurred, which caused a weakening of the coke structure and an increase in its specific electrical resistivity.
Thus, it has been established that an increase in the content of gas group coal is the predominant factor influencing the properties of coke; therefore, it increases the reactivity of coke and naturally increases the resistivity of the resulting coke. Based on the above, it can be concluded that the structure of blast furnace coke is significantly influenced by the grade composition of the coal batch and the clinkering of its components, which can be further evaluated using the resistivity.
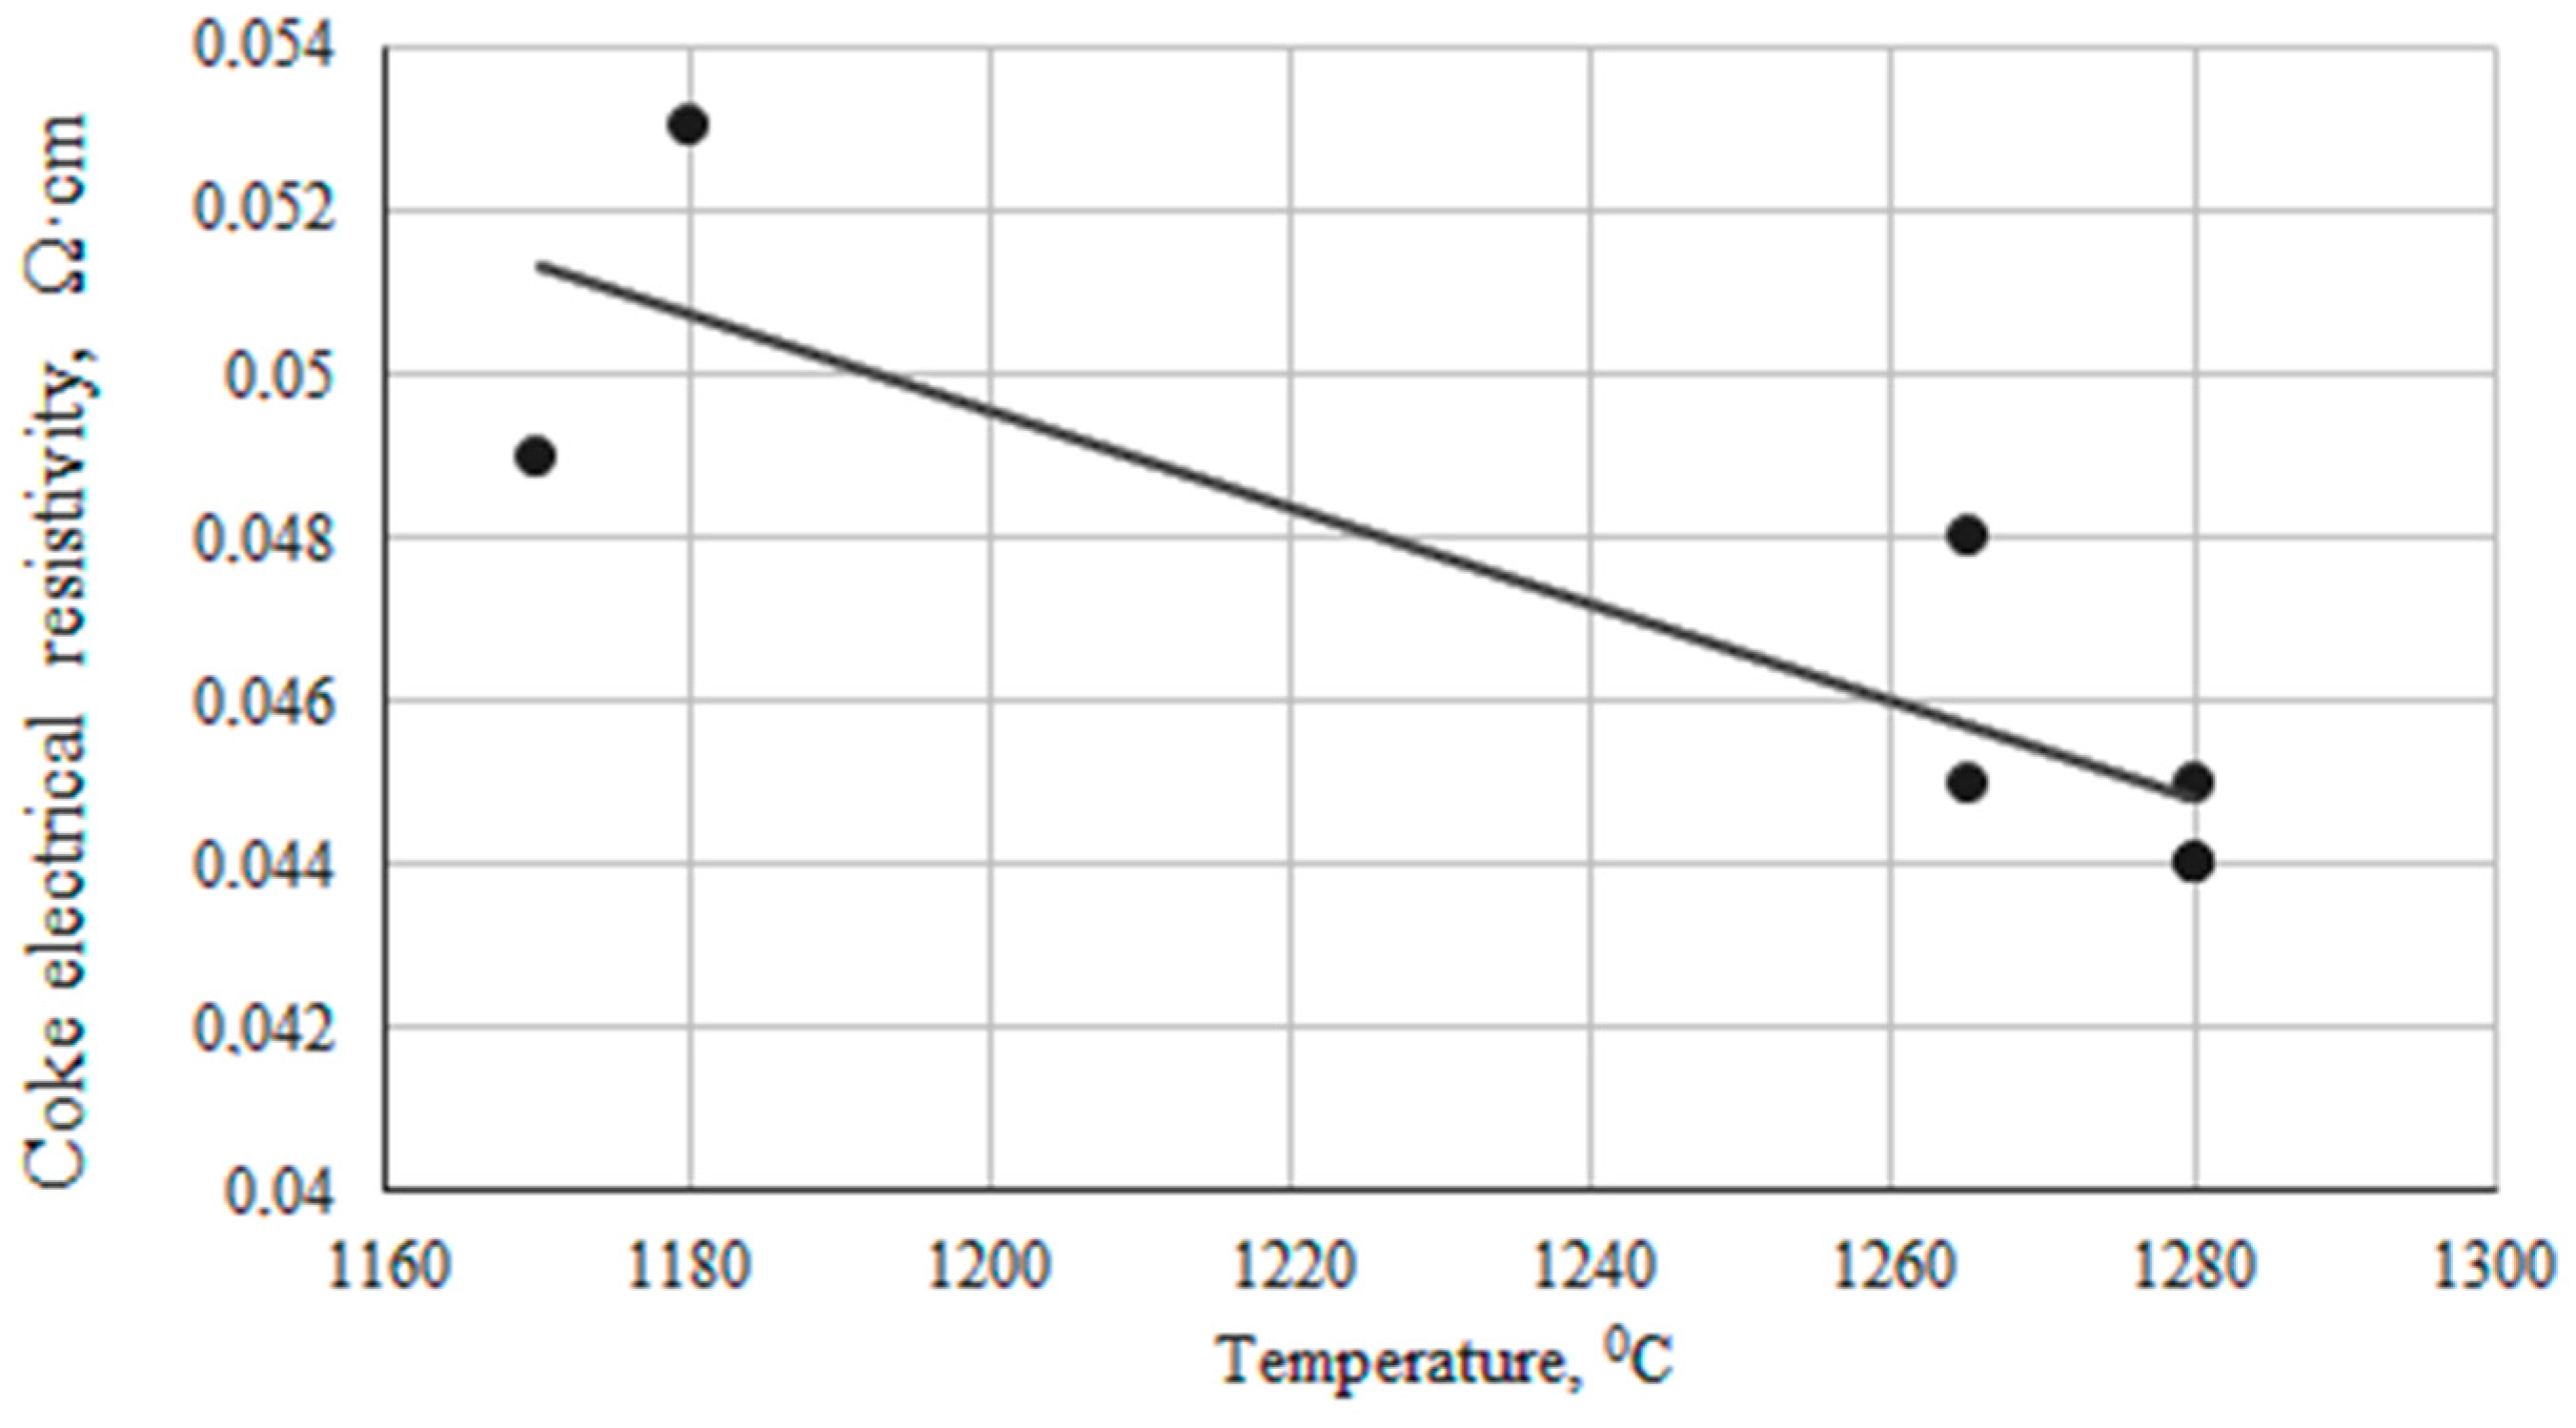
For samples 10–17 of the coal batch, in which the content of gas group coal did not exceed 43%, the dependence of the resistivity on the final process temperature was observed. It was found that the resistivity of the coke decreased with increasing temperatures (Figure 10). Figure 11 shows the dependence of coke resistivity on the final temperature of the coking process.
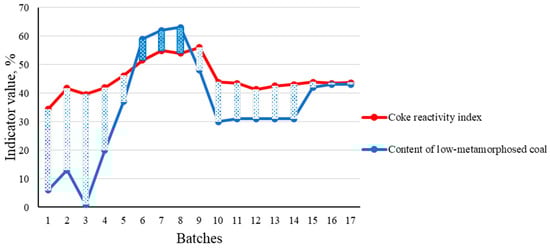
Figure 10.
Changes in the content of low-metamorphosed coal in the batch and the coke reactivity index.
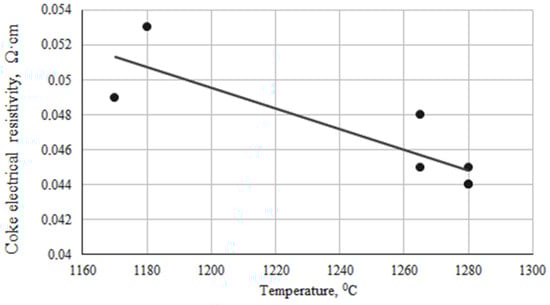
Figure 11.
Dependence of coke electrical resistivity on the final temperature of the coking process.
Table 7 shows the equations that describe the dependencies obtained.
Table 7.
Mathematical dependencies.
The above mathematical expressions and their statistical estimates (correlation of 0.6–0.84) illustrate the close dependence of raw materials and coke properties on resistivity. The inversion of signs in the equations indicates that the CSR and CRI indicators are inversely proportional. Using methods of mathematical statistics to process the data, we obtained regression equations:
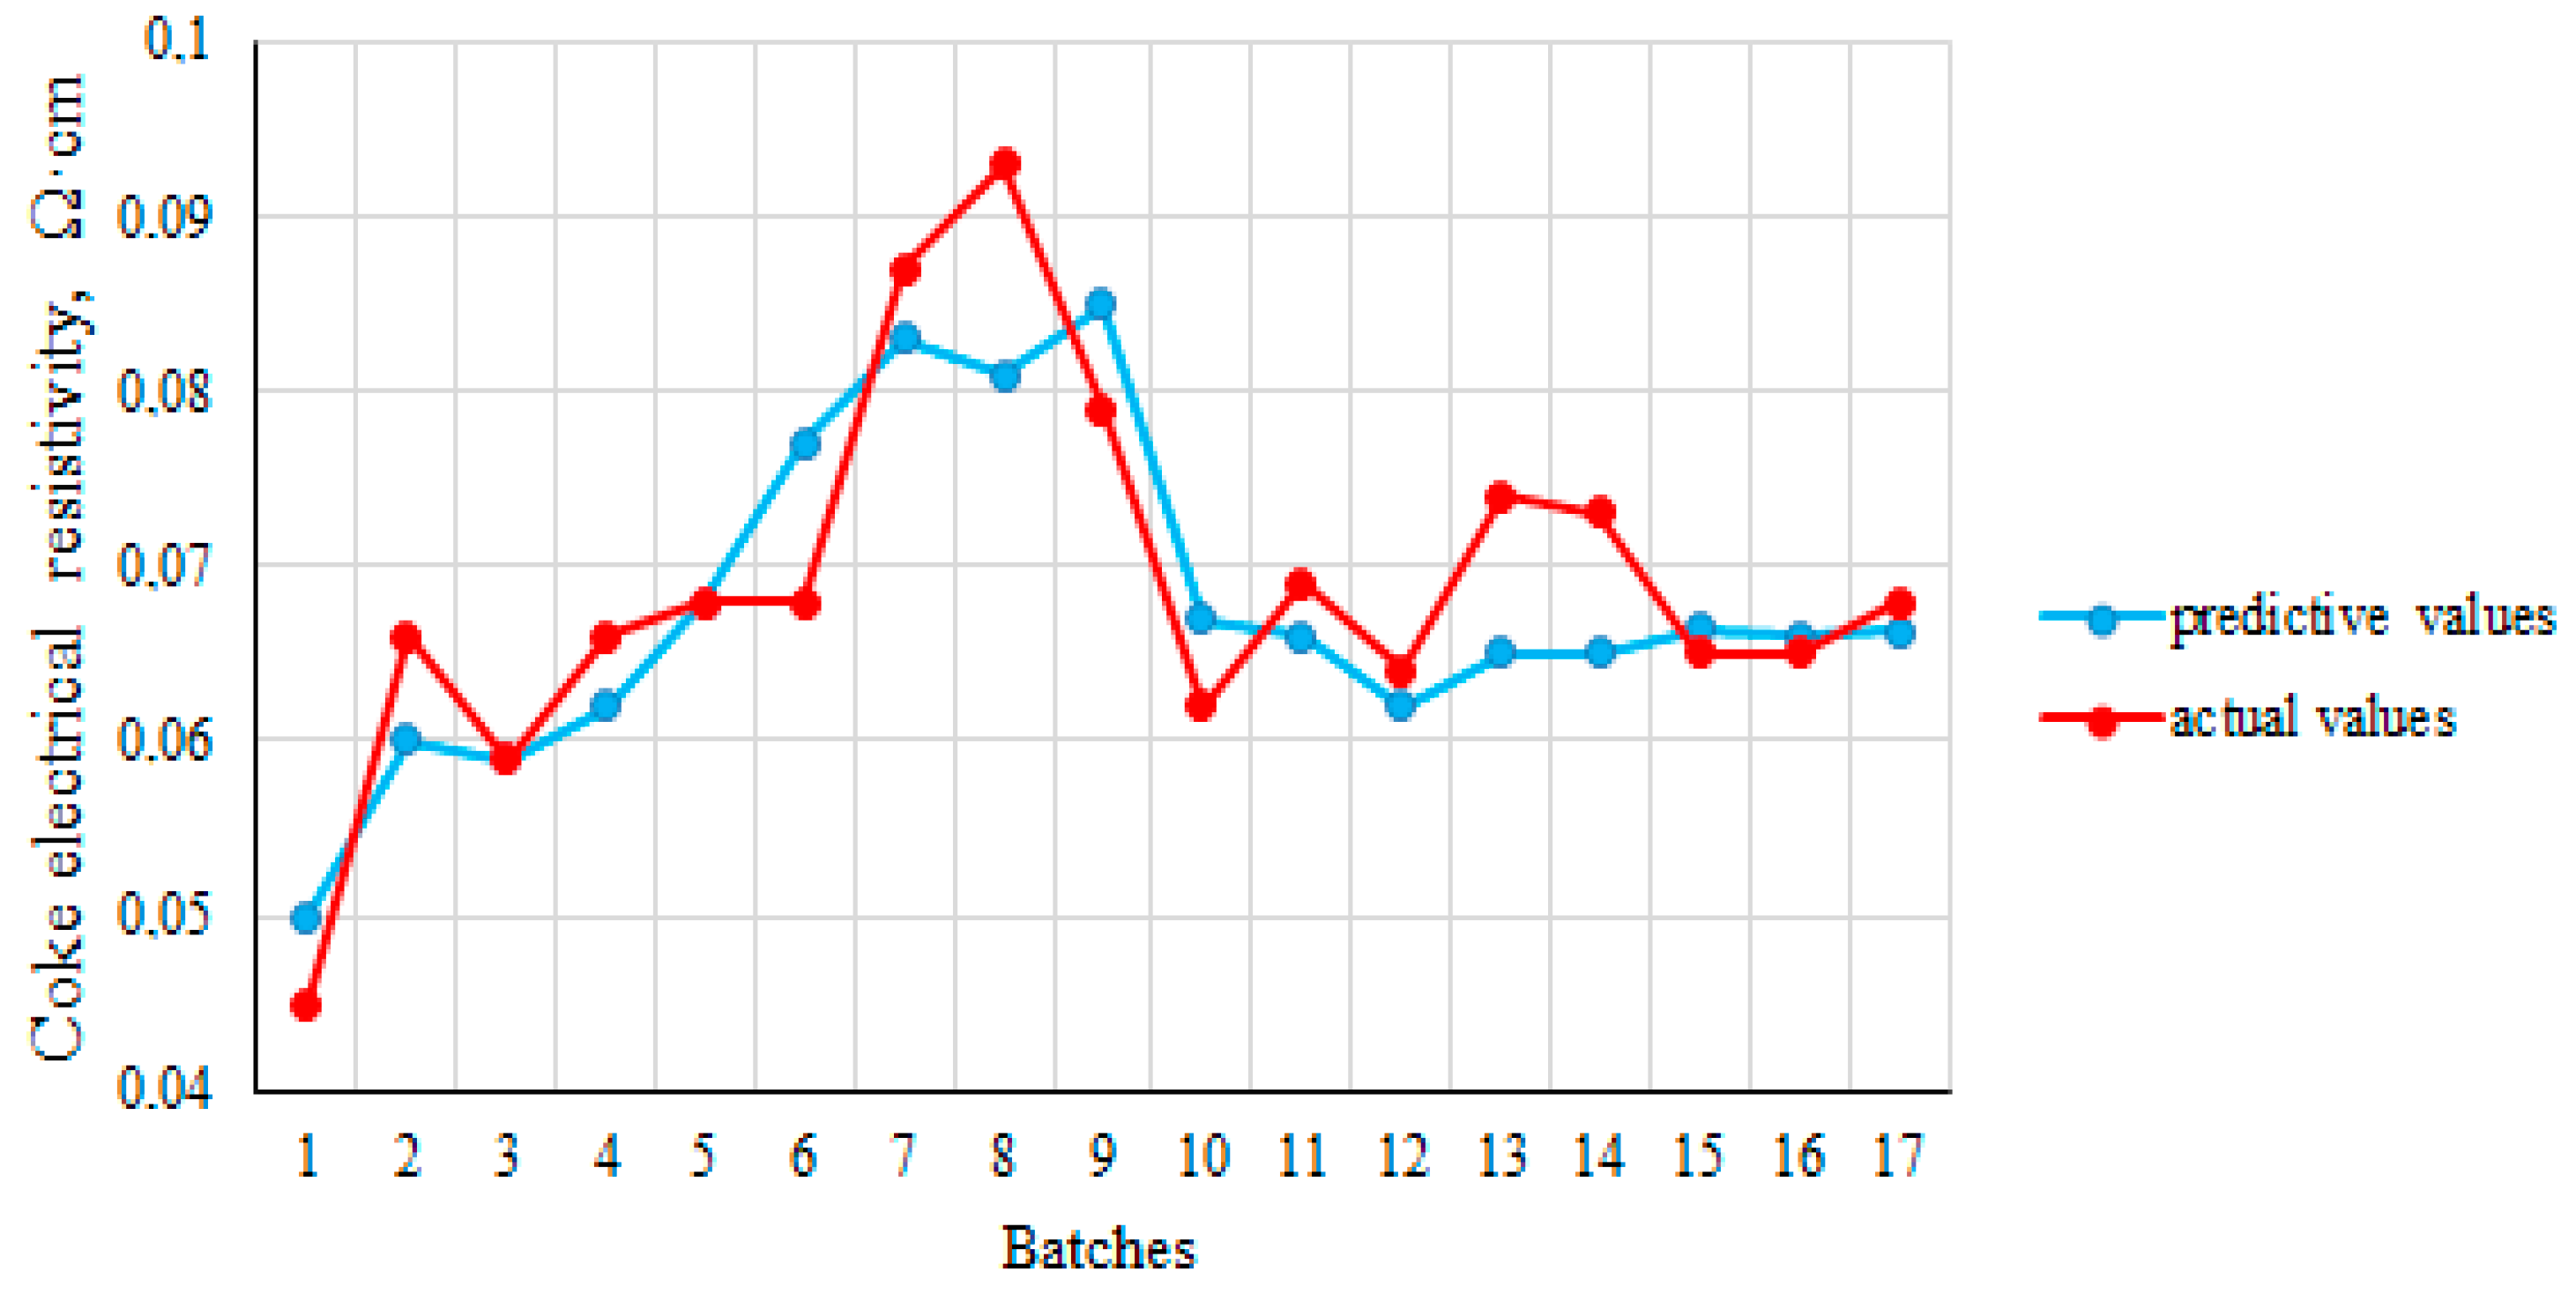
The graph in the Figure 12 illustrates the actual and predicted values of electrical resistance. For Equation (8), the standard error is 0.00768.
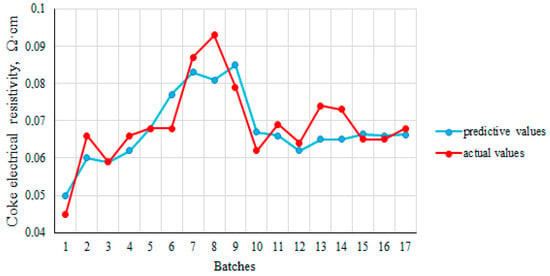
Figure 12.
Analysis of actual and predicted values for Equation (8).
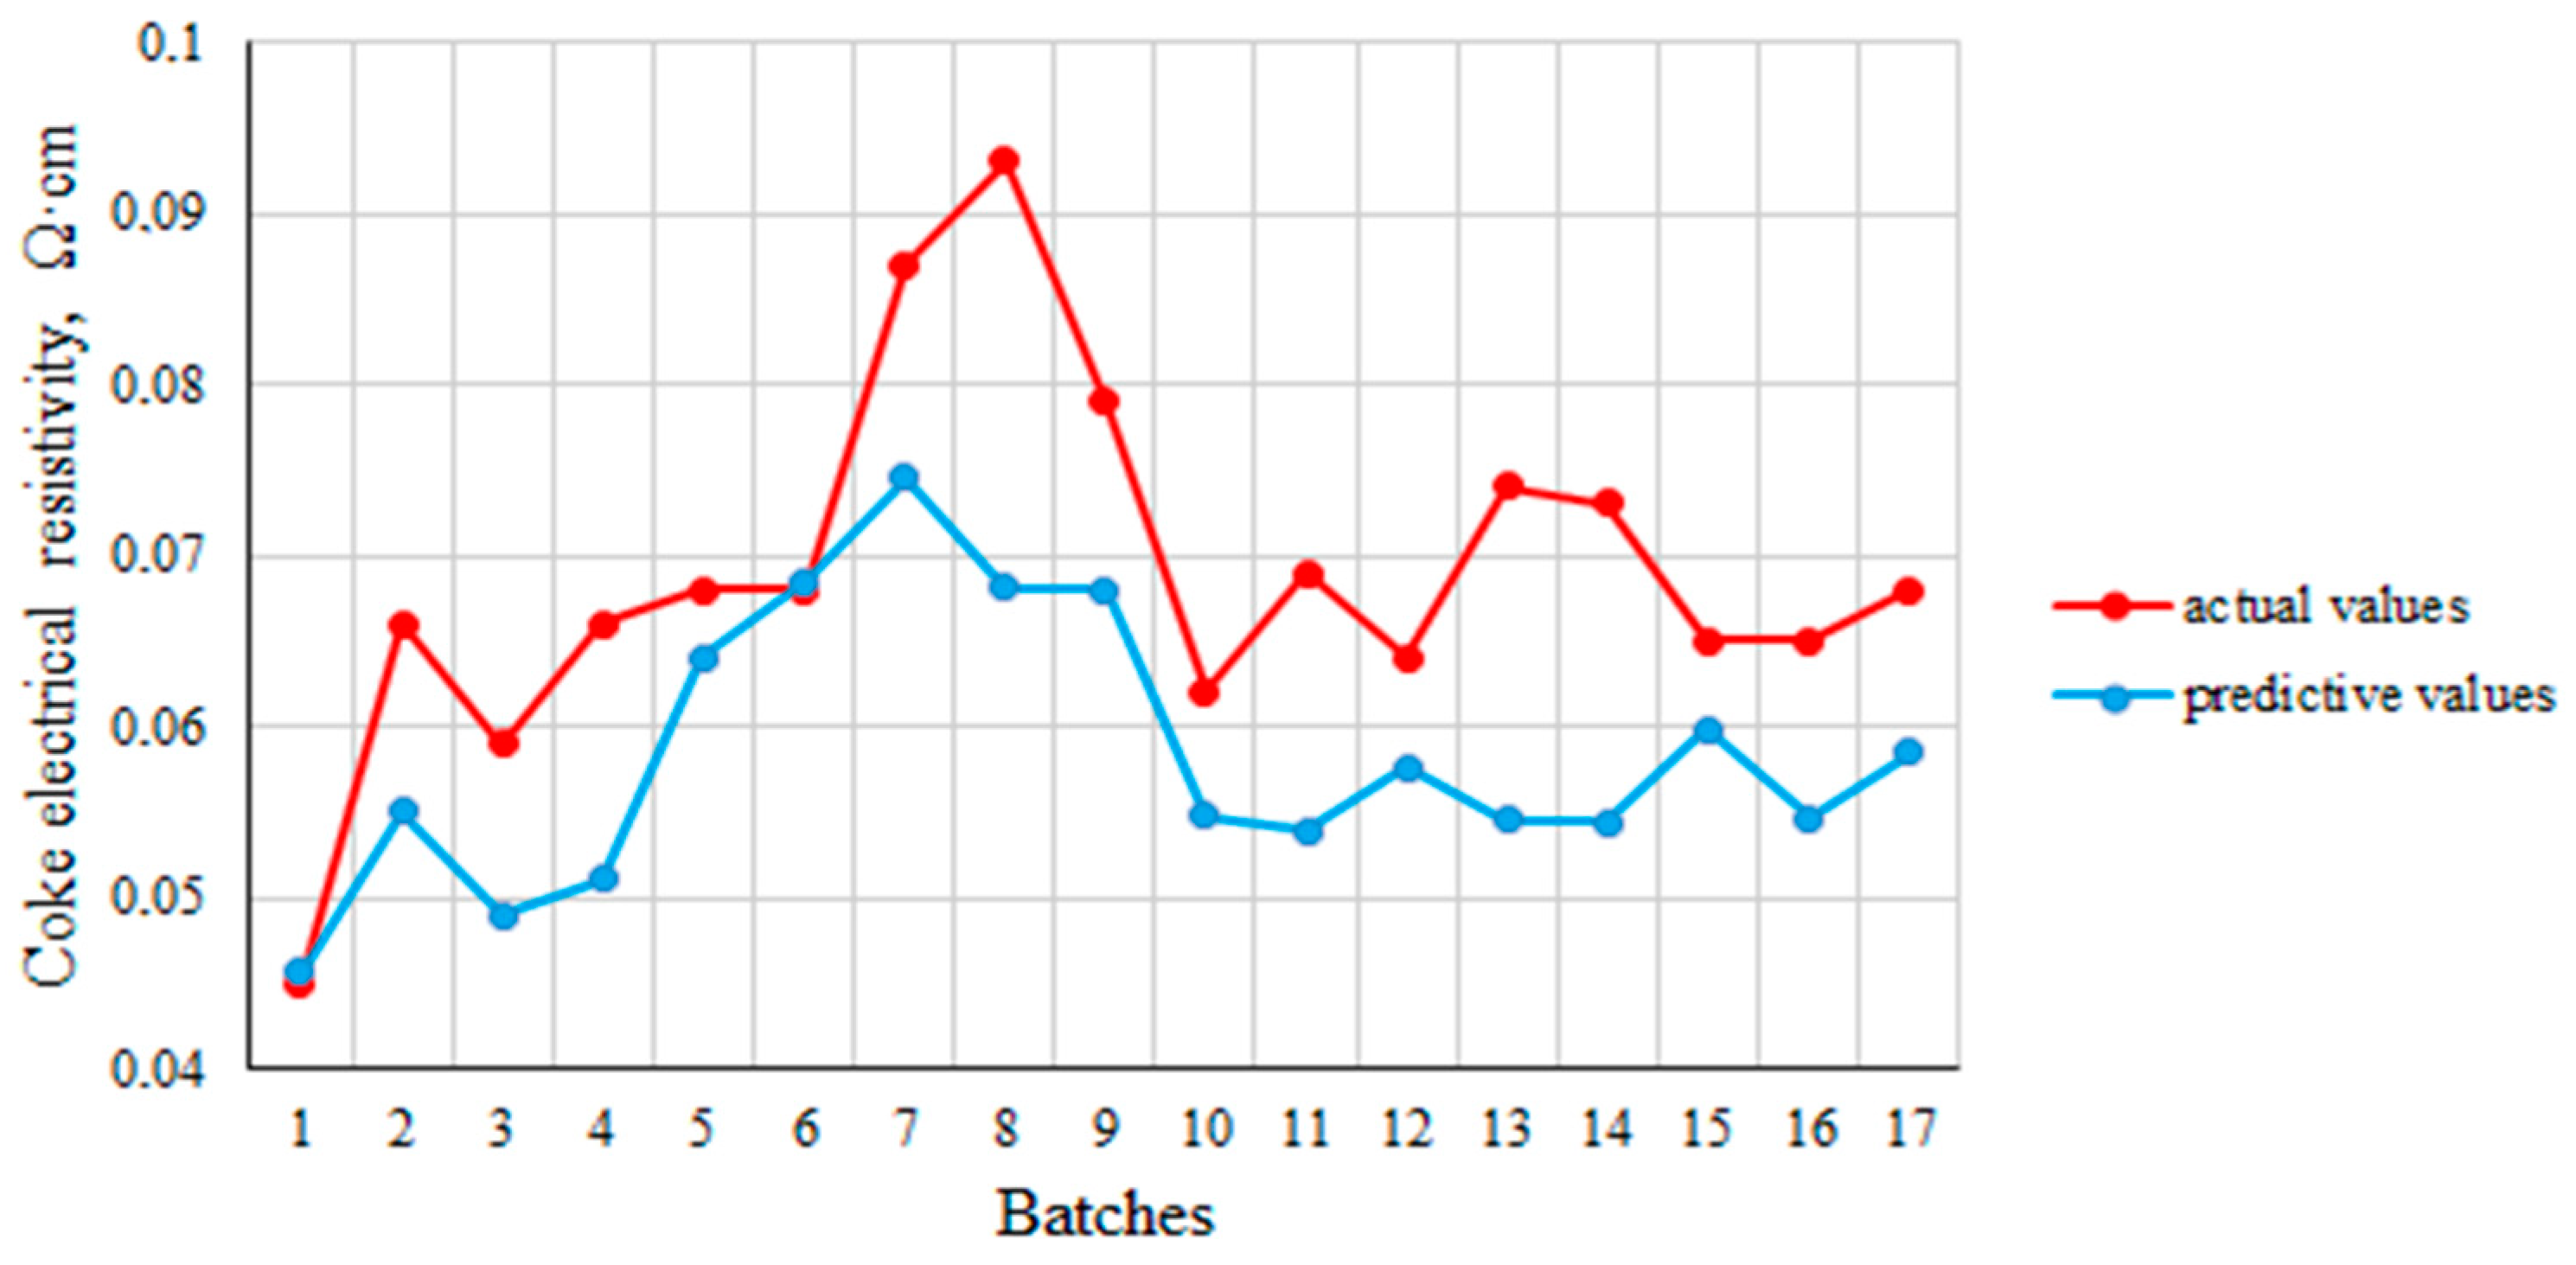
The graph in the Figure 13 illustrates the actual and predicted values of electrical resistance. For Equation (9), the standard error is 0.00605.
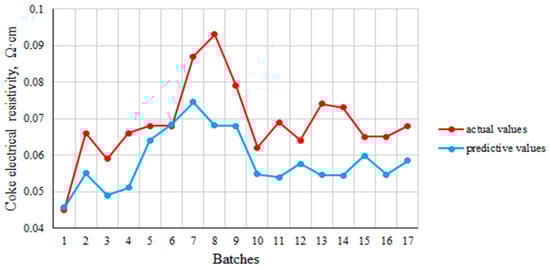
Figure 13.
Analysis of actual and predicted values for Equation (9).
Such low standard error values indicate that the obtained regression equations accurately describe the relationship between the factors of influence and the high resistivity of coke. Thus, the equation can be recommended for optimizing the component composition and quality of coal batches, given their significant impact on coke resistivity and predicting coke resistivity.
4. Discussion
The established relationship between resistivity and reactivity and post-reaction strength is logical. Resistivity and reactivity are different in nature. For example, the analyses of many studies [17,18,19] show that the properties of the coal used (ash content, sulfur content, mineral composition, volatile yield, and petrographic composition), the technology of the batch preparation, the thermal regime of its coking, and the coking period affect the CRI. At the same time, both of these indicators change synchronously because they are influenced by some common factors, such as the temperature level and coke readiness, which indicates the orderliness of its structure.
In [5], they evaluated the electrical properties of coal raw materials of different degrees of carbonization (charcoal and hard coal) and their carbonization products. Thus, thermal processing of carbonaceous raw materials up to a temperature of 1400 °C reduces the oxygen yield, streamlines the structure, and reduces the electrical resistance, i.e., the transformation of dielectric properties into a material with semiconductor characteristics occurs with a change in the carbon structure [5,20,21,22,23,24]. Moreover, the greater the changes in properties, the greater the degree of transformation and orderliness of the new structure. The authors also note that the heat treatment temperature of the carbon material is the main influence parameter, while the holding time has only a minor effect on the resistivity.
Papers [1,2,25] also show that with an increase in the heat treatment temperature due to thermal destruction and the release of low-molecular-weight gases, such as CO, CO2, CH4, and H2, there is a significant decrease in the electrical resistivity of carbonaceous material.
Studies [26,27] illustrate the results of a study on the influence of biomass additives on the quality of metallurgical coke. The study also found that the resistivity of carbon-containing materials decreased with increasing carbonization temperature, which is explained by the destruction of side chains, the separation of oxygen and other heteroatoms contained in functional groups, and the restructuring of the coke matrix. The resistance of carbon materials in the temperature range from 950 °C to 1100 °C decreases from an average of 13.9 mΩ to 12 mΩ.
Coke is classified as a semiconductor in terms of its electrical resistance.
The electrical resistance of a coke bulk mass depends significantly on its size and pressure: with a decrease in size and an increase in coke uniformity, the resistance increases; an increase in pressure, which will lead to an increase in the contact density between coke particles, reduces the electrical resistance [26].
The authors of [28] studied the effect of high temperature on the macroscopic properties and microstructure two types of coke (tamping coke (T-coke) and top-charging coke (TC-coke)). The study was conducted in the temperature range of 1100–1400 °C, i.e., in conditions close to blast furnace melting. In this temperature range, chemical bonds are broken. In addition, changes in the arrangement of atoms in the coke were accompanied by changes in its electrical resistance. Using spectroscopic analysis, changes in the optical structure were recorded when the temperature increased from 1100 °C to 1400 °C. Thus, it was found that the distance between the layers and the anisotropic texture of coke decreased, and an increase in the degree of graphitization was observed, as well as an increase in the proportion of large pores, which, in combination, causes a decrease in the strength of coke.
Also noteworthy is the study by [29] on changes in the electrical properties of low-rank coal as a result of pyrolysis under the influence of microwave radiation. It was found that with an increase in the time of microwave radiation, the cleavage and destruction of functional groups occurred. We also recorded an increase in the number of sp2-hybridized carbon atoms and free electrons between the planes of crystalline graphite and an increase in the degree of structure orderliness; for GC coal—from 457.42 to 4.57 Ω·cm, and for SL coal—from 402.46 to 3.59 Ω·cm. Thus, as in the case of temperature exposure, due to structural changes in the organic matrix of coal, the physical properties are transformed, and in this case, so is the electrical conductivity (resistance).
Therefore, carbon materials (coal, activated carbon, coke), whose electrical properties vary with temperature, are used as raw materials for the production of specialized capacitor technology [30].
It can be said that resistivity is a measure of the temperature effect during the process of thermal destruction of coal and coke conversion. Depending on the final temperature of the process, the resistivity decreases the higher the temperature. Therefore, the resistivity can characterize the degree of coke readiness.
5. Conclusions
The determination of electrical resistivity is necessary to assess the properties of carbon-reducing agents used in electrochemical, electrothermal, and metallurgical processes. It is also a valuable characteristic for assessing the readiness of coke and the specifics of its carbon structure.
Thus, reactivity and electrical resistivity determine the technological use of coke.
The correlation between the reactivity and the electrical resistivity of a number of cokes obtained from coal batches with different component compositions was determined.
It is noted that an increase in the content of low-metamorphosed components in the coal batch to 42–63% caused a decrease in the vitrinite reflection index and a shift in the plasticity interval toward lower temperatures, and also led to a weakening of the structure and an increase in the resistivity of coke.
Electrical resistivity is a cumulative indicator of coke properties, the values of which are determined by the ash content, sulfur content, volatile yield, petrographic composition, and carbonization conditions of coal raw materials. The obtained mathematical dependencies are characterized by high correlation values (0.6–0.84).
The studies made it possible to establish the relationship between the resistivity and reactivity, which is reasonable, since both of these indicators characterize the structure of coke and the degree of its orderliness. It can be recommended to use Equation (8) to optimize the component composition and quality of production batches, given their significant impact on the resistivity of coke. Thus, regression Equation (9) will allow us to additionally evaluate the coke structure. The proposed regression equations will allow us to predict its behavior in the blast furnace process. They can also be recommended for optimizing the component composition and quality of production batches, given their significant impact on the resistivity of coke.
This is especially true when coke is used in electrothermal processes (production of ferroalloys), since the resistivity of coke determines the course of physical, chemical, and chemical reduction processes, productivity, and the electrical and thermal efficiency of the furnace. Logical dependence of the resistivity of carbon materials on temperature makes it possible to consider coke as a promising raw material for the production of temperature-sensitive capacitors, anodes, and lining elements for electrolyzers in the electrochemical production of aluminum.
It is important to note that the use of the coke electrical resistivity test to monitor coke quality for the conditions of a particular coke production is practical and economically feasible. As the resistivity test requires much less time to perform than the reactivity test, it can be considered as an alternative approach to the reactivity testing currently performed for quality control purposes.
Author Contributions
Conceptualization, D.M. and K.S.; methodology, D.M., S.P. and Y.S.; investigation, K.S., B.K. and Y.S.; data curation, D.M.; writing—original draft preparation, K.S. and M.K.; writing—review and editing, M.K., Y.P. and M.S.; visualization, K.S. and Y.P.; supervision, D.M.; project administration, D.M. and S.P. All authors have read and agreed to the published version of the manuscript.
Funding
This research received no external funding.
Institutional Review Board Statement
Not applicable.
Informed Consent Statement
Not applicable.
Data Availability Statement
The data presented in this study are available on request from the corresponding author.
Conflicts of Interest
The authors declare no conflicts of interest.
References
- Miroshnichenko, D.; Shmeltser, K.; Kormer, M. Factors Affecting the Formation the Carbon Structure of Coke and the Method of Stabilizing Its Physical and Mechanical Properties. C 2023, 9, 66. [Google Scholar] [CrossRef]
- Shmeltser, E.O.; Lyalyuk, V.P.; Sokolova, V.P.; Miroshnichenko, D.V. The using of coal blends with an increased content of coals of the middle stage of meta-morphism for the production of the blast-furnace coke. Message 2. Assessment of coke quality. Pet. Coal 2019, 61, 52–57. Available online: https://www.vurup.sk/wp-content/uploads/2019/01/PC_x_2018_Shmeltzer_155_rev1.pdf (accessed on 20 May 2024).
- Zhang, L.; Wang, G.; Xue, Q.; Zuo, H.; She, X.; Wang, J. Effect of preheating on coking coal and metallurgical coke properties: A review. Fuel Process. Technol. 2021, 221, 106942. [Google Scholar] [CrossRef]
- He, J.; Zou, C.; Zhao, J.; Yu, N.; Wang, Y.; Shi, R. Comparison of isothermal and nonisothermal combustion methods when evaluating semicoke for pulverized coal injection of blast furnace. Asia-Pac. J. Chem. Eng. 2022, 18, 2838. [Google Scholar] [CrossRef]
- Saranchuk, V.I.; Oshovsky, V.V.; Lavrenko, A.T.; Koshkarev, Y.M. Method for determining the value of electrical resistance of coal depending on temperature. Sci. J. DonNTU Chem. Chem. Technol. 2013, 134, 138–143. [Google Scholar]
- State Standard of Ukraine 4096-2002; Brown Coal, Hard Coal, Anthracite, Combustible Shale and Coal Briquettes. Methods of Sample Selection and Preparation for Laboratory Tests. Technical Committee of Ukraine on standardization TK-92: Kyiv, Ukraine, 2002.
- ISO 1171-97; Solid Mineral Fuels. Methods for Determination of Ash. International Organization for Standardization: Geneva, Switzerland, 1997.
- ISO 589-81; Hard Coal—Determination of Total Moisture. International Organization for Standardization: Geneva, Switzerland, 1981.
- ISO 562:2010; Hard Coal and Coke. Determination of Volatile Matter. International Organization for Standardization: Geneva, Switzerland, 1981.
- ISO 334:2020; Coal and Coke. Determination of Total Sulfur. Eschka Method. International Organization for Standardization: Geneva, Switzerland, 2020.
- ISO 7404-3-84; Methods for the Petrographic Analysis of Bituminous Coal and Anthracite—Part 3: Method of Determining Maceral Group Composition. International Organization for Standardization: Geneva, Switzerland, 1984.
- ISO 7404-5-85; Methods for the Petrographic Analysis of Coal—Part 5: Method of Determining Microscopically the Reflectance of Vitrinite. International Organization for Standardization: Geneva, Switzerland, 1985.
- State Standard of Ukraine 7722:2015; Hard Coal. Method of Determining Plastometric Characteristics. State Enterprise “Ukrainian Scientific Research and Training Center for Problems of Standardization, Certification and Quality”: Kyiv, Ukraine, 2015.
- State Standard of Ukraine 3472:2015; Brown Coal, Hard Coal and Anthracite. Classification. UkrNDNC SE: Kyiv, Ukraine, 2015.
- DSTU 8831:2019; Coke. Method for Determining the Resistivity of Coal Coke Powder. UkrNDNC SE: Kyiv, Ukraine, 2019.
- ISO 18894:2006; Coke-Determination of Coke Reactivity Index (CRI) and Coke Strength after Reaction (CSR). International Organization for Standardization: Geneva, Switzerland, 2006.
- North, L.; Blackmore, K.; Nesbitt, K.; Mahoney, M.R. Models of coke quality prediction and the relationships to input variables: A review. Fuel 2018, 219, 446–466. [Google Scholar] [CrossRef]
- Flores, B.D.; Borrego, A.G.; Diez, M.A.; da Silva, G.L.; Zymla, V.; Vilela, A.; Osorio, E. How coke optical texture became a relevant tool for understanding coal blending and coke quality. Fuel Process. Technol. 2017, 164, 13–23. [Google Scholar] [CrossRef]
- Kumar, D.; Saxena, V.K.; Tiwari, H.P.; Nandi, B.K.; Verma, A.; Tiwary, V.K. Variability in Metallurgical Coke Reactivity Index (CRI) and Coke Strength after Reaction (CSR): An Experimental Study. ACS Omega 2022, 7, 1703–1711. [Google Scholar] [CrossRef] [PubMed]
- Vega, M.F.; Díaz-Faes, E.; Barriocanal, C. Influence of the Heating Rate on the Quality of Metallurgical Coke. ACS Omega 2021, 6, 34615–34623. [Google Scholar] [CrossRef] [PubMed]
- Surup, G.R.; Pedersen, T.A.; Chaldien, A.; Beukes, J.P.; Tangstad, M. Electrical Resistivity of Carbonaceous Bed Material at High Temperature. Processes 2020, 8, 933. [Google Scholar] [CrossRef]
- Sánchez-González, J.; Stoeckli, F.; Centeno, T.Á. The role of the electric conductivity of carbons in the electrochemical capacitor performance. J. Electroanal. Chem. 2011, 657, 176–180. [Google Scholar] [CrossRef]
- Miroshnichenko, D.; Zhylina, M.; Shmeltser, K. Modern uses of biochar in various technologies and industries. A review. Chem. Chem. Technol 2024, 18, 2. [Google Scholar] [CrossRef]
- Adinaveen, T.; Vijaya, J.J.; Kennedy, L. Comparative Study of Electrical Conductivity on Activated Carbons Prepared from Various Cellulose Materials. Arab. J. Sci. Eng. 2014, 41, 55–65. [Google Scholar] [CrossRef]
- Weber, K.; Quicker, P. Properties of biochar. Fuel 2018, 217, 240–261. [Google Scholar] [CrossRef]
- Buryak, V.V.; Vasil’chenko, G.N.; Chirka, T.V.; Konstantinov, S.M. Specific Electrical Resistance of Carbon Materials. Refract. Ind. Ceram. 2013, 54, 215–219. [Google Scholar] [CrossRef]
- Bazaluk, O.; Kieush, L.; Koveria, A.; Schenk, J.; Pfeiffer, A.; Zheng, H.; Lozynskyi, V. Metallurgical Coke Production with Biomass Additives: Study of Biocoke Properties for Blast Furnace and Submerged Arc Furnace Purposes. Materials 2022, 15, 1147. [Google Scholar] [CrossRef] [PubMed]
- Fu, X.; Pang, Q.; Yang, X.; Zhan, W.; He, Z. Effect of high temperature on macroscopic properties and microstructure of metallurgical coke. Fuel 2024, 356, 129543. [Google Scholar] [CrossRef]
- Liu, S.; Zhang, Y.; Tuo, K.; Wang, L.; Chen, G. Structure, electrical conductivity, and dielectric properties of semi-coke derived from microwave-pyrolyzed low-rank coal. Fuel Process. Technol. 2018, 178, 139–147. [Google Scholar] [CrossRef]
- Ordabaeva, A.T.; Muldakhmetov, Z.M.; Kim, S.V.; Kasenova, S.B.; Sagintaeva, Z.I.; Gazaliev, A.M. Electrophysical Properties and Heat Capacity of Activated Carbon Obtained from Coke Fines. Molecules 2023, 28, 6545. [Google Scholar] [CrossRef] [PubMed]
Disclaimer/Publisher’s Note: The statements, opinions and data contained in all publications are solely those of the individual author(s) and contributor(s) and not of MDPI and/or the editor(s). MDPI and/or the editor(s) disclaim responsibility for any injury to people or property resulting from any ideas, methods, instructions or products referred to in the content. |
© 2024 by the authors. Licensee MDPI, Basel, Switzerland. This article is an open access article distributed under the terms and conditions of the Creative Commons Attribution (CC BY) license (https://creativecommons.org/licenses/by/4.0/).