Article

Numerical Analysis of Crack Propagation in an Aluminum Alloy under Random Load Spectra
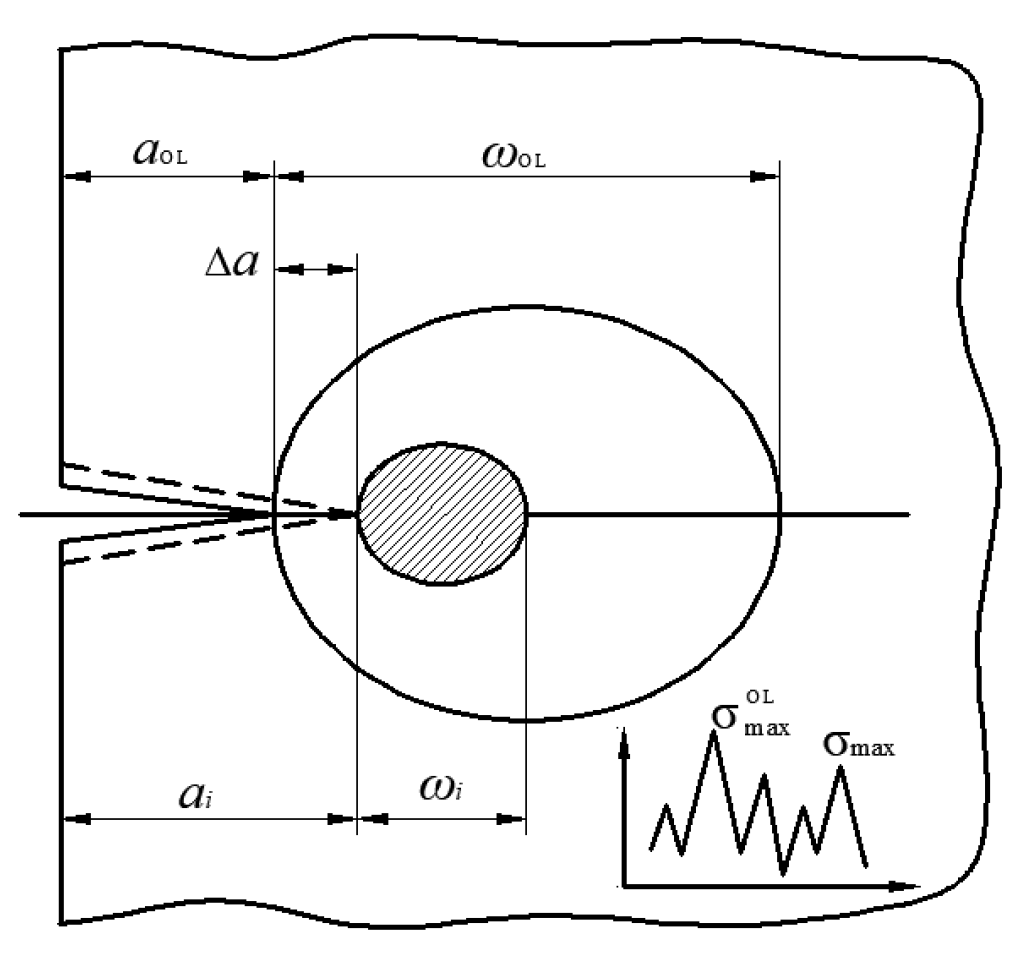
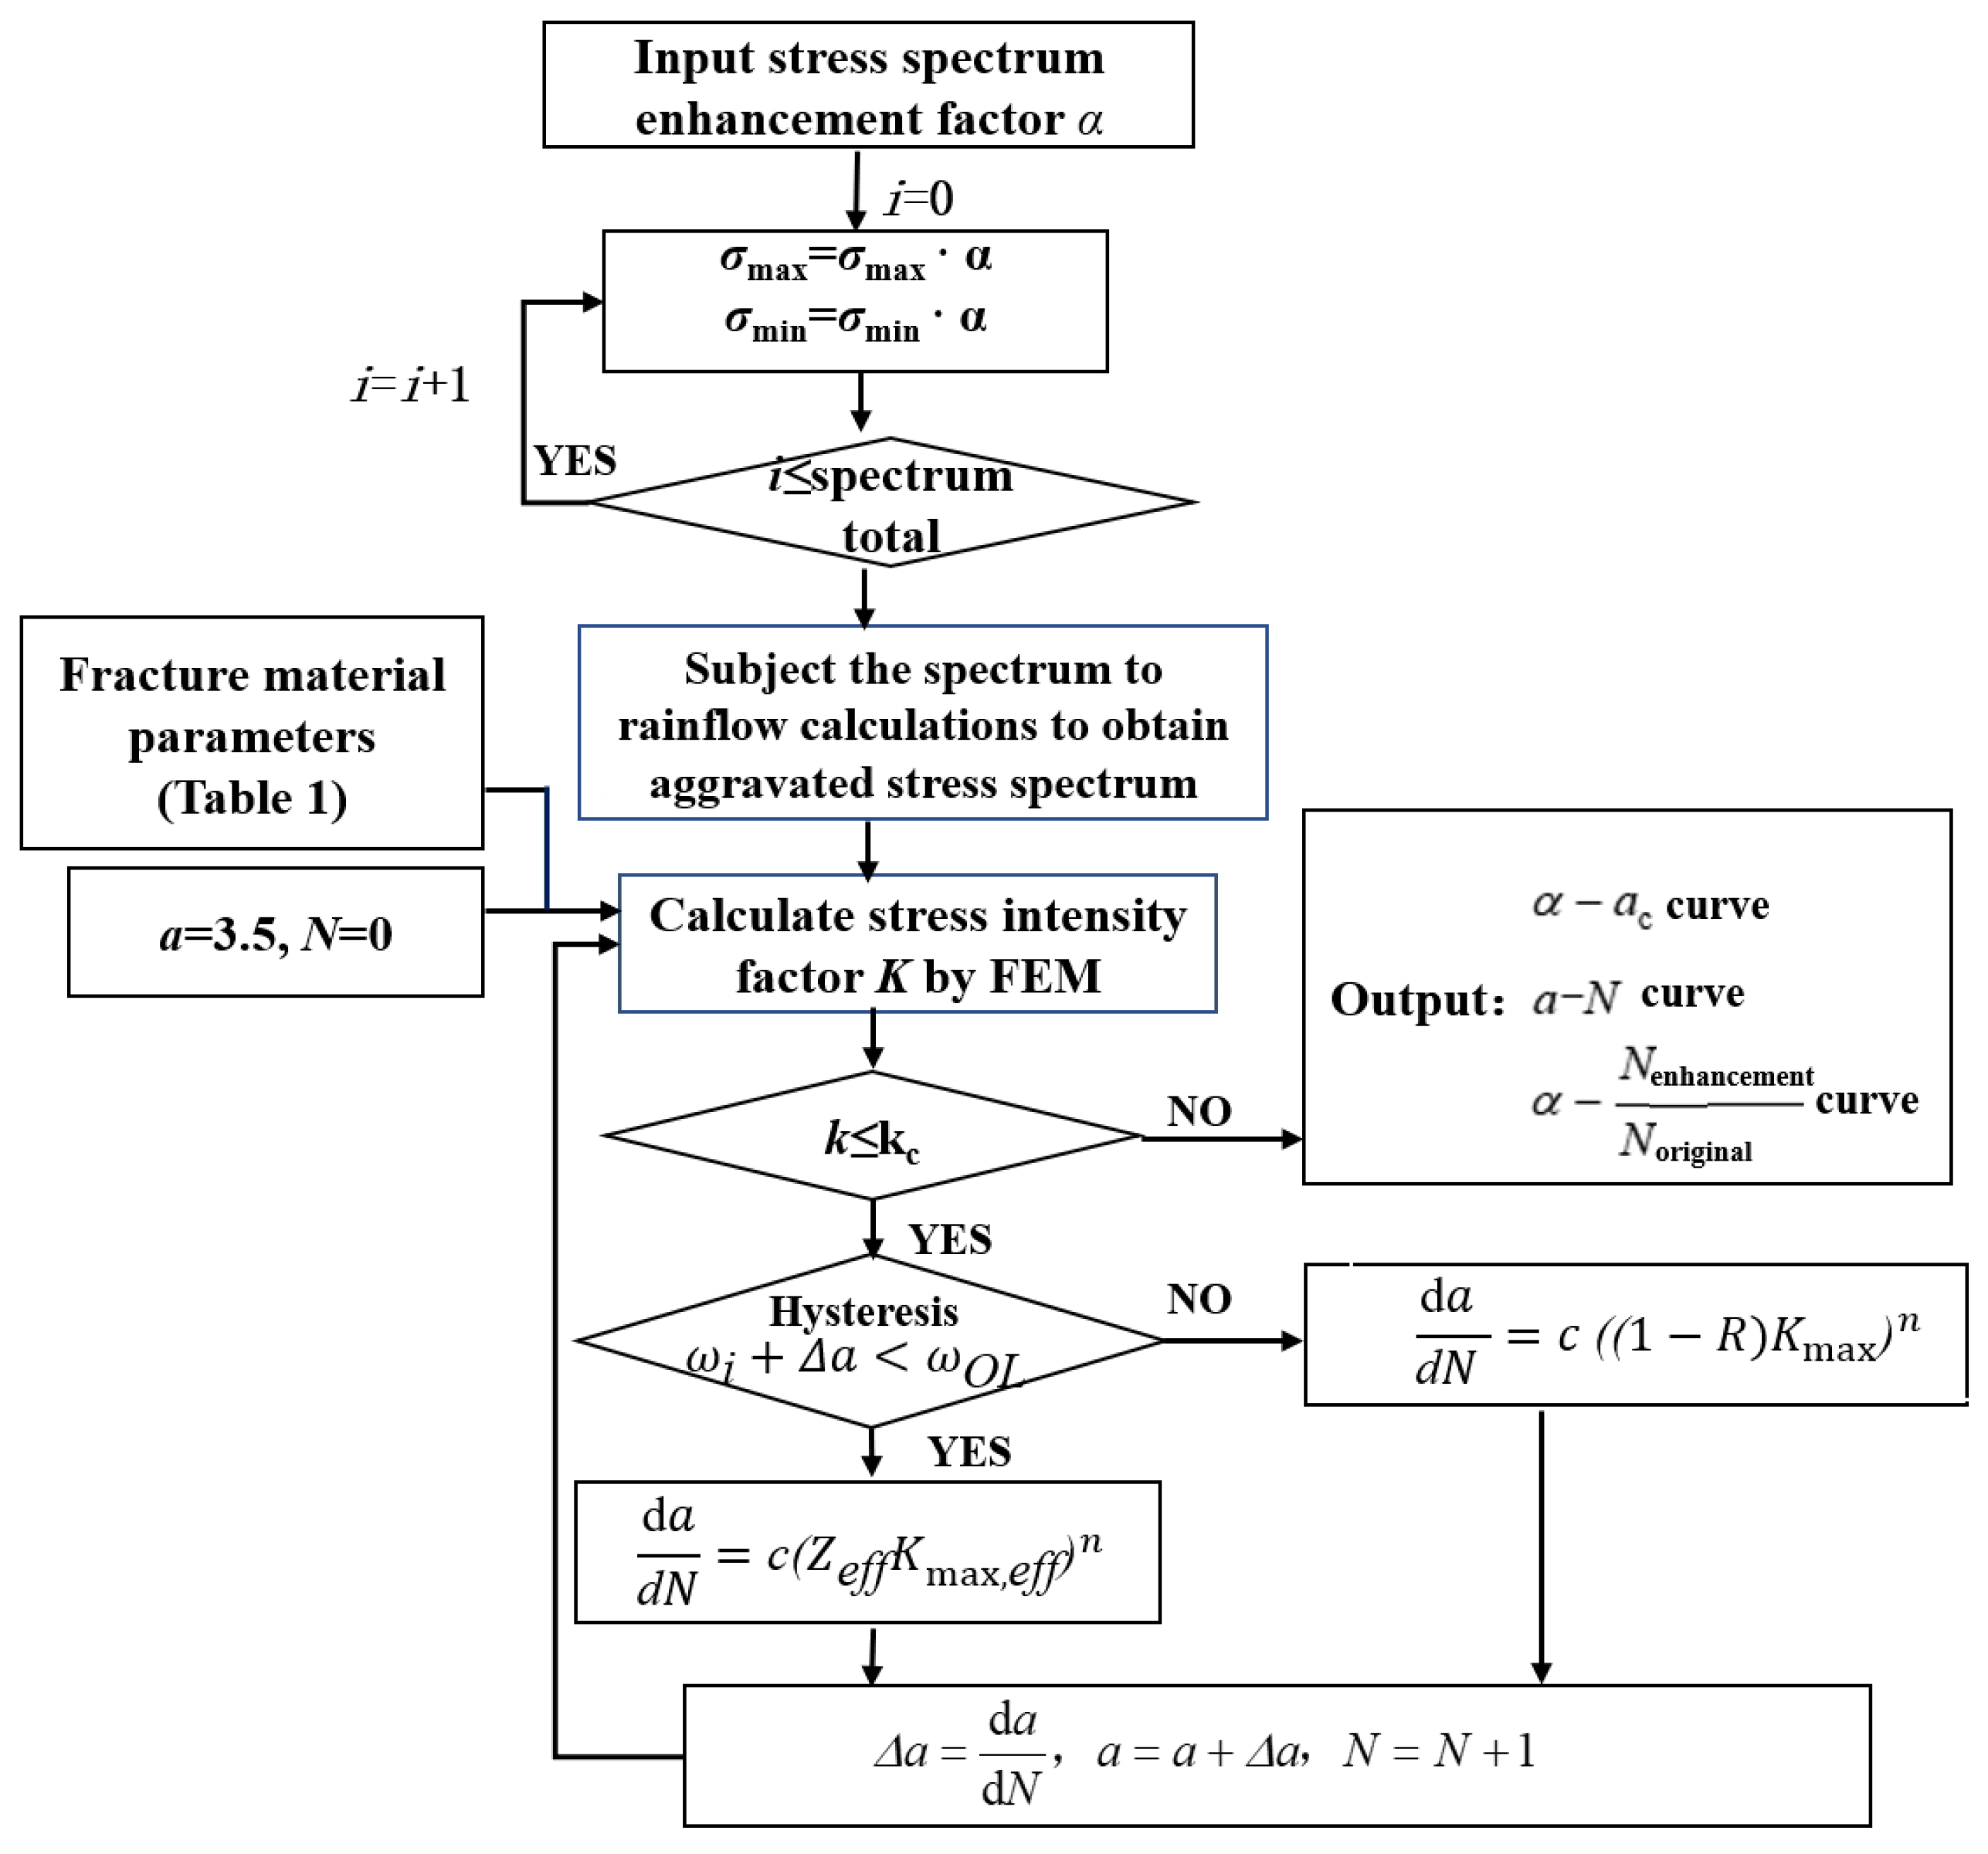
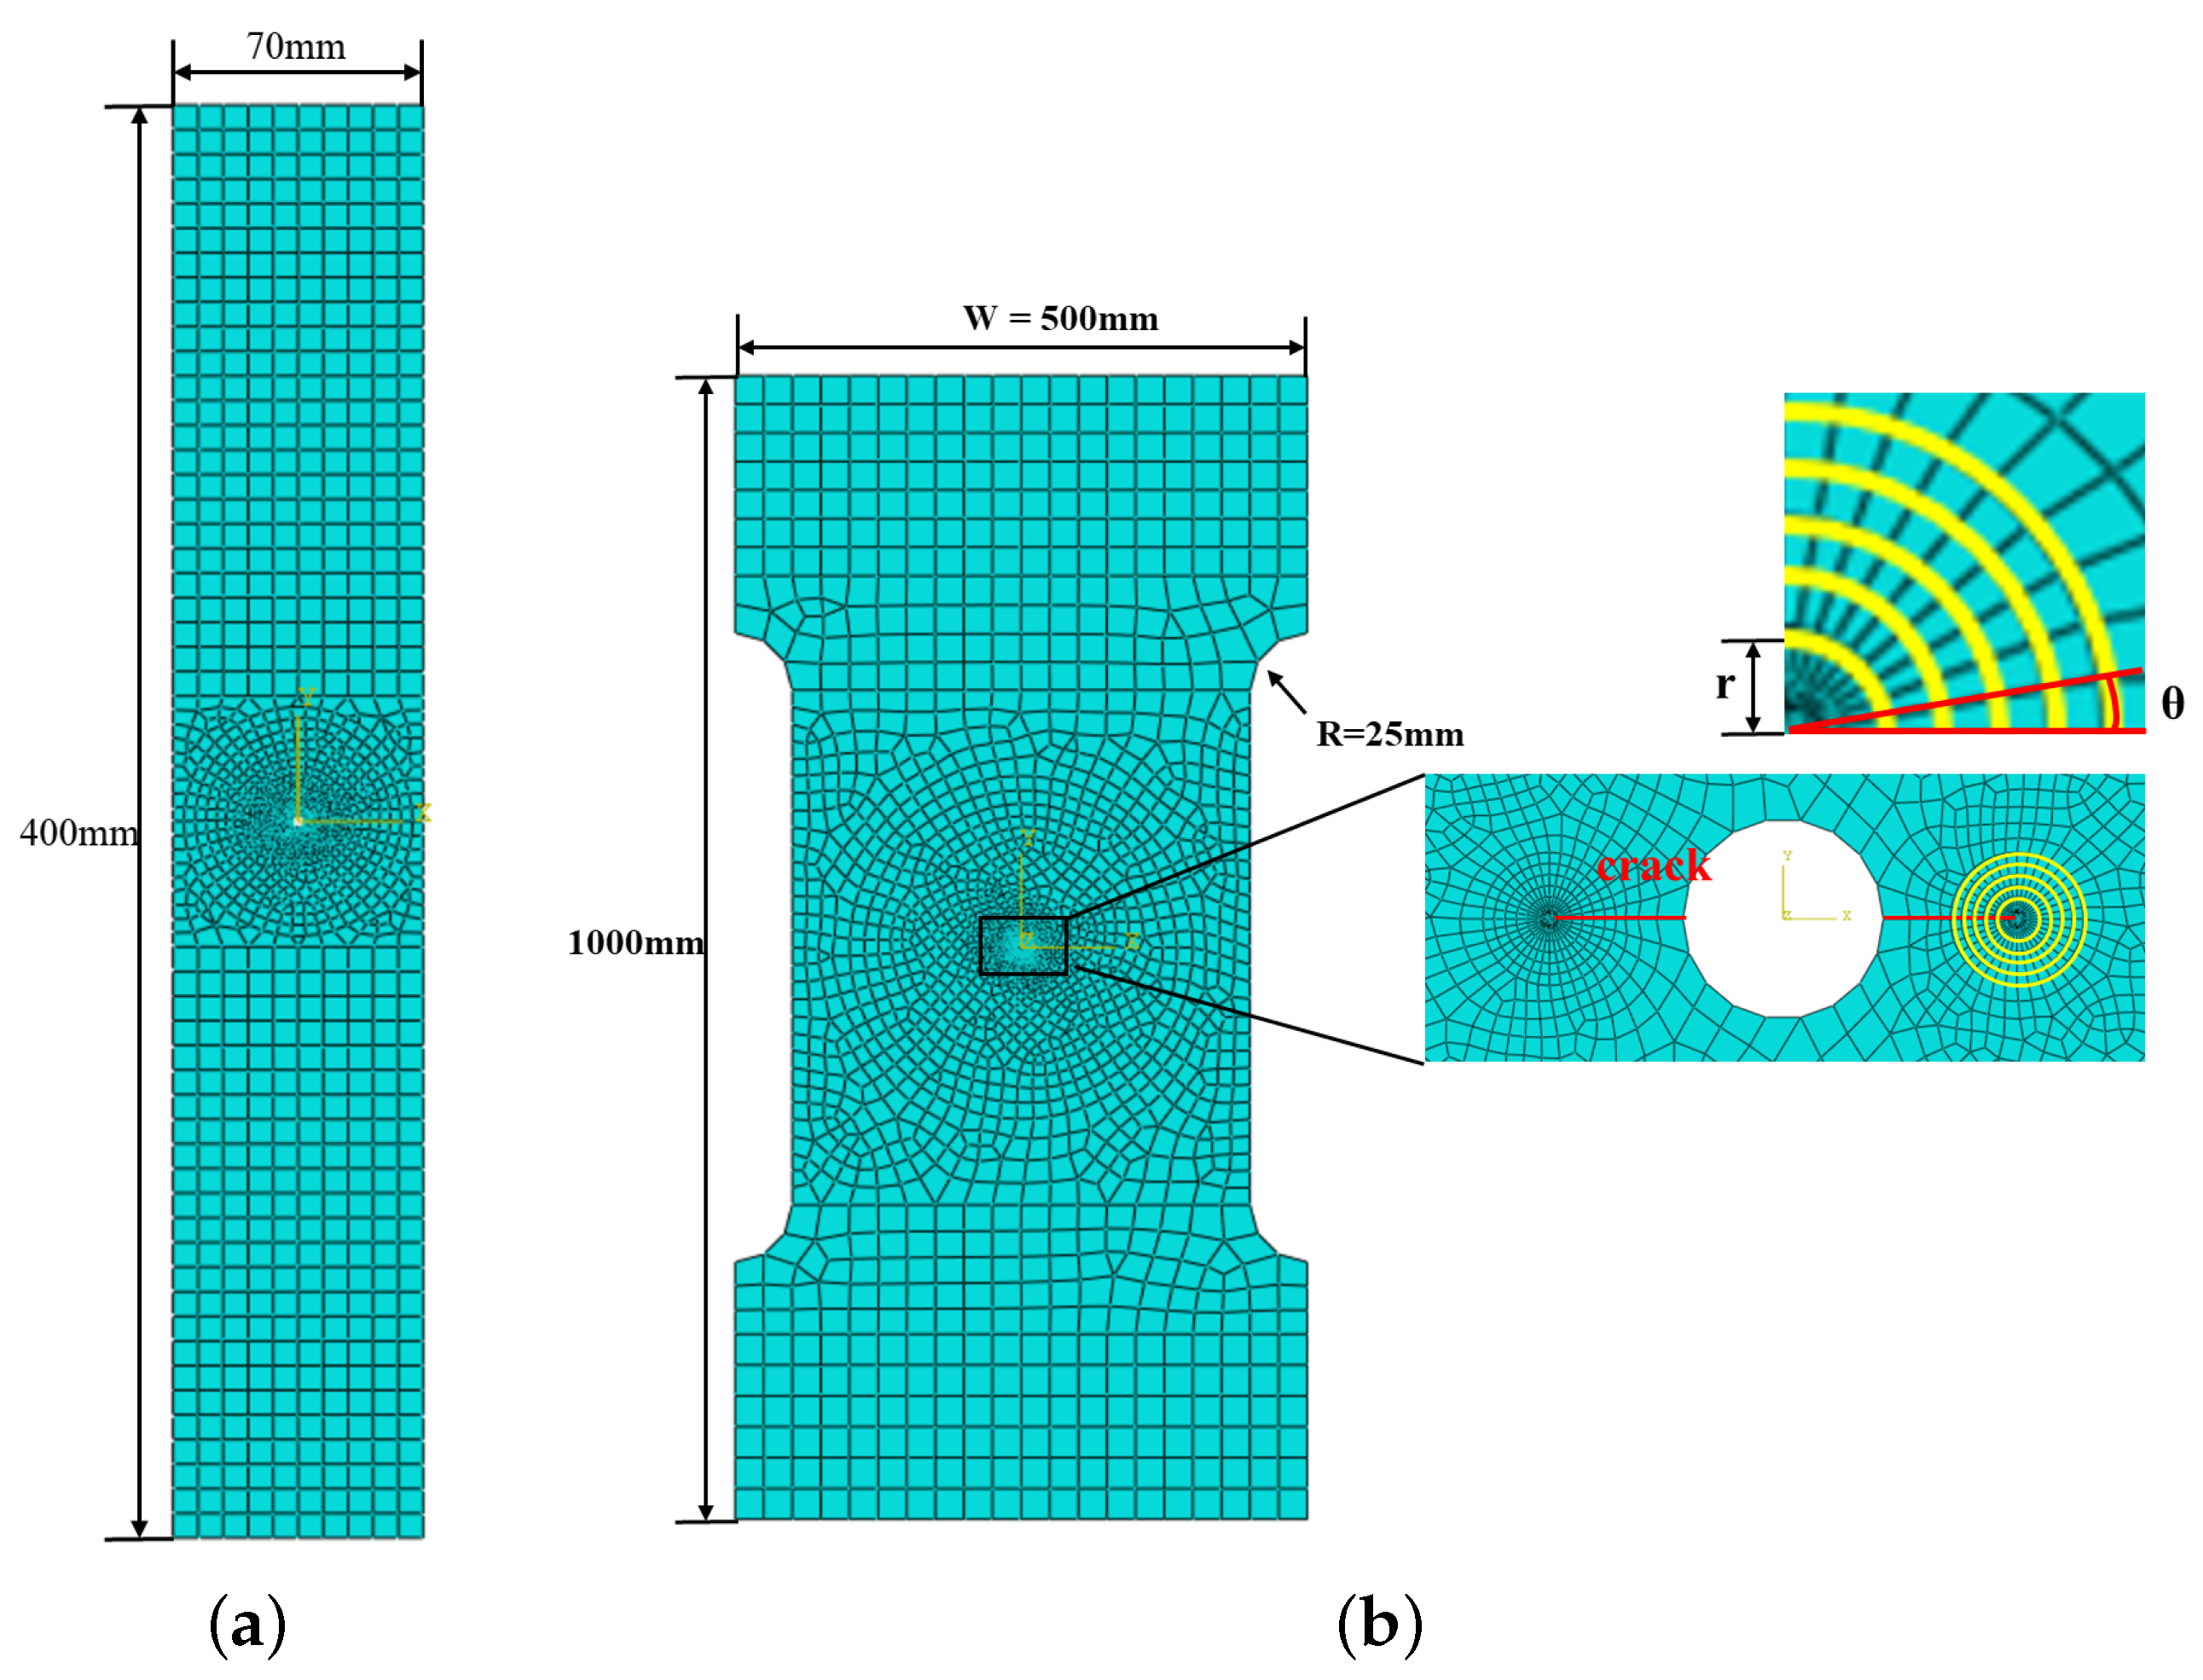
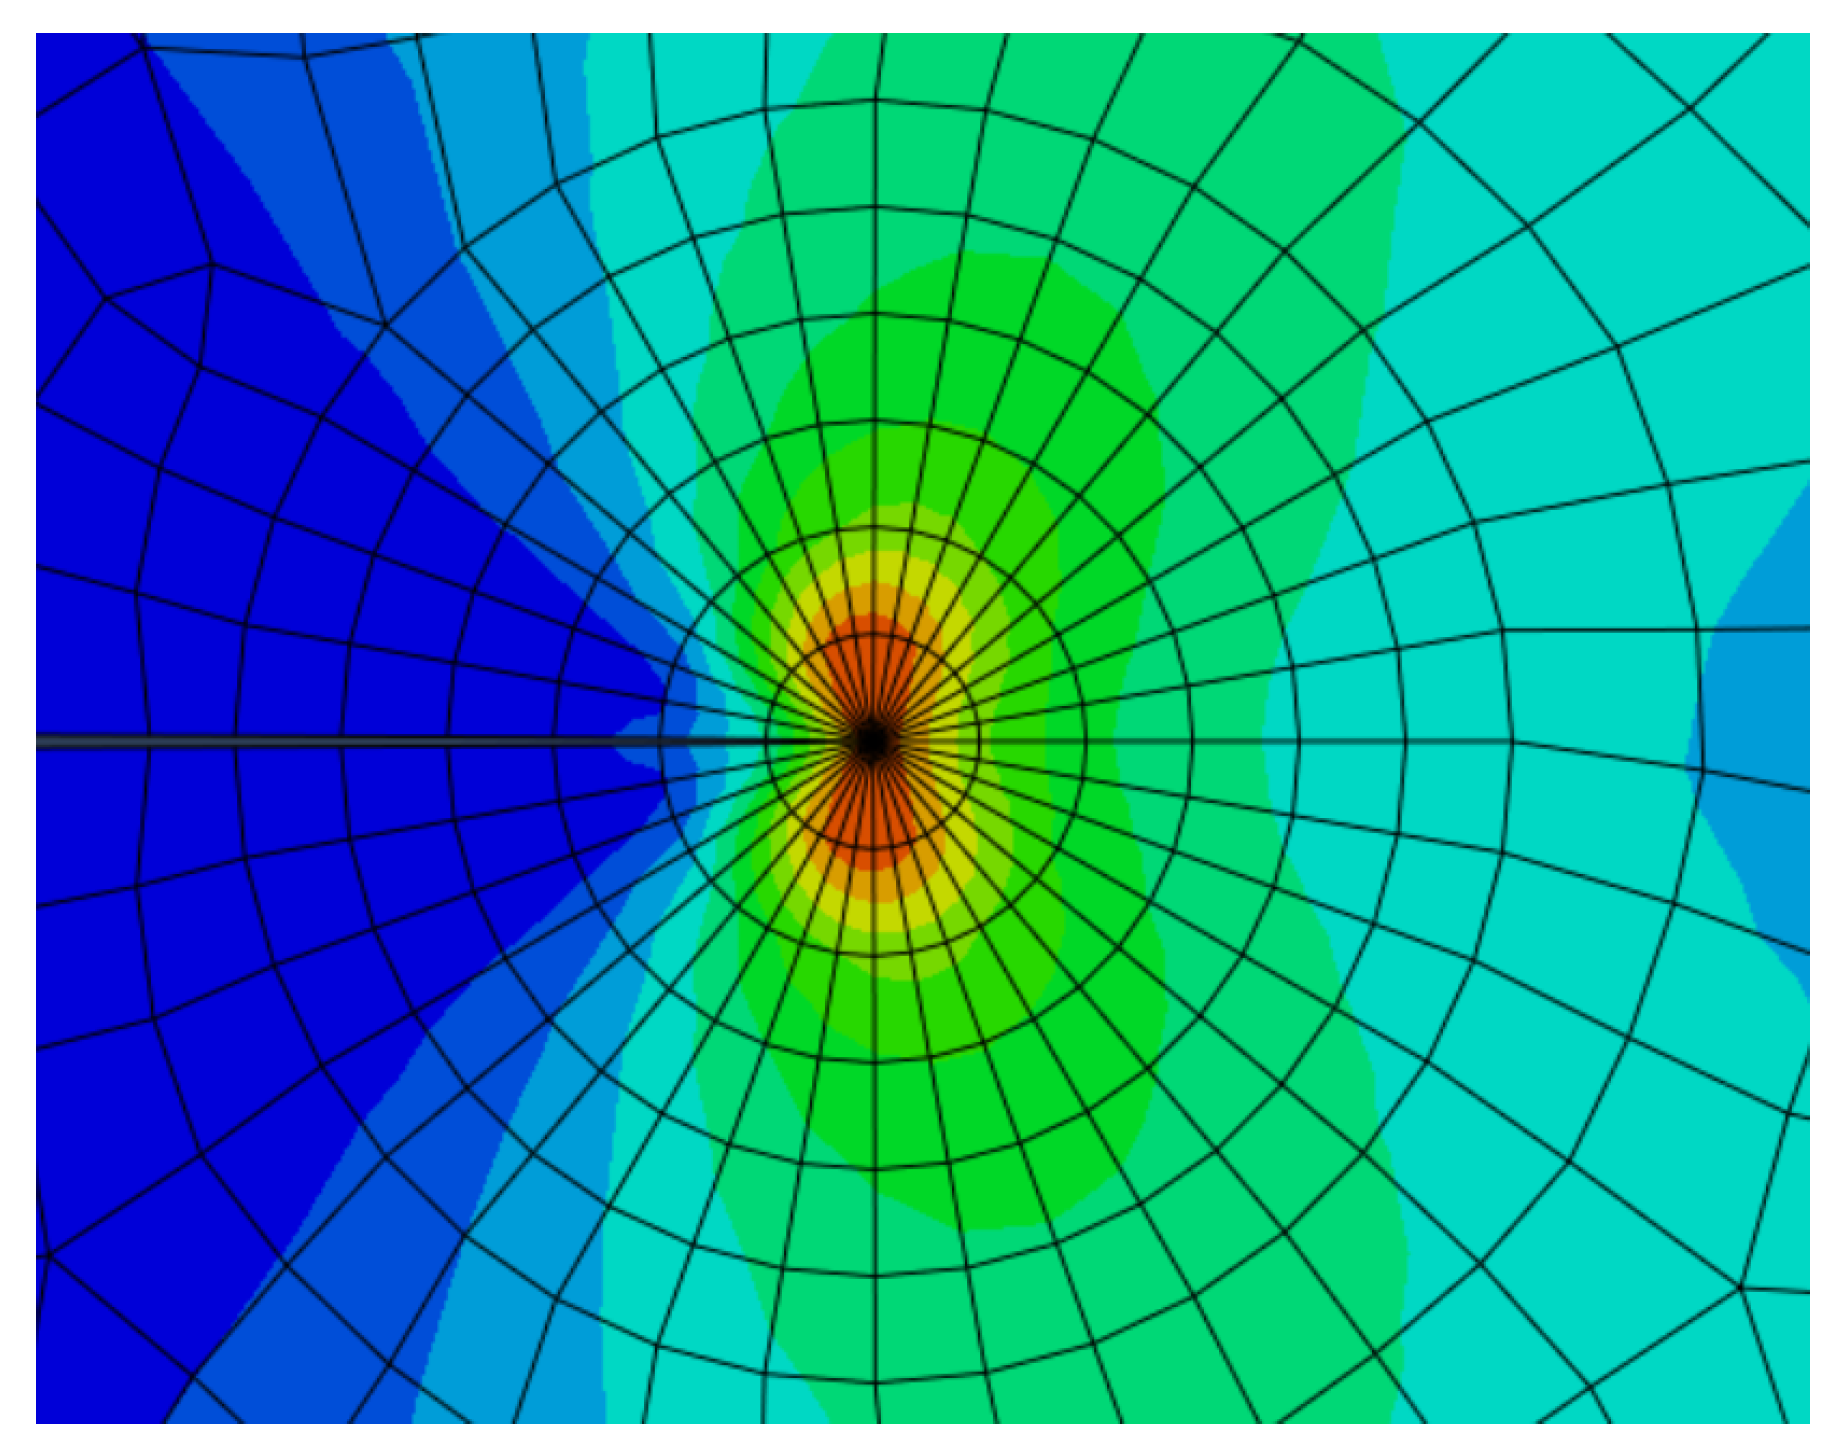
1
College of Mechanical and Electrical Engineering, Jinling Institute of Technology, Nanjing 211169, China
2
College of Aerospace Engineering, Nanjing University of Aeronautics and Astronautics, Nanjing 210016, China
3
China Special Vehicle Research Institute, Jingmen 448000, China
4
Department of Mechanical Engineering, University of Alberta, Edmonton, AB T6G 2R3, Canada
*
Authors to whom correspondence should be addressed.
Modelling 2024, 5(2), 424-437; https://doi.org/10.3390/modelling5020023
Submission received: 18 February 2024 / Revised: 30 March 2024 / Accepted: 1 April 2024 / Published: 4 April 2024

Abstract

:
This study develops a rapid algorithm coupled with the finite element method to predict the fatigue crack propagation process and select the enhancement factor for the equivalent random load spectrum of accelerated fatigue tests. The proposed algorithm is validated by several fatigue tests of an aluminum alloy under the accelerated random load spectra. In the validation process, two kinds of panels with different geometries and sizes are used to calculate the stress intensity factor, critical crack length, and crack propagation life. The simulated and experimental findings indicate that when the aluminum alloy is in a low plasticity state, the crack propagation life exhibits a linear relationship with the acceleration factor. When the aluminum alloy is in a high plasticity state, this study proposes an empirical formula to calculate the equivalent stress intensity factor and crack propagation life. The normalized empirical formula is independent of the geometry and size of different samples, although the fracture processes are different in the two kinds of panels used in our study. Overall, the numerical method proposed in this paper can be applied to predict the fatigue crack propagation life for the random spectrum of large samples based on the results of the simulated accelerated crack propagation process and the accelerated fatigue tests of small samples to reduce the cost and time of the testing.

1. Introduction

As the aerospace industries develop with demands for longer lifespans, higher reliability, and shorter development cycles, accelerated fatigue testing has become integral in full-scale aircraft fatigue testing. This method swiftly evaluates an aircraft’s lifespan and reliability while reducing testing costs. Accelerated fatigue testing offers distinct advantages, such as a clear understanding of fatigue failure mechanisms, straightforward operation, and significant effectiveness. It possesses substantial engineering applicability and economic value. Currently, researchers have conducted experimental, numerical, and theoretical studies on the issue of the load spectrum for accelerated fatigue testing. Many studies have established a solid foundation for applying accelerated fatigue testing to practical engineering structures. Chowdhury et al. [1] applied load spectrum simplification to decrease the number of fatigue cycles in aircraft composite structures for accelerated fatigue testing. This method effectively shortened the testing time and reduced costs. In a separate study, Lu et al. [2] developed a three-tier accelerated load spectrum based on a uniform failure mechanism principle. Utilizing this method, they successfully predicted the fatigue life of a large bogie through accelerated life testing. Zhang et al. [3] conducted crack propagation tests on single-hole wall panel structures made of aluminum alloy, exploring the impact of the load enhancement factor on the crack propagation life. In another study, Zhang [4] executed similar tests on multi-crack structures, employing numerical methods to calculate and analyze the stress intensity factors under enhanced load spectrum and the corresponding variations in crack propagation life. Drawing on the technical essence of load spectrum enhancement and the acceleration principle of fatigue testing, Yan et al. [5] established a technical framework for accelerated fatigue testing on military aircraft metal structures. Additionally, Dong et al. [6] conducted accelerated fatigue tests on the aircraft connection structure, examining the impact of the load enhancement factor on the fatigue life.
Concerning crack propagation under a random load spectrum, researchers [7,8,9] have explored the impacts of different percentages of overload cycles, overload ratios, and sequences of random loading on the life of crack propagation. Huang [10] introduced the notion of an equivalent stress intensity factor corresponding to R = 0 and a modified Wheeler crack growth model. This approach addressed the high-load hysteresis effects caused by overload and the accelerated crack growth resulting from negative overload. Meanwhile, Wang [11] proposed a universal method to predict the fatigue life of smooth circular hole specimens under a random spectrum. This method utilized the crack closure model and the concept of an Equivalent Initial Flaw Size (EIFS). Ishihara [12] investigated the impact of varying R values on the delayed crack growth life under conditions of overload and high load. De [13] conducted numerical analyses of crack propagation under a random load spectrum to examine the thickness effect in a plastic fatigue crack closure. Carlson [14] proposed a mechanism explaining hysteresis following overload, encompassing factors such as residual stress, crack deflection, crack closure, strain hardening, and plastic passivation. Enrico and colleagues [15] examined the effects of crack closure and residual stress on delaying crack propagation by applying various load ratios.
In summary, past research in accelerated fatigue life has predominantly focused on understanding the effects of simplifying random load spectra and implementing constant amplitude load spectrum enhancement on fatigue crack growth life. Research on crack propagation hysteresis under random spectra employs experimental, numerical, and theoretical approaches, particularly on scenarios involving single- and dual-peak overloads. A significant challenge in exploring accelerated fatigue tests with random load spectrum enhancement lies in the uncertainty associated with the stress state, stress ratio, and loading sequence. Typically, empirical or semi-empirical formulas derived from testing do not completely capture the inherent objective laws and may not accurately predict the crack propagation life. Furthermore, the relationship between crack propagation life and random load spectrum enhancement does not simply correlate linearly with the load enhancement factor. Currently, there are a limited amount of studies on the variations in stress intensity factor, critical crack size, and crack propagation life before and after the application of random load spectrum enhancement, and the corresponding relationship between structures with different sizes and constant amplitude load spectrum weighting.
Based on the single-hole crack propagation test with random load spectrum enhancement [16], this paper systematically studies the effects of random load spectrum enhancement on the stress intensity factor, critical crack size, and crack propagation life of wall panel structures with different sizes. We also establish a new empirical model for the random load spectrum enhancement factor. Using our new model, the original spectrum crack growth life of a random load spectrum and large-scale structure can be extrapolated from the weighted data of a small-scale structure with a constant amplitude load spectrum to reduce the cost and time of the test.

2. Random Load Spectrum Enhancement Method

2.1. Crack Propagation Model

In the proposed damage program for enhanced load spectrum analysis presented in this study, the model for crack propagation under a constant amplitude load spectrum employs the Paris model as detailed by Paris et al. [17]. When considering the crack propagation hysteresis under a random load spectrum, the Willenborg–Chang model is employed as referenced by Willenborg et al. [18] and Chang et al. [19]. The Paris formula is simple and widely used. It is more applicable to stage II but cannot describe the effect of stress ratio R on the crack expansion rate. It can only describe the crack expansion characteristics of the intermediate stage for a given stress ratio. Walker’s formula adds the term considering the stress ratio R and the acceleration effect of compressive load based on the Paris formula, which has higher calculation accuracy and a wider range of applications [20]. Both formulas are suitable for transverse alternating loads, i.e., their range of application is limited to the linear class of load spectrum. If there is a high load in the transverse load, the crack expansion will be slowed down or even stagnated, i.e., the high load hysteresis phenomenon. The Willenborg–Chang model is a kind of residual stress model within the range of online elastic fracture mechanics, based on Walker’s formula of crack extension under equal amplitude load and, at the same time, considering the hysteresis effect caused by high load, the acceleration effect produced by the load, and the interaction between the loads, and does not need to determine the hysteresis constants, so it is widely used in engineering. Determining the hysteresis constant by test is unnecessary, so it is widely used in engineering [21].
For a constant amplitude load spectrum, the Paris model is
d a d N = C 1 ( ( 1 R ) K m a x ) n 1
where K m a x is the stress intensity factor corresponding to the peak load of the constant amplitude load spectrum, R is the stress ratio, a is the length of the crack, N is the number of load cycles, and C 1 and n 1 are material constants, respectively.
Crack propagation under a random spectrum can be categorized into two distinct categories. The first category encompasses situations in which variations in the load are negligible, thus diminishing the significance of load interactions. In such instances, crack propagation is quantified using the Paris model. Conversely, the second category pertains to situations characterized by significant fluctuations in load, necessitating the consideration of load interactions. Applying the high-load hysteresis model is appropriate for estimating crack growth for these scenarios. The Willenborg–Chang model, renowned for its straightforward application and high accuracy, is extensively utilized in engineering as a high-load hysteresis model.
This model becomes particularly relevant in the presence of a substantial overload, denoted as σ m a x O L , within the random spectrum (refer to Figure 1). Such an overload leads to the formation of a high-load plastic zone ω O L at the crack tip. After the unloading process, a significant residual compressive stress remains within the plastic zone, whereas residual tensile stress develops in the adjacent elastic zone, resulting in self-balance. Subsequently, when the load reaches the next peak value, a new plastic zone, denoted as ω i , forms at the crack tip. If the cumulative extent of the crack growth, represented by Δ a and ω i , falls within the bounds of the high-load plastic zone ω O L , the residual compressive stress from the high load acts to mitigate the tensile stress. This reduction decreases the amplitude of the effective stress intensity factor and the crack growth rate.
The Willenborg–Chang model is
d a d N = C Z e f f K m a x , e f f n
where
Z e f f = 1 R c u t m R e f f R c u t 1 R e f f m 0 < R e f f < R c u t 1 R e f f q R e f f 0 0 R e f f = 1
where R c u t is the cut-off value of the stress ratio, R e f f is the effective stress ratio, and C, n, m, and q are material constants respectively.
K m a x , e f f = K m a x K r s
where K r s is the residual stress intensity factor,
K r s = Φ K m a x O L 1 Δ a ω O L 1 2 K m a x
where K m a x O L is the maximum stress intensity factor of overload, ω O L is the size of the overload plastic zone, Δ a is the crack growth increment after overload,
R e f f = K m i n K r s / K m a x K r s
Φ = 1 K t h , m a x / K m a x / γ s o 1
where K t h , m a x is the threshold value of stress intensity factor, γ s o is the overload cutoff ratio,
ω O L = 1 π K O L , m a x σ s 2
where σ s is the yield stress,
K t h , m a x = Δ K t h / ( 1 R )
Δ K t h = K t h , 0 / ( 1 R ) η
where Δ K t h , m a x is the threshold value of the stress intensity factor at any R, K t h , 0 is the threshold stress intensity factor at R = 0, and η is the material constant
ω O L , e f f = ( 1 + R e f f ) ω O L
where ω O L , e f f is the effective size of the overload plastic zone.

2.2. Random Load Spectrum Enhancement Method

According to the random spectrum crack propagation model Equation (2), the stress intensity factor is calculated using the following equation:
K m a x , e f f = β σ m a x , e f f π a
In this equation, β is the dimensionless stress intensity factor determined by the structural configuration of the crack, a is the length of the crack, and K m a x , e f f is the effective size of overload plastic zone. Therefore, when the crack propagates from a 0 to a c through N load cycles, by separating the variables in Equation (2), it can be obtained that:
C 0 N Z e f f σ m a x , e f f n d N = a 0 a N β π a n d a
Let:
I = C Z e f f σ m a x , e f f n d N
where I is spectral strength. For a given material ( c , n ) , given a load spectrum block (i.e., Z e f f , including peak stress σ m a x and hysteresis effects caused by load sorting ϕ and number of load cycles N), I is a constant value, reflecting the basic characteristics of the load spectrum and material crack propagation, characterizing the degree of damage caused by the studied load spectrum block to the crack propagation of the component. The larger the I value, the greater the damage caused by the load spectrum block to structural cracks. Let:
1 d = a 0 a N β π a n d a
where d is specific damage, which refers to the amount of damage under a given structural configuration and crack form per unit spectral intensity. It is only related to the structural configuration and crack geometry and is independent of the spectral type. Therefore, Equation (13) can be expressed as
I d = 1
In practical engineering applications, when simplifying or converting the load spectrum of crack propagation tests, d can be set to a constant, which is called the damage equivalence criterion. According to the damage equivalence criterion, for a structure under any given load spectrum, the crack propagates from a 0 to a c through N i load cycles. If the spectrum remains unchanged, the peak and valley values of the load are proportional α enhanced to each other, i.e., the stress ratio R remains constant, and the crack propagates from a 0 to a c after N k load cycles, resulting in
α n 0 N k Z e f f σ m a x , e f f n d N = a 0 N i Z e f f σ m a x , e f f n d N
If a spectral block contains T load cycles, let:
N e n h a n c e m e n t = N k = a T
N o r i g i n a l = N i = b T
If a and b are much larger than 1, then we have:
N e n h a n c e m e n t N o r i g i n a l = a b = α n
where N e n h a n c e m e n t is the life corresponding to the fracture of the structure with the aggravated spectrum load, and N o r i g i n a l is the life corresponding to the fracture of the structure with the original spectrum load. If all peak and valley values in the fatigue crack propagation test load spectrum are increased by an equal proportion of α times before conducting the crack propagation test, the test time can be shortened, and the crack propagation life of the structure under the reference spectrum can be analyzed by Equation (20). If the required test life N is increased, the required load increase factor can also be determined. When Z e f f = 1 R , K m a x , e f f = K m a x , the crack propagation model is a constant amplitude load spectrum, which can be considered a specific case in the random load spectrum. The formula for aggravating the load spectrum is derived similarly.
Based on the above load spectrum enhancement method, the crack propagation program for random load spectrum enhancement is compiled as shown in Figure 2.
(1)
Input load spectrum, weighting factor, fracture material parameters, initial values, etc.
(2)
The weighted load spectrum is scaled up by α factor of equal proportions and then processed by the rainflow method to obtain the weighted load spectrum.
(3)
Finite element simulation and analysis of the structure to obtain the stress intensity factor.
(4)
By the K c fracture toughness criterion for determining whether the crack continues to expand, if it continues to expand, go to the next step; otherwise, terminate the cycle and output the results.
(5)
Determine whether the crack cycle undergoes hysteresis according to if hysteresis is calculated by substituting into the crack hysteresis model; if not, substitute into the Paris grain extension model to calculate the crack extension length increment a calculation, a = a + Δ a , N = N + 1 .
(6)
Repeat Step 3 until the cycle is terminated.
(7)
Output the results, specifically α a c curves, a N curves, and α N e n h a n c e m e n t N o r i g i n a l curves.

3. Creating Calculation Model

3.1. Creating Finite Element Model

This study employs finite element modeling to analyze two different sizes of wall plate structures. The geometric dimensions and loading methods are based on those used in the random spectrum accentuated crack growth test as detailed by Yan et al. [5]. The finite element model is depicted in Figure 3. In the larger wall plate, the loading holes at both ends are specifically designed to distribute the load evenly across the central section. The total number of model cells is 3815, and the cell type is CPS4R. Automatic crack expansion and mesh delineation are realized by writing Python scripts. Based on the Saint Venant principle, the stress distribution around the loading holes predominantly affects the immediate vicinity of the loading area, exerting minimal impact on the stress distribution near the central hole crack. Consequently, the loading holes are omitted in the modeling process. In the case of the smaller panel, loading is applied directly at both ends, with its geometric dimensions remaining constant throughout the modeling phase. The total number of model cells is 1461, and the cell type is CPS4R. automatic crack expansion and mesh delineation is realized by writing python scripts. The lower end of the panel is fixed, and the upper end is loaded with displacement. As the thickness of wall plate is much smaller than the length and width, plane modeling is carried out. Selecting 1/4 singular unit at the crack tip, r / W = 10 5 at the radius of the first layer unit at the crack tip and circumference θ = π / 18 , the unit length increases with the distance from the crack tip as recommended in the literature [22,23] and shown in Figure 3 and Figure 4. The loading and unloading processes are under stress control, and the load spectrum is introduced in Section 3.2.
The two panels are made of LY12-CZ aluminum alloy. The fracture parameters are shown in Table 1. In Table 1, E is Young’s modulus, μ is Poisson’s ratio, and the other parameters are introduced in Section 2. The half-crack length a is the sum of the radius of the hole and the crack size at the edge of the hole. The initial half-crack length a 0 is 5 mm.

3.2. Loading Original Spectrum and Enhanced Spectrum

In this paper, based on the fracture test of large and small wall plate [25,26], the stress intensity calculation, critical crack and crack extension analyses under constant amplitude spectrum and random spectrum are carried out, the load spectrum used in the simulation analysis is the experimental spectrum, and the weighting coefficients are selected by following the guideline of consistency of the main damage site and damage mode, the criterion of damage equivalence, and the criterion of the finite objective.
For the constant amplitude spectrum, the maximum stress is 56.72 MPa, the stress ratio R is 0.074, and the weighting factors are 1.2, 1.3, and 1.4 as recommended in the literature [27].
For the original spectrum of random load spectrum as shown in Figure 5, a program block has 6405 peaks and valleys, maximum stress 119.36 MPa, minimum stress 1.26 MPa, and aggravation factors 1.06, 1.1, 1.15, and 1.2 as recommended in the literature [27].

3.3. Finite Element Model Validation

In order to verify the finite element model, the random spectrum crack propagation life of large and small wall panels is simulated and compared with the test results as shown in Figure 6. The error between the numerical simulation results and the experimental average value is within 10%. Therefore, the modeling method and parameters applied by the program are accurate and can well predict the random spectrum crack propagation life.

4. Analysis and Discussion

4.1. Stress Intensity Factor

The stress intensity factor is used to characterize the stress field at the crack tip. It is an important parameter for crack propagation life and enhancement analysis. For large and small wall panels, the stress intensity factor K is calculated by the following equation:
K = β P B W π · a
where B and W are the thickness and width of the wall panel, P is the applied load, a is the half crack length, and β is the geometric influence factor.
The comparison of the regularized stress intensity factor ( K / K C ) from the finite element and formula calculation is shown in Figure 7. The results show that when the half-crack length is less than 8 mm, the finite element and formula calculations for large and small wall plates have good consistency with an error of 10% or less, which verifies the correctness of the finite element calculation method; when it is greater than 8 mm, because the stress intensity factor formula calculation does not take into account the boundary effect of the finite plate, the formula calculation value is relatively conservative, and the longer the crack, the larger the error. As the crack length increases, the stress intensity factor of small wall panels grows faster and has a larger value than that of large wall panels. This is because when the crack length is relatively large, the boundary constraints of width and height have a greater impact on the stress at the crack tip for small wall panels. As the crack length increases, the stress intensity factor increases as shown in Figure 8. Therefore, the application of finite element for stress intensity factor calculation has a higher calculation accuracy, which can provide a data basis for the random load spectrum aggravation program.

4.2. Critical Crack Length

In the residual strength analysis of the structure, the fracture toughness criterion is used as a damage criterion
K = K c
where K c is the fracture toughness. The expression for the stress intensity factor is
K = β σ π a
where β is the geometric influence factor. At a fracture toughness of K c , the critical crack size a c at structural damage is
a c = 1 π K c β σ c 2
where σ c is the stress of structural failure.
When structural failure occurs, the stress intensity factor reaches its critical value K c , and the corresponding critical crack length is denoted as a c . This condition satisfies the established failure criterion, marking the completion of the calculation for crack propagation and damage program under an enhanced load spectrum. Utilizing the methodologies outlined in Section 3.2 for constant amplitude and random spectrum loading, the critical crack lengths for the original spectra of both large and small wall panels are calculated. These calculations consider varying enhancement coefficients. The results are then presented in a normalized α a c / W curve as illustrated in Figure 9.
For the constant amplitude spectrum, the a c calculated by the crack extension and aggravation procedure for the small wall plate coincides with the experimental values; with the increase in the aggravation factor for the loading spectrum, the regularized critical crack size of both the large and small wall plates becomes smaller; under the same loading and aggravation factor, the regularized critical crack size of the large wall plate is smaller than the critical crack size of the small wall plate, and the rate of decrease of the critical crack size of the large wall plate is relatively fast due to the fact that, as shown in Figure 8, with the increase in the crack length, for the same crack length, the stress intensity of the large wall plate grows more slowly, the stress intensity factor is smaller, and the critical crack length is larger, but the ratio of the critical crack length to width, i.e., the regularized critical crack length, is smaller.
For the random spectrum, similar to the law for the constant amplitude spectrum, the regularized critical crack size of both large and small wall plates becomes smaller with the increase of the weighting factor of the loading spectrum; under the same loading and weighting factor, the regularized critical crack size of the large wall plate is smaller than the critical crack size of the small wall plate, and the critical crack size of the large wall plate decreases at a relatively fast rate.

4.3. Prediction of Original Spectrum Life and Selection of Enhancement Factor

Applying the random spectrum aggravated damage program, we input the above mentioned constant amplitude spectrum and random spectrum loading and aggravation coefficients, and the stress intensity factor calculated by the finite element. The crack extension life N corresponding to the critical crack size under the original spectrum of the large and small wall plate and different aggravation coefficients are calculated. N o r i g i n a l is the life corresponding to the fracture of the structure with the original spectrum load, N e n h a n c e m e n t is the life corresponding to the fracture of the structure with the aggravated spectrum load, and N e n h a n c e m e n t / N o r i g i n a l is the spectrum ratio. N e n h a n c e m e n t / N o r i g i n a l ratio and the α N e n h a n c e m e n t / N o r i g i n a l spectrum ratio curve is plotted as shown in Figure 10. The results show that when the enhancement factor is less than 1.25, the N e n h a n c e m e n t / N o r i g i n a l ratio coincides with different spectral types and sizes with the increase in the enhancement factor.The fitting formula is
N e n h a n c e m e n t N o r i g i n a l = 6.94917 8.91763 α + 2.97061 α 2
The error δ is
δ = N f o r m u l a N p r o g r a m N p r o g r a m
where N f o r m u l a is the life corresponding to the fracture of the structure with the formula spectrum load, and N p r o g r a m is the life corresponding to the fracture of the structure with the program spectrum load. When the enhancement factor is 1.25, the maximum error is
δ 1.25 , m a x = m a x ( N 1.25 N 1.25 N 1.25 ) = 0.4437 0.50035 0.50035 = 11 %
When the enhancement factor is less than 1.25, a maximum error of 11%, the error meets the scope of the engineering application. Therefore, the crack growth life of the original spectrum can be quickly predicted by Equation (20), and the enhancement factor can be quickly selected by shortening the time of the accelerated fatigue test. In addition, when the enhancement factor is less than 1.25, the relationship between the load spectrum enhancement factor α and the fatigue life accelerated ratio N e n h a n c e m e n t / N o r i g i n a l is consistent under the two different kinds of spectra and specimens investigated in the current study. This conclusion holds significant applicability in life prediction for the original spectrum and determining the appropriate enhancement factor for the load spectrum. Additionally, it can be utilized in computing the constant amplitude spectrum for smaller samples and extrapolating test results. This approach facilitates the prediction of necessary parameters for the random spectrum of larger samples, thereby reducing the cost and duration of testing.

5. Conclusions

Drawing upon the accelerated crack propagation test under an enhanced random load spectrum, this paper conducts a study through numerical modeling analysis and calculations using the random load spectrum damage program. This research focuses on the stress intensity factor, the critical crack length, life prediction, and the selection of load spectrum enhancement factors for both large and small panel structures. The study culminates in the following key conclusions:
  • The numerical modeling for the two different panels is carried out, and the crack propagation life of the original spectrum is calculated and verified with the experimental results. The results show that the numerical model can predict crack growth life conservatively. On this basis, the stress intensity factor of the small and large wall plates is calculated; with the increase in crack length, the stress intensity factor of the small wall plate is larger than the value of the large wall plate at the same crack length, and the stress intensity factor calculation by the finite element can provide technical support for the aggravation program of the random load spectrum.
  • For the constant amplitude spectrum, the critical crack length calculated by the crack extension aggravation procedure of the small wall plate coincides with the test value: with the increase in the aggravation coefficient of the load spectrum, the regularized critical crack sizes of the large and small wall plates become smaller; under the same loading and aggravation coefficients, the regularized critical crack size of the large wall plate is smaller than the critical crack size of the small wall plate; for the random load spectrum, the rule of change of the aggravated critical crack length is similar to that of the constant amplitude spectrum.
  • For a flat plate center opening structure similar to the one in this paper, under different spectral loading and different sample sizes, when the enhancement factor is less than 1.25 (corresponding to the maximum error 11% in Equation (27)), with the increase in the enhancement factor of the load spectrum, the fatigue life accelerated ratio, N e n h a n c e m e n t / N o r i g i n a l tends to be consistent after normalization, which can be combined into a formula. According to this conclusion, we can quickly predict the crack growth life of the original spectrum or shorten the time of the known fatigue accelerated test and select the enhancement factor. It can also be applied to calculating the constant amplitude spectrum of small samples and the test results to predict the relevant parameters required by the random spectrum of large samples, reducing the cost and time of the test.

Author Contributions

Conceptualization, F.W., J.Z. (Jie Zheng) and M.T.; methodology, F.W., J.Z. (Jie Zheng) and K.L.; software, F.W., J.Z. (Jie Zheng) and K.L.; validation, F.W., J.Z. (Jie Zheng) and K.L.; formal analysis, F.W.; investigation, F.W.; resources, M.T.; data curation, F.W.; writing—original draft preparation, F.W. and J.Z. (Jie Zheng); writing—review and editing, F.W., J.Z. (Jie Zheng) and K.L.; visualization, F.W., J.Z. (Jie Zheng) and K.L.; supervision, M.T. and J.Z. (Jinyu Zhou); project administration, M.T. and J.Z. (Jinyu Zhou); funding acquisition, M.T. All authors have read and agreed to the published version of the manuscript.

Funding

This research was funded by the Aeronautical Science Foundation of China (No. 20182352015, 201928052009, 20230009052004 and 20230023052001). This research was supported by research on xxx-110 hydraulic pressure energy storage technology of a basic research project.

Data Availability Statement

The data presented in this study are available on request from the corresponding author.

Acknowledgments

The authors gratefully acknowledge the editors and reviewers for their careful work and thoughtful suggestions, which helped to improve this paper substantially.

Conflicts of Interest

The authors declare no conflicts of interest.

References

  1. Chowdhury, N.M.; Wang, J.; Chiu, W.K. Fatigue spectra simplification approaches for accelerated testing in composite aircraft structures. In Proceedings of the 9th Australasian Congress on Applied Mechanics, Sydney, Australia, 27–29 November 2017; pp. 121–129. [Google Scholar]
  2. Zhu, L.; Jia, M. Estimation study of structure crack propagation under random load based on multiple factors correction. J. Braz. Soc. Mech. Sci. Eng. 2017, 39, 681–693. [Google Scholar] [CrossRef]
  3. Zhang, K.; Yan, W.W.; Chen, L. The effect of Load Spectrum Enhancement on the fatigue crack propagation life. J. Mech. Strength 2014, 2, 280–284. [Google Scholar]
  4. Zhang, W.D. Research on Load Spectrum Enhancement of Wide Spread Fatigue Damage of Aircraft Structure; Aircraft Strength Research Institute: Shenzhen, China, 2014. [Google Scholar]
  5. Yan, W.W.; Li, Y.B.; Dong, D.K. A method for increasing the load spectrum of typical structural fatigue test of military aircraft. J. Struct. Strength Study 2015, 1, 1–3. [Google Scholar]
  6. Dong, D.K.; Li, Y.B.; Chen, X.M. Research on the relationship between load enhancement factor and fatigue life. J. Mech. Strength 2013, 4, 488–492. [Google Scholar]
  7. Vasco-Olmo, J.M.; Diaz, F.A.; Patterson, E.A. Experimental evaluation of shielding effect on growing fatigue cracks under overloads using ESPI. Int. J. Fatigue 2016, 83, 117–126. [Google Scholar] [CrossRef]
  8. Lu, Z.; Liu, Y. Experimental investigation of random loading sequence effect on fatigue crack growth. Mater. Des. 2011, 32, 4773–4785. [Google Scholar] [CrossRef]
  9. Borrege, L.P.; Ferreira, J.M.; Pinho da Cruz, J.M.; Costa, J.M. Evaluation of overload effects on fatigue crack growth and closure. Eng. Fract. Mech. 2003, 70, 1379–1397. [Google Scholar] [CrossRef]
  10. Huang, X.P.; Torgeir, M.; Cui, W. An engineering model of fatigue crack growth under variable amplitude loading. Int. J. Fatigue 2007, 30, 2–10. [Google Scholar] [CrossRef]
  11. Wang, Q.; Zhang, W.; Jiang, S. Fatigue life prediction based on crack closure and equivalent initial flaw size. Materials 2015, 8, 7145–7160. [Google Scholar] [CrossRef] [PubMed]
  12. Ishihara, S.; McEvily, A.J.; Goshima, T.; Nishino, S.; Sato, M. The effect of the R value on the number of delay cycles following an overload. Int. J. Fatigue 2008, 30, 1737–1742. [Google Scholar] [CrossRef]
  13. De Matos, P.F.P.; Nowell, D. Experimental and numerical investigation of thickness effects in plasticity-induced fatigue crack closure. Int. J. Fatigue 2009, 31, 1795–1840. [Google Scholar] [CrossRef]
  14. Carlson, R.L.; Kardomateas, G.A.; Bates, P.R. The effects of overloads in fatigue crack growth. Int. J. Fatigue 1991, 13, 453–460. [Google Scholar] [CrossRef]
  15. Enrico, S.; Zhang, H.J.; Fong, K.S.; Song, X.; Alexander, M.K. Separating plasticity-induced closure and residual stress contributions to fatigue crack retardation following an overload. J. Mech. Phys. Solids 2017, 98, 222–235. [Google Scholar]
  16. Wang, F.L. Study of the Fatigue/Damage Load Spectrum Enhancement of the Aircraft’s Metal Structure; Nanjing University of Aeronautics and Astronautics: Nanjing, China, 2015. [Google Scholar]
  17. Paris, P.; Erdogan, F. A critical analysis of crack propagation laws. ASM Trans. J. Basic Eng. 1963, 85, 528–534. [Google Scholar] [CrossRef]
  18. Willenborg, J.; Engle, R.M.; Wood, H.A. A Crack Growth Retardation Model Using an Effective Stress Concept. AFFEL-TM-7-1-IEER. 1971. Available online: https://api.semanticscholar.org/CorpusID:135785790 (accessed on 17 February 2024).
  19. Chang, J.B.; Engle, R.M.; Szamossi, M. An Improved Methodology for Predicting Rangom Spectrum Loading Interaction Effects on Fatigue Crack Growth. Adv. Fract. Res. 1982, 2761–2769. [Google Scholar] [CrossRef]
  20. Yin, Z.P. Structural Fatigue and Fracture; Northwestern Polytechnical University Press: Xi’an, China, 2012. [Google Scholar]
  21. Sun, X.S. Guidelines for Design and Verification of Strength and Stiffness of Civil Aircraft Structures; Aviation Industry Press: Beijing, China, 2012. [Google Scholar]
  22. Zhao, J.H. Three-Parameter Research on Three-Dimensional Fracture for Macrostructures; Nanjing University of Aeronautics and Astronautics: Nanjing, China, 2008. [Google Scholar]
  23. Wang, F.L.; She, C.M.; Guo, W.L. Numerical analysis of three-dimensional I/II mixed-mode elastic-plastic fracture of aeronautical structural aluminum alloy. Chin. J. Comput. Mech. 2011, 28, 255–259. [Google Scholar]
  24. Liu, K.; Wang, F.; Pan, W.; Yang, L.; Bai, S.; Zhu, Q.; Tong, M. Probability Analysis of Widespread Fatigue Damage in LY12-CZ Aluminum Alloy Single-Row Seven-Hole Plate. Aerospace 2022, 9, 215. [Google Scholar] [CrossRef]
  25. Wang, F.L.; Tong, M.B.; Wang, H.H. Numerical Analysis on Load Spectrum Enhancement of Wide spread Fatigue Damage in Aluminum Alloy Panel. J. Nanjing Univ. Aeronaut. Astronaut. 2013, 45, 28–33. [Google Scholar]
  26. Wang, F.L.; Zhu, S.H.; Tong, M.B. Numerical analysis on Crack Propagation Order of Wide spread Damage in Aluminum Alloy Panel. Aeronaut. Comput. Tech. 2011, 44, 66–69. [Google Scholar]
  27. Zhang, H.Y.; Niu, Z.Q.; Dong, D.K. Research on Load Enhancement Method for Fatigue Crack Grown Test. Eng. Mech. 2015, 32, 236. [Google Scholar]
Figure 1. The diagram of Willenborg–Chang crack model with a random load spectrum. The crack with full lines is the old crack with a length of a O L , and the dash line crack is a new one with a length of a O L + Δ a .
Modelling 05 00023 g001
Figure 2. Flow chart of random load spectrum crack growth enforcement calculation program.
Modelling 05 00023 g002
Figure 3. (a) Small wall panel, (b) big wall panel. The yellow lines highlight the mesh layers drawn at the crack tip, r is the radius size of the first layer of the mesh, and θ is the angle size of the mesh divided around the front of the crack.
Modelling 05 00023 g003
Figure 4. Crack tip finite element stress.
Modelling 05 00023 g004
Figure 5. Crack propagation spectrum under random load.
Modelling 05 00023 g005
Figure 6. (a) Load spectrum a N curve of small wall panel. (b) Load spectrum a N curve of big wall panel.
Modelling 05 00023 g006
Figure 7. a K curve with different calculation methods.
Modelling 05 00023 g007
Figure 8. a K / K c curves with differnt enhancement factors of (a) small wall panel and (b) big wall panel.
Modelling 05 00023 g008
Figure 9. (a) Constant amplitude spectrum enhanced regularized α a c curve. (b) Random amplitude spectrum enhanced regularized α a c curve.
Modelling 05 00023 g009
Figure 10. Load spectrum enhancement α N e n h a n c e m e n t / N o r i g i n a l original spectrum curves.
Modelling 05 00023 g010
Table 1. Fracture parameters of LY12-CZ material [3,24].
E μ K c σ S Cnm
6.8 × 10 10 (Pa)0.33100 (Mpa m )336.9 (MPa)3.29 × 10 11 3.460.56
q R cut K th 0 η γ s o C 1 n 1
0.130.752.73 (Mpa m )0.462.41.43  × 10 10 3.302
Disclaimer/Publisher’s Note: The statements, opinions and data contained in all publications are solely those of the individual author(s) and contributor(s) and not of MDPI and/or the editor(s). MDPI and/or the editor(s) disclaim responsibility for any injury to people or property resulting from any ideas, methods, instructions or products referred to in the content.

