Abstract
Enterprises today face an increasing need for seamless data exchange across various information systems, both internally and with their partners. Addressing challenges in information system and data interoperability is essential. Unfortunately, this issue is often underrecognized by many stakeholders, leading to time wasted on non-value-added tasks and a significant decline in data quality. Our contribution comprises two essential components. Firstly, we introduce and implement extensions to BPMN 2.0 to visually represent data exchanges that encounter interoperability issues as well as those successfully resolved. These extensions also provide performance metrics such as cost, duration, quality, and data availability for tasks affected by these exchanges. By doing so, they gauge the extent of the interoperability challenge and underscore the need to address it for all stakeholders within the enterprise. Secondly, we propose a method derived from FMECA, enabling users to meticulously examine each exchanged piece of data and compute its criticality. This approach empowers the prioritization of corrective actions to enhance data quality, establishing a continuous improvement process that ensures optimal data quality over time.
1. Problem Statement
In today’s highly competitive global economic landscape, companies face tremendous pressure to establish and maintain highly efficient information systems. These systems correspond to the information system, and their components are the exchanged documents and each of the data inside. However, the full-scale implementation of an integrated system, such as an ERP tailored to encompass all the unique intricacies of a company, is occasionally deemed impractical. This can be due to the absence of suitable tools or the presence of tools that are overly complex and prohibitively expensive to acquire and implement. Consequently, this leads to the integration of one or more modules or external systems into the existing framework, giving rise to the critical issue of data interoperability.
The concept of interoperability often remains nebulous or insufficiently recognized by many stakeholders within a company. This lack of clarity tends to relegate the resolution of this problem to a secondary or nonurgent objective, particularly in small and medium-sized enterprises (SMEs) that may lack a dedicated IT department.
Understanding the full extent of the interoperability challenge requires quantifying its repercussions with the use of performance indicators. Therefore, it becomes imperative to incorporate performance metrics that vividly illustrate the impact in a manner accessible to all.
One common definition of interoperability states that it represents “the ability of two or more systems or components to exchange information and to use the information that has been exchanged” [1]. The InterOp NoE (Interoperability Research for Networked Enterprise Application and Software) Network of Excellence defines interoperability as “the ability of an information system or product to work with other systems or products without special effort on the part of the customer or user” [2]. The EIF (Enterprise Interoperability Framework) [3] proposes considering interoperability at four different levels: activities, processes, services, and data. This article specifically addresses the data level.
To solve the interoperability problem, the first step must be identifying the problem. Business process modeling is an effective tool for representing information systems and interoperability problems. It offers the possibility of graphically describing business practices in different ways, highlighting the problems underlying current operations. However, the representation of interoperability is often absent in most modeling languages, a shortcoming discussed in this paper.
Identifying interoperability is not enough. To fully appreciate the lack of interoperability problem, it is essential to quantify the consequences using performance indicators. Again, indicators are often absent in high-level business models intended to visualize processes nontechnically for all project stakeholders, not just experts.
Establishing interoperability is a fundamental step towards optimal data quality between different information systems, but it is not a final objective. If data has a quality defect before it is exchanged, this defect will remain after being transferred to the target information system. Therefore, it is necessary to complement the introduction of data interoperability with actions aimed at improving data quality. This document aims to characterize and visualize interoperability problems in the business process, measure the performance of activities and business processes using simulation and aggregation formulas, and ensure the quality of interoperable data in business processes.
The next section will present a state-of-the-art overview of modeling languages and performance assessment methods to select existing languages and methods that will help solve interoperability problems. Subsequently, the proposed method will be presented, allowing the representation of interoperability problems, the evaluation of interoperability performance, and the improvement of data quality. The last part of this paper will be dedicated to the presentation of a real case study in the agrifood industry to illustrate the method and its benefits for the company.
2. Literature Review
This literature review focuses on modeling languages and performance evaluation techniques crucial for selecting suitable languages and methods to address interoperability issues. The review is organized into two distinct segments.
The first section explores various modeling languages and performance assessment methods, essential for constructing models to address interoperability challenges. The subsequent part redirects its focus toward methodologies designed to improve data quality.
2.1. Modeling and Performance Measurement
The objective is to select a modeling language that strikes a balance between robust functionality and user-friendliness, ensuring comprehensibility for all stakeholders. It should facilitate a clear depiction of data exchanges and interoperability nodes while also enabling the construction of models from a behavioral perspective. This final requirement opens the door to contemplating the potential execution of these models.
This section scrutinizes the research and propositions put forth by stakeholders in their endeavor to bolster data exchange quality and enhance interoperability using the BPMN tool. Like any other methodology, BPMN often serves to visually represent business processes, refining the operational endeavors of a company. Within these organizations, decision-makers are frequently confronted with a rapid pace of technological evolution, compounded by evolving customer demands. This necessitates an ongoing process of submission and adaptation of internal solutions and approaches to ensure continued relevance.
In this dynamic landscape, interoperability has now emerged as a pivotal facet in processes, allowing for the seamless access and utilization of a company’s data, often presented in disparate formats and utilized by various applications as mentioned previously in [1].
Ref. [4] proposed a model-oriented approach utilizing an intermediate BPMN 2.0 model derived from high-level business process modeling based on industrial partner requirements. This approach aims to implement a solution on an ESB, enabling small and medium enterprises (SMEs) to adopt an interoperable collaborative architecture, facilitating the definition of domain process interfaces. Ref. [5] and others have also endeavored to enhance interoperability between various vendor implementations. Their research primarily focuses on domains such as supply chain management (SCM), customer relationship management (CRM), enterprise resource planning (ERP), and electronic commerce (E-commerce).
Efforts were made in these studies to modify XML process model definitions to enable the sharing of process models between tools, identifying gaps and proposing solutions to facilitate model exchange. Additionally, ref. [6] emphasized the importance of data quality in BPMN modeling and extended BPMN to incorporate data quality requirements in business process models. Similarly, ref. [7] introduced a methodology allowing business professionals to highlight issues related to data elements in BPMN models.
In terms of performance and process steering methodologies, various approaches such as dashboard [8], Balanced Scorecard [9], OVAR [10], GIMSI [10], PRISM [11], and ABC/ABM/ABB [12] have been proposed for overall company performance. However, when addressing a specific localized problem, implementing one of these methods involves a comprehensive analysis and represents a more global methodology.
Furthermore, ref. [13] explored the suitability of BPMN for representing blockchain-based solutions, noting that BPMN is one of the most extensive and widely applied business process modeling techniques.
The table below provides detailed insights into the modeling languages and tools considered in this study, revealing that none of them explicitly addresses interoperability representation. The languages examined include BPMN [14]. ARIS as toolbox [15] was originally integrating a dedicated business process modeling language and it is now based on BPMN, IDEF [16], GRAI [17], and CIMOSA [18]. Table 1 outlines the features defined as prerequisites for each language, particularly focusing on the “Data Representation” column, which categorizes values as “Obvious”, “Intermediate”, or “Not obvious” in the context of model visualization by nonspecialist audiences.

Table 1.
Synthesis of modeling languages.
Firstly, it is worth noting that all the languages examined operate at a high level, yet none of them directly address interoperability representation. Furthermore, when it comes to data representation, BPMN 2.0 stands out for its intuitive depiction of exchanged data using specific icons. However, in the cases of IDEF0 and GRAI models, while an attentive audience can discern the data involved in the process, the same representations have been employed for other types of elements (such as constraints), potentially leading to confusion. Therefore, we assigned them an “Average” rating. In the case of ARIS, the separation of data from processes, represented on an entity-association model, may not be easily digestible for a nontechnical audience. Similarly, CIMOSA’s representation via objects and views of objects may not be the most suitable for our scenario.
In terms of building models from a behavioral perspective, only BPMN 2.0 and ARIS meet this criterion.
Existing performance measurement methodologies are designed to monitor the performance of an entire company in pursuit of its overarching objectives. Consequently, their associated implementation methods necessitate a comprehensive analysis of all facets of the company. However, in our case, the goal is to address a specific localized problem, making the implementation of these methods complex and indicative of a more global approach. Consequently, none of them aligns with our specific needs.
In light of this literature review, the decision was made to enhance the BPMN 2.0 modeling language to facilitate the creation of appropriate models for resolving interoperability issues. This choice stems from the fact that BPMN 2.0 is a high-level language, accessible to audiences of all backgrounds, and it enables the clear representation of data exchanges and the construction of models from a behavioral perspective. Additionally, it possesses an extension mechanism, allowing for the incorporation of extensions that not only represent interoperability in the models but also display performance metrics for tasks involved in these data exchanges.
2.2. Data Quality Management Method
After a thorough examination of modeling languages and performance measurement methods, the review encompasses an evaluation of methodologies for managing data quality to ascertain their potential relevance to this research.
TDQM (total data quality management) has its roots in academic research and stands as a foundational reference for numerous approaches. This method aligns data quality with the principles of total quality management (TQM) by drawing parallels between data production and the manufacturing of physical products [19]. To comprehensively grasp the data production process, TDQM proposes a description language of information production processes (IP), known as IP-MAP [20], which has become a de facto standard.
TDQM follows a continuous improvement process consisting of four phases:
- Definition: The organization must articulate a clear definition of what it means by data quality and determine the dimensions of data quality relevant to its objectives.
- Measurement: Measure quality values to compare them against objectives.
- Analysis: Identify the roots of quality problems and study their relationships.
- Improvement: Design and implement actions to enhance data quality.
The AIMQ methodology stands out as the sole information quality methodology focused on benchmarking [21] and unfolds in two stages:
Firstly, quality dimensions are classified using the PSP/IQ method as outlined in Table 2. Subsequently, the focus shifts to quality measurement, accomplished through questionnaires. The initial questionnaire is employed to identify relevant dimensions and quality attributes for reference. The second questionnaire addresses previously identified dimensions and attributes to obtain IQ measurements. Ultimately, these measures are compared against established benchmarks.
Table 2.
The PSP/IQ model.
In the subsequent step, these measures are compared to the organization’s standards based on best practices, and improvement measures are deduced.
TIQM emphasizes the significance of information quality in reducing costs and increasing profits within management models [22]. The methodology envisions consolidating operational data sources into a single, integrated database, involving management activities responsible for this integration. TIQM unfolds in three phases:
- Assessment: Identifying stakeholders, measuring and interpreting data quality, evaluating costs of nonquality, and assessing benefits of improvement.
- Improvement: Identifying error causes, defining improvements for data and processes, and redefining processes.
- Improvement management and monitoring: Conducting customer satisfaction surveys, executing small-scale pilot projects, defining information stewardship, analyzing systematic barriers to data quality, recommending changes, and establishing a regular communication mechanism with managers.
DQA, recognized as one of the most widely used methodologies globally, provides general principles for defining data quality measures. This approach combines subjective (perceptions, needs, and experiences of stakeholders) and objective assessments of data quality [23], progressing through three steps:
- Subjective and objective assessments: Evaluate the quality of data from both subjective and objective perspectives.
- Comparative analysis: Compare assessment results, identify discrepancies, and determine root causes.
- Improvement steps: Determine and implement necessary steps for improvement.
While these methodologies are widely employed, they are tailored for managing the quality of data across entire organizations rather than focusing on specific enterprise subsets. Consequently, their implementation can be resource-intensive. However, their constructive contributions form the basis of our method, as they all share common major steps for quality management: observation, identification of improvement points, and proposing improvements.
2.3. Data Interoperability
Data interoperability involves ensuring that data can be understood, interpreted, and processed consistently across heterogeneous environments. Achieving data interoperability is essential for enabling effective communication, collaboration, and integration between diverse systems and stakeholders. It involves addressing challenges related to data formats, structures, semantics, and standards to facilitate seamless data exchange and interoperable operations. Robust data interoperability frameworks and standards play a crucial role in supporting data-driven decision making, innovation, and digital transformation initiatives across various domains. Data interoperability includes the identification, evaluation, and resolution.
Semantic interoperability, as one recent approach to data interoperability resolution [24], is essential for seamless data exchange and understanding across diverse systems. Recent studies underscore its significance in healthcare, smart cities, and Industry 4.0. For instance, research by [25] highlights its role in improving patient care by facilitating the exchange of medical data among healthcare providers. Similarly, in smart city applications, semantic interoperability optimizes urban services and resource utilization [26]. In Industry 4.0, it enables data integration across the manufacturing value chain, enhancing decision making and automation. Overall, semantic interoperability is crucial for overcoming data silos and ensuring effective data-driven operations. In our case, we focus more on the first steps that consist of identification and evaluation.
To formalize data interoperability for identification and evaluation, in most process modeling languages, including BPMN, interoperability challenges are typically not explicitly represented as standalone concepts. Instead, they are often implicitly addressed within the context of the process model. While interoperability challenges may not be explicitly represented as standalone elements within the process model, process analysts and designers can identify and address them by considering the various aspects of integration, data exchange, and system interactions depicted in the model.
The current graphical representations, like communication events between pools in BPMN notation, are inadequate for effectively depicting interoperability. They lack the necessary detail to convey essential aspects such as data formats and semantic mappings. Future research should focus on developing more comprehensive visual languages or extensions to address this gap. Therefore, there is a need for specialized notations, extensions, or documentation to be used to document interoperability requirements, constraints, or solutions explicitly within the context of the process model.
Based on this comprehensive review and recognizing certain limitations, we have decided to develop our own method for managing data quality and interoperability, a concept that will be expounded upon in the subsequent chapter.
3. Methodology for Data Quality and Interoperability
3.1. General Methodology
Recognizing the identified shortcomings, it became imperative to enhance an existing modeling language to effectively address interoperability challenges at the information system level. However, this is necessary to consider business process modeling in order to track interoperability problems even if these problems will be solved at the information system level. After careful consideration, we opted for BPMN 2.0 due to its high-level nature, making it comprehensible to a diverse audience, and its capacity to capture information system processes. Moreover, BPMN 2.0 facilitates clear representation of data exchanges and features an extension mechanism that allows us to integrate interoperability aspects into models, as well as display performance measures for the tasks involved.
The performance areas are crucial to depict in the models and encompass cost, time, quality, and availability. While the first three are conventional and are integral to most performance indicator systems, showcasing availability holds paramount importance. According to AFNOR, availability is defined as the equipment’s capacity to perform a required function under given conditions of use, at a specified time or during a designated time interval, assuming the provision of necessary external means [27]. Transposed to the data domain, this definition simplifies availability as meeting the requirement to deliver the right data at the right time, precisely when it is needed in a process or decision-making context. While establishing interoperability is imperative, it is not an end in itself; rather, it serves to ensure that the necessary data for a process is present without imposing additional workload on the recipient. Therefore, established interoperability hinges on data availability. Furthermore, the question of data quality for unavailable data is moot: if the data are absent, quality cannot be assessed. Hence, availability is not just a standalone metric but an integral component of data quality, even a prerequisite. It is, thus, imperative to measure, alongside data quality, the availability of data.
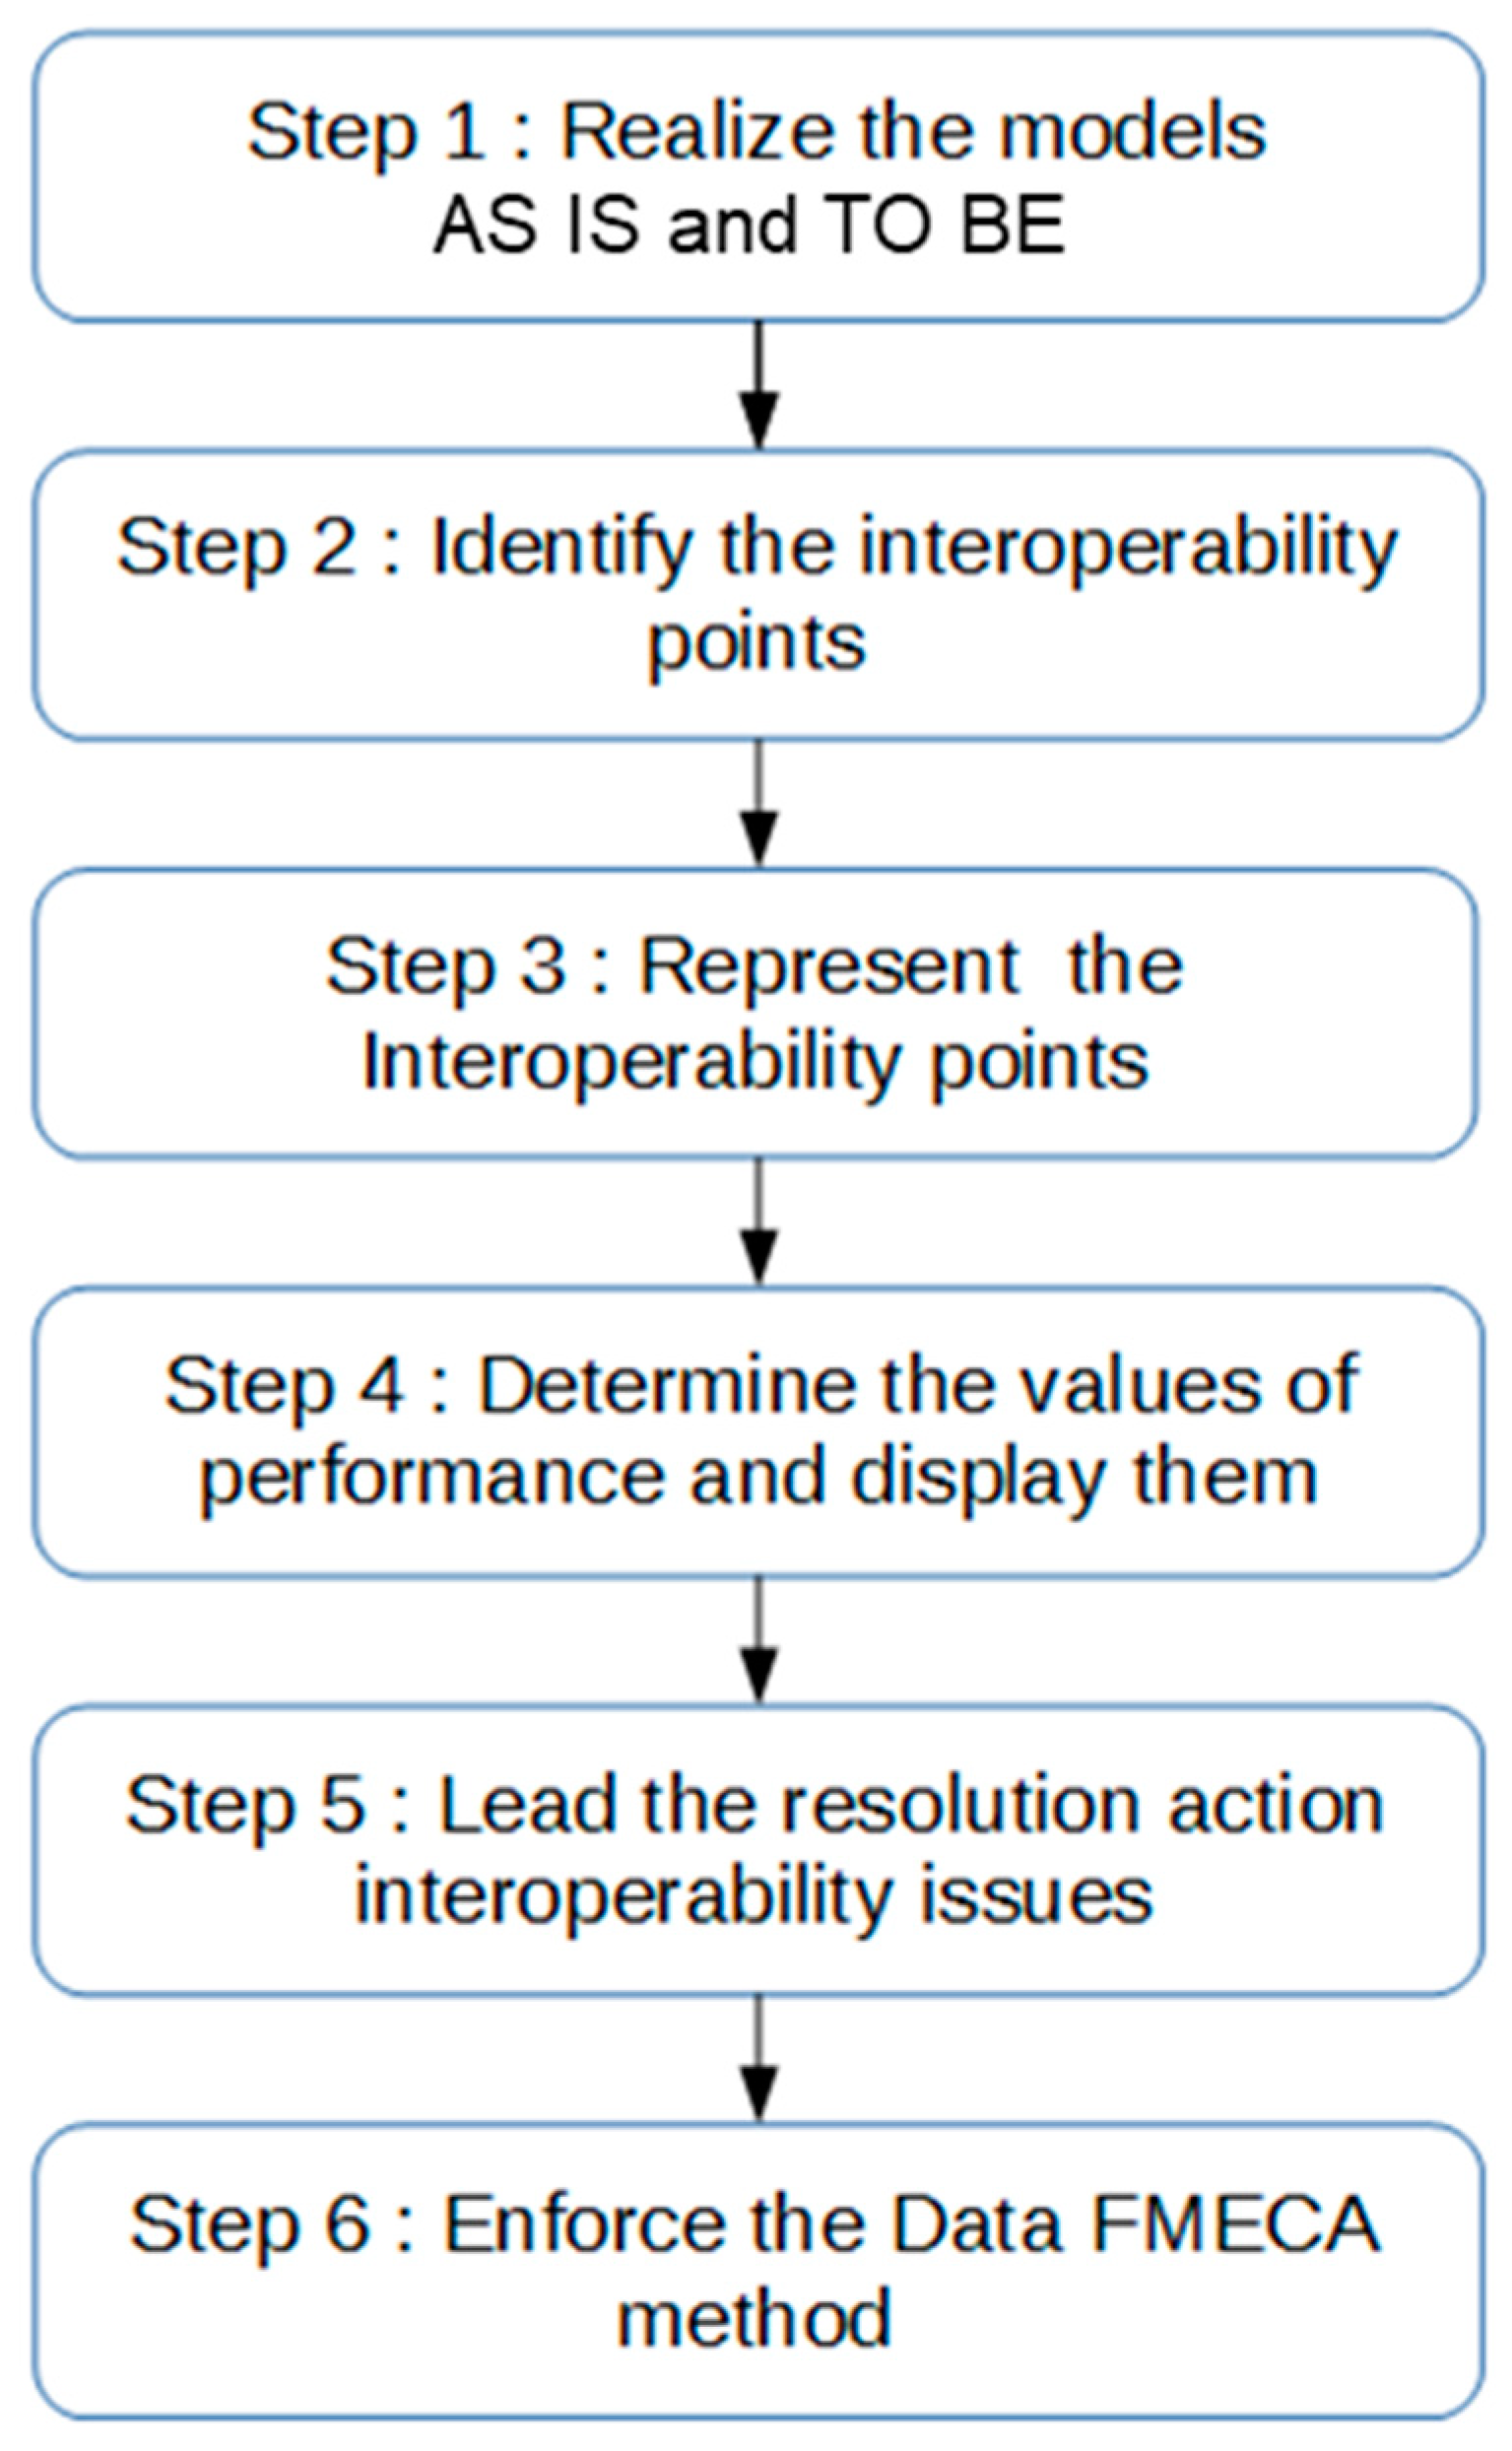
These BPMN extensions, coupled with the data quality management approach, will form an integrated and comprehensive methodology designed to enhance the quality of data exchanged within an interoperable context. The schematic representation of this methodological approach is illustrated in Figure 1. Then, a method derived from failure modes, effects, and criticality analysis (FMECA) was introduced to examine exchanged data pieces systematically and compute their criticality. This approach prioritizes corrective actions to enhance data quality. This ensures a continuous improvement process, maintaining optimal data quality over time.
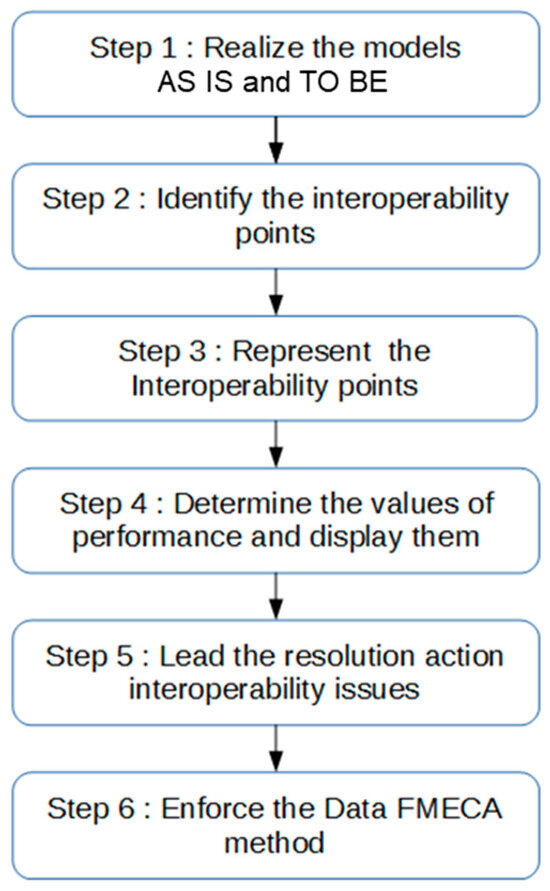
Figure 1.
Global methodology steps.
3.2. Methodology Steps
- Step 1: Perform AS IS and TO BE models to represent the tasks involved in data exchange.
- Step 2: Identify interoperability problems (interoperability points) among various data exchanges within the process.
- Step 3: Represent the identified interoperability points using proposed interoperability extensions.
- Step 4: Determine and input performance values for tasks involved in these data exchanges into proposed performance extensions.
- Step 5: Implement technical solutions to resolve data interoperability.
- Step 6: Implement the data using the FMECA method, ensuring follow-up on previous technical actions for interoperability and establishing a continuous improvement process for data quality.
3.3. Contributions and Case Study Implementation
The following parts detail contributions and their implementation in a real case study, following the steps outlined in Figure 1.
For model implementations in Step 1 and various extensions in Steps 3 and 4, BPMN2 Modeler [28] (version 1.5.0) is used, as well as a plugin of the Eclipse development platform based on Eclipse Graphiti and EMF (Eclipse Modeling Framework). The choice is based on its open-source nature, extensive community support, documentation, popularity (Java language), and extensibility potential.
To demonstrate the methodology’s relevance, it was decided to present at the same time in this paper the methodology and its application to a real case in Onetik SME, a Basque Country cheese manufacturer with a turnover of nearly EUR 35 million. The company is part of a supply chain, dealing with numerous suppliers and customers, primarily supermarkets.
The Onetik ERP’s expedition management module, source of errors and disputes with customers, required improvements. Due to financial constraints, replacing the ERP was not an immediate option. The management decided to integrate another ERP’s expedition module (Integraal Agro) [29] using the proposed method to enhance data quality.
- Step 1: AS IS and TO BE models (Figure 1: The process models were created using BPMN 2.0.
- Step 2: Interoperability points identification: Interoperability points were identified at the level of data exchanges in both models.
- Step 3: Representation of interoperability points:
In Step 3, interoperability points were represented by extending the BPMN 2.0 meta-model.
3.4. Foundation
The goal was to create a sustainable BPMN extension for explicit and intuitive representation of data exchange interoperability issues. BPMN extensions were designed to represent interoperability issues visually. The representation includes indicators of performance measures such as cost, duration, quality, and data availability for tasks impacted by these issues. These extensions enable the quantification and visualization of interoperability problems, promoting their resolution by making the problems clear to all stakeholders.
3.5. Implementation
Two extensions were introduced: dataInteroperabilityBarrier and dataInteroperabilitySolute. The former represents an unresolved interoperability problem, while the latter signifies a resolved issue. Both extend dataObject without adding new attributes.
3.6. Graphical Representation
A proposed graphical representation for dataInteroperabilityBarrier is provided in Figure 2.

Figure 2.
dataInteroperabilityBarrier extension.
Representation of Interoperability Points
In Step 3, interoperability points are graphically represented using extensions to the BPMN 2.0 meta-model. The graphical representation adheres to the same rules and constraints as the standard data object.
- dataInteroperabilityBarrier:
- Graphical representation: The representation signifies that interoperability is not assured. Arrows representing interoperability are barred, indicating a problem to be solved.
- Placement in BPMN model: This representation is placed in the BPMN model following the same rules and constraints as the standard data object.
- dataInteroperabilityResolved:
- Graphical representation: Similar to dataInteroperabilityBarrier but without barred arrows, indicating that interoperability is resolved.
- Placement in BPMN model: This representation is also placed in the BPMN model following the same rules and constraints as the standard data object.
- Use of extensions in BPMN model:

3.7. Evaluation and Representation of Performance
Step 4: Performance Calculation and Display in BPMN Models:
The objective of Step 4 in the methodology (Figure 1) is to calculate the performance of a business process with interoperable activities based on the performance of each activity, and then display these performance values in the BPMN models. To achieve this, an aggregation formula and a new BPMN 2.0 extension, known as “performanceMeasurement”, were developed.
3.7.1. Foundations
The “performanceMeasurement” extension aims to display values of performance measures in areas such as cost, time, quality, and availability. This extension is designed to be linked to a task or a set of tasks within a business process. It allows the comparison of performance values between the AS IS model and the TO BE model after resolving the interoperability problem.
In the context of interoperability, efficiency is directly related to classical operational performance concepts, namely, cost, time, and quality [30,31]. The extension facilitates the representation and comparison of these performance measures.
3.7.2. Linking to Tasks
The “performanceMeasurement” extension is linked to a task or set of tasks within a business process. For data exchanges with interoperability problems, tasks involved include the data reception task and the data compliance task (non-value-added task). In the AS IS model, the extension can be linked to a subprocess representing these tasks. In the TO BE model, where interoperability problems are resolved, it is only linked to the reception task, as no additional tasks are required.
3.7.3. Performance Aggregation Methods
The aggregation model for performance measures is influenced by the work of [32,33], focusing on aggregation within the framework of interoperability based on the reduction of a process to a single task.
3.7.4. Problem and Non-Added-Value Tasks
An interoperability problem requires a non-value-added task to make the data usable in the rest of the process. The objective is to compare the performance of tasks involved in data exchange in the AS IS information system with those in the TO BE information system. Additionally, it involves comparing performance measures of a task in the TO BE model with those of a set of tasks in the AS IS model. This requires aggregating performance measures of multiple tasks.
3.7.5. Performance Aggregation Model
The aggregation model for performance measures is based on the reduction of a process to a single task, drawing inspiration from the works of [32,33] within the interoperability framework.
Process Reduction
Process reduction involves the application of a set of reduction rules to a set of tasks until only one atomic task remains. The performance value of this remaining atomic task corresponds to the collective performance values of all the tasks that have been reduced.
J. Cardoso introduced the stochastic workflow reduction (SWR) algorithm, which uses six reduction rules: sequential, parallel, conditional, fault-tolerant, loop, and network. However, for the purpose of our research, and drawing from [32] work, we will focus on three rules: sequential, conditional, and parallel. This decision is influenced by the fact that fault and loop-tolerant reductions are more applicable to the computer domain. Additionally, network-type information system reduction typically involves subprocesses, but in the context of enterprise, it often translates to just two tasks: data transmission and data compliance (non-value-added task). Subprocesses are considered inappropriate for such small task groupings.
The overarching objective of the reduction process is to simplify detailed activities (A1, A2, etc.) into a single global activity (A).
Sequential Reduction
In sequential reduction, one activity takes place after the previous one and only begins once the preceding activity concludes. In Figure 4, A2 starts after the end of A1.
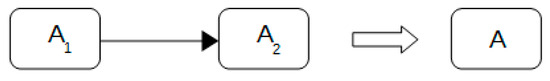
Figure 4.
Sequential reduction.
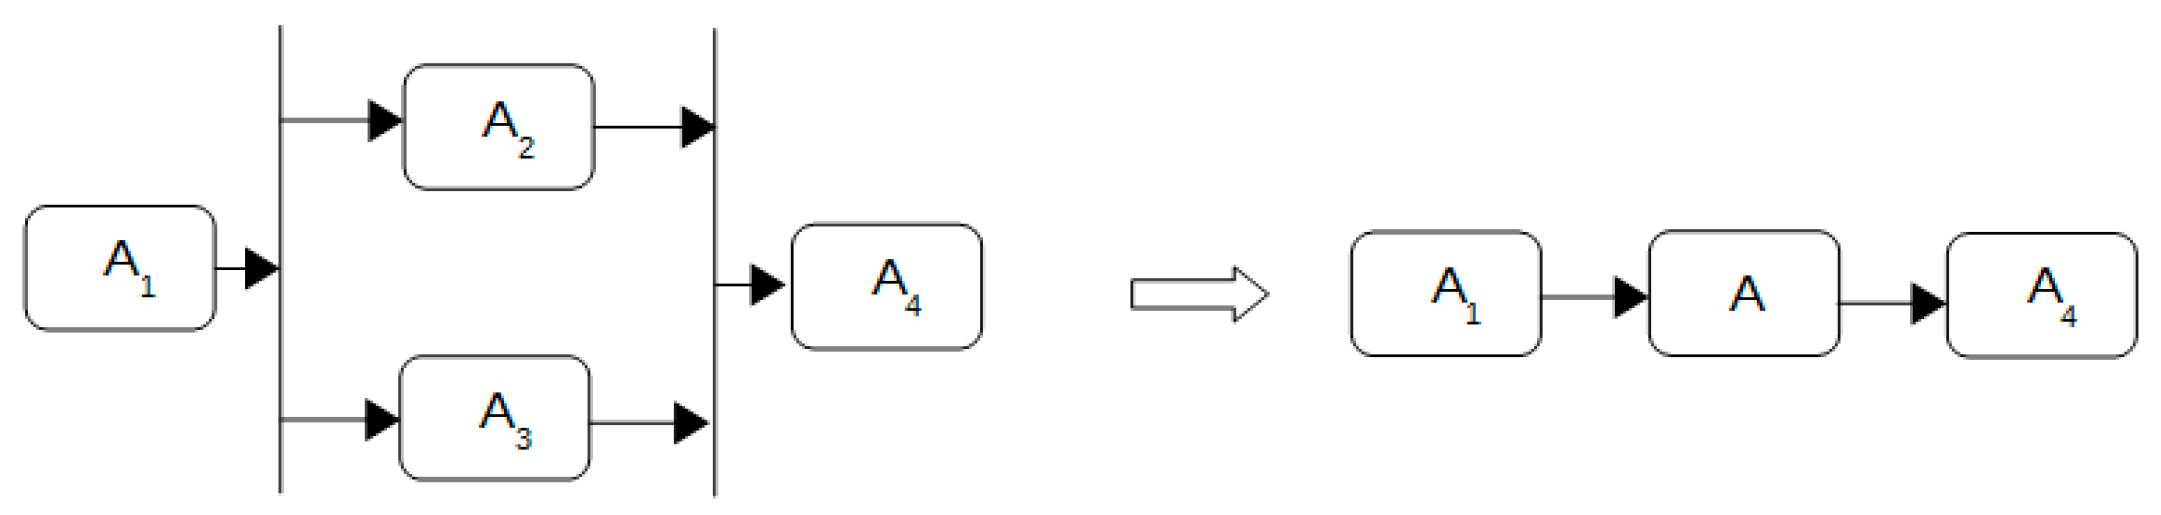
Conditional Reduction
Conditional reduction involves the scenario where either activity A2 or A3 can be performed interchangeably, with each activity having distinct performance characteristics. The graphical representation of conditional reduction is illustrated in Figure 5.
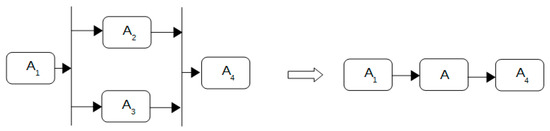
Figure 5.
Conditional reduction.
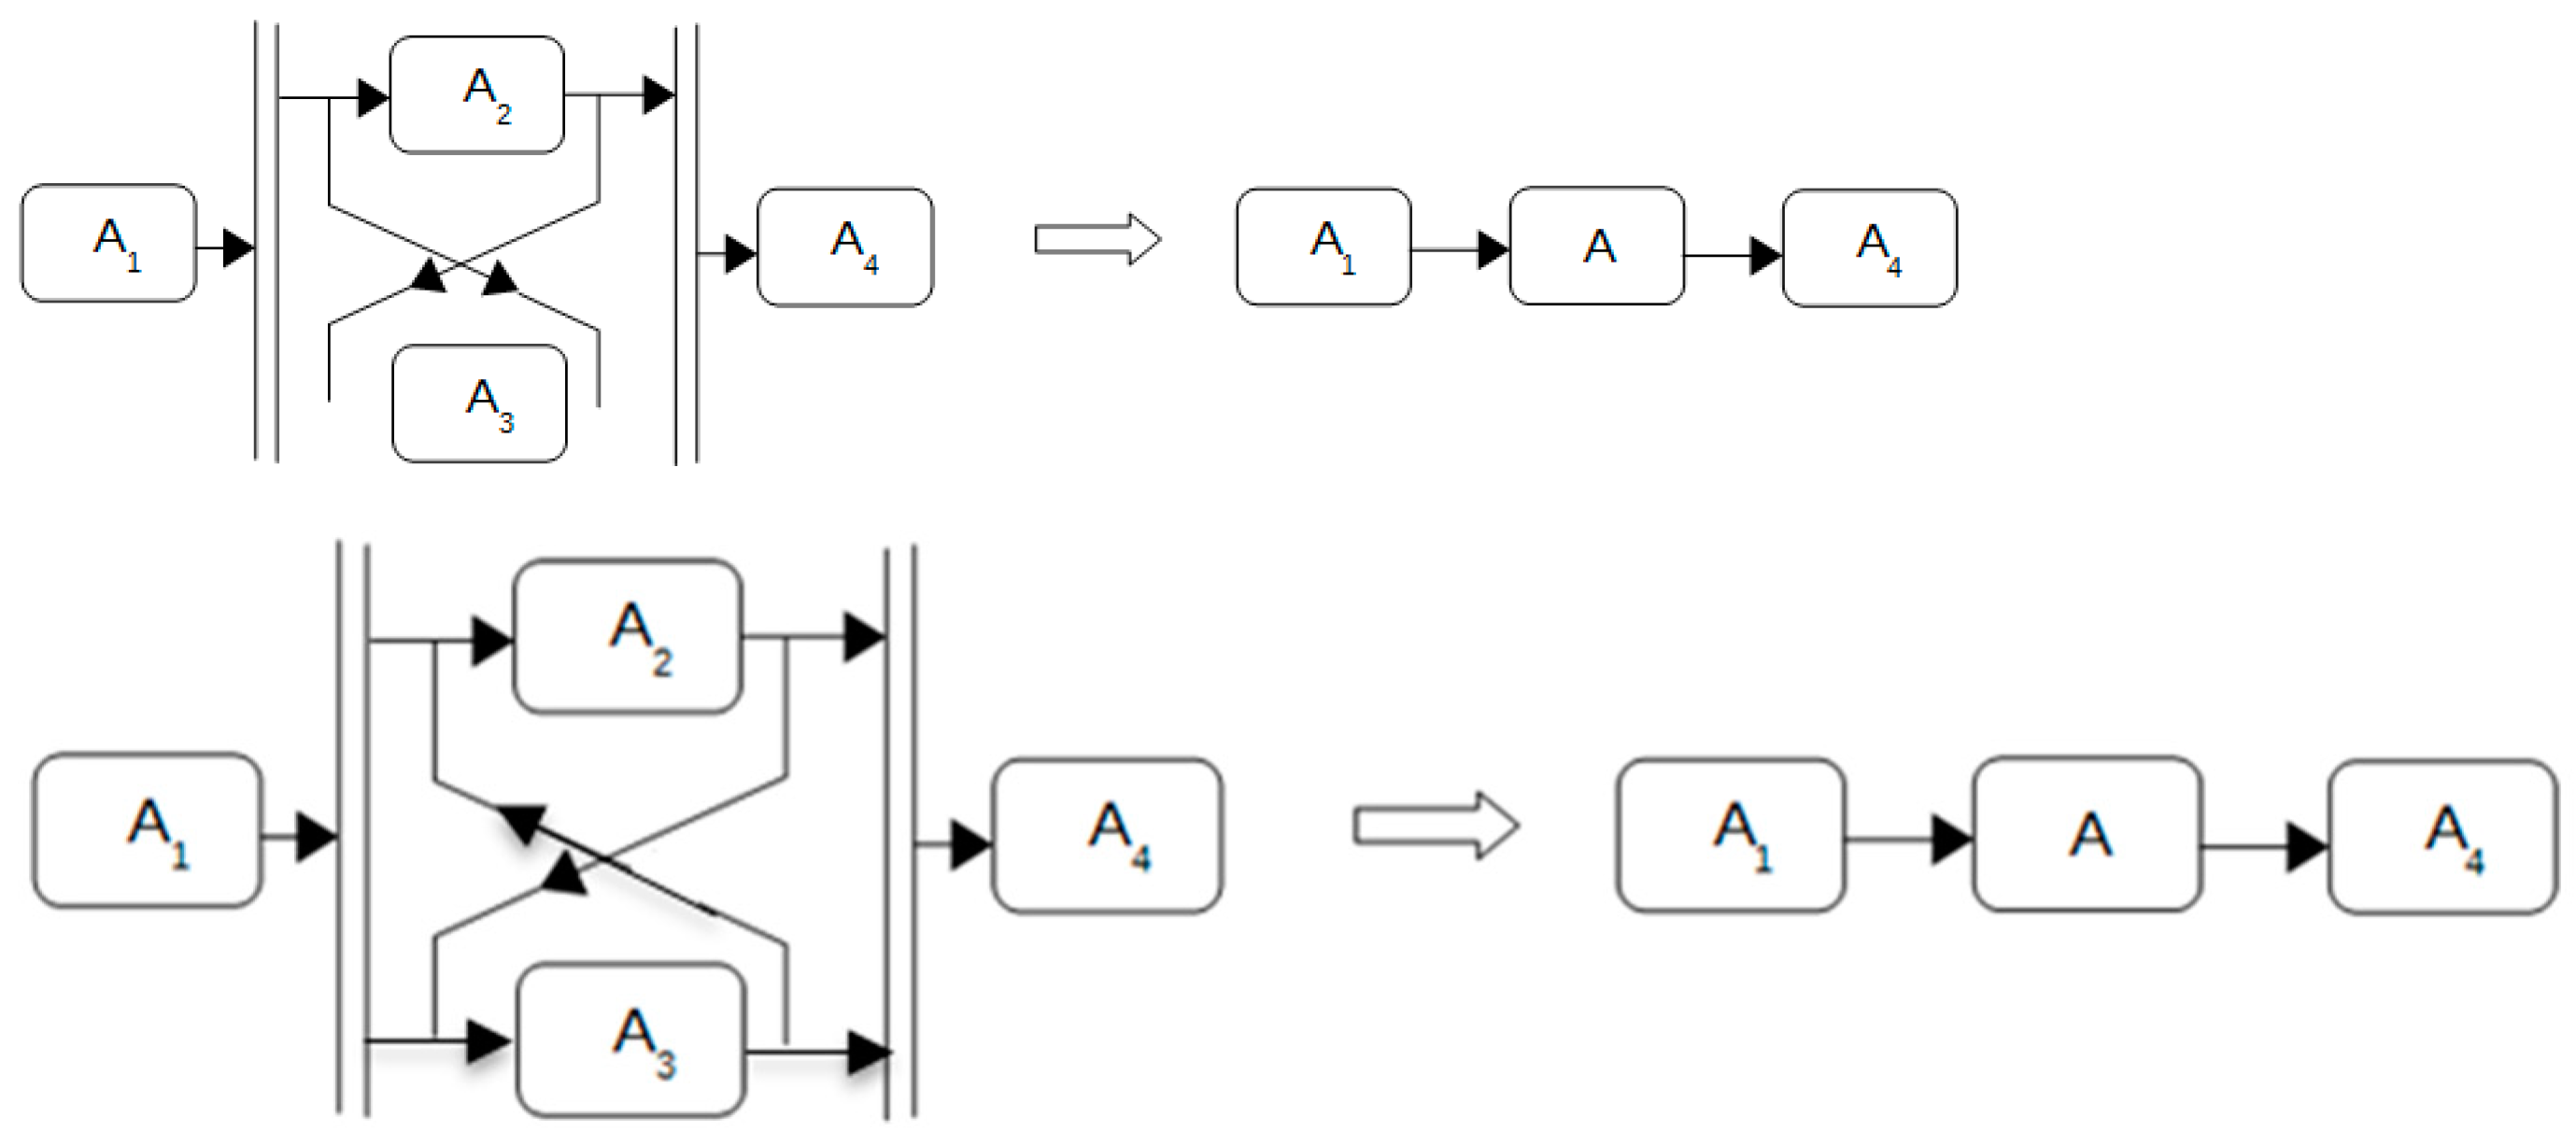
Parallel Reduction
Parallel reduction entails the simultaneous execution of activities A2 and A3, both of which must be performed. Each activity possesses distinct performance characteristics, as depicted in Figure 6.
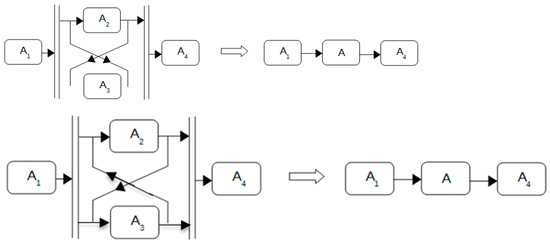
Figure 6.
Parallel reduction.
The counterpoint to process reduction argues against oversimplification, emphasizing that reducing complex processes to atomic tasks may overlook essential nuances and dependencies within the workflow. While process reduction aims to streamline activities, critics contend that it risks losing granularity and context, potentially compromising the accuracy and comprehensiveness of the analysis. Additionally, the decision to focus on specific reduction rules may inadvertently neglect other important aspects of the process, limiting the applicability and robustness of the approach. Critics advocate for a more holistic understanding of process dynamics, incorporating diverse perspectives and considering the interplay between activities for a more accurate representation of the workflow.
3.7.6. Aggregation of Performance Measures
First of all, this was the objective of the simple case study to illustrate how the aggregation formula can be used. Therefore, in the case study, the aggregation of performance is performed. Moreover, the formulas are for performance aggregation and not information aggregation. Indeed, in performance aggregation we can lose the variation of the performance.
For each type of reduction (sequential, conditional, and parallel), specific formulas are employed to calculate the aggregated performance for various performance dimensions. The following formulas will be used to determine the values of the aggregated activity A based on the performance of N activities Ai:
Sequential aggregation:
Cost:
Time:
Quality:
Availability:
Conditional aggregation:
Cost:
Time:
Quality:
Availability:
Parallel aggregation:
Cost:
Time:
Quality:
Availability:
3.7.7. Implementation
Unlike previous extensions, this extension defines attributes for cost, duration, quality, and availability to represent performance values in various domains.
The graphical representation of the “performanceMeasurement” extension is depicted in Figure 7.

Figure 7.
performanceMeasurement extension.
The use of this extension will be represented in the case study presented in the next part of this article.
3.7.8. Extended Interface
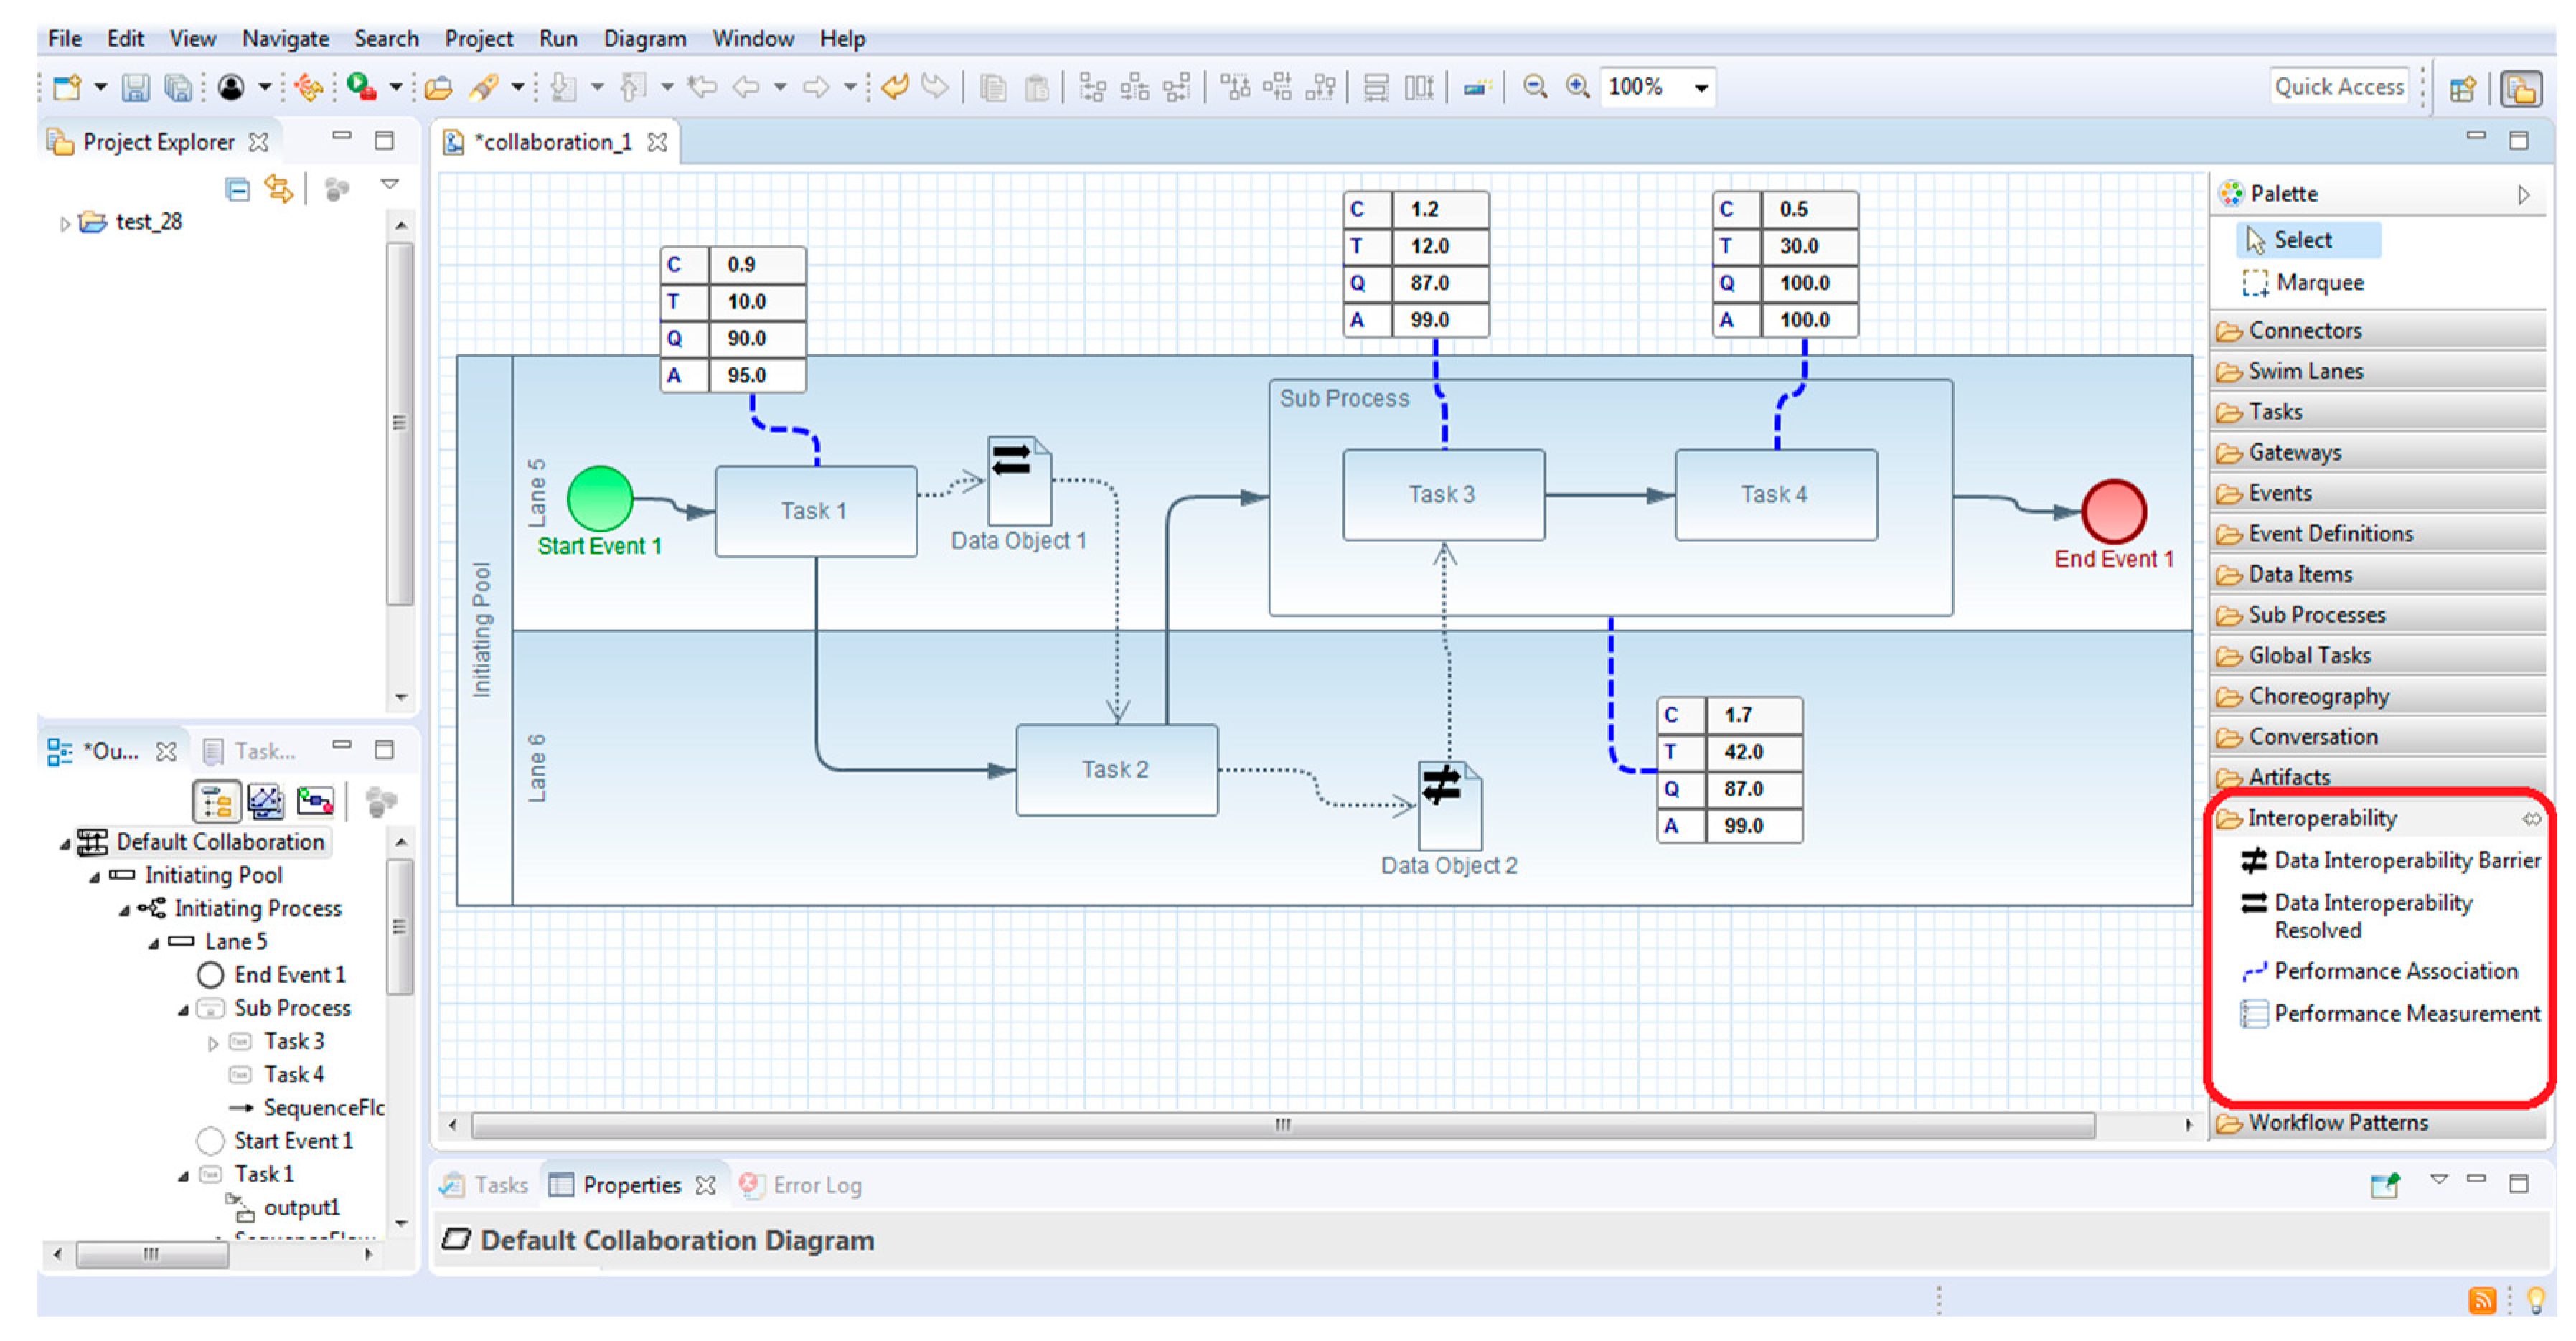
The extended BPMN2 Modeler interface, showcasing our developed features, is presented in Figure 8. This Eclipse-based interface amalgamates the conventional functionalities of BPMN2 Modeler. The distinctive aspect is the incorporation of the “Interoperability” category in the tool palette (outlined in red in Figure 8). This category houses the developed extensions, namely, Data Interoperability Barrier, Data Interoperability Resolved, Performance Association, and Performance Measurement. Users can drag these extensions from the palette to integrate them into their models.
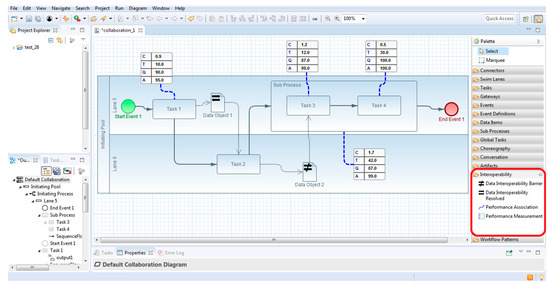
Figure 8.
Extended BPMN Modeler interface with an example of a model.
This expanded interface facilitates the creation of AS IS and TO BE models, aligning with the description provided in Step 1 of the methodology. These models, coupled with Data FMECA, play a pivotal role in identifying and addressing interoperability issues.
4. Use Case: Onetik
A real-world case study in the agrifood industry illustrates the methodology’s application and effectiveness. The study showcases how the methodology helped the company identify and resolve interoperability issues, leading to improved data quality and operational efficiency. By following this improved methodology, enterprises can address interoperability and data quality issues more effectively, leading to enhanced performance and reduced operational inefficiencies.
The real-world implementation of the complete methodology at Onetik, a cheese company in the Basque Country, provided concrete validation of its ability to enhance interoperability and data quality. The successful execution of the methodology highlights its potential to positively impact financial performance and customer satisfaction.
Within the scope of this paper, it is crucial to emphasize that complexity in a process does not inherently offer additional validation. Therefore, we deliberately chose the most straightforward process within the company to effectively illustrate our argument.
4.1. Use Case: Onetik-AS IS Model of Expedition Business Process
In the Onetik case study, the initial steps of the proposed methodology, including modeling, extensions, and performance calculation, are applied. The AS IS model depicts the process of preparing the preprocessing expedition. The detailed steps are as follows:
- The print delivery bill (PDB) is displayed on the screen by the ERP.
- An operator prints the PDB.
- The operator brings the paper PDB to the weighing operator.
- The weighing operator enters the following data on the scale: product identifier, customer identifier, tare, number of packages of this product, use-by date, and batch number.
- The weighing operator places the package on the scale, weighing the package that is automatically displayed on the scale.
- The weighing operator records the weight and batch number on the paper PDB.
- The weighing operator transmits the PDB.
- An operator enters the weight and lot number on the PDB in the ERP.
- The ERP generates a delivery note (BL) from the PDB.
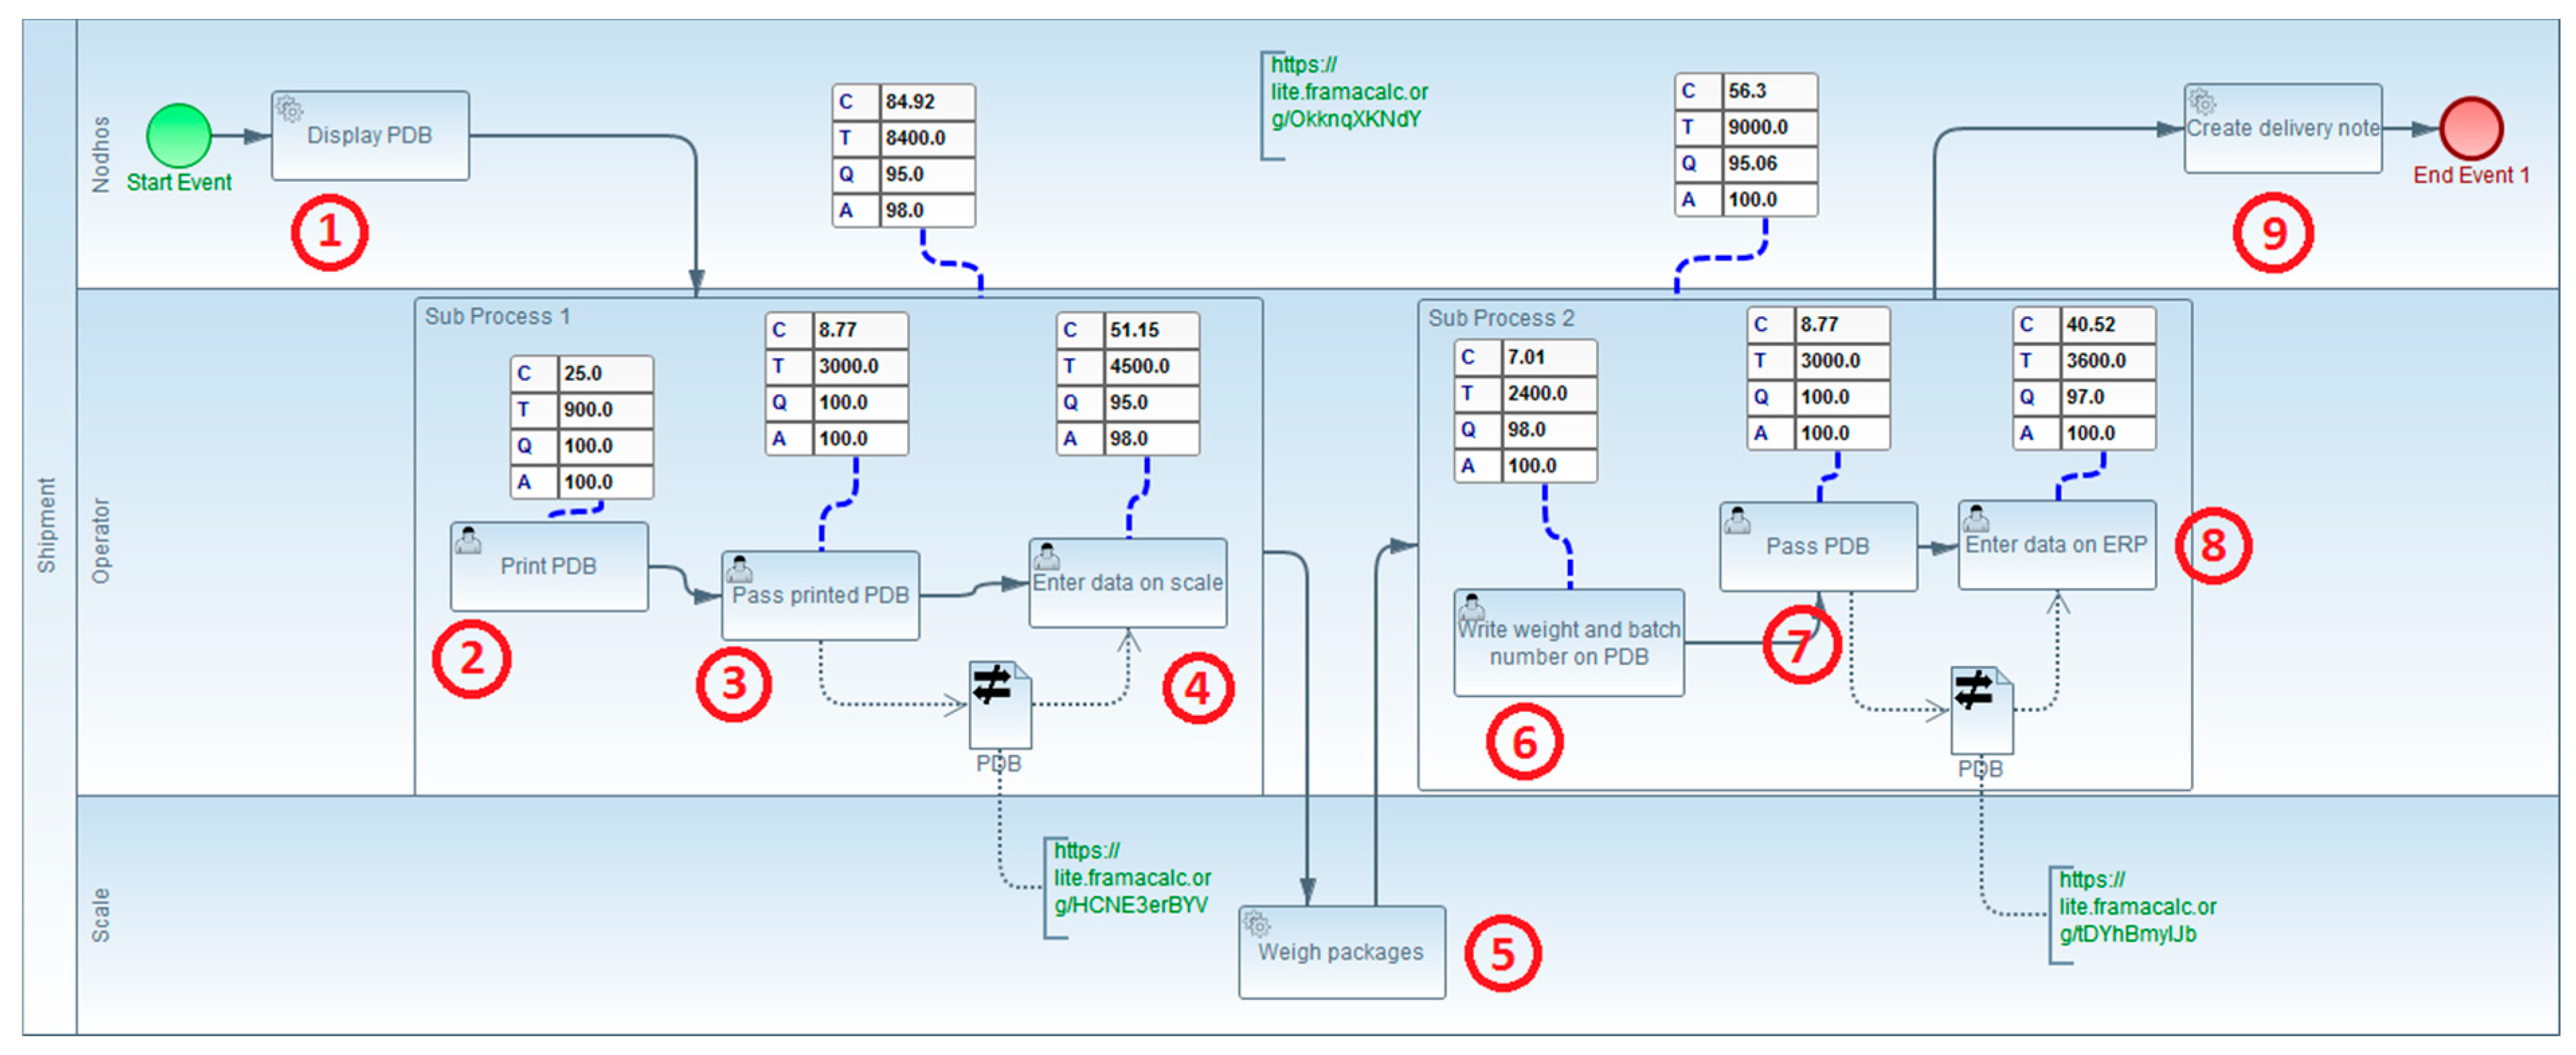
The AS IS model representing this process is presented in Figure 9.
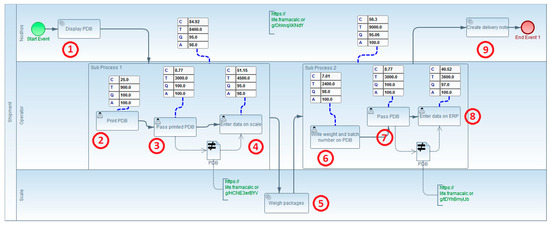
Figure 9.
AS IS model of Onetik expedition business process.
This model serves as a baseline for identifying and addressing interoperability issues in the subsequent steps of the methodology. The extensions and performance measurements will be applied to enhance and optimize this process.
4.2. Onetik Case Study: TO BE Model and Interoperability Points
In Figure 9, the numbers correspond to the steps of the process. Two interoperability points are identified, represented by the dataInteroperabilityBarrier extension, indicating the need for data rekeying:
- Interoperability Point 1: The first interoperability problem occurs in transferring data from the PDB to the weighing scale, resulting in non-value-added tasks (2, 3, and 4).
- Interoperability Point 2: The second problem arises in transferring the completed PDB, along with weight and batch numbers, from the scale to the ERP. This interoperability issue leads to non-value-added tasks (6, 7, and 8).
The performanceMeasurement extension is used to showcase the performance values of the tasks involved in these exchanges (tasks 2, 3, 4, 6, 7, and 8), as well as those of the two subprocesses grouping these tasks. These values will be compared with those of the AS IS model.
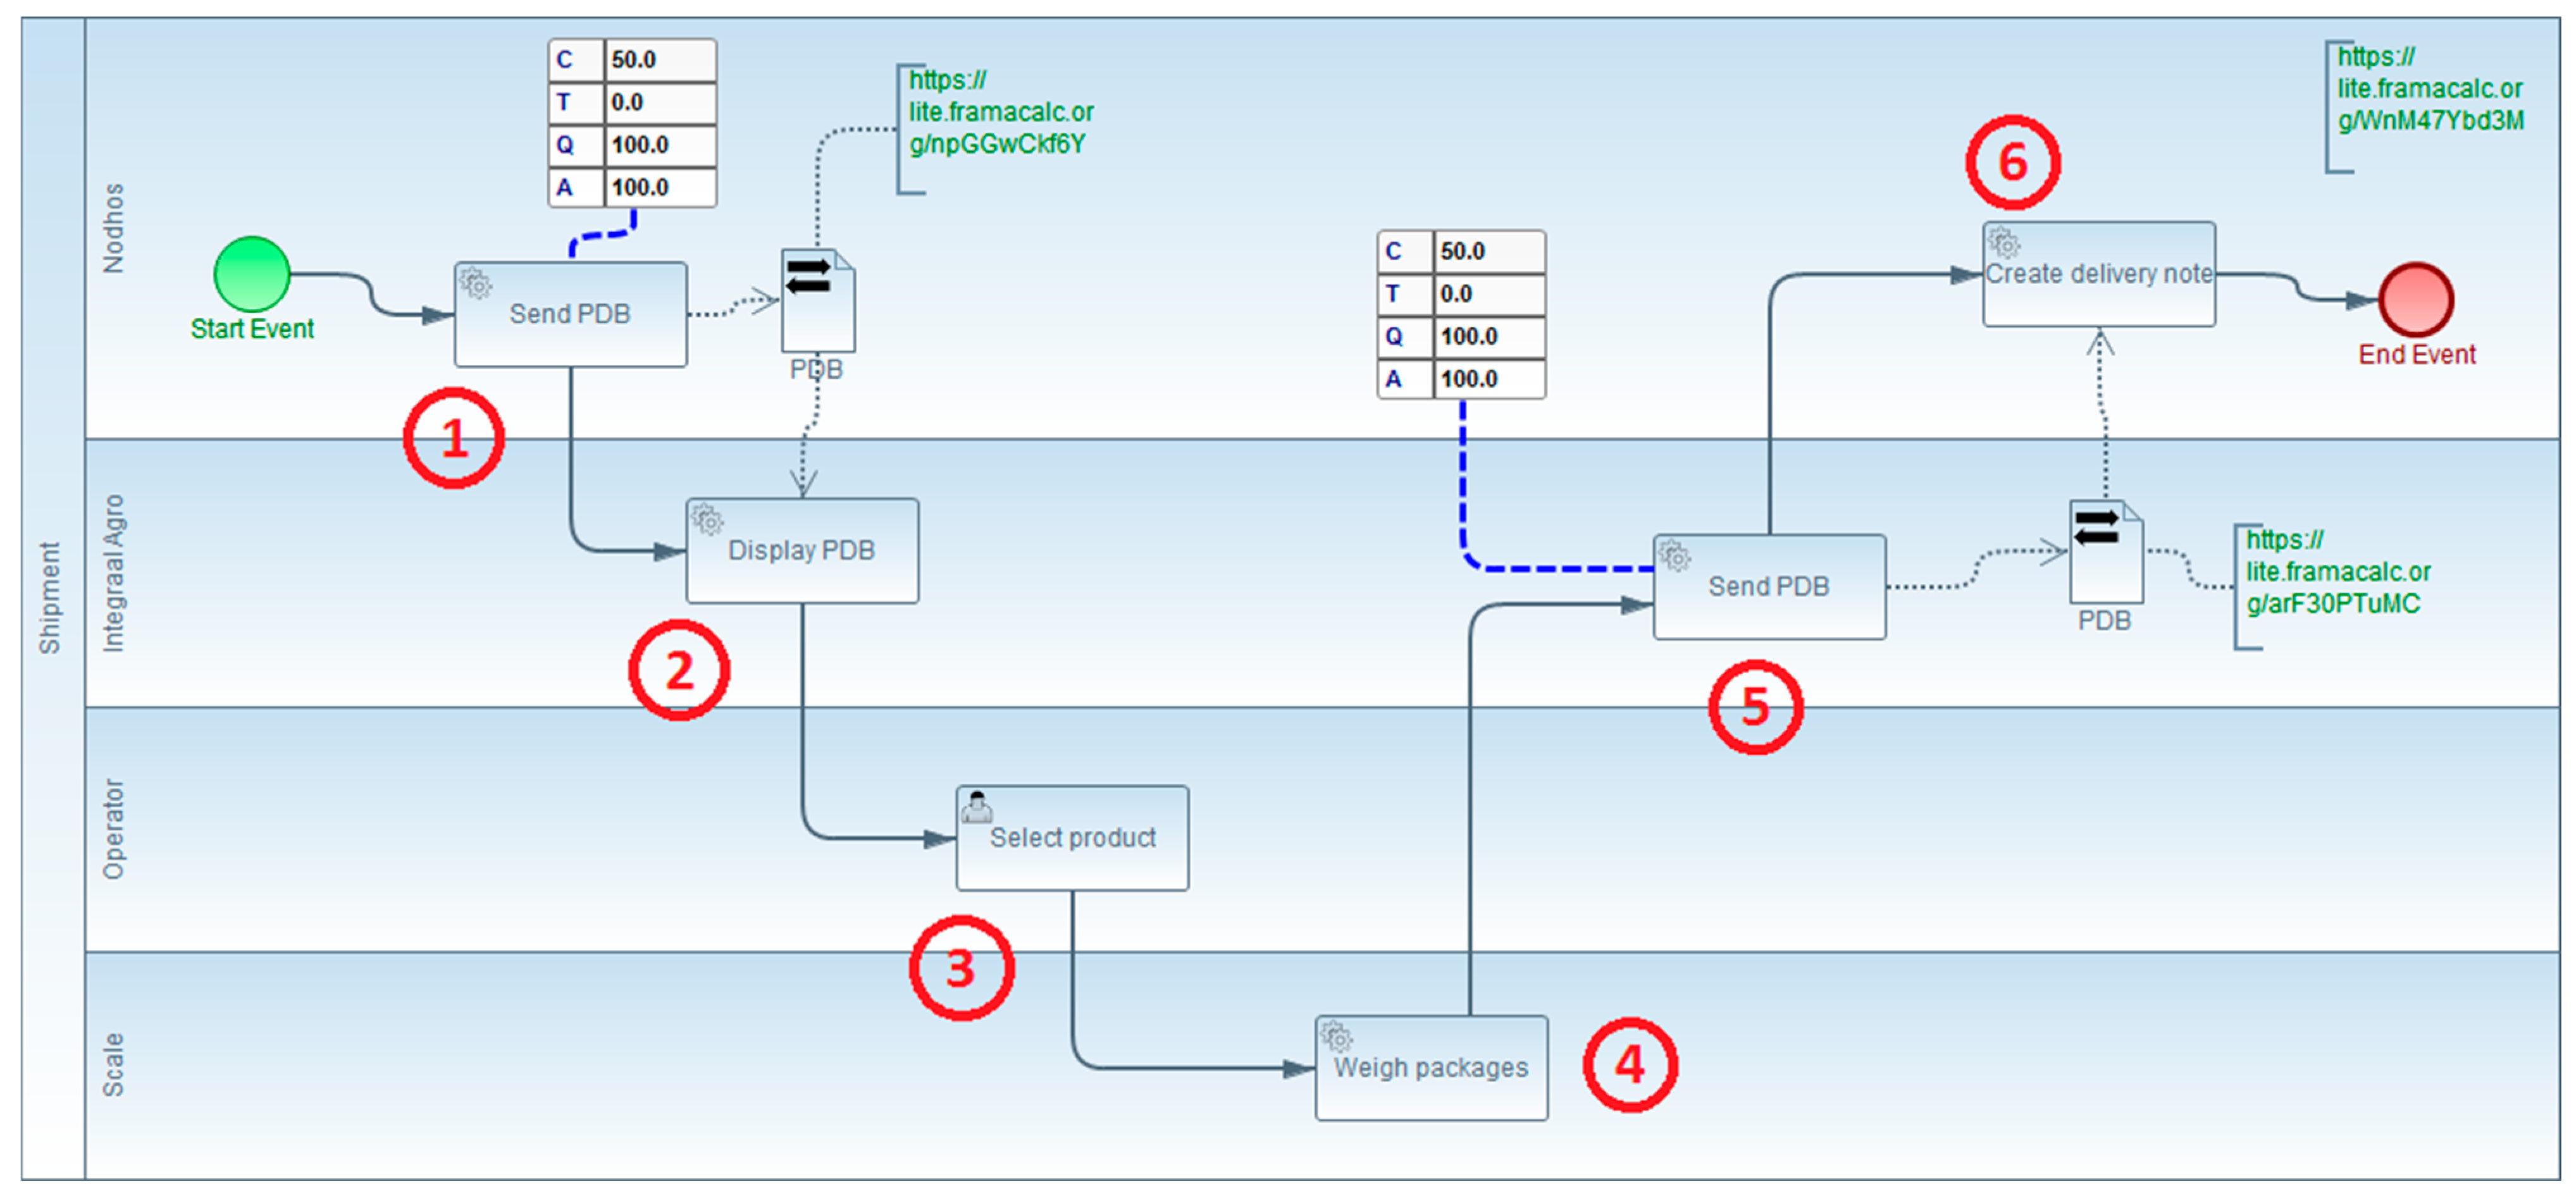
TO BE model (Figure 10):
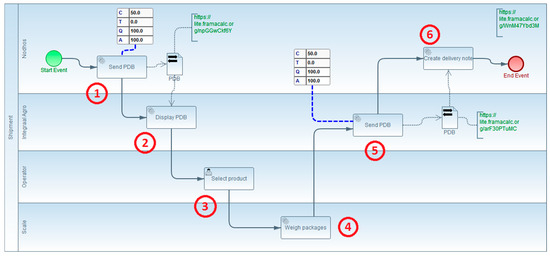
Figure 10.
TO BE model for expedition business process.
The TO BE model represents the same process after transformation. There are six tasks remaining, and non-added-value tasks are removed to improve interoperability. The tasks in the TO BE model include the following:
- The ERP sends the preparation delivery bill (PDB) to the new shipping management module.
- The shipping management module displays the PDB on the scale.
- The weighing operator selects the line to be weighed and the batch number to use.
- The weighing operator places the package on the scale, weighing the package.
- After weighing all the products of the order, the shipment management module returns data to the ERP.
- The ERP generates a delivery note from the PDB.
The TO BE model illustrates the streamlined process after implementing interoperability, resulting in the removal of non-added-value tasks.
4.3. Onetik Case Study: Interoperability Points and Performance Measurement
In the Onetik case study, the “dataInteroperabilityResolved” extension is used to clearly identify the points of interoperability, reminding where issues were present, and ensuring the proper functioning of interoperability solutions. There are only two “performanceMeasurement” tables corresponding to each of the remaining tasks after interoperability solving, when non-added-value tasks have been removed.
The comparison of the values displayed in the TO BE model with those of the AS IS model vividly demonstrates the benefits of establishing interoperability for each of the represented dimensions.
Step 4: Displaying Performance Values in BPMN 2.0 Models
Step 4 of the overall methodology is completed with the display of performance values in the BPMN 2.0 models
Step 5: Implement the resolution actions to solve interoperability issues
According to Figure 1, Step 5 aims to establish interoperability using the new expedition ERP module.
Step 6: Data FMECA Implementation
The next stage is Step 6, which involves the implementation of the Data FMECA method to ensure the quality of data.
Data Quality Management: Data FMECA
The objective of this part is to ensure data quality management through the definition of a method based on the FMECA method dedicated to risk management and to improve the reliability of products. This step is crucial because once interoperability is ensured, it is imperative to ensure that the exchanged data are of good quality. Otherwise, interoperability becomes useless.
Foundation
The proposed BPMN 2.0 extensions provide a global view of data exchange. While this global view is useful, it only allows understanding the existence and nature of data quality problems. For a more detailed and quantitative approach, a complementary tool is required. This tool must provide a detailed view of each data involved in the process, allowing the identification of the causes and consequences of their nonquality to develop corrective actions.
Adaptation of FMECA to Data Quality: Data FMECA
The proposed Data FMECA includes five main stages.
Stage 1—Initialization, Implementation of the Method:
- -
- A team is formed, including actors from all trades concerned by the project.
- -
- The project’s scope is defined, along with the objectives in terms of data quality improvement.
Stage 2—Functional Analysis:
- -
- Documents with quality problems are identified, along with the data inside these documents.
- -
- The system corresponds to the information system, and components are the exchanged documents with each of the data inside.
The continuation of the Data FMECA method and its subsequent stages are outlined for a comprehensive data quality management approach introduced in Table 3.
Table 3.
Data FMECA grid proposal.
Stage 3—Criticality Assessment and Corrective Actions: FMECA Data Grid
In the criticality assessment stage, the FMECA data grid is filled in, considering the parameters F, N, and G:
- F (frequency of the causes of nonquality): Represents the frequency of unreliability of the considered data. Each cause is evaluated independently.
- N (facility of detection/detectability): Represents the possibility of detecting the cause or mode of failure before the effect occurs.
- G (severity of the effects of nonquality): Represents the importance of the effect of nonquality of the data in the long term. Severity quantifies the impact on the customer or on the next process.
Criticality Calculation:
C = F × N × G
The quantification of F, N, and G values is performed based on evaluation grids, scales, etc. These grids are specific to each company and are determined by the company’s sensitivity to data quality.
Stage 4—Corrective Actions:
The corrective actions aims at defining actions for prevention (to decrease the frequency), mitigation (to decrease the severity), or detection of data quality issues.
Summary FMECA grid: A summary FMECA grid is completed at the level of the global business process to summarize all the data quality problems. A column is added to this summary grid, corresponding to the name of the document containing the data.
The completion of these stages helps prioritize the resolution of data nonquality issues and provides a roadmap for implementing corrective actions. The next steps involve executing these corrective actions and continually monitoring and improving data quality within the organization.
The complete Data FMECA methodology ensures a thorough analysis and management of data quality issues, contributing to the overall improvement of the data exchange process as introduced in Table 4.
Table 4.
Summary grid.
Threshold of Criticality and Continuous Improvement:
It is indeed possible to set a threshold of criticality. Data for which criticality is greater than this threshold will require corrective actions, while others may be considered less critical and potentially neglected. This threshold serves as a prioritization criterion for addressing data quality issues.
Stage 5—Continuous Improvement:
After setting up the Data FMECA tool and completing the summary grid, managers can monitor the evolution of data quality after each corrective action. The parameters F, N, and G are reevaluated for the corrective actions, resulting in new values denoted as F′, N′, and G′. These updated values are used to calculate the new criticality denoted as C′ for each data entry in the grid.
This continuous improvement process involves the following steps:
- Reevaluation of parameters: Assessing the impact of corrective actions on the frequency, detectability, and severity of data quality issues.
- Calculation of new criticality (C′): Using the updated parameters to calculate the new criticality values for each data entry.
- Prioritization of reliability failures: Establishing a new list of critical points based on the updated criticality values.
- Proposing new corrective actions: Identifying and proposing new corrective actions to further improve data quality.
The continuous improvement cycle allows organizations to iteratively enhance their data quality management processes. It ensures that corrective actions are effective and provides a mechanism for ongoing refinement and optimization of data quality initiatives.
Use Case:
As part of the case study, the Data FMECA method was applied to identify failure modes, causes, and effects of data quality issues related to batch numbers and the weight of the cheese. The provided extract from the grid (Table 5) showcases the evaluation of criticality for these specific data entries, emphasizing their importance in addressing customer claims.
Table 5.
FMECA data grid used at Onetik.
The Data FMECA methodology, when applied to specific data elements, contributes to a systematic and continuous approach to improving data quality, thereby enhancing overall process performance and customer satisfaction.
Summary Table and Continuous Improvement:
The completion of evaluation grids for different data entries is followed by merging these data into a summary table, as presented in Table 6. The “Result” column in this summary table contains criticality values that indicate the direct benefits obtained from the implemented corrective actions.
Table 6.
Summary grid completed.
This summary table serves as a comprehensive overview of the impact of corrective actions on various data elements. The criticality values in the “Result” column reflect the positive outcomes resulting from efforts to decrease the frequency of data quality issues. The table provides insights into which data entries have experienced improvements and highlights areas where future efforts should be directed during the continuous improvement phase.
Continuous Improvement Phase:
- Analysis of criticality values (result): Understanding the impact of implemented corrective actions on the criticality values of different data entries.
- Identification of data entries with ongoing issues: Recognizing data entries that still exhibit high criticality values, indicating areas where further improvements are needed.
- Selection of additional corrective actions: Choosing additional corrective actions based on the identified areas for improvement. This involves assessing the feasibility and effectiveness of different actions.
- Implementation of new corrective actions: Executing the chosen corrective actions to address the identified issues and enhance the quality of data.
- Monitoring and evaluation: Continuously monitoring the performance of data entries, reevaluating criticality values, and assessing the effectiveness of the newly implemented corrective actions.
- Iterative process: Repeating the continuous improvement cycle iteratively to achieve ongoing enhancements in data quality.
The continuous improvement phase is a dynamic and iterative process that ensures organizations remain proactive in addressing data quality issues. By regularly assessing criticality values and implementing targeted corrective actions, organizations can achieve sustained improvements in data quality over time.
The presented methodology, encompassing the Data FMECA approach and continuous improvement, provides a structured framework for managing and enhancing data quality. It allows organizations to systematically identify, analyze, and address data quality issues, leading to improved overall process performance and customer satisfaction. The iterative nature of the continuous improvement phase ensures that efforts to enhance data quality remain adaptive and responsive to evolving business needs.
Summary of Conceptual Contributions and Case Study Application:
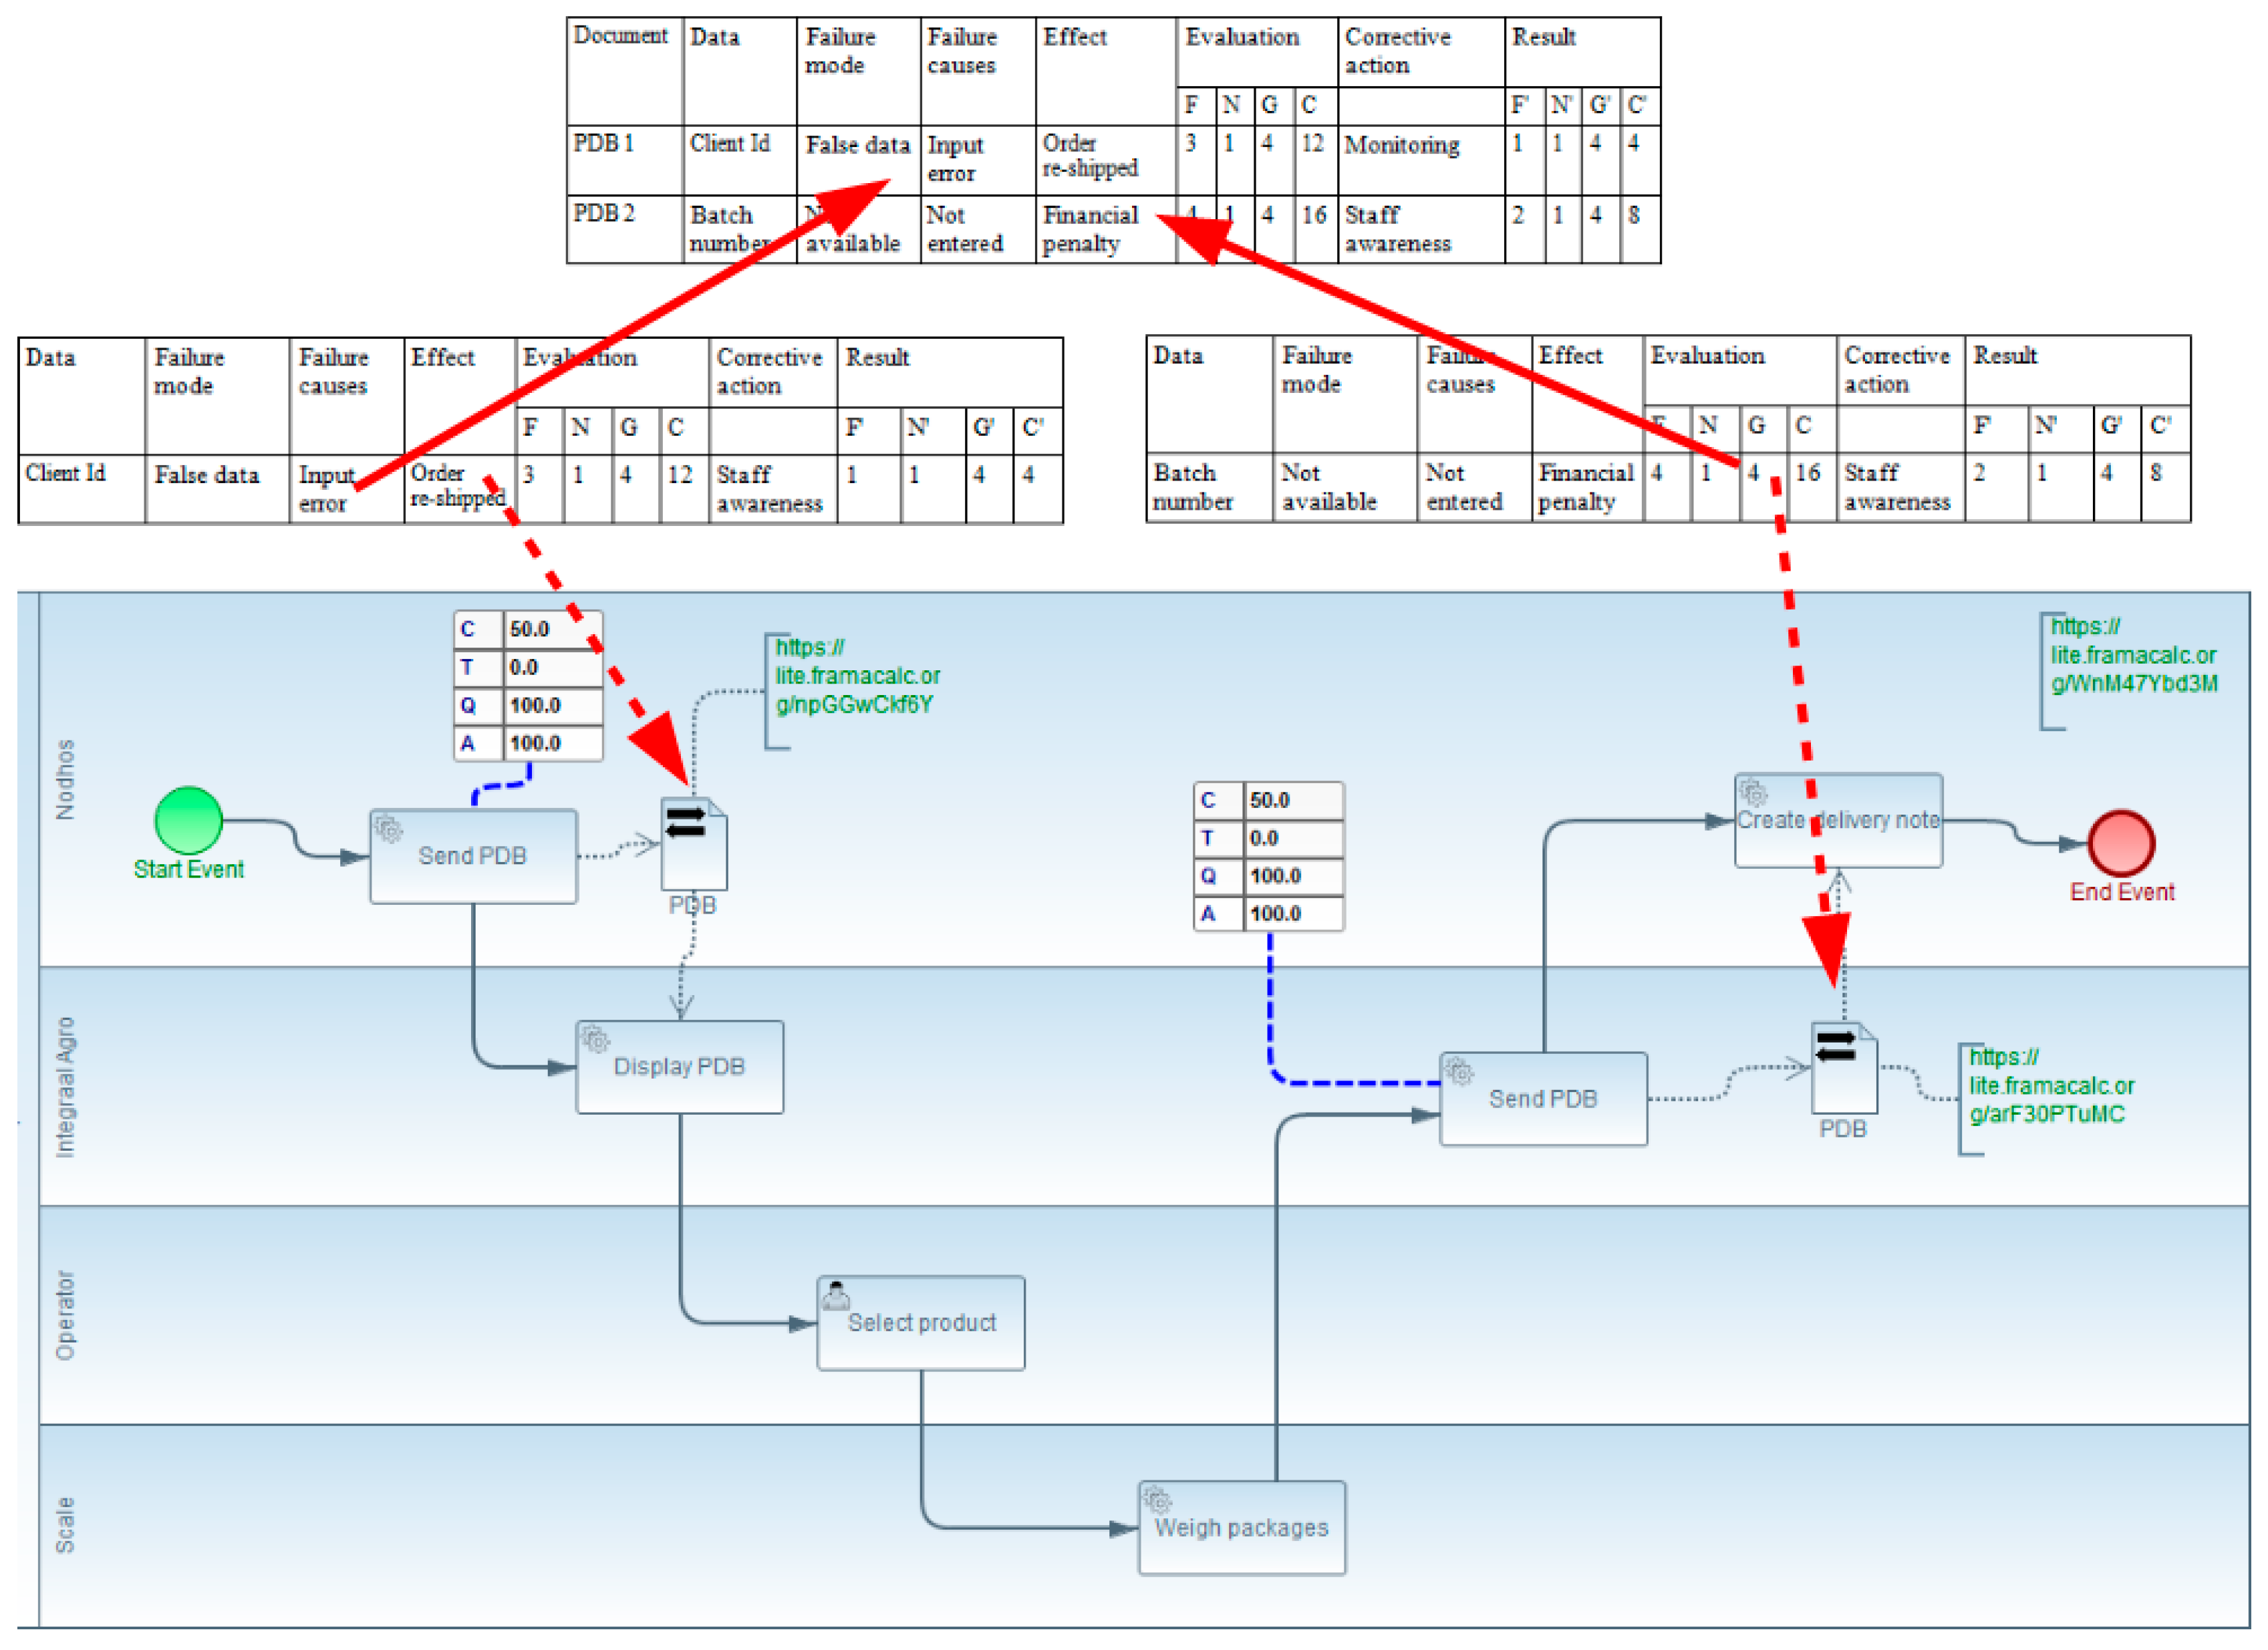
The application of the complete methodology to the ONETIK case study has yielded significant conceptual contributions and practical outcomes. Figure 11 serves as a summary, highlighting the key aspects and contributions:
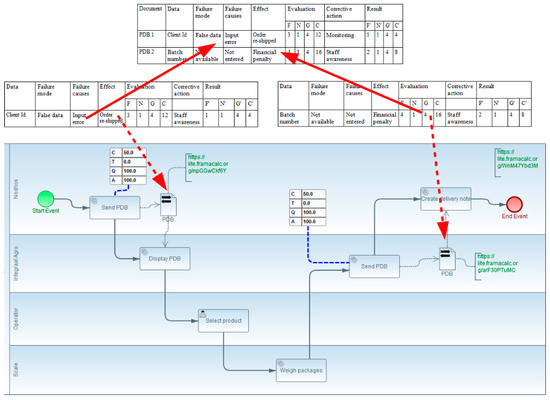
Figure 11.
Complete TO BE model of Onetik with the FMECA grids.
- Visibility of Data Exchanges with Interoperability Problems:
- The methodology makes the exchange of data with interoperability problems visible to various audiences within the company.
- The use of BPMN 2.0 models with interoperability extensions, such as dataInteroperabilityResolved, facilitates clear representation of data exchanges.
- Highlighting the Need for Problem Resolution:
- Measures of performance for tasks directly involved in data exchanges are displayed in BPMN 2.0 models.
- The TO BE model illustrates the establishment of interoperability, showcasing improved performance in terms of cost, time, quality, and availability.
- Significant Improvement in Data Quality:
- The Data FMECA method contributes to a continuous improvement approach for data quality management.
- Implementation of corrective actions based on FMECA analysis results in a substantial enhancement of the quality of exchanged data.
- Positive Impact on Financial Performance and Customer Satisfaction:
- The improved data quality resulting from the methodology has a positive impact on financial performance.
- Enhanced data quality contributes to increase customer satisfaction.
- Conceptual Contributions Visualized in Figure 11:
- The TO BE model with established interoperability points is depicted, showcasing the two data exchanges with the dataInteroperabilityResolved extension.
- Data FMECA evaluation grids for the identified data exchanges are presented, connected to the corresponding exchanged documents.
- The synthesis grid, merging data from individual FMECA grids, provides a comprehensive overview of criticality and areas for improvement.
In summary, the methodology’s application demonstrates its effectiveness in addressing interoperability challenges, improving data quality, and contributing to overall organizational performance. The visual representation in Figure 11 encapsulates the various stages and contributions of the methodology in the context of the illustrative case study. The red arrows show the locations of the tables in the process data component of the model. The red dashed arrows in Figure 11 link the detailed data table to the data object of the BPMN model. It details the failure modes from the initial process to the evaluation and corrective actions proposed to improve interoperability.
5. Conclusions
In conclusion, this article introduces a comprehensive methodology and associated modeling tools designed to identify and address data interoperability issues while emphasizing continuous improvement in data quality. The key contributions and outcomes of the methodology encompass several facets.
The first major aspect involves introducing extensions to BPMN 2.0, specifically dataInteroperabilityBarrier and dataInteroperabilityResolved. These extensions provide a visual representation of interoperability challenges and successfully resolved cases, aiding in the depiction and understanding of data exchanges.
Another significant contribution is the development of the performanceMeasurement extension, which facilitates the display of performance metrics within both the AS IS and TO BE models. This extension allows for the representation of task performance metrics within subprocesses, enhancing the visualization of performance values.
To streamline the evaluation process, the methodology proposes methods for process reduction and performance aggregation. These techniques assist in consolidating task performance metrics within subprocesses, simplifying the analysis of performance data.
The introduction of the Data FMECA method represents a systematic approach to resolving data quality issues. This method considers individual data elements, identifies causes and consequences of nonquality, and calculates criticality to establish priorities for corrective actions. The criticality evaluation grids produced by this method correspond to each data exchange within the process, providing a detailed and quantitative approach to data quality management.
The real-world application of the entire methodology at Onetik, a cheese company in the Basque Country, serves as practical validation of its effectiveness in enhancing interoperability and data quality. The successful implementation of the methodology demonstrates its potential impact on financial performance and customer satisfaction.
In summary, the methodology presented in this article offers a holistic framework for addressing interoperability challenges and improving data quality throughout the data exchange process. The contributions in terms of BPMN extensions, performance measurement, and Data FMECA contribute to a comprehensive toolkit for organizations seeking to enhance their data management practices.
6. Perspectives and Future Works
Looking ahead, there are several potential directions for further refinement and expansion of the developed method and toolbox, opening avenues for future work.
One promising avenue involves exploring the use of BPMN 2.0 models as simulation tools for upcoming projects, aligning with the principles advocated by the BPSIM initiative. This approach not only enables the prediction of system behavior but also validates that process dynamics align with business requirements, enhancing the practical utility of BPMN 2.0 models.
Then, addressing the order of resolving interoperability issues will be crucial. Determining which issue to tackle first will depend on factors such as impact and dependencies between systems. Additionally, it is important to consider how changes made to solve interoperability problems may trigger new issues, especially concerning shared or reused data. Adopting an iterative approach in resolving these issues can provide a more flexible and adaptive solution, allowing for incremental improvements while managing risks effectively.
In terms of implementation, there are opportunities for improving the functionality of extensions within the BPMN2 Modeler. Enhancements such as clickable links within BPMN 2.0 models that directly navigate to the corresponding evaluation grid for each data exchange, or the summary grid, would add significant value. Current methods involve manually added links in text annotations, and a more seamless integration would enhance user experience. Additionally, considering the storage of grids on a local network or in a company’s cloud hosting solution could allow for structural interconnection of grids beyond their association with the BPMN process. This development could provide a unified data view across different grids, improving overall coherence.
Moreover, incorporating statistical analysis tools into the methodology to generate aggregated insights directly from the FMECA grids holds promise for streamlining reporting processes. This integration would offer a more efficient means of extracting meaningful information from the collected data, further enhancing the decision-making process.
In summary, the identified perspectives and future works underscore the potential for ongoing development and refinement of the methodology, aligning it with emerging technologies and addressing specific usability enhancements for a more seamless and comprehensive approach to data interoperability and quality management.
Author Contributions
Conceptualization, X.H. and S.T.; methodology, X.H.; software, X.H.; validation, X.H., S.T., Y.D. and G.Z.; formal analysis, X.H.; investigation, X.H.; resources, X.H.; data curation, X.H.; writing—original draft preparation, X.H., S.T., Y.D. and G.Z.; writing—review and editing, X.H., S.T., Y.D. and G.Z.; visualization, X.H.; supervision, X.H., S.T., Y.D. and G.Z.; project administration, S.T., Y.D. and G.Z.; funding acquisition, S.T. and Y.D. All authors have read and agreed to the published version of the manuscript.
Funding
This research was partialy funded by ANRT (Agence Nationale de la Recherche et de la Technologie) through a CIFRE PhD Grant.
Data Availability Statement
Data available on request due to restrictions.
Conflicts of Interest
The authors declare no conflict of interest.
References
- Geraci, A. IEEE Standard Computer Dictionary: Compilation of IEEE Standard Computer Glossaries; IEEE Press: Piscataway, NJ, USA, 1991. [Google Scholar]
- Konstantas, D.; Bourrières, J.P.; Léonard, M.; Boudjlida, N. (Eds.) Interoperability of Enterprise Software and Applications; Springer: Berlin/Heidelberg, Germany, 2006. [Google Scholar]
- Chen, D.; Daclin, N. Framework for enterprise interoperability. In Interoperability for Enterprise Software and Applications: Proceedings of the Workshops and the Doctorial Symposium of the Second IFAC/IFIP I-ESA International Conference: EI2N, WSI, IS-TSPQ; Wiley Online Library: Hoboken, NJ, USA, 2006; pp. 77–88. [Google Scholar]
- Lemrabet, Y.; Clin, D.; Bigand, M.; Bourey, J.P. From BPMN 2.0 to the Setting-Up on an ESB–Application to an Interoperability Problem. In Collaborative Networks for a Sustainable World. PRO-VE 2010; IFIP Advances in Information and Communication Technology; Springer: Berlin/Heidelberg, Germany, 2010; pp. 722–729. [Google Scholar]
- Pawar, S.N. BPMN Tools-A Comparative Analysis to Improve Interoperability. Master’s Thesis, Purdue University, West Lafayette, IN, USA, 2011. [Google Scholar]
- Rodríguez, A.; Caro, A.; Cappiello, C.; Caballero, I. A BPMN extension for including data quality requirements in business process modeling. In International Workshop on Business Process Modeling Notation; Springer: Berlin/Heidelberg, Germany, 2012; pp. 116–125. [Google Scholar]
- Cappiello, C.; Caro, A.; Rodriguez, A.; Caballero, I. An approach to design business processes addressing data quality issues. In Proceedings of the ECIS 2013—Proceedings of the 21st European Conference on Information Systems, Utrecht, The Netherlands, 6–8 June 2013. [Google Scholar]
- Bourguignon, A.; Malleret, V.; Nørreklit, H. Balanced Scorecard versus French Tableau de Bord: Beyond Dispute, a Cultural and Ideological Perspective; Groupe HEC Cergy-Pontoise: Paris, France, 2001. [Google Scholar]
- Trudel, J.D. The balanced scorecard: Translating strategy into action. Consult. Manag. 1997, 9, 74. [Google Scholar]
- Fernandez, A. Les Nouveaux Tableaux de Bord Pour Piloter L’entreprise; Éditions d’Organisation: 1999. Available online: https://www.persee.fr/doc/reso_0751-7971_1999_num_17_92_2133_t1_0456_0000_3 (accessed on 13 December 2023).
- Neely, A.D.; Adams, C.; Kennerley, M. The Performance Prism: The Scorecard for Measuring and Managing Business Success; Prentice Hall Financial Times: London, UK, 2002. [Google Scholar]
- Cooper, R.; Kaplan, R.S. How cost accounting distorts product costs. Strateg. Financ. 1988, 69, 20. [Google Scholar]
- Markovska, M.; Milani, F.P.; Garcia-Banuelos, L. Modelling Business Processes on a Blockchain Eco-System (BPMN). Master’s Thesis, University of Tartu, Tartu, Estonia, 2019. [Google Scholar]
- Belaunde, M.; Casanave, C.; DSouza, D.; Duddy, K.; El Kaim, W.; Kennedy, A.; Frank, W.; Frankel, D.; Hauch, R.; Hendryx, S.; et al. MDA Guide Version 1.0. 1.; Object Management Group: Needham, MA, USA, 2003. [Google Scholar]
- Scheer, A.W.; Schneider, K. ARIS—Architecture of integrated information systems. In Handbook on Architectures of Information Systems; Springer: Berlin/Heidelberg, Germany, 1998; pp. 605–623. [Google Scholar]
- IDEF–Integrated DEFinition Methods (IDEF). s. d. IDEF–Integrated DEFinition Methods (IDEF). Available online: https://www.idef.com/ (accessed on 2 January 2023).
- Doumeingts, G. Méthode GRAI: Méthode de Conception des Systèmes en Productique. Ph.D. Thesis, Université de Bordeaux I, Talence, France, 1984. [Google Scholar]
- Kosanke, K. CIMOSA—Overview and status. Comput. Ind. 1995, 27, 101–109. [Google Scholar] [CrossRef]
- Oakland, J.S. Total Quality Management and Operational Excellence: Text with Cases; Routledge: London, UK, 2014. [Google Scholar]
- Shankaranarayanan, G.; Wang, R.Y.; Ziad, M. Modeling the Manufacture of an Information Product with IP-MAP. In Proceedings of the 6th International Conference on Information Quality; ACM: New York, NY, USA, 2000. [Google Scholar]
- Lee, Y.W.; Strong, D.M.; Kahn, B.K.; Wang, R.Y. AIMQ: A methodology for information quality assessment. Inf. Manag. 2002, 40, 133–146. [Google Scholar] [CrossRef]
- English, L.P. Improving Data Warehouse and Business Information Quality: Methods for Reducing Costs and Increasing Profits; John Wiley & Sons, Inc.: Hoboken, NJ, USA, 1999. [Google Scholar]
- Pipino, L.L.; Lee, Y.W.; Wang, R.Y. Data quality assessment. Commun. ACM 2002, 45, 211–218. [Google Scholar] [CrossRef]
- Leal, G.d.S.S.; Guédria, W.; Panetto, H. Interoperability assessment: A systematic literature review. Comput. Ind. 2019, 106, 111–132. [Google Scholar] [CrossRef]
- Li, Y.; Zheng, K.; Liu, S. Semantic Interoperability in Healthcare: A Systematic Literature. Available online: https://pubmed.ncbi.nlm.nih.gov/35103230/ (accessed on 2 January 2023).
- Pliatsios, A.; Kotis, K.; Goumopoulos, C. A systematic review on semantic interoperability in the IoE-enabled smart cities. Internet Things 2023, 22, 100754. [Google Scholar] [CrossRef]
- Afnor, N. Terminologie relative à la fiabilité-maintenabilité-disponibilité. NF X 1988, 60, 500. [Google Scholar]
- Brodt, B. Eclipse BPMN2 Modeler|The Eclipse Foundation. 2022. Available online: https://www.eclipse.org/bpmn2-modeler/ (accessed on 13 December 2023).
- ERP Agroalimentaire InteGraal AGRO, Progiciel, Logiciel. s. d. Available online: https://www.a-g-i.fr/integraal-agro.html (accessed on 2 January 2023).
- Neghab, A.P.; Etienne, A.; Kleiner, M.; Roucoules, L. Performance evaluation of collaboration in the design process: Using interoperability measurement. Comput. Ind. 2015, 72, 14–26. [Google Scholar] [CrossRef]
- Rezaei, R.; Chiew, T.K.; Lee, S.P.; Aliee, Z.S. Interoperability evaluation models: A systematic review. Comput. Ind. 2014, 65, 1–23. [Google Scholar] [CrossRef]
- Ducq, Y. Contribution à Une Méthodologie D’analyse de la Cohérence des Systèmes de Production dans le Cadre du Modèle GRAI. Ph.D. Thesis, Bordeaux 1, Talence, France, 1999. [Google Scholar]
- Cardoso, J.; Sheth, A.; Miller, J.; Arnold, J.; Kochut, K. Quality of service for workflows and web service processes. J. Web Semant. 2004, 1, 281–308. [Google Scholar] [CrossRef]


Disclaimer/Publisher’s Note: The statements, opinions and data contained in all publications are solely those of the individual author(s) and contributor(s) and not of MDPI and/or the editor(s). MDPI and/or the editor(s) disclaim responsibility for any injury to people or property resulting from any ideas, methods, instructions or products referred to in the content. |
© 2024 by the authors. Licensee MDPI, Basel, Switzerland. This article is an open access article distributed under the terms and conditions of the Creative Commons Attribution (CC BY) license (https://creativecommons.org/licenses/by/4.0/).