Abstract
Research Octane Number (RON) is one of the primary indicators for the determination of the resistance of gasoline fuels to autoignition. This parameter is usually determined with a test procedure involving a standardized engine that requires expensive hardware and time-consuming tests. In this work, a set of different methods with which to determine the RON of gasoline fuel surrogates is presented, considering only computer simulations, which allows to reduce both cost and time for the evaluation. A palette of 11 chemical species has been chosen as the basis for the surrogates’ database, which will be investigated in the work, allowing the representation of the complex chemical formulation of fuels in an easier way. A simplified zero-dimensional engine model of the standard variable compression ratio is used to provide pressure and temperature, then employed to calculate RON. This is done first by means of existing methods, and then by introducing new processes concerning a simplified chemical reactor built on kinetic schemes. Finally, these different methodologies are tested against a molar weighted sum of RONs of each chemical specie, allowing to have a criterion for comparison and evaluating their real prediction capabilities.
1. Introduction
Greenhouse gases, regarded as responsible for the dangerous phenomenon occurring in the ozone layer in the atmosphere, are becoming increasingly regulated from current and future legislations. Even though there are no target limitation (as in the case of other pollutant species, e.g., NOx) and only warnings, which can be overcome by paying an additional tax according to the amount of produced carbon dioxide at the tailpipe, car manufacturers are pushing towards the improvement of thermal engine efficiency, which is the main influencing parameter in minimizing CO2 emissions throughout the operating map. To this aim, besides the different technological solutions that have been introduced over decades, e.g., downsizing, downspeeding, and non-conventional new combustion concepts, the application of higher Compression Ratio (CR) in order to significantly increase the engine thermal efficiency (which is the lower among the contributions to the overall) should be considered. Unfortunately, high CR leads to the increase in in-cylinder pressure and temperature values, which can easily trigger knocking autoignition phenomena when dealing with spark ignition engines. It must be reported that different system solutions have been proposed in order to allow regular combustion in high-CR SI engines, such as the use of water injection, and the application of super-high gasoline injection pressure. With respect to the former, Boretti [1] has published a numerical study in which it is shown that in direct injection engines (high load × 2000 r/min operations) the injection of water upstream of the intake port can suppress the knock onset in a SI engine from CR13 up to CR15. Kim et al. [2] have conducted experiments showing that the direct injection of water into the cylinder allows to run both part-load × 1500 r/min and full load × 2000/3000 r/min operations in a CR13.5 SI engine due to the improved knock tolerance. Concerning the second system solution, Kaminaga et al. [3] performed a simulation analysis based on the Mazda’s Skyactiv-X engine specifics that reveal the potential of super-high gasoline injection pressure (700–1200 bar) in providing a significant boost to mixing and flame speed, resulting in the possibility of applying large spark timing delay without knock occurrence for CR up to 17. Despite the fact that those are promising and attractive solutions, their employment deals with the introduction of significant complexity in the powertrain. Moreover, it must be considered that currently, to the best knowledge of the authors, only Magneti Marelli can provide gasoline injection systems operating at the injection pressure described in [3]. As a consequence, work directly focusing on the anti-knock properties of the fuel supplied at the pump can be a suitable solution through which to comply with large-scale production engines designed with relatively high CR. Therefore, the chemical composition of fuels is of fundamental importance: for each gasoline, a test is performed in order to determine its auto ignition resistance. Results are then compared to standardized values, obtaining an index which states how the fuel behaves if thermodynamic conditions during combustion phase arise too much. This analysis is of fundamental importance due to the fact that a gasoline showing higher opposition against detonation is more suitable for applications where CR value is pushed up, reducing the possibility of knock occurrence and preserving the engine from stresses and premature mechanical failure.
Research [4] and Motored [5] methods (specifications summarized in Table 1) are those used to obtain the RON (Research Octane Number) and MON (Motored Octane Number), which are indexes that describe the behavior of fuels in terms of detonation, and to make observations on the CR theme. Standard practice is to assign to iso-Octane (iso-Alkane with eight carbon atoms disposed in a branched configuration) RON and MON equal to 100, whilst RON and MON equal to 0 are assigned to n-Heptane (linear Olefine with seven carbon atoms). The actual value of the index for the fuel under investigation is found to be the one characteristic of a mixture of iso-Octane and n-Heptane (usually called Primary Reference Fuel (PRF)) which has the same behavior in terms of detonation. PRFs [6] are blends obtained by mixing the two chemical species previously introduced, and depending on their percentage (in liquid volume), a value of the Octane Numbers (ON) is assigned, allowing for a scale of RON indexes with which to compare tested fuels. In practice, a standard test is the one adopted to determine those indexes, where a single cylinder engine, the CFR engine [4,5] (Cooperative Fuel Research), whose geometrical parameters are fixed, is fed with the fuel and left to run up to the onset of knock phenomenon.

Table 1.
Standard test conditions for RON and MON measurements from [4,5].
This procedure, even if is the standardized one and the one used in practice, needs both a facility where the CFR engine is installed and the fuel is analyzed, and for tests to be run in the right way, which takes time to perform. For these reasons, a different approach has been investigated, in particular for determining RON for different fuels, given their chemical composition and based on chemical reaction simulations. The use of combined experimental and numerical methods for a better understanding of the phenomena underlying autoignition of gasoline fuel is a topic that has been investigated by researchers, mainly with the target of mitigating knock events [7]. On the other hand, in the present work, the focus is mainly directed towards a better understanding and predictability of the octane rating value, with respect to the chemical composition of a specific fuel, in order to reduce the effort required for the complete experimental characterization of research blends, increasing the range of possible combinations to be evaluated a-priori.
To this purpose, surrogates are introduced to emulate the behavior of real fuels [8], allowing to reduce their chemical complexity. In fact, these mixtures are composed of different species put together in various percentages, obtaining final surrogate composition and making it possible to analyze and compare their characteristics with those of real gasolines. In this work, a palette of 11 basic chemical species has been chosen to build the final list of blends, on which an analysis on the feasibility of pre-existing methods to determine Octane Number is performed. In particular, above all of them (chemical kinetic approaches, three-dimensional CFD (Computational Fluid Dynamics) simulations, etc.), it has been decided to investigate the method presented by Westbrook et al. [9]. In this method, different single species and blends have been analyzed, taking advantage from a precise kinetic mechanism, and allowing to obtain autoignition times that are then compared with those characterizing Primary Reference Fuels (PRFs) in order to obtain the RON index. This methodology, which later on has also been tested with the surrogates introduced in the current work, has two main drawbacks (not considering the issues related to the intrinsic errors produced by the kinetic scheme). The first is related to the issue that ON calculation could be affected by the fact that pressure/temperature/time data used to drive the kinetic cycle could not be the factors characterizing the engine environment in which the tested blend is expected to work. This could lead to errors, especially for those mixtures with a knock resistance behavior different from the one related to the fuel used to provide thermodynamic (pressure and temperature) traces. The second drawback is related to the fact that this methodology is not capable of studying different engine cycles in the same way, given the impossibility of changing engine-related parameters such as rotational speed or compression ratio. Subsequently, trying to overcome the already mentioned set of problems related to some of the available techniques to determine the RON value, a new model updated and tailored to a specific chemical kinetic mechanism is introduced, and its performance is compared with the results previously obtained.
2. Methodology
2.1. Zero-Dimensional Engine Thermodynamics Model
The backbone of the work is the zero-dimensional engine model that has been built with the aim to emulate a real CFR engine, and in particular determine pressure and temperature traces needed in the application of the RON calculation methods. The model solves the internal energy balance applied to the combustion chamber as a closed thermodynamic system by employing the Euler forward method in order to solve the first order time derivatives. Woschni’s model [10] has been implemented to take into account the contribution of the wall heat transfer, whilst Wiebe’s [11] function has been adopted in order to account for the positive heat release due to combustion. Modeling is applied to the closed valves phase of the cycle IVC-EVO (Intake Valve Closing-Exhaust Valve Opening), thus, the trapped mass inside the cylinder can be reasonably assumed as constant. Once the energy balance is resolved, the pressure is calculated according to the perfect gas law. Given the fact that the fresh mixture is actually the focus of the study, a pseudo-2-zones model [12] is introduced in order to approach the burnt and the unburnt gases separately, allowing to estimate the temperature of the latter. The model has been implemented in an in-house code written in Python3, coupled with the Cantera library [13] for temperature-dependent mixture properties evaluation and the simulation of the chemical reactors. The relevant geometric parameters of the engine have been taken from [14], and they are listed in Table 2.
Table 2.
Main geometric features of the CFR engine from [14].
In order to tune the two main parameters of the Wiebe function (one correlated with the combustion efficiency and the other with the combustion shape), iso-Octane was taken as reference fuel and the CR of the CFR was set equal to 7.55. The validation at those reference conditions [14] is shown in Figure 1. This is the starting point of the study because, as will be discussed later, the compression ratio will vary (and thus, the pressure and temperature curves) according to the specie or surrogate to be investigated up to the trigger of knock. The latest consideration on the engine model involves the determination of the surrogate’s thermodynamic properties, as Lower Heating Value (LHV) and heat capacity cp and cv, calculated using a simplified chemical reactor [13], each time fed with the different initial composition of the mixture.
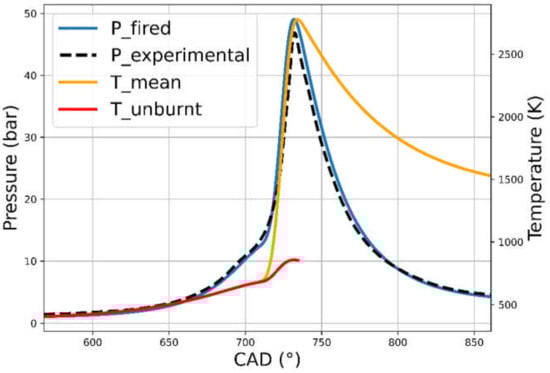
Figure 1.
Comparison between modeled (blue) and experimental (dashed black) pressure curves for the CFR engine. The modeled burning and the fresh mixture temperature are also shown.
2.2. Kinetics Scheme and Chemical Reactor
A further step towards the achievement of the final goal is to select the 11 species used to build the surrogate dataset. As listed in Table 3, the palette includes alkanes, olefines, alcohols, aromatics, and naphthenes, whose mutual mixing in different configurations define a final dataset of 98 surrogates. For a complete description of the set, refer to [15,16,17]. Kinetic schemes containing both reactions and chemical elements are used to process species and surrogates, mainly to compute auto-ignition used to predict the knock insurgence during the engine cycle. In this work, two different schemes are used:
- CRECK_2003_TOT_HT_LT_NOX, which includes 537 species and 18,250 reactions [18,19,20];
- Reduced_279, derived from the previous one by adopting reduction method DRGEP + SA [21] on 20 operative points, achieving 279 species and 8367 reactions.
Table 3.
Palette of the chemical species chosen for chemical kinetics simulations and their properties.
Table 3.
Palette of the chemical species chosen for chemical kinetics simulations and their properties.
| Component (Formula) | Class | RON/MON (-) | LHV/HHV (MJ/kg) | SAFR 1 (-) |
|---|---|---|---|---|
| i-Octane (iC8H18) | i-Alkanes | 100/100 | 44.61/48.07 | 15.028 |
| n-Pentane (nC5H12) | n-Paraffins | 62/62 | 45.33/48.99 | 15.227 |
| n-Heptane (nC7H16) | n-Paraffins | 0/0 | 44.53/47.66 | 14.686 |
| Ethanol (C2H5OH) | Alcohols | 109/90 | 27.72/30.59 | 8.934 |
| 1-Hexene (1-C6H12) | Olefins | 76/63.4 | 44.79/47.92 | 14.686 |
| Cyclohexane (C6H12) | Naphthenes | 82.5/77.2 | 43.81/46.95 | 14.686 |
| Methylcyclohexane (C7H14) | Naphthenes | 74.1/71 | 43.72/46.86 | 14.686 |
| Toluene (C6H5CH3) | Aromatics | 118/103.5 | 40.93/42.84 | 13.414 |
| 124-Trimethylbenzene (C6H5C6H5) | Aromatics | 107.4/97.9 | 41.31/43.38 | 14.686 |
| 1-Pentene (1-C5H10) | Olefins | 90/77.1 | 44.81/47.95 | 15.227 |
| n-Decane (nC10H22) | n-Paraffins | −15/0 | 45.33/48.99 | 15.0 |
1 SAFR is the stoichiometric air-to-fuel ratio.
The two schemes have been validated against data found in literature [6], both for the pure species and surrogate mixtures, as shown in Figure 2. The validation in Figure 2 reports the Ignition-Delay Time (IDT) for i-Octane (PRF100), n-Heptane (PRF0), and different of their PRF combinations characterized by RON 90, 80, 60, respectively. A nice agreement of both the complete (solid) and the reduced (dashed) scheme with respect to experimental measure can be seen along the high-temperature region and the so called Negative Temperature Coefficient (NTC) region, whilst a slight prediction performance degradation is observed in the low-temperature region. Whilst in the high-temperature region, the complete scheme and the reduced scheme are comparable, and the reduced scheme (dashed lines) can capture the experimental NTC region with improved accuracy, leading to a greater reliability in the temperature range of more interest for the unburnt mixture around typical spark advance timings.
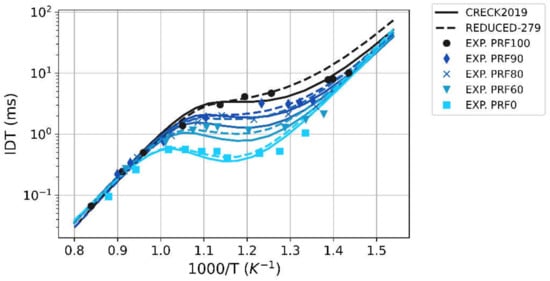
Figure 2.
Comparison between experimental (markers) and simulated (lines) ignition-delay time vs. inverse temperature for different PRF surrogates. Simulation results from the complete kinetics scheme are solid lines, those from the reduced scheme are dashed lines.
To simulate knock events, a chemical reactor has been used. Its implementation was possible thanks to Cantera [13], an open-source suite containing tools mainly used in the resolution of problems involving chemical kinetics and thermodynamics, perfectly matching the combustion and knock analysis hereby performed. This is the simplest form of representing a chemical reacting system for identifying the auto-ignition of certain species or surrogates, given initial conditions for pressure, temperature, and composition. In practice, each surrogate requires a simulation to be run, starting from the set-up of the reactor, which is fed with mixture initial composition together with the oxidizer (in this case O2 + N2). At the beginning of the process, the tested blend is found to be in initial pressure and temperature conditions, and at each simulation step these parameters are updated following the chemical reactions included in the kinetic scheme, up to the onset of detonation.
However, in order to improve the accuracy and in particular to include the CR variation in the analysis of each surrogate, the reactors are paired with the previously introduced engine model, using its output traces (pressure-temperature) to provide the behavior of the mixture. The basic idea consists in dividing each engine simulation interval (to which correspond a value of pressure and fresh mixture temperature provided by the CFR model) into a smaller set of instants, and then perform a chemical simulation for which the thermodynamic conditions of the gas are initialized as those of the engine simulation initiate, up to occurrence of autoignition. This updated method allows an easier CR change, with consequent modification of the pressure and temperature traces, depending on the kind of surrogate that is observed (a value of CR could be the factor causing autoignition for a mixture, but could be too low to bring to the same results for another factor). The complete procedure is described in the chapter dedicated to the results presentation, while a brief description of the passages involved in the CR modification is shown in Figure 3, in which xU is the generic unburnt mixture fraction and xK is the mass fraction that can trigger knock in the CFR engine, and if available into the combustion chamber as fresh charge for a time longer than the calculated auto-ignition delay. As mentioned in Section 2.1, the engine threshold value xK was defined by checking the xU value at the auto-ignition delay time after spark timing for the i-Octane reference condition CR = 7.55. To have a more robust set of results, reactors are built and tested with both kinetic schemes, highlighting some differences that will be discussed later.
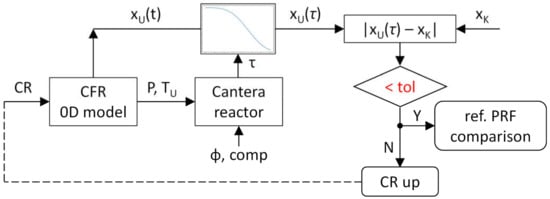
Figure 3.
Workflow of the thermodynamics-chemical kinetics algorithm for the CR up-driven RON numerical estimation.
3. Results
In this section, results are shown method by method firstly, then are compared with each other. For the sake of improved readability, 19 surrogates have been chosen to represent the whole dataset. However, apart from the figures, the data shown in the tables involve all 98 surrogates, available in the Supplementary Data. The interested reader can refer to the support material to visualize the complete results.
3.1. Weighted Sum
The first method presented to determine RON is the already known linear-by-mole blending rule [22,23], also taken as a reference to measure accuracy of the following calculation procedures, the latter being a widely adopted option in the literature if PRFs are considered. The first approach would be the determination of Octane Number based on a weighting by liquid volume fraction, introducing errors especially when the number of compounds are high and their percentages are small, as illustrated by [23]. Given the fact that fuels react in the gaseous phase and not in the liquid, the liquid-by-volume weighted sum is replaced with a linear-by-mole blending rule based on molar fraction and the ON of each component. This second method proved to be more accurate, especially when Ethanol is part of the surrogate, fixing the large non-linearities introduced by the liquid volume rule. For the surrogates taken as representative for the whole set, results are shown in the parity plot in Figure 4. It is visible that the simple and fast use of the blending rule allows for a nice correlation between experimental and calculated RON (R2 coefficient = 0.81), with most of the reported 19 surrogates lying in the 2% RON error.
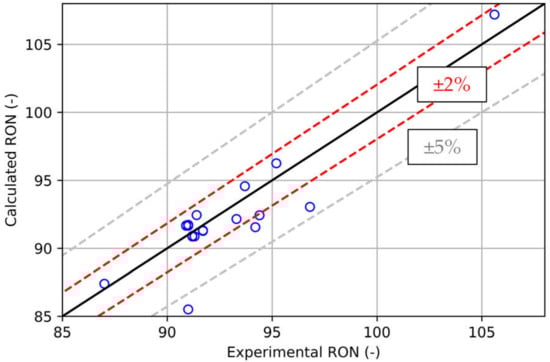
Figure 4.
Parity plot for the RON calculated by means for the blending rule against experiments.
3.2. Reactor: P,T from Reference vs. P,T from Engine Thermodynamics Model
The second test performed to obtain Octane Number takes into account the Cantera chemical reactor previously introduced. Firstly, pressure and temperature traces are taken from the study of Westbrook [9] from real engine tests similar to the standardized procedure [4], and they are considered fixed regardless of the surrogate under investigation. The fuel used is a mixture (E30 [24]) of gasoline (70% vol) and ethanol (30% vol) such that pressure and temperature are high enough to ensure detonation for all the surrogates involved in the present work. The equivalence ratio is set to 1.1 to emulate a slightly fuel-rich condition, while the rotational speed is maintained at 600 r/min as described in the standards. The only parameter that changes with respect to ASTM [4] is the intake air temperature, fixed at 32 °C (vs. the 52 °C characteristic of standardized tests). In order to compensate this, the intake pressure is maintained slightly below atmospheric. The interested reader can refer to [9,24] for the complete problem setup and development. Since in this approach option (reactor simulations) the engine parameters are fixed (including CR), the only parameter available to determine the RON is the autoignition time.
As a consequence, this characteristic is computed for each surrogate and then compared to PRFs; the results are shown in Figure 5 (the 19 selected surrogates are the blue points, the PRFs are the black points) for the reactor built employing the reduced scheme only. Correlation with PRFs has been performed after interpolating up to a value of RON equal to 120, with a denser step to obtain better results. The dependence of the results on the kinetic schemes is visible, which affect the final values obtained, especially for those surrogates containing particular species, as better described in the following.
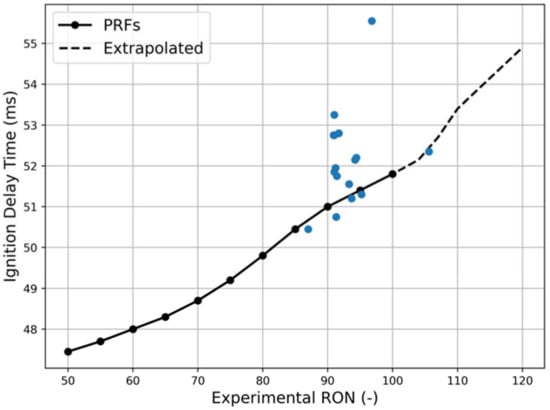
Figure 5.
Comparison between the auto ignition delay time calculated with the reactor approach for the 19 test surrogates (blue points) and the PRFs (black points) against the associated experimental RON. P, T input from reference conditions, method: Cantera reactor simulation.
For the sake of comparison, the reactor simulation was also applied by providing pressure and temperature traces from the zero-dimensional engine model developed, as described in Section 2.1. It must be underlined that in this case all the geometrical parameters are fixed, except for the compression ratio, which is variable according to the CFR test and directly influences the results. In order to find a starting point for the entire procedure, the first test is performed with i-Octane and a CR value equal to 7.55. This allows to find a value of residual unburnt fresh mixture in the chamber when the detonation occurs, which is the parameter taken as the guideline for different combinations of fuel/CR. Tests with the chemical reactor have been carried out both with the reduced and with the complete kinetic scheme, highlighting some important aspects mostly related to the schemes themselves, greatly affecting the results obtained. To relate the CR values found during simulations to RON, the PRFs have also been tested, and results are also in this case extrapolated up to RON = 120. As it can be seen from Figure 6, the whole set of single species is not well processed by the kinetic schemes, e.g., 1-Hexene (red) has a strong influence on the final results obtained with the reactor for both the adopted schemes.
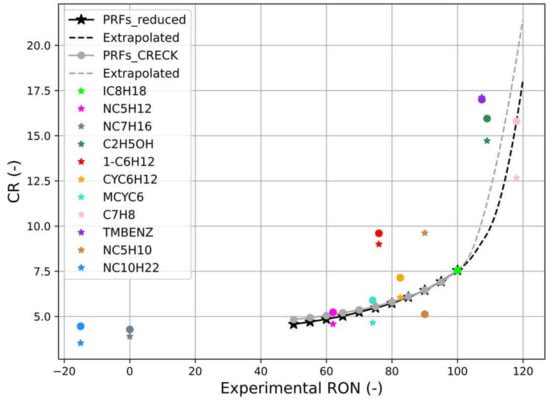
Figure 6.
Correlation between calculated CR at knock conditions and experimental RON for PRFs and pure species performed with the complete (points) and reduced (stars) kinetics schemes. P, T input from engine model; method: Cantera reactor simulation.
This consideration is confirmed by the validation process performed on chemical species, available in the SUPPORT MATERIAL. Figure 7 shows simulation results obtained with the reduced scheme (black + orange) and with the complete one (gray + blue) for the 19 surrogates taken as reference. It is visible how some surrogates have a more favorable behavior, while others are heavily influenced by kinetics. In particular, it has been noticed that the surrogates performing the worst are those with a content of 1-Hexene greater than 20 mol.%.
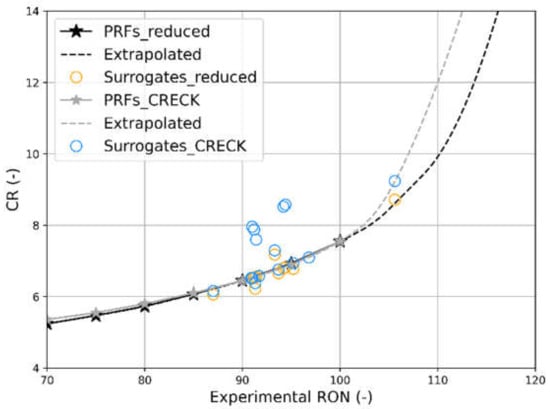
Figure 7.
Correlation between calculated CR at knock conditions and experimental RON for PRFs and the 19 test surrogates performed with the complete (points) and reduced (stars) kinetics schemes. P, T input from engine model; method: Cantera reactor simulation.
3.3. Comparison
For the sake of comparison, Table 4 reports some metrics for the prediction performance analysis of the presented methods. Analyzing Table 4, some considerations can be deduced. First, linear-by-mole blending rule is confirmed to be a valid alternative to investigate RON values without having a real CFR engine available. This is also the reason why results obtained with this rule are taken as a reference parameter for the evaluation of the accuracy of the other methodologies. Then, it is important to underline the fact that all the processes involving chemical reactor simulations are affected by the adopted kinetic schemes. The latter observation is important when comparing RON values with the ones obtained using the blending rule. As a matter of fact, the best strategy among the ones introduced in this work is the employment of the chemical reactor associated to the reducer kinetic scheme, allowing to obtain results that in general are similar to the ones achieved with the weighted sum, or even better. Focusing on the reactor simulations, from Table 4 it is visible that the reduced scheme allows to obtain better results, even if it is a sub scheme obtained from the complete one. This could be attributed to the error compensation given by the reduction in reactions and species. In particular, removing part of the chemical processes involving 1-Hexene could lead to a lesser influence of this specie in the final behavior of the surrogates, meaning that, in general, Octane Number is better calculated using this approach.
Table 4.
Palette of the chemical species chosen for chemical kinetics simulations and their properties.
The results listed in Table 4 are summarized in the error distribution functions shown Figure 8, with respect to the Error (measured RON–calculated RON). The comparison between the orange and the green curves poses emphasis on the dramatic importance of using pressure-temperature conditions tailored with respect to the test fuel, underlining the importance of the coupling with the CFR thermodynamics model.
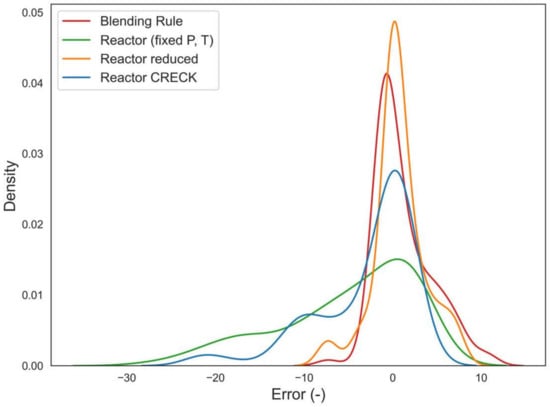
Figure 8.
Absolute error distribution (Calc–Exp of RON) for the tested methods: blending rule (red), reactor with reduced scheme and P, T from ref. (green), reactor with reduced scheme and P, T from the engine model (orange), reactor with complete scheme and P, T from the engine model (blue).
Furthermore, comparing the orange and the blue curve, one can show the influence of the kinetics schemes given the thermodynamics engine approach. It is visible that both the blue and the green curves produce a significant amount of overestimated data, whilst the red and the orange curve are in line with the classic bell-shaped curves, and the orange curve is characterized by a larger set of data predicted with excellent performance (error around zero). Finally, all the above-mentioned processes must be also compared with respect to another parameter useful for optimization problems: simulation time (Table 5).
Table 5.
Comparison between the computation time of the tested methods.
Apart from the blending rule, which is only a weighted sum, all the other methods require a time that is not null in order to obtain desired results. As mentioned before, the influence of the kinetics schemes is quite strong, resulting in different simulation durations. In particular, the complete CRECK scheme is the one taking longer to complete a run, depending on the fact that a higher number of reactions and species are involved, while its reduction is faster in obtaining results, as shown in Table 5. It is also important to underline that the first method, even involving the reactor, does not take a lot to perform a simulation because pressure and temperature are already available, while in the other cases, the simulation duration is also affected by the engine thermodynamics simulation (approximately 14 s).
As already discussed, the kinetics schemes affect the accuracy of the previously cited methods in calculating RON values. Considering the best modeling calculation option (reactor with reduced scheme and input P, T from the CFR thermodynamics model) a brief process is introduced to perform a correction, trying to compensate errors introduced in the chemical reactors. Firstly, the RON values of pure species are obtained from the reactor and the reduced scheme and compared with the real measured values, searching for under/over estimation points. Then, for each test surrogate and PRF, the RON previously calculated by means of the aforementioned best reactor configuration (RON*) is corrected by KRON (Equation (1)), depending on the evaluated under/over estimation (ε, absolute error as defined in Figure 8) and on the moles amount (x) of each component (Equation (2)).
RON = RON* + KRON
As a result, the correction factor operates a RON linear compensation weighted (W) on the presence of the components whose RON as pure species is not well captured. The weights were tuned, giving more emphasis to the components associated with the most significant RON mismatch in the case of pure species, leading to a value of 10 for toluene, 0.2 for ethanol, and 0.1 for the remaining components in the palette. Adopting the final methodology, the error distributions shown in Figure 9 are achieved.
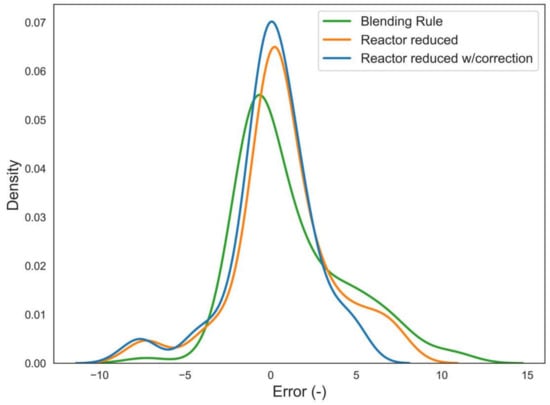
Figure 9.
Effect of the tuned correction on the error (Calc–Exp of RON) distribution of reactor simulations in comparison with the reference blending rule.
It can be observed that both the reactor simulations feature a peak of the error distribution at zero error, whilst the peak of the blending rule is slightly shifted towards RON differences around 1.5. Furthermore, after the application of the tailored correction, the data amount predicted at almost zero error is larger than that observed for the basic reactor simulation, and the positive error branch is approach zero density around error equal to seven, underlining that the correction factor contributed to obtaining the greater reduction in the maximum over-estimation.
4. Conclusions
In the present work, alternative methodologies via which to measure Octane Number for a general gasoline fuel surrogate have been presented. Starting from a palette of 11 chemical species, the methods have been validated against a dataset of 114 blends for which experimental data from the CFR engine are available. Starting from the well-known blending rule, based on a weighted sum of Octane Numbers belonging to each surrogate component, it has been possible to set a comparison meter to evaluate performances of all the methods presented. Chemical reactors have been created to simulate a real combustion chamber, allowing to emulate the behavior of fuel according to thermodynamic conditions and to predict the occurrence of detonation, which is fundamental to consider, especially when dealing with SI engines. A zero-dimensional simplified engine thermodynamics model has been built to extract pressure and temperature curves (of the fresh mixture), allowing to relate knock phenomenon with compression ratio (which in the model is variable) and the nature of the surrogate. In particular, higher compression ratio values are found for those surrogates containing anti-detonation components (aromatics and alcohols) to whom a higher value of RON has been measured. The results analysis revealed that the reactor simulation is dramatically sensitive to the chosen kinetics scheme. However, once the palette of the most significant species has been identified and some of their combinations tested and validated on fundamental experimental data, this concern can be addressed by making a sufficient effort towards the initial evaluation regarding the possible kinetics schemes. A strong sensitivity to the initial pressure-temperature data input to the reactor was also discovered, thus, the importance of using both reactor simulations and engine CFR thermodynamics simulation was enhanced. The final proposed methodology is a combination of the CFR engine thermodynamics simulations, reactors simulations in Cantera environment (which relies on carefully tested chemical schemes), and the application of a results analysis-driven correction aimed at damping the negative impact on the mixture Octane Number of some specifical species. The application of the proposed methodology has led to a significant improvement of the prediction performance of the RON value of fuel mixtures, with respect to the widely adopted blending rule based on the moles weighted average. In particular, the error distribution comparison highlighted a larger number of surrogates predicted with near-zero error and a more limited set of data affected by significant underestimation. Eventually, the same modelling methodology developed for the CFR engine simulation coupled with detailed chemistry-based knock model is expected to be successfully applicable under more varied operating conditions for the co-optimization of fuel surrogate and engine specification. Future perspectives of the present work deal with the estimation of the auto-ignition delay by means of neural network techniques trained on the presented chemical kinetics simulations, then provided as input to the Livengood-Wu literature correlations aiming at faster knock onset detection integrated in the CFR engine thermodynamics model. This combined technique, based on the mutual support between networks—which are charged to capture complex and highly non-linear dependence and correlations—and which relies on fast and simple calculation, has been already applied successfully by some of the present authors to approach the prediction of properties such as the liquid phase diffusion coefficient of mixtures [25,26].
Supplementary Materials
The following supporting information can be downloaded at: https://www.mdpi.com/article/10.3390/fuels3020014/s1, Figure S1: Ignition Delay Time Isooctane; Figure S2: Ignition Delay Time n-Pentane; Figure S3: Ignition Delay Time n-Heptane; Figure S4: Ignition Delay Time Ethanol; Figure S5: Ignition Delay Time 1-Hexene; Figure S6: Ignition Delay Time Cyclohexane; Figure S7: Ignition Delay Time Methylcyclohexane; Figure S8: Ignition Delay Time Toluene; Figure S9: Ignition Delay Time 124-Trimethylbenzene; Figure S10: Ignition Delay Time 1-Pentene; Figure S11: Ignition Delay Time n-Decane; Figure S12: Ignition Delay Time prf80; Figure S13: Ignition Delay Time prf90; Figure S14: Ignition Delay Time Surrogate A; Figure S15: Ignition Delay Time Surrogate B; Figure S16: Ignition Delay Time Surrogate C. References [27,28,29,30,31,32,33,34,35,36,37,38] are cited in the Supplementary Materials.
Author Contributions
Conceptualization, L.P.; methodology, L.P., C.F., V.M. and G.M.B.; software, L.P. and D.L.; validation, L.P. and D.L.; formal analysis, L.P., D.L. and V.M.; investigation, L.P. and D.L.; resources, C.F., S.F. and G.M.B.; writing—original draft preparation, D.L. and V.M.; writing—review and editing, L.P., C.F., S.F. and G.M.B.; visualization, L.P., D.L. and V.M.; supervision, C.F., S.F. and G.M.B. All authors have read and agreed to the published version of the manuscript.
Funding
This research received no external funding.
Institutional Review Board Statement
Not applicable.
Informed Consent Statement
Not applicable.
Data Availability Statement
Data used for this study are available in the Supplementary Materials.
Conflicts of Interest
The authors declare no conflict of interest.
References
- Boretti, A. Water injection in directly injected turbocharged spark ignition engines. Appl. Therm. Eng. 2013, 52, 62–68. [Google Scholar] [CrossRef]
- Kim, J.; Park, H.; Bae, C.; Choi, M.; Kwak, Y. Effects of water direct injection on the torque enhancement and fuel consumption reduction of a gasoline engine under high-load conditions. Int. J. Engine Res. 2016, 17, 795–808. [Google Scholar] [CrossRef]
- Kaminaga, T.; Yamaguchi, K.; Ratnak, S.; Kusaka, J.; Youso, T.; Fujikawa, T.; Yamakawa, M. A Study on Combustion Characteristics of a High Compression Ratio SI Engine with High Pressure Gasoline Injection. In Proceedings of the 14th International Conference on Engines & Vehicles, Capri, Napoli, Italy, 15–19 September 2019. [Google Scholar]
- ASTM Standard D2700; Standard Test Method for Motor Octane Number of Spark Ignition Engine Fuel. Annual Book of ASTM Standards; ASTM: West Conshohocken, PA, USA, 2004.
- ASTM Standard D2699; Standard Test Method for Research Octane Number of Spark-Ignition Engine Fuel. Annual Book of ASTM Standards; ASTM: West Conshohocken, PA, USA, 2004.
- Fieweger, K.; Blumenthal, R.; Adomeit, G. Self-Ignition of S.I. Engine Model Fuels: A Shock Tube Investigation at High Pressure. Combust. Flame 1997, 109, 599–619. [Google Scholar] [CrossRef]
- Kim, N.; Vuilleumier, D.; Sjöberg, M.; Yokoo, N.; Tomoda, T.; Nakata, K. Using Chemical Kinetics to Understand Effects of Fuel Type and Compression Ratio on Knock-Mitigation Effectiveness of Various EGR Constituents. SAE Int. J. Adv. Curr. Prac. Mobil. 2019, 1, 1560–1580. [Google Scholar]
- Cai, L.; Pitsch, H. Optimized chemical mechanism for combustion of gasoline surrogate fuels. Combust. Flame 2015, 162, 1623–1637. [Google Scholar] [CrossRef] [Green Version]
- Westbrook, C.K.; Sjöberg, M.; Cernansky, N.P. New Chemical Kinetic Method of Determining RON and MON Values for Single Component and Multicomponent Mixtures of Engine Fuels. Combust. Flame 2018, 195, 50–62. [Google Scholar] [CrossRef]
- Woschni, G.A. A Universally Applicable Equation for the Instantaneous Heat Transfer Coefficient in the Internal Combustion Engine. SAE Trans. 1967, 76, 3065–3083. [Google Scholar]
- Ghojel, J.I. Review of the development and applications of the Wiebe function: A tribute to the contribution of Ivan Wiebe to engine research. Int. J. Engine Res. 2010, 11, 297–312. [Google Scholar] [CrossRef]
- Verhelst, S.; Sheppard, C. Multi-zone thermodynamic modelling of spark-ignition engine combustion—An overview. Energy Convers. Manag. 2009, 50, 1326–1335. [Google Scholar] [CrossRef] [Green Version]
- Cantera. Available online: https://cantera.org/ (accessed on 4 March 2022).
- Pal, P.; Kolodziej, C.; Broatch, A.; Gomez-Soriano, J. Development of a Virtual CFR Engine Model for Knocking Combustion Analysis. SAE Int. J. Engines 2018, 11, 1069–1082. [Google Scholar] [CrossRef]
- Li, R.; Herreros, J.M.; Tsolakis, A.; Yang, W. Integrated machine learning-quantitative structure property relationship (ML-QSPR) and chemical kinetics for high throughput fuel screening toward internal combustion engine. Fuel 2021, 307, 121908. [Google Scholar] [CrossRef]
- Correa Gonzalez, S.; Kroyan, Y.; Sarjovaara, T.; Kiiski, U.; Karvo, A.; Toldy, A.I.; Larmi, M.; Santasalo-Aarnio, A. Prediction of Gasoline Blend Ignition Characteristics Using Machine Learning Models. Energy Fuels 2021, 35, 9332–9340. [Google Scholar] [CrossRef]
- Yuan, H. Octane Blending and Oxidation Chemistry of Ethanol-Hydrocarbon Mixtures. Ph.D. Thesis, University of Melbourne, Melbourne, VIC, Australia, 9 March 2018. [Google Scholar]
- Ranzi, E.; Frassoldati, A.; Stagni, A.; Pelucchi, M.; Cuoci, A.; Faravelli, T. Reduced kinetic schemes of complex reaction systems: Fossil and biomass-derived transportation fuels. Int. J. Chem. Kinet. 2014, 46, 512–542. [Google Scholar] [CrossRef]
- Ranzi, E.; Frassoldati, A.; Stagni, A.; Pelucchi, M.; Cuoci, A.; Faravelli, T. New reaction classes in the kinetic modeling of low temperature oxidation of n-alkanes. Combust. Flame 2015, 162, 1679–1691. [Google Scholar] [CrossRef]
- Bagheri, G.; Ranzi, E.; Pelucchi, M.; Parente, A.; Frassoldati, A.; Faravelli, T. Comprehensive kinetic study of combustion technologies for low environmental impact: MILD and OXY-fuel combustion of methane. Combust. Flame 2020, 212, 142–155. [Google Scholar] [CrossRef]
- Niemeyer, K.E.; Sung, C. Reduced Chemistry for a Gasoline Surrogate Valid at Engine-Relevant Conditions. Energy Fuels 2015, 29, 1172–1185. [Google Scholar] [CrossRef] [Green Version]
- Vom Lehn, F.; Cai, L.; Tripathi, R.; Broda, R.; Pitsch, H. A property database of fuel compounds with emphasis on spark-ignition engine applications. Appl. Energy Combust. Sci. 2021, 5, 100018. [Google Scholar] [CrossRef]
- Knop, V.; Loos, M.; Pera, C.; Jeuland, N. A linear-by-mole blending rule for octane numbers of n-heptane/iso-octane/toluene mixtures. Fuel 2014, 115, 666–673. [Google Scholar] [CrossRef]
- Sjöberg, M.; He, X. Combined effects of intake flow and spark-plug location on flame development, combustion stability and end-gas autoignition for lean spark-ignition engine operation using E30 fuel. Int. J. Engine Res. 2018, 19, 86–95. [Google Scholar] [CrossRef]
- Mariani, V.; Pulga, L.; Bianchi, G.M.; Cazzoli, G. A Bayesian neural network methodology to predict the liquid phase diffusion coefficient. Int. J. Heat Mass Transf. 2020, 161, 120309. [Google Scholar] [CrossRef]
- Mariani, V.; Pulga, L.; Bianchi, G.M.; Cazzoli, G.; Falfari, S. Neural Network-Based Prediction of Liquid Phase Diffusion Coefficient to Model Fuel-Oil Dilution on Engine Cylinder Walls. SAE Int. J. Engines 2020, 13, 649–664. [Google Scholar] [CrossRef]
- Marks, B.; Mathieu, O.; Archuleta, R.; Petersen, E.; Metcalfe, W.; Curran, H.; Bourque, G. Ignition Delay Time Measurements and Modeling of n-Pentane and iso-Pentane at Elevated Pressures. In Proceedings of the 51st AIAA Aerospace Sciences Meeting including the New Horizons Forum and Aerospace Exposition, Grapevine, TX, USA, 7–10 January 2013; p. 160. [Google Scholar]
- Hartmann, M.; Gushterova, I.; Fikri, M.; Schulz, C.; Schießl, R.; Maas, U. Auto-ignition of toluene-doped n-heptane and iso-octane/air mixtures: High-pressure shock-tube experiments and kinetics modeling. Combust. Flame 2011, 158, 172–178. [Google Scholar] [CrossRef]
- Roy, S.; Hadi, F.; Askari, O. Detailed Chemical Mechanism Generation for Combustion of Ethanol-Air Mixture. In ASME International Mechanical Engineering Congress and Exposition; American Society of Mechanical Engineers: New York, NY, USA, 2019; Volume 59438, p. V006T06A005. [Google Scholar]
- Roy, S.; Askari, O. A New Detailed Ethanol Kinetic Mechanism at Engine-Relevant Conditions. Energy Fuels 2020, 34, 3691–3708. [Google Scholar] [CrossRef]
- Dong, S.; Aul, C.; Gregoire, C.; Cooper, S.P.; Mathieu, O.; Petersen, E.L.; Rodriguez, J.; Maussd, F.; Wagnone, S.W.; Kukkadapue, G.; et al. A comprehensive experimental and kinetic modeling study of 1-hexene. Combust. Flame 2021, 232, 111516. [Google Scholar] [CrossRef]
- Vranckx, S.; Lee, C.; Chakravarty, H.K.; Fernandes, R.X. A rapid compression machine study of the low temperature combustion of cyclohexane at elevated pressures. Proc. Combust. Inst. 2013, 34, 377–384. [Google Scholar] [CrossRef]
- Andrae, J.C.G. Kinetic Modeling of the Influence of Cyclohexane on the Homogeneous Ignition of a Gasoline Surrogate Fuel. Energy Fuels 2018, 32, 3975–3984. [Google Scholar] [CrossRef]
- Vasu, S.S.; Davidson, D.F.; Hong, Z.; Hanson, R.K. Shock tube study of methylcyclohexane ignition over a wide range of pressure and temperature. Energy Fuels 2009, 23, 175–185. [Google Scholar] [CrossRef]
- Andrae, J.C.; Björnbom, P.; Cracknell, R.F.; Kalghatgi, G.T. Autoignition of toluene reference fuels at high pressures modeled with detailed chemical kinetics. Combust. Flame 2007, 149, 2–24. [Google Scholar] [CrossRef]
- Liu, Y.X.; Wang, B.Y.; Weng, J.J.; Yu, D.; Richter, S.; Kick, T.; Naumannc, C.; Braun-Unkhoffc, M.; Tian, Z.Y. A wide-range experimental and modeling study of oxidation and combustion of n-propylbenzene. Combust. Flame 2018, 191, 53–65. [Google Scholar] [CrossRef] [Green Version]
- Skjoth-Rasmussen, M.; Braun-Unkhoff, M.; Naumann, C.; Frank, P. Experimental and Numerical Study of n-Decane Chemistry. In Proceedings of the 1st European Combustion Meeting, Orléans, France, 25–28 October 2003. [Google Scholar]
- Cancino, L.R.; Fikri, M.; Oliveira, A.A.M.; Schulz, C. Autoignition of gasoline surrogate mixtures at intermediate temperatures and high pressures: Experimental and numerical approaches. Proc. Combust. Inst. 2009, 32, 501–508. [Google Scholar] [CrossRef]
Publisher’s Note: MDPI stays neutral with regard to jurisdictional claims in published maps and institutional affiliations. |
© 2022 by the authors. Licensee MDPI, Basel, Switzerland. This article is an open access article distributed under the terms and conditions of the Creative Commons Attribution (CC BY) license (https://creativecommons.org/licenses/by/4.0/).