Abstract
This study examined the combined effect of torrefaction and microwave absorbers on improving biomass thermochemical characteristics and grindability for heat, power, and value-added products. Camelina straw in two grinds, ground (6.4 mm screen size) and chopped with biochar addition (0%, 10% and 20%), was torrefied in a bench-scale microwave reactor at torrefaction temperatures of 250 °C and 300 °C with residence times of 10, 15 and 20 min under inert conditions and nitrogen-activated. After torrefaction, the geometric mean particle and size distribution, moisture content, ash content, bulk and particle densities were determined, and the grinding performance values of torrefied ground and chopped with and without biochar were determined and compared with the raw camelina straw. The results showed that the geometric diameter decreased after torrefaction in both grinds. The specific energy required for grinding torrefied biomass decreased significantly with biochar addition, longer residence times, and increased torrefaction temperatures. Torrefied ground camelina straw with biochar after grinding had the lowest grinding energy of 34.30 kJ at 300 °C/20 min. The surface morphology by confocal laser scanning microscopy of torrefied camelina straw particles indicated that biochar addition (>10%) and a torrefaction temperature at 250 °C can create profound surface distortion, and beyond 300 °C, colossal surface damage and carbonized weight fractions were produced.
1. Introduction
Herbaceous biomass is endowed with the potential capacity to serve as an alternative to coal for sustainable and green energy creation. The cost of renewable energy is decreasing, making it less expensive than coal for fuel applications [1]. Canada’s energy sectors have recently improved in managing a high amount of variable renewable energy without compromising reliability. The increase in the use of renewable energy sources (28%) is projected to surpass petroleum and other liquids (27%), natural gas (22%), coal (20%), and nuclear (4%) to renewable energy the most utilized and consumed energy by 2050 [2,3]. Over the past years, Canada’s agricultural and forest residues have continued to produce renewable energy, high-value chemicals, and materials to support the bioeconomy [4]. Canada has massive untapped renewable energy resources; more than 23% of Canada’s total renewable energy production is from solid biomass. Several research investigation reports aimed to exploit renewable herbaceous materials from agricultural crop residues and forest wastes to produce solid fuel through thermochemical processes, irrespective of raw biomass or feedstock challenges [5,6]. Camelina is an energy crop with a global interest in crop by-products for bioenergy utilization. Biodiesel from camelina seed is increasing, with the majority of crop production confined to Saskatchewan (around 2000 hectares). Canada ranked second in global production, with an overall potential biodiesel yield estimated at 430 L/ha [7]. Research and development involving aviation fuel have placed camelina in an important role as a dedicated energy crop. Successful results from commercial and military airlines using camelina bio-jet fuel have indicated a significant and promising feedstock for aviation fuel and bioenergy [8,9,10]. Our previous work has shown that camelina straw has the requisite fuel properties as a co-combustion material with coal in a coal-fired plant. More research investigations and development with camelina straw for biorefinery, which support the bioeconomy, are ongoing within our research group [11].
Thermochemical pretreatment conversion, such as through the torrefaction (mild pyrolysis) process at a temperature of 250 °C to 300 °C, is a promising technique that generates a homogenized, hydrophobic, energy-dense, rich in-carbon fraction, and high-heating value solid fuel, thus improving the biomass physiochemical and mechanical characteristics to a level similar to coal [12,13]. The torrefaction process has been studied, and results have overcome the drawbacks of herbaceous biomass via grindability, leading to more spherical and uniform particles and high-quality energy characteristics depending on the feedstock [14]. Several published research studies investigated torrefaction process conditions such as temperature, reaction time, and gas environment, making comparisons of different biomass combinations with microwave techniques at various power levels, the use of microwave absorbers for energy consumption, and product yield characterizations. Thus, the desired final product in densification is used for co-firing in coal power plants and as a substrate for enzymatic hydrolysis in bioethanol conversion [15,16]. However, the choice of biomass heating technique is essential to reduce energy consumption and to achieve grinding characteristics comparable to coal. Many researchers have reported thermal or conventional torrefaction. Microwave irradiation transfers heat from the center to the outside of the material, a reverse of conventional heating. The torrefaction efficiency using microwave biomass upgrading is higher than conventional torrefaction, and their grindability performances reportedly differed [17,18]. Employing microwave techniques in torrefaction is a promising technology and requires lower energy than conventional heating due to instantaneous heating, and solid yields are obtained in a short residence time [19,20,21]. Mohd Fuad et al. [22] and Mohamed et al. [23] reported that dry biomass is a poor microwave absorber in microwave torrefaction heating. Improved particle heat interaction and product yield would be achieved using good microwave absorbers such as carbon-based materials, oil, sewage sludge, and coal.
Consequently, a microwave absorber is added to enhance the microwave absorption rate, increasing the torrefaction temperature at a reduced microwave power and providing volumetric heating with good penetration depth [24,25]. Various microwave absorbers (palm kernel shell, activated carbon, petroleum coke, forest residues and waste, and water) have been used in the torrefaction process. The other advantages of microwave absorbers include the following: (a) improving solid yield quality, (b) improving the heating rate of particles by reducing the drying reactions, (c) easy mixing and uniform biomass mixture, (d) no after-use problems, and (e) being environmentally friendly [26]. The anticipated effects of microwave absorber addition are reduced grinding energy and particle size performance characteristics. Overall, various technological innovations in the past years have been aiming at commercializing the process and developing a technoeconomic assessment in sustaining the bioenergy production processes [27,28].
Coal pulverizing for fuel boilers is significant, and the pulverizer system includes grinding, particle sizing, and conveying the fuel to the burner. However, each process stage is influenced by the physicochemical properties and depends on the composition of the fuel. Apart from the reductions in NOx and SOx emissions, other challenges in utilizing raw biomass for coal co-firing include ash content, volatiles, feeding and milling adaptation, and irregular particle sizes, leading to lower burn-out efficiency and higher oxygen content in biomass [13,15,29]. Grinding herbaceous biomass is a vital stage and energy-intensive during biomass conversion processes. Biomass size reduction modifies the particle shape, increases bulk density and energy density, and changes the surface area, creating contact points for inter-particle bonding during compression, minimizing mass and heat transfer challenges and enhancing conversion efficiency [30]. Grindability is important to improve thermochemical reaction rates and product yields. Indeed, biomass could be utilized after the initial grinding, densification, and transportation to co-firing plants for bioenergy application. Several studies have reported that the energy required for grinding biomass depends on the moisture content, initial and final particle size, material compositions, feed rate, and grinder parameters [31,32,33]. Previous research studies have also suggested that energy consumption for grinding thermally pretreated biomass decreases and gives a uniform particle shape, whereas raw biomass has higher moisture and requires higher energy consumption during grinding [15,32]. In addition, torrefaction increases grindability characteristics and decreases the cost of grinding, and the grinding performance depends on grinding energy and the particle size distribution [25,30,34]. Thus, microwave torrefaction may be employed to pretreat camelina straw and increase its energy density value for further use as biofuel pellets.
With regard to solid torrefied biomass and microwave absorbers, there has been a great deal of investigation considering the standard fuel particle analysis, mass yield, and energy yield. However, only a few studies have reported grinding properties [23,24,35,36]. Similarly, only a few investigations have been made to examine the structure and physiochemical characteristics of the solid yield fraction of ground torrefied biomass [23,37]. Wang and Howard [16] highlighted that thermal pretreatments influence biomass yield properties such as shrinkage and grindability, revealing the microscopic and macroscopic structures. The study of microparticle transformation gives insight into the structural features and changes in physical properties observed using scanning electron microscopy (SEM) and confocal laser scanning microscopy (CLSM). Both techniques use microscopic applications and scanning on the material surface [38,39]. To understand the significant effect of thermal pretreatment on the morphology of torrefied biomass, CLSM has a microscopy core advantage over SEM based on a difference in fluorescence intensity, using two- or three-dimensional (2D or 3D) scanning to detect multiple channels simultaneously, separating polarized and scattered light and revealing fluorescence channels in all dimensions [40,41]. CLSM is more powerful in examining the film-core interface, provides more characterization and differences in the fluorescence intensity of microparticles, uses a non-destructive technique, and gives quantitative information on pellet thickness and surface material composition [39]. The CLSM technique can generate planar vertical or horizontal sections and transform them into 2D or 3D software map component distributions. There is a lack of knowledge in examining torrefied microparticles using the CLSM technique in characterizing potential solid fuel material. However, significant advances have been made in various research areas, such as biomedical, material sciences, geosciences, and agricultural research in using the CLSM technique [38,42].
The impact of microwave absorber (biochar) and residence time during the torrefaction of camelina straw has been reported [11]. Consequently, the anticipation is that torrefaction conditions and using a microwave absorber would impact the grinding energy and grindability indices of torrefied camelina straw. Also, there is a limited study concerning the effect of particle size on microwave torrefied biomass with microwave absorbers. Manouchehrinejad et al. [33] highlighted that grinding characteristics of raw or thermally treated biomass are required for selecting and designing grinding equipment for sustainable commercialization. The objectives of this study were to investigate the impact of torrefaction treatment conditions on grinding energy and examine the effect of heat deformation on the surface morphology of torrefied ground or chopped camelina straw particles by evaluating distinct microparticle changes in camelina straw with and without biochar using CLSM.
2. Materials and Methods
2.1. Material Preparation
Camelina straw (CS) used in the study was supplied by Agriculture and Agri-Food Canada (AAFC) Saskatoon Research and Development Centre Farm. A portion of the raw CS was ground using a hammer mill (Serial no. 6M13688; Glen Mills Inc., Maywood, NJ, USA) with a screen size of 6.4 mm. Another portion of the CS was chopped manually to a size (25–50 mm) equivalent to the output from a tub grinder [31]. Biochar from forest residue (Soil-matrix, Air Terra, Calgary, AB, Canada) was used as a microwave absorber and was ground with a 3 mm screen size. Table 1 presents the properties of CS and biochar and compares them with coal, summarizing the proximate and ultimate analysis. The thermochemical behaviour of raw CS and biochar strongly depends on macromolecular composition and mineral content. According to Hernando et al. [43], the chemical composition values of raw CS are consistent irrespective of the camelina crop variety. The proximate analysis values are essential for bioenergy applications, showing relatively high moisture contents, desirable characteristics in the initial microwave absorption, low value of ash content, and potentially higher calorific values and good heating rates. The ash contents of CS and biochar were lower than coal. The ash content of coal is about eleven times higher than CS and twice higher than biochar. The results showed that adding CS and biochar for co-firing purposes could produce clean and stable fuel, causing fewer cleaning challenges in the combustion unit and lower environmental impact. The ground or chopped CS samples were mixed with a microwave absorber (at weight percent) and stored in air-tight Ziploc bags until needed for quality tests.

Table 1.
Physicochemical properties of camelina straw and biochar as microwave absorber.
2.2. Torrefaction Experiment
The pretreatment experiments were conducted using lab-scale batch microwave torrefaction (2.45 GHz, LBM 1.2A/7296, Cober Electronics Inc., Stamford, CT, USA) in a custom cylindrical quartz reactor and were carried out in triplicates. A thermocouple covered with Teflon was inserted in the middle port to measure the heat distribution in the reactor, and the data were recorded with real-time graphing and LabVIEW data logging software (OSENSA Innovation Corp. Coquitlam, BC, Canada). Approximately 100 ± 0.02 g of the biomass-biochar mixture was placed in the reactor for each experiment. Both ground and chopped CS were torrefied separately, varying the microwave power between 520 W and 650 W. Once the desired temperature (250 °C or 300 °C) was reached at assigned residence times (10, 15, or 20 min), the microwave oven was switched off. The solid fraction was allowed to cool at room temperature and stored in air-tight Ziploc bags for further analysis.
2.3. Particle Density and Bulk Density
The particle and bulk density values of raw CS and torrefied ground or chopped CS with and without biochar mix were determined. A gas displacement pycnometer (AccuPyc 1340, Micromeritics Instruments Corp., Norcross, GA, USA) at 24 ± 0.7 °C was used to measure particle density and replicated seven times for each sample. Bulk density was measured and calculated using the mass and volume of a standard cylindrical steel container with 0.5 L (SWA951, Superior Scale Co. Ltd., Winnipeg, MB, Canada). The sample passed through a funnel and filled the cylindrical container; a thin steel rod was used to roll across the top in a steady pattern motion, and weight was determined. The results were obtained for seven replicates for each sample.
2.4. Particle Size and Particle Size Distribution
The particle size and size distribution analysis of raw CS and ground or chopped CS with and without biochar were determined after microwave torrefaction treatment. The chopped size of raw CS was determined using a chopped forage size analyzer, including the geometric mean, while that of the ground CS was determined using American Society of Agricultural and Biological Engineers standards (S424.1 and S319.4) [31]. The particle size distribution of the solid yield fractions after the torrefaction process was determined based on ASABE standard ASABE S319.4 (R2012) [30] using the following screen sizes: 141, 841, 595, 297, 210, and 150 μm in a Ro-Tap sieve shaker (W.S. Tyler Inc., Mentor, OH, USA). Each process was replicated three times. After sieving, each sieve mass retained was weighed, and the particle distribution, geometric mean diameter (dgw), and geometric standard deviation (Sgw) of particle diameter were calculated.
2.5. Grinding Trials
Grinding characteristics of microwave torrefied CS with and without biochar mix (ground or chopped) were evaluated using a cutting knife mill (Model N0. 3690604, Dietz-motoren GmbH & Co. KG, Dettingen unter Teck, Germany) with a screen size of 3 mm. About 50 ± 0.05 g of sample was hand-fed into a mill chute, monitoring the power consumption with real-time channel software (ELOG 13 ELITEpro XC version ES400.235). The power drawn during grinding was logged as soon as the ground or chopped torrefied CS made contact with the knife and stopped when no material came out through the collecting chute. Three replicates were performed to check the variability of the test. The grinding energy was calculated as the sum of the product of the grinding time, the average current drawn during the process, and the voltage divided by the mass quantity fed into the chute.
2.6. Confocal Laser Scanning Microscopy Assay
Particle samples of raw ground or chopped CS and microwave-torrefied ground or chopped CS were observed using CLSM (LSM 880 with AxioObserver, Carl Zeiss Microscopy LLC, White Plains, NY, USA) to visualize and obtain accurate reflectance imaging using a 10× magnifying lens with size x: 425.10/y: 425.10 tiles. Since dried samples were used, the excitation and emission wavelengths were set at 405 µm and 484 µm, respectively [45]. The image was examined for the degree of heat distortion and damage to the biomass structure due to MW torrefaction. The patterns of surface structural opening during torrefaction at different severity levels were evaluated using the ZEN 3.5 Lite 2.5D display (Carl Zeiss Microscopy, LLC, White Plains, NY, USA). The ZEN lite software automatically analyzed the fluorescence spectroscopy intensities (sum and mean fluorescence intensity). Also, the heat distortion depth into the biomass surface was calculated using the ZEN 3.5 Lite software, and the ZEN lite 2.5D display and histogram processing evaluated the penetration patterns.
2.7. Statistical Analysis
Grinding characteristics of torrefied ground or chopped CS with and without biochar were determined, including the geometric mean diameter and interaction effects of biochar addition and residence time at two torrefaction temperatures using a user-defined design (UDD) of response surface methodology (RSM) of the Minitab software (Version 20.3; eBase Solutions Inc., Vaughan, ON, Canada). The experimental design was a collection of mathematical and statistical techniques applied using analysis of variance for effects of variables (solid yield, moisture content, ash content, geometric mean diameter, bulk, and particle densities), building models and optimizing the process variables for optimum responses.
3. Results
3.1. Microwave Torrefied Biomass and Solid Yield Fractions
Table 2 shows selected physical properties of ground and chopped CS with and without biochar addition, comparing two torrefaction temperatures and three residence times. The samples without microwave absorbers (T-100/0) showed that biomass could not be heated sufficiently. The solid yields of torrefied ground or chopped CS fractions decreased with increased torrefaction temperatures and longer residence times.
Table 2.
Effect of microwave torrefaction process on ground and chopped camelina straw.
The fraction yields started to decline beyond 50% of the original weight at 20% biochar addition for a torrefaction temperature of 250 °C and at 10% biochar addition when the torrefied temperature reached 300 °C. However, the solid yields were similar and comparable for torrefied ground or chopped CS with and without biochar. As previously reported, biochar addition and longer residence times increased the mass loss at different torrefaction temperatures irrespective of grinds. In addition, the mass loss could be attributed to small particles of ground CS and biochar, reducing hot spots and increasing uniform heating compared to chopped CS with biochar mix. The degree of torrefaction data represents one minus the ratio of torrefied volatile matter to the volatile matter of raw biomass [46]. The increase in the degree of torrefaction is due to biochar addition with torrefaction severity leading to the loss of volatiles. According to Phanphanich and Mani [34], a decrease in raw biomass particle size would increase bulk and particle densities because of inter- and intra-particle void reduction produced during grinding. Table 2 shows that the bulk and particle densities of torrefied ground or chopped CS with and without biochar behaved differently. The particle density results showed that torrefied ground or chopped CS without biochar decreased with higher torrefaction temperatures as the particle size reduced significantly. On the contrary, biochar addition and longer residence times increased the particle density of torrefied ground from 1234.20 kg/m3 to 1398.10 kg/m3 for 250 °C and from 1205.20 kg/m3 to 1250.60 kg/m3 for 300 °C and torrefied chopped CS from 1203.10 kg/m3 to 1283.10 kg/m3 for 250 °C and from 1173.70 kg/m3 to 1208.10 kg/m3 for 300 °C. The bulk density increased with biochar addition and extended torrefaction temperatures in both grinds. The bulk and particle densities of torrefied ground CS with and without biochar were slightly higher than those of torrefied chopped CS with and without biochar. Biochar addition significantly affected the production of biochar yield fractions and the corresponding mass loss.
In addition, Table 2 summarizes the data of ground or chopped CS with and without biochar after microwave torrefaction on moisture content, ash content, and geometric mean diameter and compares with raw CS at different torrefaction temperatures, biochar addition, and residence times. The percentages of biochar addition and longer residence times at high torrefaction temperatures resulted in decreased moisture content and increased ash content irrespective of the particle size. Moisture reduction after torrefaction increases energy efficiency, improves solid yield quality, and reduces emissions during thermochemical energy conversion. The increased ash content observed in both grinds, compared to that of the raw CS, was due to the mass loss of the biomass during torrefaction treatment. Compared to the raw CS, the mean particle size of torrefied ground or chopped CS with and without biochar decreased with increased torrefaction temperature. On average, increased torrefaction temperature, increased biochar addition, and longer residence time reduced particle size in the torrefied ground CS more than in the torrefied chopped CS. As observed with the torrefied ground or chopped CS without biochar, the larger the particle geometric diameter, the lower the bulk and particle densities. The torrefied ground or chopped CS with biochar showed a different trend; the smaller the geometric mean diameter, the higher the bulk and particle densities. The results showed the significance of microwave absorber reaction in small-shaped particle CS with biochar compared to larger-shaped particle CS with biochar.
3.2. Experimental Verification of Predictive Models
The statistical significance of the response for the quadratic models of solid yield, moisture content, ash content, geometric mean diameter, bulk density, and particle density from the torrefied ground or chopped CS with and without biochar was analyzed using RSM analysis of variance (Table S1). The data generated using the analysis of variance (ANOVA) RSM method for the response variables (solid yield, moisture content, ash content, bulk density, particle density, and geometric mean diameter) and their quadratic models were found to be significant at p < 0.000. Overall, the p-values for the response variables satisfied the significance of the coefficients and interaction power of each independent variable. However, some exceptions showed no significance in torrefaction temperature and residence time (torrefied ground CS with or without biochar bulk density and torrefied ground or chopped CS with or without biochar particle density). In the case of solid yield, moisture content, geometric mean diameter and ash content, torrefaction temperature, CS with or without biochar addition, and residence time were found to be significant (p < 0.000 and <0.05) for both torrefied grinds. The p-value checks the coefficients’ significance, including each independent variable’s interaction power. The correlation coefficient (R2 value close to 1) shows a better fit between the predicted and actual experimental values [47]. Solid yield, bulk, and particle densities showed similar R2 values (actual, predicted and adjusted) in both grinds, and they showed the highest values for fit of the models. Also, the difference between R2 values predicted and adjusted was <0.2 across each model, implying that the developed models reasonably agree between the factors and response variables. The coefficient of variation (CV in %) measures the residual variation in the experimental data relative to the average and should be <10% [48]. All the CVs for torrefied ground or chopped CS with and without biochar met the requirements, indicating that the reproducibility and reliability of the experimental results were satisfactory. Table S2 shows the multiple regression equations and adequate precision fitted for the experimental data. The accuracy values of all models indicated desirability greater than 4, implying an adequate signal-to-noise ratio and that the response regression models can be used to navigate the design space. Also, the results evaluate the reliability of the response models, proving that the models and equations are suitable.
The solid yield, moisture and ash contents were selected for variable optimization to maximize the after-torrefaction mass yield and pelletization. The optimum operating conditions (experimental and predicted responses) showing desirability calculated close to 1 are presented in Table S3. Considering the significant effect of the torrefaction temperature, biochar addition, and residence time on the selected response variables, the desired optimum conditions, which could reduce microwave energy consumption and ensure economic experimentation, were selected. The validation error was calculated based on the difference between actual and predicted values [49]. The validation results succeeded in showing that the predicted values reached within the acceptable error of ±10% of the predicted responses (solid yield: 0.06 and 0.21%, ash content: 0.11%, moisture content: 0.01%) and predicted operating conditions (torrefaction temperatures: 0.21 and 0.39%, biomass-biochar: 0.03 and 0.10%, residence times: 0.45 and 0.04%) for both torrefied samples. The operating and response variables (actual and predicted) are closely related to certify the model’s reliability.
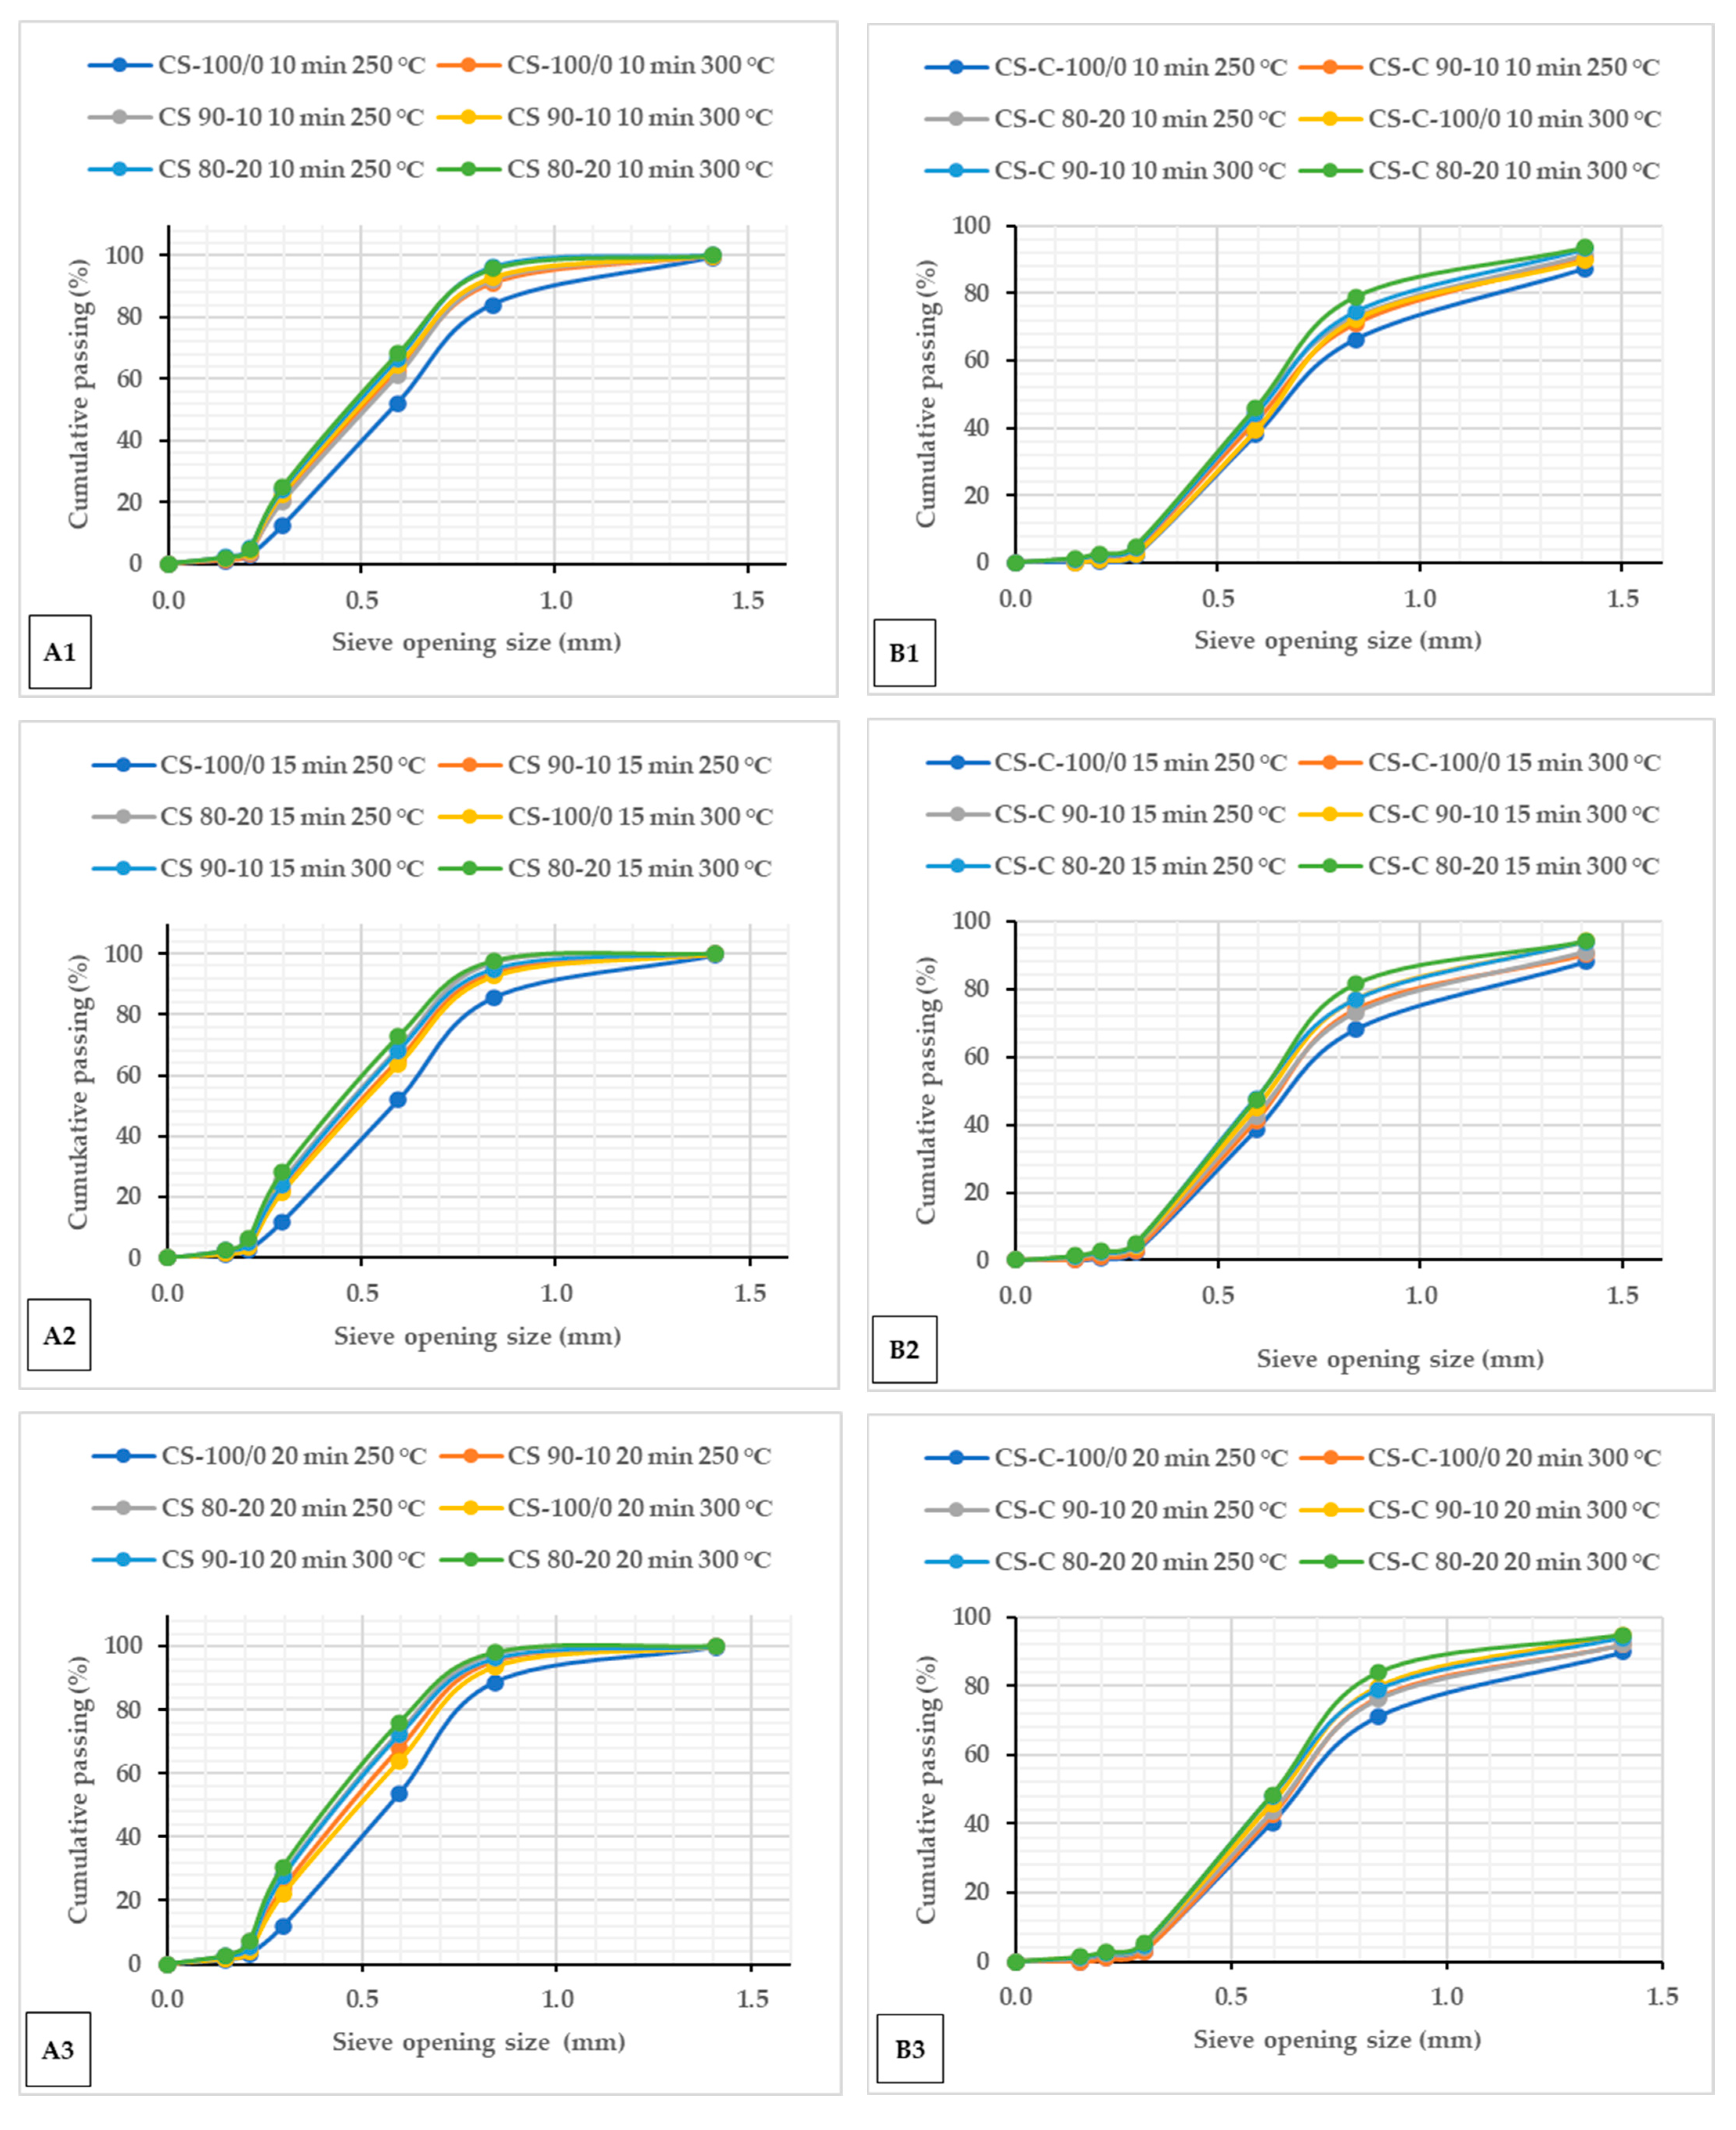
3.3. Particle Size Distribution of Torrefied Biomass
The cumulative passing percentages of particle sizes for microwave torrefied ground or chopped CS with and without biochar and non-torrefied CS are shown in Figure 1. The cumulative percent passing curve showed similar plots after the microwave torrefaction, irrespective of the biochar addition and residence times Figure 1(A1–A3,B1–B3), and compared with raw CS (Figure S1). The results showed that the fine fraction content consistently increased as the torrefaction temperatures increased in both grinds Figure 1(A1–A3,B1–B3). Torrefied ground CS without biochar behaved differently and showed uniform particle size ranges than torrefied chopped without biochar. From the particle size point of view, ground CS seems to be more thermally sensitive than chopped CS with biochar addition, thus revealing heat consistency across the particles. As observed, the mass of torrefied samples retained in the smaller sieve and pan was more at 300 °C. The torrefied ground CS with biochar had more mass collected on the pan than the torrefied chopped CS without biochar. The torrefied ground CS weight fraction yield of 30.54% (CS 80/20 at 300 °C/20 min) had more fine particles passed through the screen with a 0.2 mm aperture opening size than torrefied chopped CS.
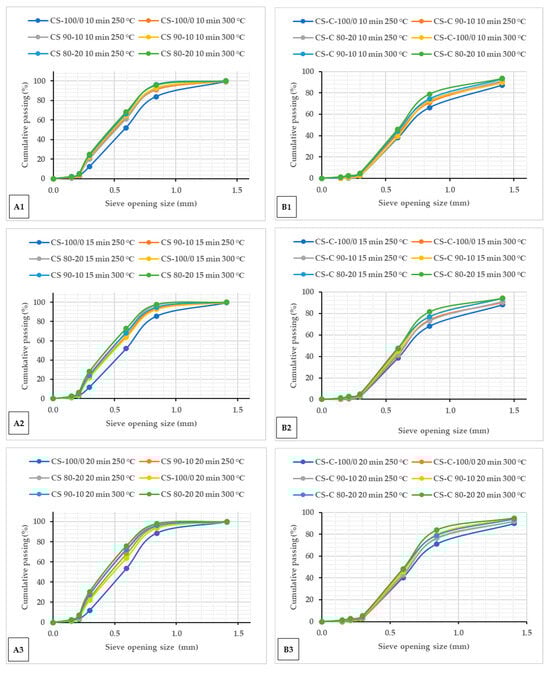
Figure 1.
Cumulative passing plots of particle size for torrefied ground (A1–A3) and torrefied chopped (B1–B3) camelina straw with and without biochar at different torrefaction temperatures and residence times 10 min (A1,B1), 15 min (A2,B2) and 20 min (A3,B3). CS: camelina straw ground in 6.4 mm sieve; CS-C: chopped camelina straw; CS-100/0: torrefied camelina straw no-biochar. The first number after torrefied biomass is % CS, and the second is % of biochar.
Torrefied chopped CS with biochar showed over a 75% particle size above 0.3 mm against 71% torrefied ground CS at a torrefaction temperature > 250 °C. A small particle size with biochar addition > 10% at extended torrefaction temperatures (250 °C and beyond) generates more fine fractions. The results show that biomass torrefaction with biochar addition improved the grinding and handling characteristics regardless of the biomass particle size. Indeed, increasing the torrefaction temperature resulted in a thinner particle size. Also, raw CS produced a wider particle size range compared to the torrefied ground or chopped CS with and without biochar (Figure S1A,B). The behaviour of the particle size after microwave torrefaction can be attributed to biomass carbonization increasing biochar weight fractions. Table 3 presents the particle size distribution of raw CS from two particle size reduction strategies (ground at 6.4 mm and chopped). The chopped CS had a larger distribution with a geometric diameter of 6.950 mm compared to 0.585 mm for ground CS. Mani et al. [31] reported that coarse particles are adequate as feed for boilers and gasifiers. However, Li et al. [24] noted that a small particle biomass with a microwave absorber mix can potentially reduce hot spots and promote uniform heating.
Table 3.
Particle mass distribution of non-torrefied camelina straw.
3.4. Specific Grinding Energy of Torrefied Biomass
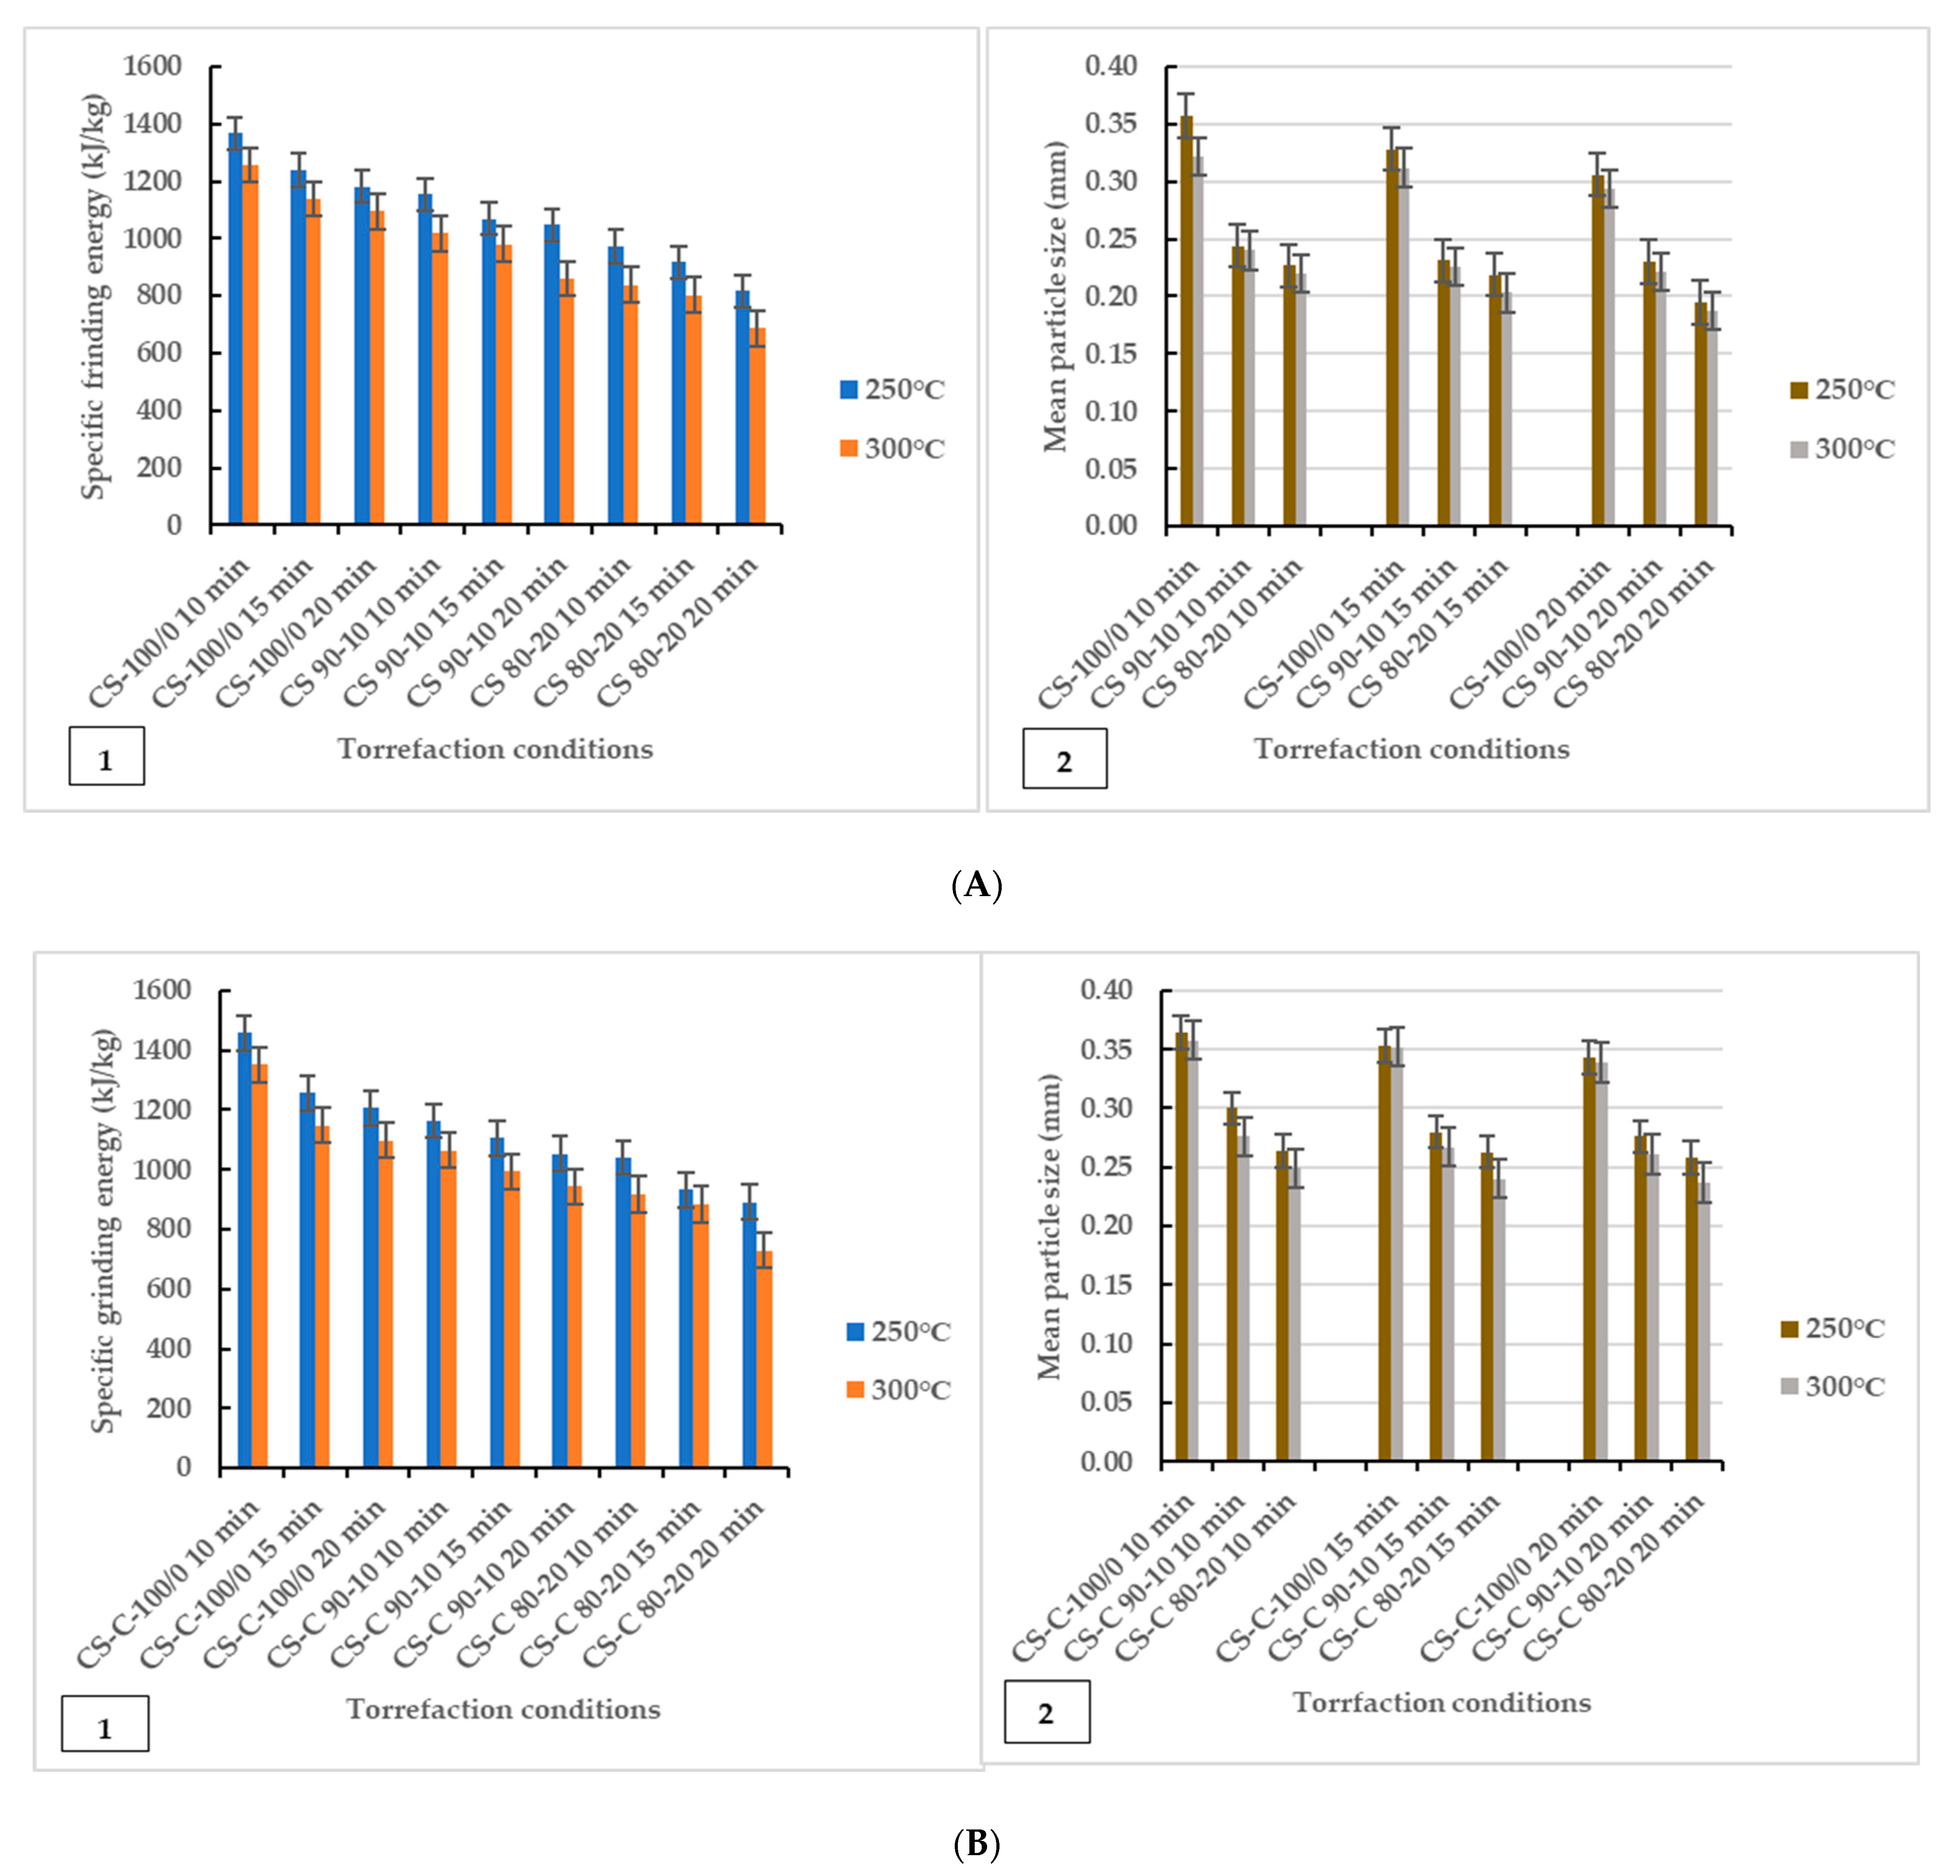
The grinding characteristics and geometric mean diameter of torrefied ground or chopped CS with and without biochar are given in Figure 2. The study showed that grinding energy consumption is a function of torrefaction temperature and feedstock. The results showed that torrefied ground or chopped CS without biochar consumed more grinding energy than torrefied CS with biochar. Thus, extended torrefaction temperatures, biochar addition, and longer residence times further decreased energy consumption. The decrease in grinding energy consumption indicates a significant improvement in grindability after torrefaction. The grinding improvement could be due to the loss of volatile components and moisture to the surrounding environment, which broke down hemicellulose at 250 °C and cellulose and lignin components at torrefaction temperatures > 250 °C and beyond 300 °C, which left the torrefied biomass weight fractions carbonized and lighter. The effect of microwave torrefaction temperature, biochar addition, and residence time on the mean particle size of torrefied ground or chopped CS with and without biochar ground through a screen size of 3 mm showed that disintegration of the lignocellulosic matrix made the grinding easier and produced smaller particles compared to the results after microwave torrefaction (Table 2). Overall, biochar added as a microwave absorber during torrefaction significantly enhanced grindability irrespective of CS particle size.

Figure 2.
Specific energy of grinding graphed in comparison to geometric mean particle size (dgw). Effect of torrefaction temperature, biochar addition and residence time on specific grinding energy (left) and mean particle diameter (right) for torrefied ground camelina(A1,A2) and torrefied chopped camelina straw (B1,B2). CS: camelina straw ground in 6.4 mm sieve; CS-C: chopped camelina straw; CS-100/0: torrefied camelina straw no-biochar. The first number after torrefied biomass is % CS and the second is % of biochar.
Figure 2 shows that the grindability of torrefied ground or chopped CS was improved after biochar addition at longer residence times as the specific grinding energy was as low as 1048.65 kJ/kg–685.95 kJ/kg for torrefied ground CS and 1052.40 kJ/kg–729.90 kJ/kg for torrefied chopped CS. The results showed that torrefied ground CS with biochar had lower specific grinding energy than torrefied chopped CS with biochar. As observed, there were variations in the mean particle size of ground and after torrefaction (250 °C and 300 °C) mean particle size values, presented in Figure 2(A2,B2) and Table 2. The mean particle size of torrefied ground biomass decreased significantly with torrefaction temperatures for torrefied ground or chopped CS with and without biochar. The particle size for chopped CS was the largest for the non-torrefied CS, followed by the ground CS. In the case of ground torrefied biomass, the mean particle size of torrefied chopped CS with and without biochar was larger than that of the torrefied ground CS with and without biochar (Figure 2). Notably, ground CS (sieve size of 6.4 mm) with biochar addition reduced hot spots and generated uniform heating, increasing the particle surface area and improving grindability.
The ANOVA results indicated that torrefaction temperatures, biochar addition, and longer residence times significantly affected the specific grinding energy and mean particle size of ground torrefied ground or chopped CS with and without biochar. As previously reported, reduced microwave energy consumption was achieved at a microwave power of 520 W (torrefaction temperature 250 °C), with a 20 min residence time at 20% biochar added, significantly making biochar from forestry residues a good microwave absorber. The F-values suggest that the models were highly significant (p < 0.0001). The p-values check the coefficient significance, including each independent variable’s power. There was no difference between R2 values for torrefied ground or chopped CS with and without biochar: 0.976 (0.894 predicted) and 0.985 (0.932 predicted) (specific grinding energy and geometric mean diameter) for ground torrefied ground CS and 0.974 (0.898 predicted) and 0.997 (0.988 predicted) for ground torrefied chopped CS. In addition, the ANOVA results showed that biochar addition and longer residence times are influenced by higher torrefaction temperatures, improving crushing efficiency and size reduction for potential compression into fuel pellet production. The interaction effects of the response variables on torrefaction temperature, biomass-biochar, and residence times in describing the specific energy of grinding were studied using contour plots for torrefied ground or chopped CS with and without biochar (Figure S2). The response contour plots showing similarities in curves help visualize and understand the interactive effect of the selected factor (specific grinding energy). Each studied grind displayed different curve plots in response to the variable interactions. Increased torrefaction temperatures, biochar addition, and longer residence times resulted in lower grinding energy, as indicated in the contour plots; the sky-blue colour partition represents lower grinding energy in response to the variable interactions. However, torrefied ground or chopped CS without biochar showed increased specific grinding energy, as represented in a yellow-light-green colour partition. Overall, biochar addition significantly interacted with other processing variables in reducing the grinding energy of torrefied ground or chopped camelina straw.
3.5. Confocal Laser Scanning Microscopy Evaluation
The selected grinds were prepared, mounted on a slice glass, and observed using a CLSM (LSM 880 with AxioObserver, Carl Zeiss Microscopy LLC, White Plains, NY, USA) with 10× magnification. This study used the CLSM method to examine the surface morphology distortion at different torrefaction temperatures. The ZEN imaging software, a collection of 2D fluorescence images captured through laser scanning microscopy (LSM 800) and converted into 2.5D displays, provides a detailed view of interfacial adaption and the distribution of heat distortion on the microstructure surface [50,51]. In addition, representative of the torrefied samples sum fluorescence intensity (SFI) and mean fluorescence intensity (MFI) were automatically calculated using the ZEN software. The SFI and MFI were compared to the raw values, and the patterns of heat deformation on the microparticle surface were evaluated using the ZEN software 2.5D display and histogram.
Figure 3 shows the raw camelina straw (chopped and ground) 2D and 2.5D images with plots of surface areas generated from the CLSM technique, indicating significant surface changes at different particle sizes. At different grinds, the raw CS contains firm and bulky xylem tissues. The biomass CLSM 2.5D plots Figure 3(A2,A3,B2,B3) show the bound fibrous structure and crack levels in chopped and ground particle sizes, respectively. Each particle’s surface morphology showcased evidence of a surface breakdown in its raw form before heat application. The chopped CS showed sectionalized rays of fibres and internal end-views of microparticle stacks, revealing the extent of particle surface deformation. Meanwhile, the ground CS showed more fibrous and extended crack levels, including surface changes, indicating the effect of grinding (6.4 mm sieve size). Also, it was noted that the ground particle size had a detailed image microparticle resolution compared to chopped CS.
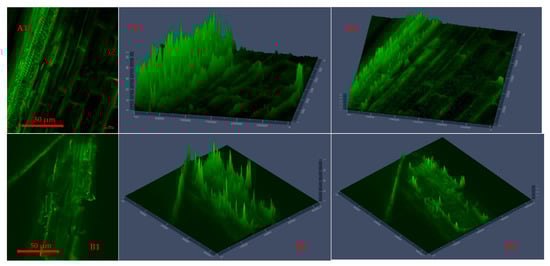
Figure 3.
Two-dimensional segmentation (A1,B1) and 2.5 D display cross-section plots (extended 2.5D plots (A2,A3)) for chopped and ground (B2,B3) raw camelina straw generated using confocal laser scanning microscopy with changes across the surface morphology.
Figure 4 and Figure 5 present CLSM 2D images and 2.5D plots of selected microwave torrefied chopped and ground CS without and with biochar, indicating changes in surface morphology at different torrefaction treatment conditions. The torrefaction temperature significantly affected changes in the fluorescence properties of the torrefied CS structure with or without biochar. The CLSM results could be qualitatively confirmed from SEM images. Significant changes were observed when comparing the raw CS images to the torrefied CS at different torrefaction treatments. The CLSM 2.5D microparticle plots validated the extent of cell wall breakdown and computational image analysis in determining heat distortion on the surface of each grind at different torrefaction conditions compared to raw CS. In Figure 4, the chopped and ground CS without biochar showed evidence of hot spot heating during the torrefaction heat reactions. The longitudinal slides in Figure 4(A2,A3) represent chopped CS without biochar and torrefied at a 250 °C/15 min residence time.
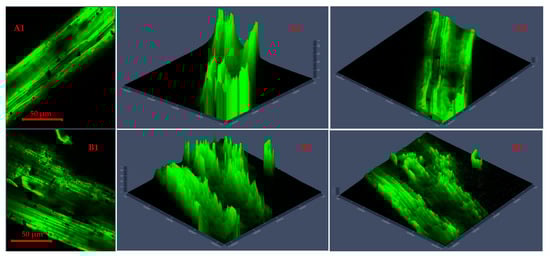
Figure 4.
Confocal laser scanning microscopy 2D images (A1,B1) and 2.5D plots showing changes in fluorescence properties across surface morphology of torrefied chopped (extended 2.5D plots (A2,A3)) and ground (extended 2.5D plots (B2,B3)) camelina straw without biochar at 250 °C and 300 °C.

Figure 5.
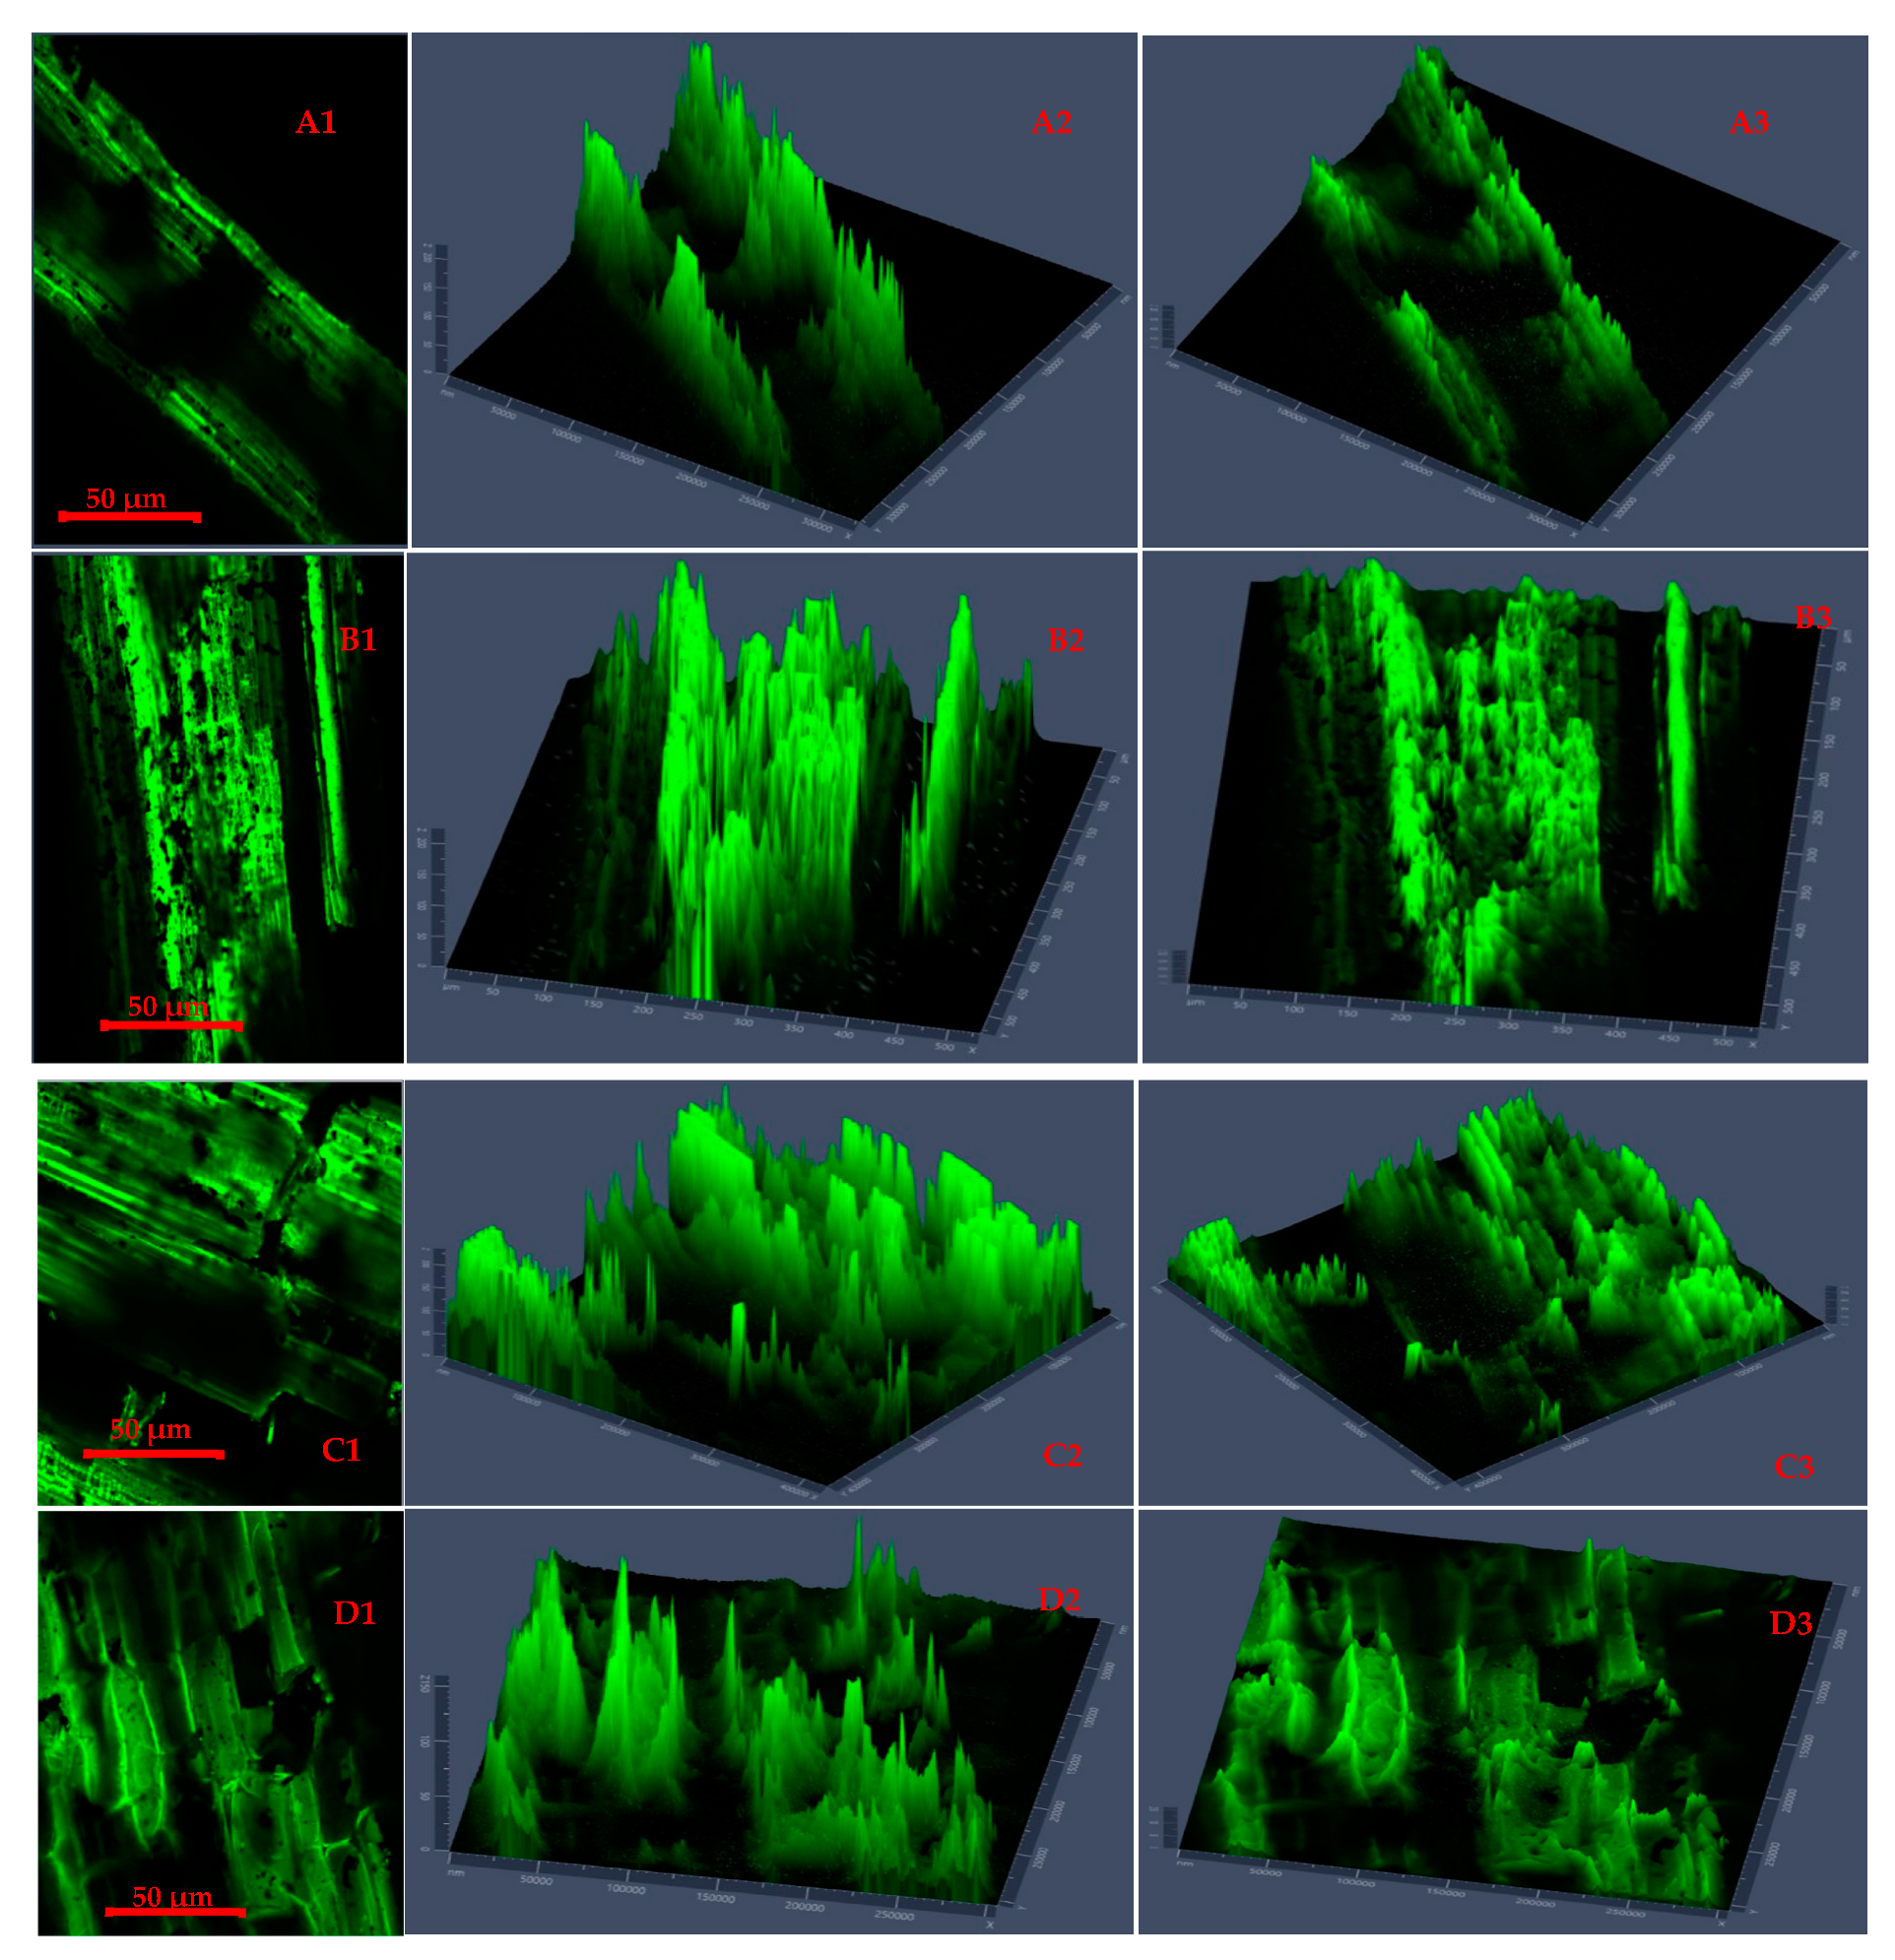
Confocal laser scanning microscopy 2D images (A1,B1,C1,D1) and 2.5D plots showing changes in fluorescence properties across surface morphology of torrefied chopped (extended 2.5D plots (A2,A3,B2,B3)) and ground (extended 2.5D plots (C2,C3,D2,D3)) camelina straw with biochar ((A1–A3,B1–B3) torrefied at 250 °C and (C1,C3,D1–D3) torrefied at 300 °C).
Figure 4(A3,B2) show CLSM images of ground CS without biochar that was torrefied at 300 °C/20 min residence time, producing deep longitudinal cracked drops. The images explain that the cell walls were disarranged, and the particle tubular structures were exposed by extending the torrefaction temperatures beyond 250 °C at longer residence times without a microwave absorber.
Figure 5 presents CLSM 2D images and 2.5D plots of chopped and ground CS that was microwave torrefied with biochar at different torrefaction treatments. The results showed a deeper insight into the impact of biochar addition and torrefaction with changes on the CS microparticle structure and cross-sections.
The 2.5 D plots in Figure 5(A1–B3), torrefied at 250 °C, and Figure 5(C1–D3), torrefied at 300 °C, clearly explained the variation in microparticle structure reaction with biochar and why the grinding performance was improved and resulted in lower grinding energy than torrefied CS without biochar and raw CS. The uniform heating during torrefaction was more evident with ground CS than with chopped CS at 250 °C with a longer residence time. But at torrefaction temperatures above 250 °C and with longer residence times, there was total collapse of the tubular microstructure, which resulted in carbonization and the biomass fractions being lighter in weight.
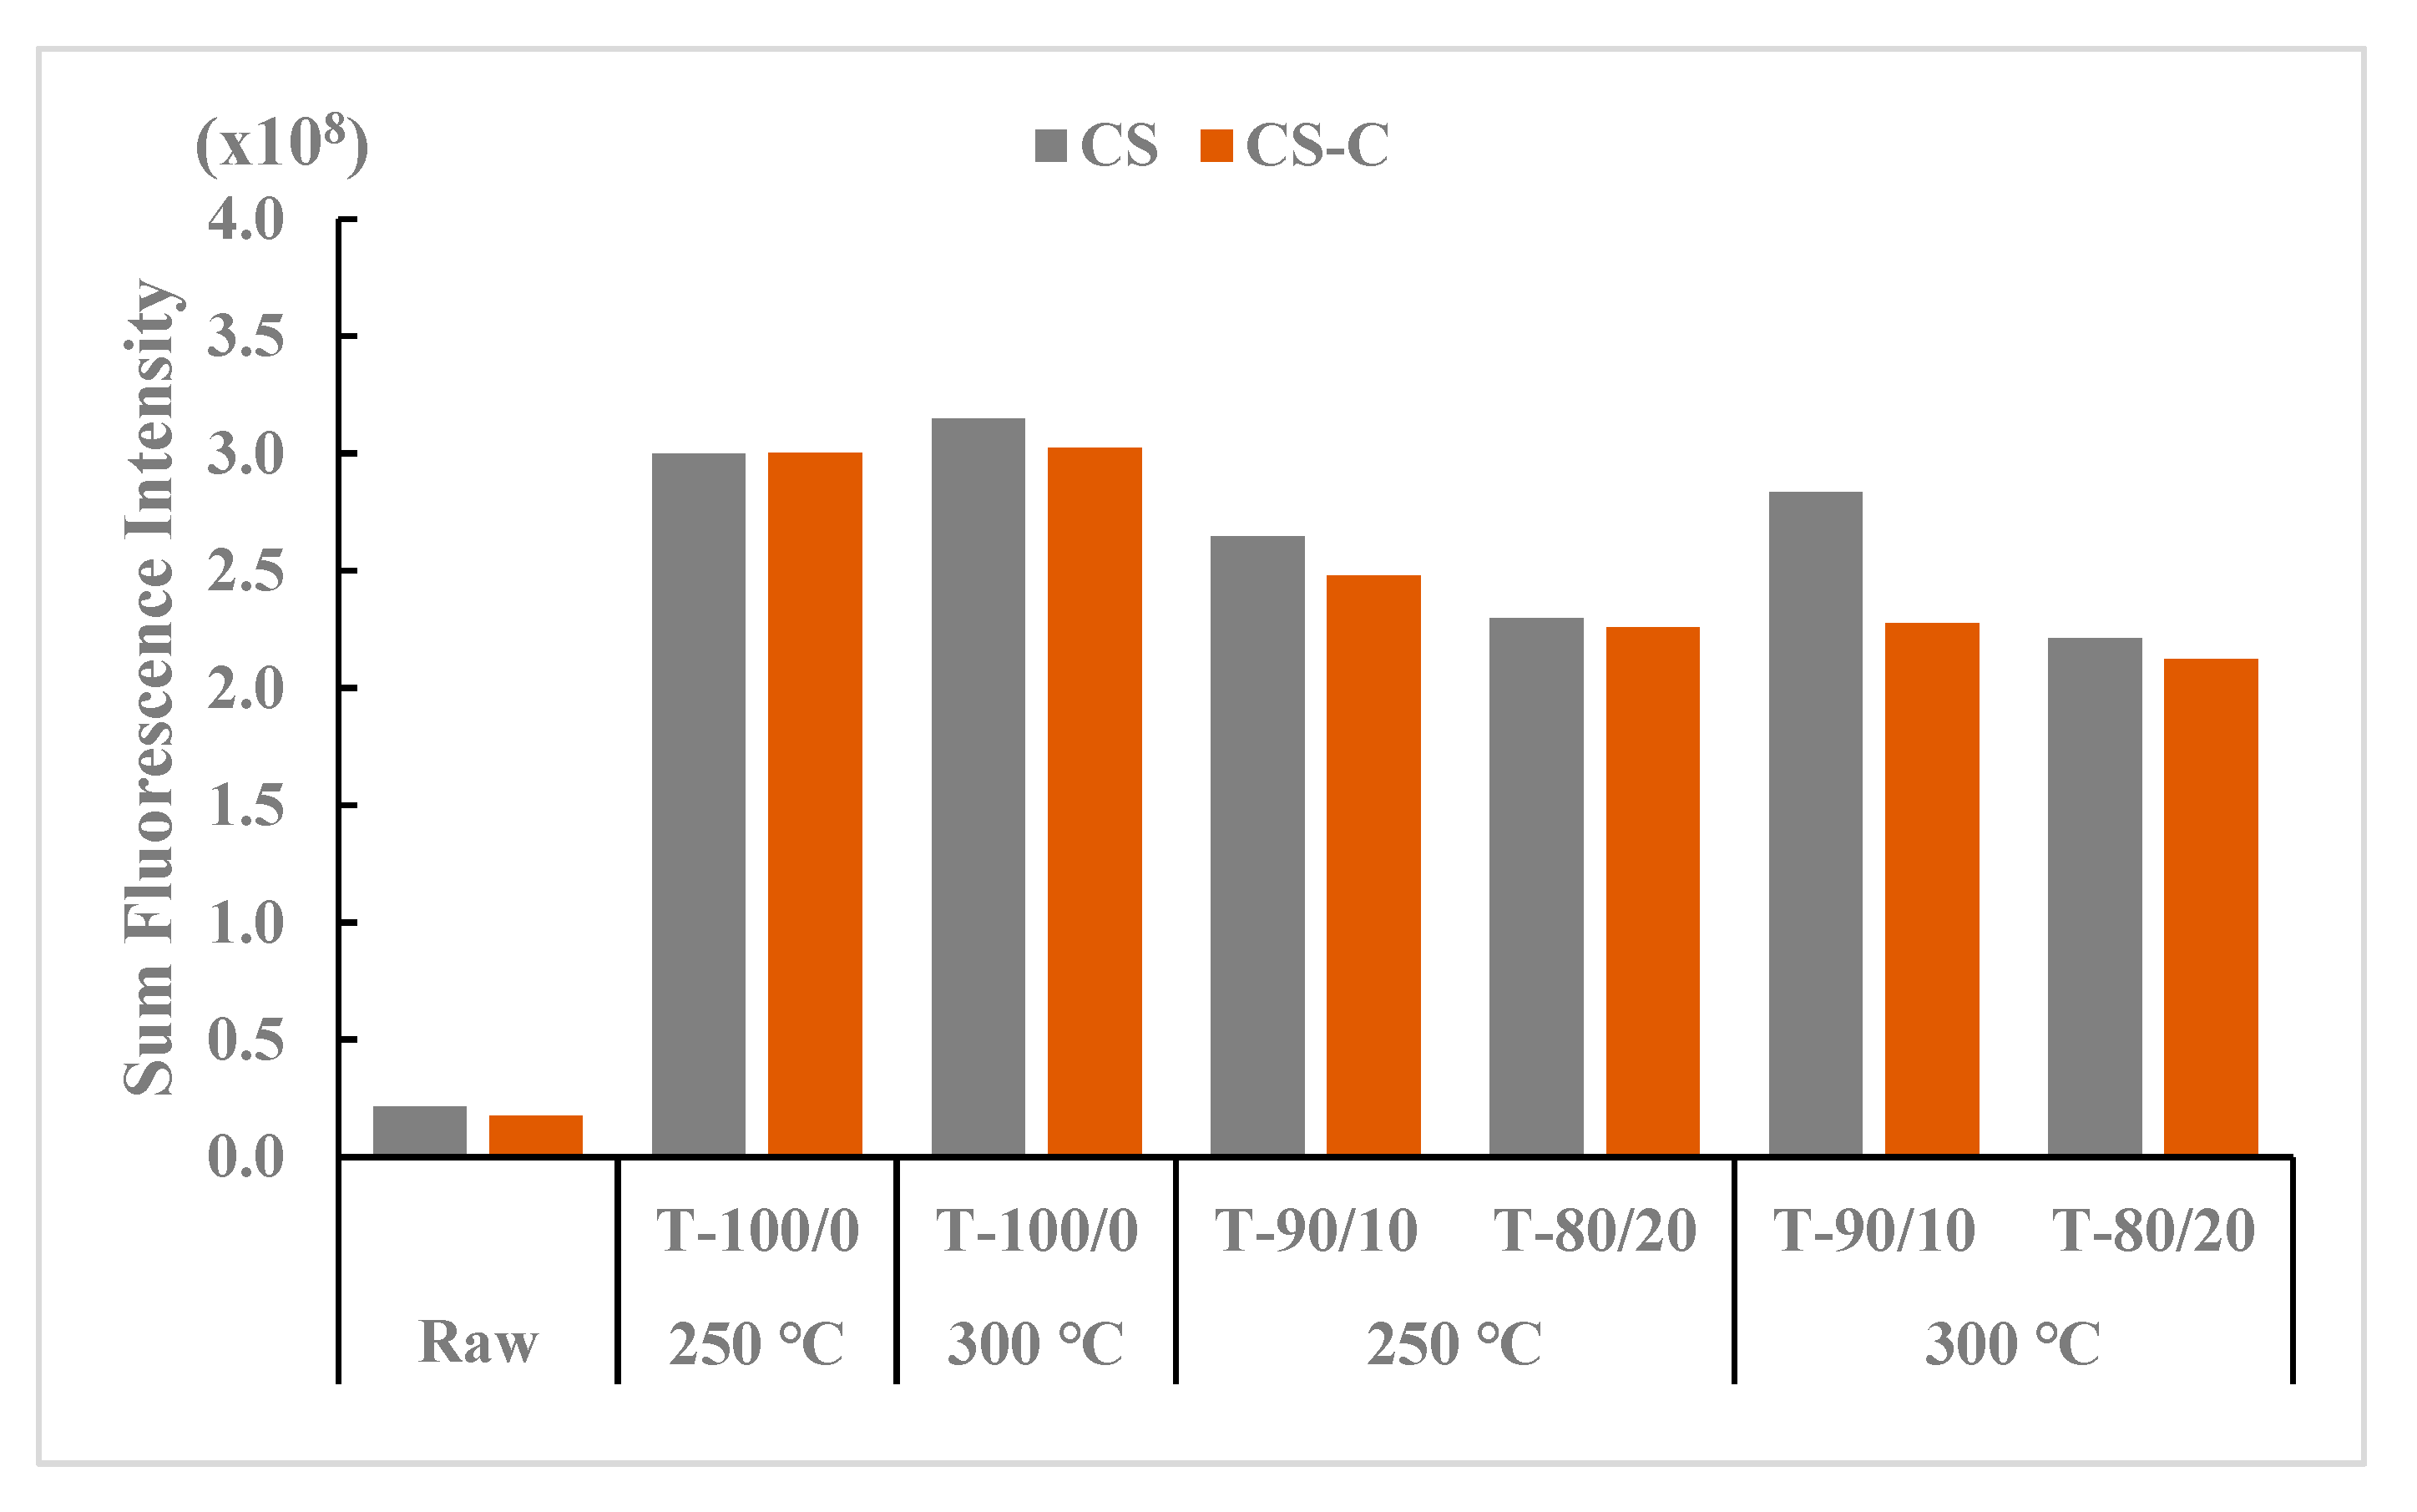
The SFI values are presented in Figure 6, reflecting the total SFI of torrefied ground and chopped CS with and without biochar and compared with raw CS. The highest SFI value at treatment levels was found in the torrefied ground CS compared to the torrefied chopped and raw CS. Among the torrefaction treatment levels, torrefied ground CS without biochar and 10% biochar at 300 °C showed the highest intensity levels, while the raw CS at different grinds without heat application had the lowest SFI values. The total SFI values for raw CS (no heat treatment) reflect the grinding and chopping process on the CS surface.
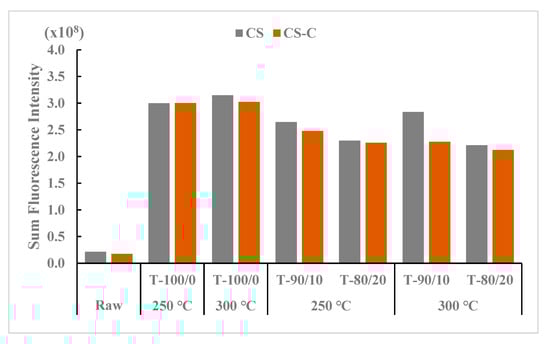
Figure 6.
Comparison of sum fluorescence intensity between torrefied ground and chopped camelina straw with and without biochar, at 250 °C and 300 °C, and raw camelina straw. CS: camelina straw ground in 6.4 mm sieve; CS-C: chopped camelina straw; T-100/0: torrefied camelina straw no-biochar. The first number after torrefied biomass is % CS and the second is % biochar.
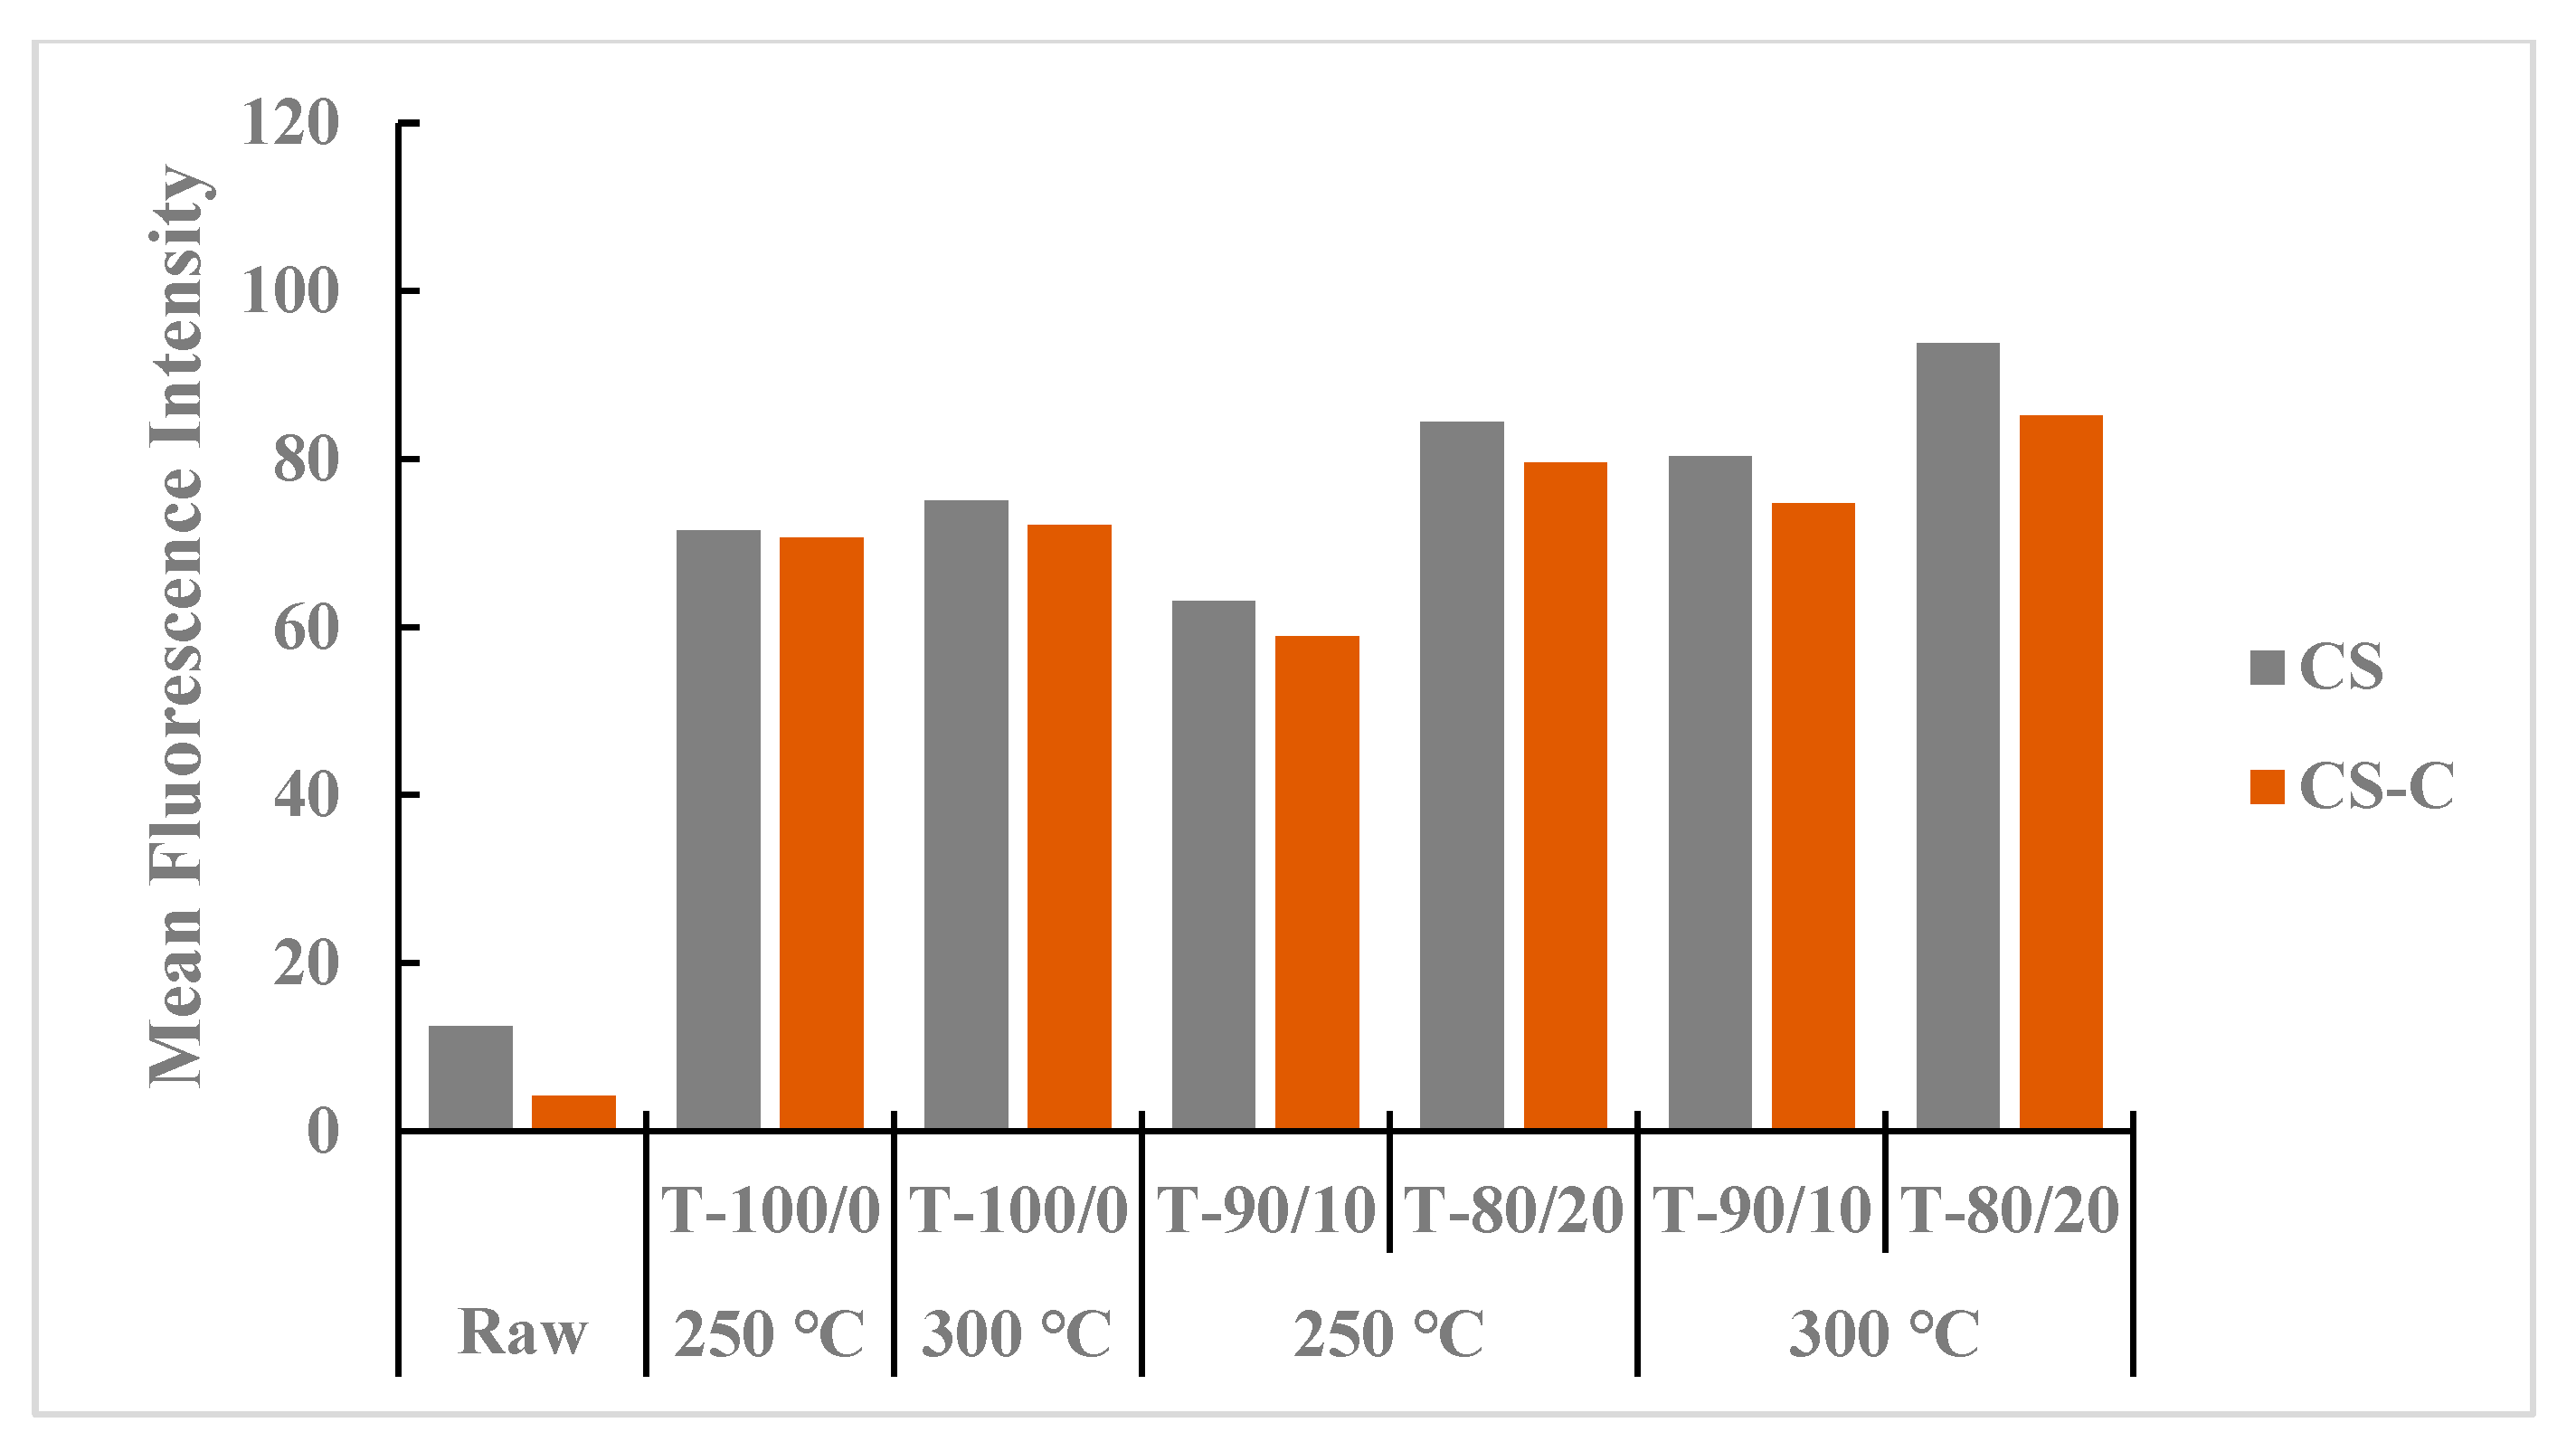
Figure 7 shows the mean intensity values of heat treatment in the torrefied ground or chopped CS with and without biochar compared with those in non-heated raw CS. Torrefied ground CS with biochar (>20%) showed higher MFI than the torrefied chopped CS with or without biochar and the raw CS. The heat treatment effect in torrefied ground CS with biochar could be attributed to heat spread and interactions due to the small particle size of CS compared to torrefied chopped CS with and without biochar. Biochar addition with higher torrefaction temperatures and longer residence times showed higher MFI than torrefied CS without biochar and raw CS grinds.
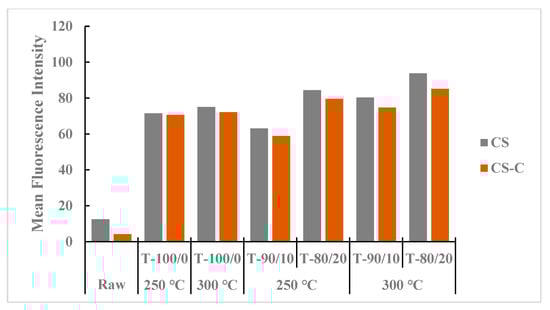
Figure 7.
Comparison of mean fluorescence intensity between torrefied ground and chopped camelina straw with and without biochar, at 250 °C and 300 °C, and raw camelina straw. CS: camelina straw ground in 6.4 mm sieve; CS-C: chopped camelina straw; T-100/0: torrefied camelina straw no-biochar. The first number after torrefied biomass is % CS and the second is % biochar.
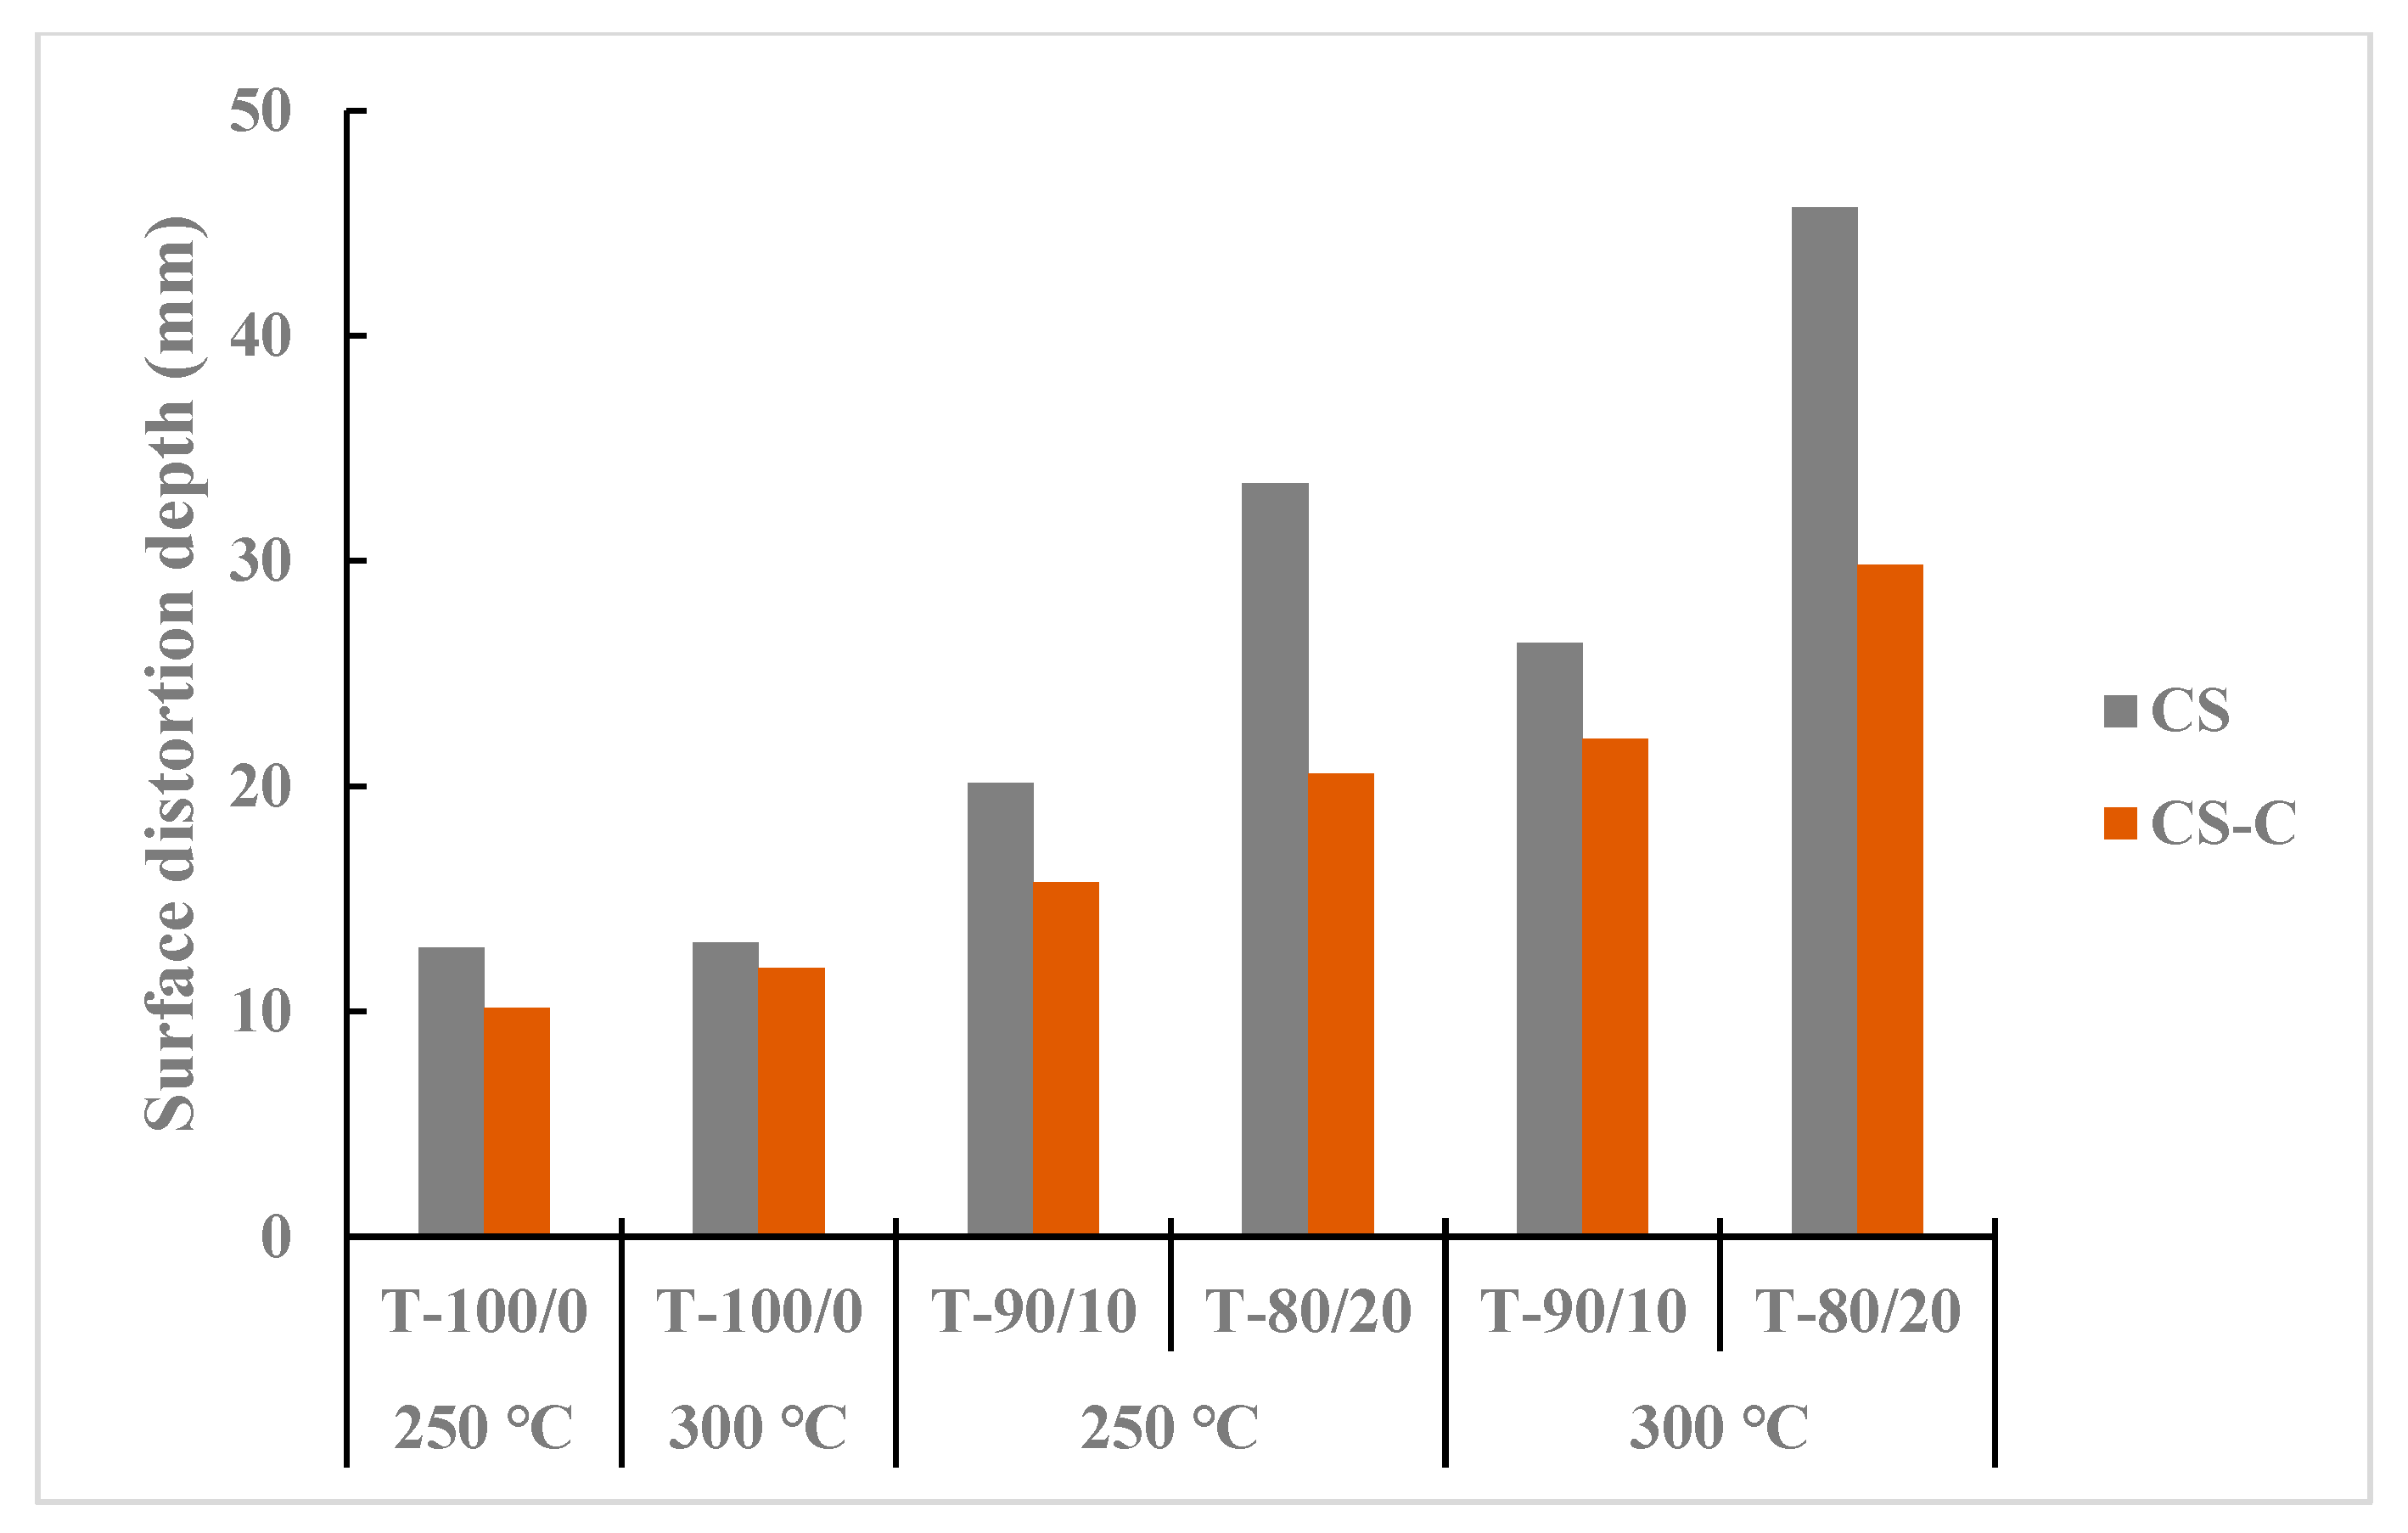
Figure 8 presents heat surface deformation by distortion depth from a selected sample of torrefied CS with and without biochar, revealing that ground CS had more pore spaces than chopped CS. The initial particle grinding before the biochar addition and torrefaction heating process increased the surface area for microwave absorber reactivity and heat penetration at different heat levels. The torrefied ground CS with biochar at 300 °C and longer residence times showed higher distortion depth than the torrefied chopped CS with and without biochar. The results indicated that biochar addition (>20%) and torrefaction temperature at 250 °C can create profound surface distortion; at 300 °C and beyond, colossal surface damage resulted and carbonized weight fraction increased. Overall, the surface heat deformation depth, SFI, and MFI were higher in torrefied ground CS with biochar than in torrefied chopped CS with and without biochar in all torrefaction treatment conditions. Furthermore, raw chopped CS showed lower SFI and MFI values than raw ground CS.
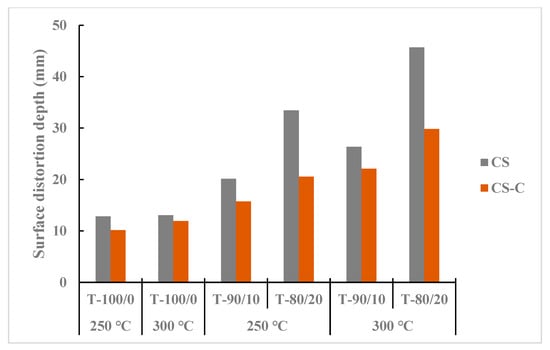
Figure 8.
Comparison of maximum penetration depth between torrefied ground and chopped camelina straw with and without biochar, at 250 °C and 300 °C, and raw camelina straw. CS: camelina straw ground in 6.4 mm sieve; CS-C: chopped camelina straw; T-100/0: torrefied camelina straw no-biochar. The first number after torrefied biomass is % CS and the second is % biochar.
4. Applications of Carbon-Based Microwave Absorbers in Microwave Torrefaction
Biochar is a carbon-based microwave absorber that provides a faster heating rate and sufficient temperature at a lower microwave power level than biomass without added biochar. Adding biochar as a microwave absorber in the study changed the product yield distribution of microwave torrefaction, composition, and thermodynamic characteristics at a low temperature. The heating process is based on volumetric heat generation and energy transfer, producing unique characteristics of particle sizes. The biochar used in microwave torrefaction process do not pose disposal problems and can be recycled to the reactor as a cost-effective biochar. Carbon-based microwave absorbers could improve heat transfer, reactor temperature, and heating rate and should be applicable technology and competitive with conventional processes.
5. Conclusions
The proposed method for assessing the grinding performance of torrefied ground or chopped biomass is a promising technique that could further characterize microwave torrefied biomass beyond the existing measured physicochemical parameters. The enhanced performance of the microwave torrefied ground or chopped CS with added biochar was attained with low energy consumption, and grinding was conducted without additional investment cost or training. Biochar utilization during torrefaction treatment is conducive to achieving agricultural residue conversion for sustainable development. Particular attention has been paid to improving the biomass yield fractions for combustion, heat, and power generation and upgrading fuel pellet properties for storage and transportation characteristics to achieve better industrial application. The studied torrefied biomass indicated the feasibility and practicality of combustion for power/heat or as a co-burning mixture with coal. The mean particle size after the torrefaction and grinding of torrefied ground or chopped CS with and without biochar decreased with increased torrefaction temperature. Specific energy consumption for grinding was lower in torrefied ground CS with biochar than in torrefied chopped CS with biochar. Adding biochar improved crushing efficiency and particle size reduction for potential compression into fuel pellet production. The CLSM could be used as a complementary technique to SEM or other microscopy methods in examining the surface morphology of biomass for the characterization of fuel properties.
Furthermore, the extent of utilization of biochar as a microwave absorber was analyzed and validated using the CLSM imaging fluorescence signals and 2D imaging capability. The results obtained from this study represent remarkable breakthroughs in converting biomass (camelina straw) into added feedstock for biofuel pellet production. Based on microparticle structural morphology of ground or chopped torrefied CS with biochar, 250 °C is the preferred reaction torrefaction temperature.
The biomass treatment technique through microwave torrefaction has proven its readiness for commercial application in the bioenergy industry. However, it is vital to identify the optimal parameters before scaling up to pilot and commercial scales. The reproducibility of the results obtained from the bench scale study is, to an extent, not realizable for large volumes of herbaceous biomass due to the number of parameters inhibiting the yield and compounding large-scale achievements. Therefore, the decision to provide economic and sustainable breakthroughs in the conversion pathways is to develop technoeconomic models that build upon processing flows, logistics, process models and simulations to perform risk and cost sensitivity analysis, including life cycle assessment and forecasting.
Supplementary Materials
The following supporting information can be downloaded at: https://www.mdpi.com/article/10.3390/fuels5020009/s1, Figure S1: Cumulative passing plots of particle size for non-torrefied camelina straw (CS); Figure S2: Contour plots specific grinding energy (kJ/kg) as a function of torrefaction temperature (°C); Table S1: Analysis of variance response variables and p-values for response variables; Table S2: Multiple regression equations generated by RSM software for each response; Table S3: Validation results for the optimized responses for torrefied ground or chopped CS with and without biochar.
Author Contributions
Conceptualization, O.S.A., L.G.T. and B.E.; methodology, O.S.A., L.G.T. and E.M.; software, O.S.A. and L.G.T.; validation, O.S.A., L.G.T. and E.M.; formal analysis, investigation, data curation, writing—original draft preparation, writing—review and editing, and visualization, O.S.A.; resources, supervision, project administration, and funding acquisition, L.GT. and E.M.; writing—review and editing, O.S.A., L.G.T., B.E. and E.M. All authors have read and agreed to the published version of the manuscript.
Funding
This research was funded by the Biofuel Network (BFN) (ASC-16) and Natural Sciences and Engineering Research Council of Canada (NSERC) (RGPIN-2017-05287).
Data Availability Statement
Not applicable.
Acknowledgments
We acknowledge the technical support of the Agriculture and Agri-Food Canada-Saskatoon Research and Development Centre (AAFC-SRDC). Special thanks are given to the Natural Sciences and Engineering Research Council of Canada (NSERC) and BioFuelNet (Canada) for their funding support for the project.
Conflicts of Interest
The authors declare no conflicts of interest.
Abbreviations
| ANOVA | Analysis of variance |
| ASABE | American Society of Agricultural and Biological Engineers |
| CLSM | Confocal laser scanning microscopy |
| CS | Camelina straw |
| CV | Coefficient of variation |
| kJ | kilojoule |
| L/ha | Liquid per hectare |
| MFI | Mean fluorescence intensity |
| RSM | Response surface methodology |
| SEM | Scanning electron microscope |
| SFI | Sum fluorescence intensity |
| UDD | User-defined design |
References
- Davis, M.; Moronkeji, A.; Ahiduzzaman, M.; Kumar, A. Assessment of renewable energy transition pathway for a fossil fuel-dependent electricity-producing jurisdiction. Energy Sustain. Dev. 2020, 59, 243–261. [Google Scholar] [CrossRef]
- Agu, O.S.; Tabil, L.G.; Mupondwa, E. Actualization and adoption of renewable energy usage in remote communities in Canada by 2050: A review. Energies 2023, 16, 3601. [Google Scholar] [CrossRef]
- Energy Information Administration U.S. 2021—International Energy Outlook. Available online: https://www.eia.gov/outlooks/ieo/narrative/sub-topic-01/php/2021 (accessed on 8 July 2023).
- Littlejohns, J.; Rehmann, L.; Murdy, R.; Oo, A.; Neill, S. Current state and future prospects for liquid biofuels in Canada. Biofuel Res. J. 2018, 5, 759–779. [Google Scholar] [CrossRef]
- IEA, Canada Energy Policy Review 2022—IEA. Available online: https://iea.blob.core.windows.net/assets/7ec2467c-78b4-4c0c-a966-a42b8861ec5a/Canada2022.pdf (accessed on 13 July 2023).
- Liu, T.; McConkey, B.; Huffman, T.; Smith, S.; MacGregor, B.; Yemshanov, D.; Kulshreshtha, S. Potential and impacts of renewable energy production from agricultural biomass in Canada. Appl. Energy 2014, 130, 222–229. [Google Scholar] [CrossRef]
- Neupane, D.; Lohaus, R.H.; Solomon, J.K.; Cushman, J.C. Realizing the potential of camelina sativa as a bioenergy crop for a changing global climate. Plants 2022, 11, 772. [Google Scholar] [CrossRef]
- Mupondwa, E.; Li, X.; Tabil, L.G.; Falk, K.; Gugel, R. Technoeconomic analysis of camelina oil extraction as feedstock for biojet fuel in the Canadian Prairies. Biomass Bioenergy 2016, 95, 221–234. [Google Scholar] [CrossRef]
- Krzyżaniak, M.; Stolarski, M.J.; Graban, L.; Lajszner, W.; Kuriata, T. Camelina and crambe oil crops for bioeconomy—Straw utilization for energy. Energies 2020, 13, 1503. [Google Scholar] [CrossRef]
- Alberghini, B.; Zanetti, F.; Corso, M.; Boutet, S.; Lepiniec, L.; Vecchi, A.; Monti, A. Camelina [Camelina sativa (L.) Crantz] seeds as a multi-purpose feedstock for bio-based applications. Ind. Crops Prod. 2022, 182, 114944. [Google Scholar] [CrossRef]
- Agu, O.S.; Tabil, L.G.; Mupondwa, E.; Emadi, B.; Dumonceaux, T. Impact of biochar addition in microwave torrefaction of camelina straw and switchgrass for biofuel production. Fuels 2022, 3, 588–606. [Google Scholar] [CrossRef]
- Usmani, Z.; Sharma, M.; Awasthi, A.K.; Lukk, T.; Tuohy, M.G.; Gong, L.; Nguyen-Tri, P.; Goddard, A.D.; Bill, R.M.; Nayak, S.; et al. Lignocellulosic biorefineries: The current state of challenges and strategies for efficient commercialization. Renew. Sust. Energy Rev. 2021, 148, 111258. [Google Scholar] [CrossRef]
- Khalsa, J.H.; Leistner, D.; Weller, N.; Darvell, L.I.; Dooley, B. Torrefied biomass pellets—Comparing grindability in different laboratory mills. Energies 2016, 9, 794. [Google Scholar] [CrossRef]
- Wang, L.; Riva, L.; Skreiberg, O.; Khalil, R.; Bartocci, P.; Yang, Q. Effect of torrefaction on properties of pellets produced from woody biomass. Energy Fuels 2020, 34, 15343–15354. [Google Scholar] [CrossRef]
- Bridgeman, T.; Jones, J.; Williams, A.; Waldron, D. An investigation of the grindability of two torrefied energy crops. Fuel 2010, 89, 3911–3918. [Google Scholar] [CrossRef]
- Wang, P.; Howard, B.H. Impact of thermal pretreatment temperatures on woody biomass chemical composition, physical properties and microstructure. Energies 2018, 11, 25. [Google Scholar] [CrossRef]
- Xu, J. Microwave pretreatment. In Pretreatment of Biomass: Processes and Technologies; Pandey, A., Ed.; Elsevier: Waltham, MA, USA, 2015; pp. 157–172. [Google Scholar] [CrossRef]
- Kostas, E.T.; Beneroso, D.; Robinson, J.P. The application of microwave heating in bioenergy: A review on the microwave pre-treatment and upgrading technologies for biomass. Renew. Sustain. Energy Rev. 2017, 77, 12–27. [Google Scholar] [CrossRef]
- Wang, M.; Huang, Y.; Chiueh, P.; Kuan, W.; Lo, S. Microwave-induced torrefaction of rice husk and sugarcane residues. Energy 2012, 37, 177–184. [Google Scholar] [CrossRef]
- Singh, S.; Chakraborty, J.P.; Mondal, M.K. Torrefaction of woody biomass (Acacia nilotica): Investigation of fuel and flow properties to study its suitability as a good quality solid fuel. Renew. Energy 2020, 153, 711–724. [Google Scholar] [CrossRef]
- Huang, Y.; Sung, H.; Chiueh, P.; Lo, S. Microwave torrefaction of sewage sludge and Leucaena. J. Taiwan Inst. Chem. Eng. 2017, 70, 236–243. [Google Scholar] [CrossRef]
- Mohd Fuad, M.A.H.; Hasan, M.F.; Ani, F.N. Microwave torrefaction for viable fuel production: A review on theory, affecting factors, potential and challenges. Fuel 2019, 253, 512–526. [Google Scholar] [CrossRef]
- Mohamed, B.A.; Kim, C.S.; Ellis, N.; Bi, X. Microwave-assisted catalytic pyrolysis of switchgrass for improving bio-oil and biochar properties. Bioresour. Technol. 2016, 201, 121–132. [Google Scholar] [CrossRef]
- Li, J.; Dai, J.; Liu, G.; Zhang, H.; Gao, Z.; Fu, J.; He, Y.; Huang, Y. Biochar from microwave pyrolysis of biomass: A review. Biomass Bioenergy 2016, 94, 228–244. [Google Scholar] [CrossRef]
- Satpathy, S.K.; Tabil, L.G.; Meda, V.; Naik, S.N.; Prasad, R. Torrefaction of wheat and barley straw after microwave heating. Fuel 2014, 124, 269–278. [Google Scholar] [CrossRef]
- Ethaib, S.; Omar, R.; Kamal, S.M.; Awang Biak, D.R.; Zubaidi, S.L. Microwave-assisted pyrolysis of biomass waste: A mini-review. Processes 2020, 8, 1190. [Google Scholar] [CrossRef]
- Liu, D.; Baral, N.R.; Liang, L.; Scown, C.D.; Sun, N. Torrefaction of almond shell as a renewable agent for plastics: Techno-economic analysis and comparison to bioethanol process. Environ. Res. Infrastruct. Sustain. 2023, 3, 015004. [Google Scholar] [CrossRef]
- Zheng, X.; Zhong, Z.; Zhang, B.; Du, H.; Wang, W.; Li, Q.; Yang, Y.; Qi, R.; Li, Z. Techno-economic analysis and life cycle assessment of hydrogenation upgrading and supercritical ethanol upgrading processes based on fast pyrolysis of cornstalk for biofuel. Biomass Conv. Bioref. 2023. [Google Scholar] [CrossRef]
- Gao, W.; Wang, J.; Akhtar, A.; Wei, J.; Li, B.; Xu, D.; Zhang, S.; Zhang, S.; Wu, Y. Effects of carbonization on the physical properties and combustion behaviour of fiberboard sanding dust pellets. Renew. Energy 2023, 212, 263–273. [Google Scholar] [CrossRef]
- Iroba, K.L.; Baik, O.; Tabil, L.G. Torrefaction of biomass from municipal solid waste fractions II: Grindability characteristics, higher heating value, pelletability and moisture adsorption. Biomass Bioenergy 2017, 8–20. [Google Scholar] [CrossRef]
- Mani, S.; Tabil, L.G.; Sokhansanj, S. Grinding performance and physical properties of wheat and barley straws, corn stover and switchgrass. Biomass Bioenergy 2004, 27, 339–352. [Google Scholar] [CrossRef]
- Ibrahim, R.H.; Darvell, L.I.; Jones, J.M.; Williams, A. Physicochemical characterization of torrefied biomass. J. Anal. Appl. Pyrolysis 2013, 103, 21–30. [Google Scholar] [CrossRef]
- Manouchehrinejad, M.; Yue, Y.; de Morais, R.A.L.; Souza, L.M.O.; Singh, H.; Mani, S. Densification of Thermally Treated Energy Cane and Napier Grass. BioEnergy Res. 2018, 11, 538–550. [Google Scholar] [CrossRef]
- Phanphanich, M.; Mani, S. Impact of torrefaction on the grindability and fuel characteristics of forest biomass. Bioresour. Technol. 2011, 102, 1246–1253. [Google Scholar] [CrossRef]
- Bu, Q.; Liu, Y.; Liang, J.; Morgan, H.M.; Yan, L.; Xu, F.; Mao, H. Microwave-assisted co-pyrolysis of microwave torrefied biomass with waste plastics using ZSM-5 as a catalyst for high quality bio-oil. J. Anal. Appl. Pyrolysis 2018, 134, 536–543. [Google Scholar] [CrossRef]
- Khelfa, A.; Rodrigues, F.A.; Koubaa, M.; Vorobiev, E. Microwave-assisted pyrolysis of pine wood sawdust mixed with activated carbon for bio-oil and bio-char production. Process 2020, 8, 1437. [Google Scholar] [CrossRef]
- Agu, O.S.; Tabil, L.G.; Mupondwa, E.; Emadi, B. Torrefaction and Pelleting of Wheat and Barley Straw for Biofuel and Energy Applications. Front. Energy Res. 2021, 9, 699657. [Google Scholar] [CrossRef]
- Hackley, P.C.; Jubb, A.M.; Burruss, R.C.; Beaven, A.E. Fluorescence spectroscopy of ancient sedimentary organic matter via confocal laser scanning microscopy (CLSM). Int. J. Coal Geol. 2020, 223, 103445. [Google Scholar] [CrossRef]
- Depypere, F.; Van Oostveldt, P.; Pieters, J.; Dewettinck, K. Quantification of microparticle coating quality by confocal laser scanning microscopy (CLSM). Eur. J. Pharm. Biopharm. 2009, 73, 179–186. [Google Scholar] [CrossRef]
- Kim, Y.; Kim, B.; Kim, Y.; Lee, D.; Kim, S. The penetration ability of calcium silicate root canal sealers into dentinal tubules compared to conventional resin-based sealer: A confocal laser scanning microscopy study. Materials 2019, 12, 531. [Google Scholar] [CrossRef]
- Maggiano, C.; Dupras, T.; Schultz, M.; Biggerstaff, J. Confocal laser scanning microscopy: A flexible tool for simultaneous polarization and three-dimensional fluorescence imaging of archaeological compact bone. J. Archaeol. Sci. 2009, 36, 2392–2401. [Google Scholar] [CrossRef]
- Sanhueza, M.I.; Castillo, R.D.P.; Meléndrez, M.; Von Plessing, C.; Tereszczuk, J.; Osorio, G.; Pena-Farfal, C.; Fernandez, M.; Neira, J.Y. Confocal laser scanning microscopy as a novel tool of hyperspectral imaging for the localization and quantification of fluorescent active principles in pharmaceutical solid dosage forms. Microchem. J. 2021, 168, 106479. [Google Scholar] [CrossRef]
- Hernando, H.; Fermoso, J.; Moreno, I.; Coronado, J.M.; Serrano, D.P.; Pizarro, P. Thermochemical valorization of camelina straw waste via fast pyrolysis. Biomass Conv. Bioref. 2017, 7, 277–287. [Google Scholar] [CrossRef]
- Iroba, K.L.; Baik, O.; Tabil, L.G. Torrefaction of biomass from municipal solid waste fractions I: Temperature profiles, moisture content, energy consumption, mass yield, and thermochemical properties. Biomass Bioenergy 2017, 105, 320–330. [Google Scholar] [CrossRef]
- Hubbe, M.A.; Chandra, R.P.; Dogu, D.; Van Velzen, S.T.J. Analytical staining of cellulosic materials: A review. BioResources 2019, 14, 7387–7464. [Google Scholar] [CrossRef]
- Azargohar, R.; Soleimani, M.; Nosran, S.; Bond, T.; Karunakaran, C.; Dalai, A.K.; Tabil, L.G. Thermo-physical characterization of torrefied fuel pellet from co-pelletization of canola hulls and meal. Ind. Crops Prod. 2019, 128, 424–435. [Google Scholar] [CrossRef]
- Senol, H.; Ersan, M.; Gorgun, E. Optimization of temperature and pretreatments for methane yield hazelnut shells using the response surface methodology. Fuel 2020, 271, 117585. [Google Scholar] [CrossRef]
- Das, S.; Bhattacharya, A.; Haldar, S.; Ganguly, A.; Gu, S.; Ting, Y.P.; Chatterjee, P.K. Optimization of enzymatic saccharification of water hyacinth biomass for bioethanol: Comparison between artificial neural network and response surface methodology. Sustain. Mater. Technol. 2015, 3, 17–28. [Google Scholar] [CrossRef]
- Kang, K.; Nanda, S.; Sun, G.; Qiu, L.; Gu, Y.; Zhang, T.; Zhu, M.; Sun, R. Microwave-assisted hydrothermal carbonization of corn stalk for solid biofuel production: Optimization of process parameters and characterization of hydrochar. Energy 2019, 186, 115795. [Google Scholar] [CrossRef]
- Song, D.; Yang, S.E. Comparison of dentinal tubule penetration between a calcium silicate-based sealer with ultrasonic activation and an epoxy resin-based sealer: A study using confocal laser scanning microscopy. Eur. J. Dent. 2022, 16, 195–201. [Google Scholar] [CrossRef]
- Zhang, J.; Zou, G.; Tan, Y.; Liu, X.; Li, G.; Zhang, C. Investigating the effect of preheating conditions and size effect on asphalt blending in recycled asphalt mixture: New approach based on artificial aggregate and laser scanning confocal microscopy. Constr. Build. Mater. 2022, 353, 129094. [Google Scholar] [CrossRef]


Disclaimer/Publisher’s Note: The statements, opinions and data contained in all publications are solely those of the individual author(s) and contributor(s) and not of MDPI and/or the editor(s). MDPI and/or the editor(s) disclaim responsibility for any injury to people or property resulting from any ideas, methods, instructions or products referred to in the content. |
© 2024 by the authors. Licensee MDPI, Basel, Switzerland. This article is an open access article distributed under the terms and conditions of the Creative Commons Attribution (CC BY) license (https://creativecommons.org/licenses/by/4.0/).