Abstract
In this paper, a new design strategy is developed for the Wireless Charging Electric Transit Bus (WCETB). The technology is innovative in that the battery in the bus is charged while it is moving over the charging infrastructure. In particular, an improved version of the Whale Optimization Algorithm (IWOA) is adopted for the WCETB system in the road map of Wakefield City, located in the United Kingdom. The main challenge in the WCETB is to select the power transmitter and battery size efficiently from an economical point of view. For this purpose, both factors are considered in the objective function to achieve the benefits of WCETBs from an energy perspective. Two analytical economic design optimization models are developed in this work. The first model is the real- environment model, which considers a WCETB system operating under typical traffic conditions characterized by vehicle interactions and inherent uncertainties. In this scenario, vehicle speeds vary with time, and specific traffic routes may encounter congestion. The second model concentrates on a WCETB system operating in a traffic-free environment with minimal vehicle interactions and uncertainties. The IWOA is implemented for the WCETB to operate in the real environment. Under traffic-free environment conditions, we utilize mathematical procedures and General Algebraic Modeling System (GAMS) software to solve the optimization problem. This approach not only allows us to comprehensively analyze the WCETB system’s behavior but also examine the interactions among different components of the objective function and constraints. Finally, a comprehensive numerical analysis under various conditions, including changes in the number of buses and increases in the length of routes, is conducted.
1. Introduction
Growing concerns about the environmental impact and depletion of fossil fuels (e.g., oil, coal, etc.) have motivated researchers and automakers to pay increasing attention to green electric-power-based vehicles. Over the last decade, numerous promising solutions based on electric-powered vehicles have been introduced to meet future market needs and commercial requirements. Among them, Electric Transit Buses (ETBs) have drawn much attention from municipal governments to be implemented for public transportation purposes [1,2,3,4]. Despite the economic aspects of electric vehicles that have been considered in the literature, these systems face some restrictions from economical and technical perspectives which are mainly created by the long time of battery charging, size of the battery, and restriction of access to the charging station [5,6,7]. Apart from the drawbacks of traditional electric vehicles, many serious problems and limitations have arisen when these systems were adopted for ETBs. For instance, one-third of the total cost of the ETB with small passengers belonged to the battery pack, which is not economically viable. In addition, deployment of a large-pack battery system needs a long recharging time, which is estimated to be about several hours using the existing charging technologies [6,8,9].
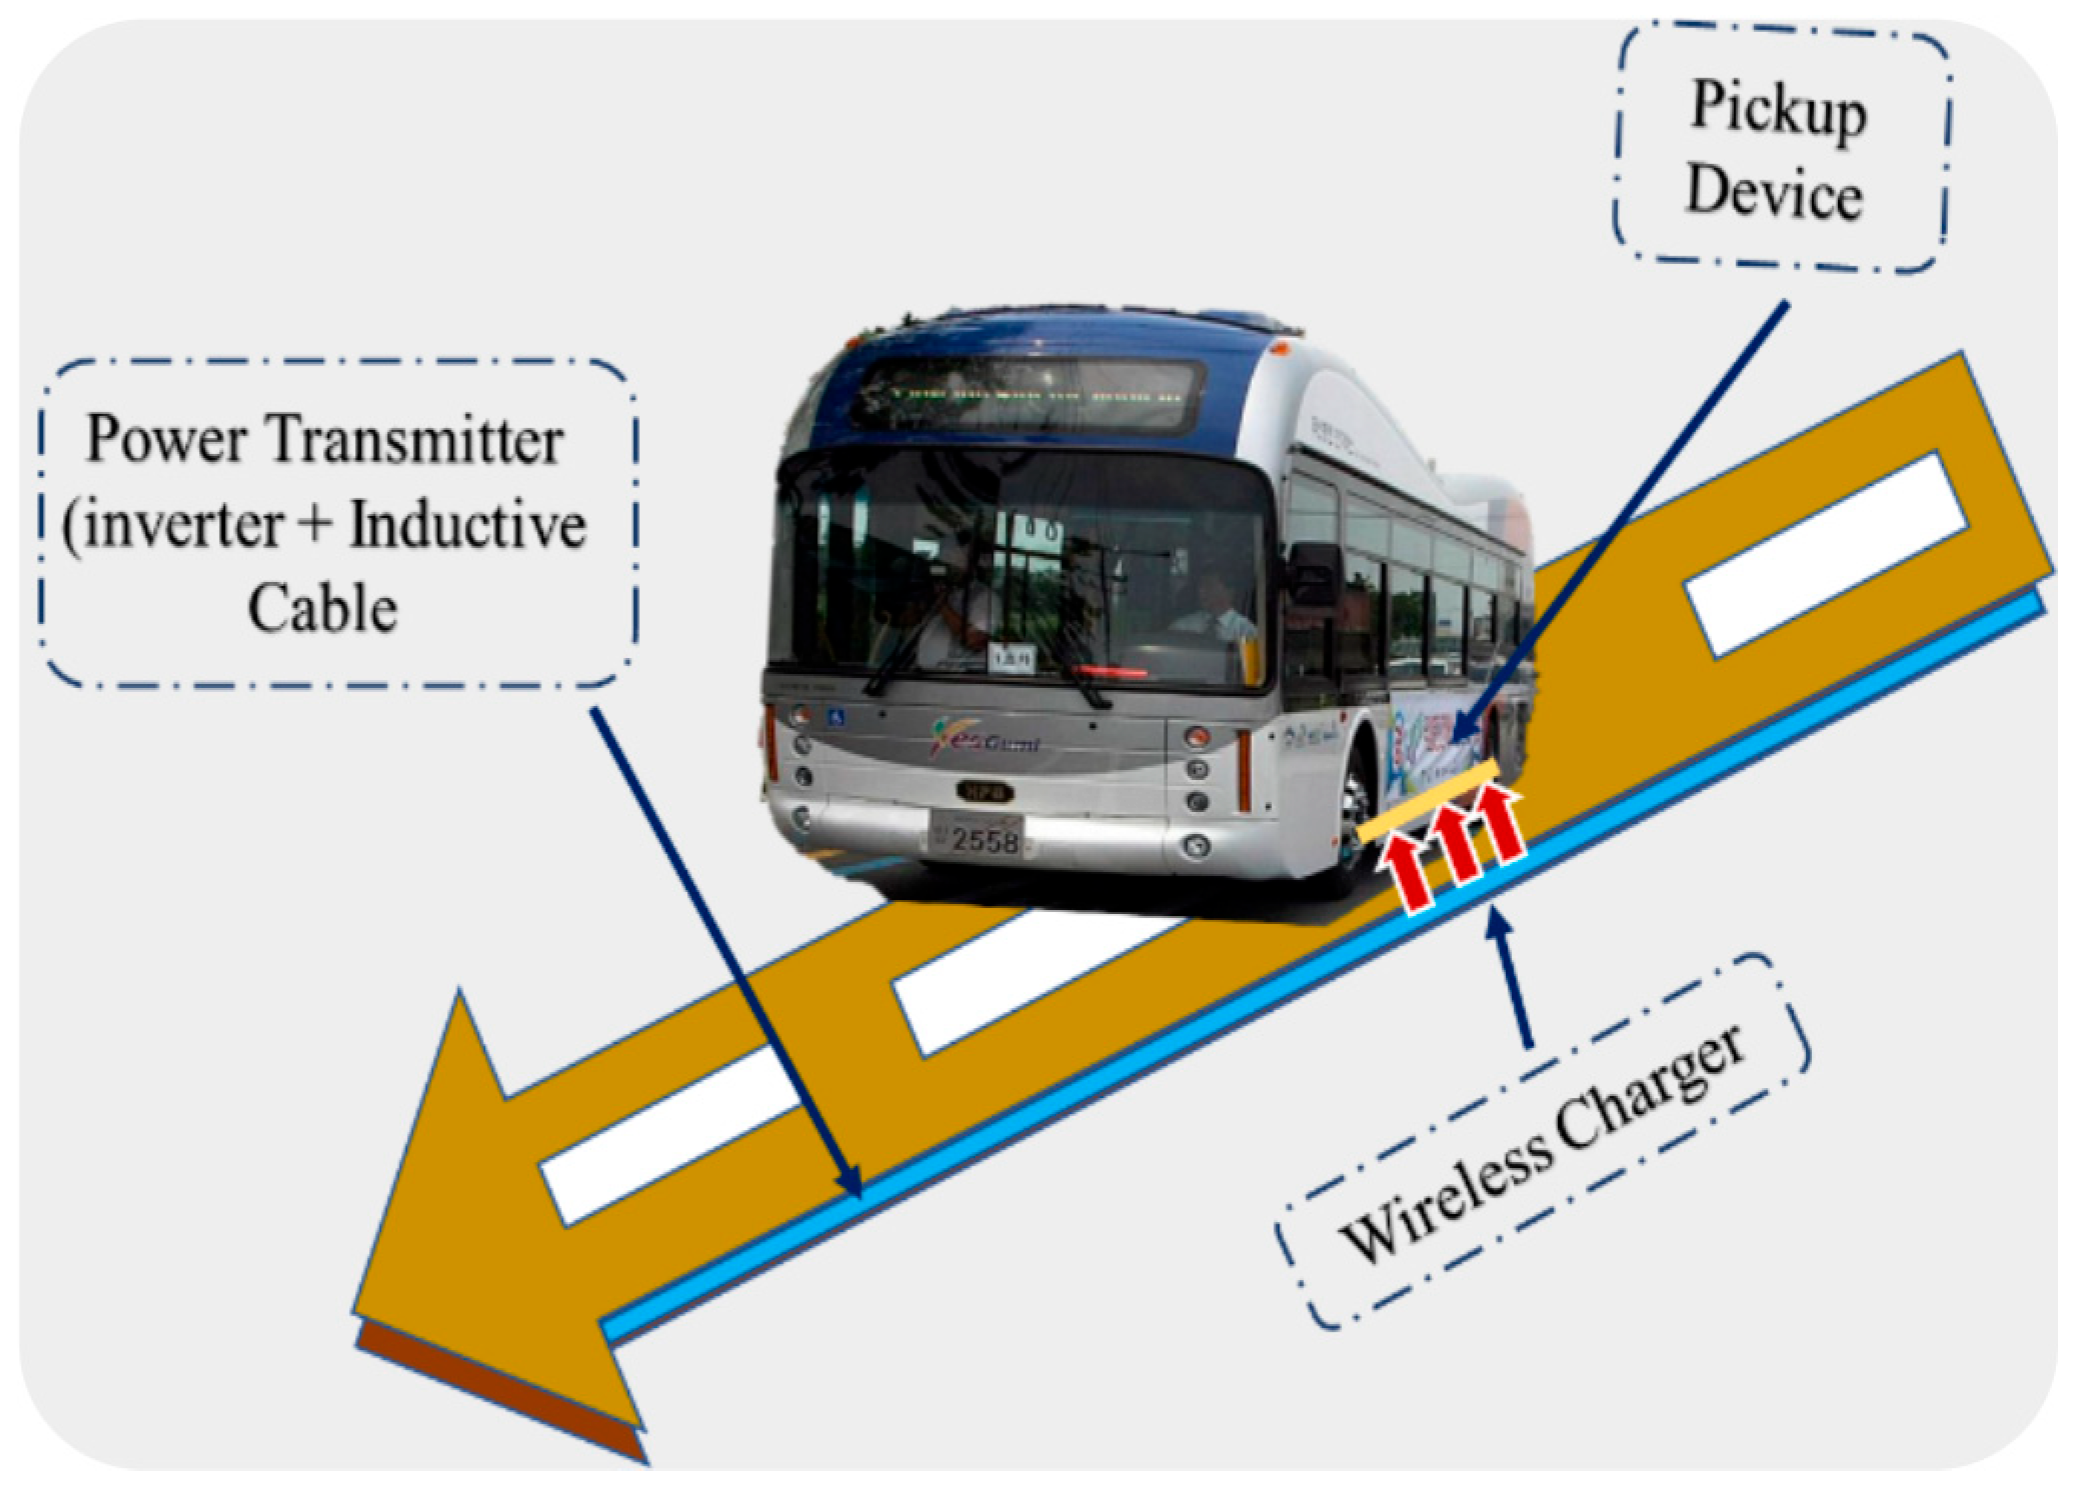
Recently, a new generation of electric vehicles based on wireless charging (WC) technology has been developed to address the problems of current generation systems [10,11,12]. Figure 1 illustrates a Wireless Charging Electric Transit Bus (WCETB) system which is designed based on the wireless power infrastructure equipped with road chargers. In fact, by employing this innovative solution, energy from the network will be transmitted to the vehicle during its movement. The WCETB technology is made of two separate sections: a fleet of vehicles and the charging infrastructure (power transmitters under the road surface) [5,13]. A pickup component is embedded in the structure of WCETB to collect the power from the installed transmitters. The WCETB and traditional electric vehicles have similar concepts where an electric motor and battery pack are adopted as the main engine and energy supply, respectively. However, the WCETB system does not need a cable for connecting the vehicle and charger; the battery in such systems can be wirelessly charged by the transmitters. The power transmitter works based on the idea of noncontact charging which produces a magnetic field to supply the required energy for the vehicle. The inverter and inductive cables are the main components of the power transmitter, which should be installed along the path [5,14].

Figure 1.
Illustration of an innovative WCETB system.
Up to now, various innovative strategies have been proposed by automakers. Dynamic wireless charging was introduced by the Korean Advanced Institute of Science and Technology (KAIST) for electric buses in 2008. In 2012, an advanced version of the shuttle bus prototype was constructed at the KAIST campus [15]. Despite the wireless power, ETB was first introduced by the KAIST, and several other wireless-based power ETB systems were developed with promising ideas. For instance, Utah State University (USU) conducted an electrical examination route that demonstrated the significant potential of dynamic wireless power technology in online electrical buses [16,17].
Despite the benefits of the WCETB system, the implementation of wireless charging technology brings new challenges to the electric bus systems, i.e., the allocation of a power transmitter and capacity of the battery [13,18,19]. The deployment of large power transmitters reduces the capacity of the battery system; however, the initial costs of power transmitters will be raised. When the power transmitters are less adopted, large batteries are required in the electric buses, which increases the long-term cost of storage systems. Thus, a balance between the two factors is desirable, and it necessitates minimizing the relationship between the power transmitter and battery size [20]. Despite the rich body of literature on wireless charging electric transit buses, limited works have been devoted to the optimal design problem of such systems. Helber et al. [14] studied the location problem of the dynamic wireless charging system to supply power to such vehicles during their operation. However, the algebraic scheme suggested in [14] suffers the complexity of implementation in solving high-dimension problems. To address this issue, meta-heuristic techniques are often recognized as a promising scheme to solve engineering problems. Utilizing a metaheuristic approach has several benefits, one of which is the ability to see any problem as a “black box” and then modify the constraints, coefficients, and objective function in accordance with the problem specification. Dae Ko and Jang [5] developed an analytical strategy based on a particle swarm optimization (PSO) algorithm to simulate the charging/discharging of the battery for multiple On-line Electric Vehicles (OLEVs). In [6], Jae Jang et al. proposed an innovative energy-powered transportation scheme for online electric vehicle-based shuttle buses to commercialize the deployment of this technology. In this study, a compromise between the allocation of energy transmitters and battery capacity is provided for commercial purposes. The location of the power transmitter and battery capacity was optimally designed by Mixed Integer Programming (MIP) [9].
Overall, the contributions of the present work are the following:
- (I).
- In the current work, a novel meta-heuristic optimization approach based on an Improved version of the Whale Optimization Algorithm (IWOA) has been developed for the problem of the WCETB system in a multi-criteria scheme.
- (II).
- The problem of the WCETB system has been formulated and optimally designed to offer a compromise between the power transmitter and battery capacity for commercial purposes.
- (III).
- The efficiency of the suggested optimal strategy for the WCETB system has been verified under two different operations, namely neglecting traffic congestion and considering traffic congestion.
- (IV).
- The optimization problem was solved by General Algebraic Modeling System (GAMS) software to verify the outcomes obtained by the meta-heuristic scheme.
- (V).
- The sensitivity analysis of the WCETB system has been carried out under various conditions, i.e., changes in the number of buses and length of the route.
The remainder of the current paper is organized as follows: In Section 2, the configuration and operational issues of WCETB are described. The proposed optimization is presented in Section 3. Section 4 is devoted to numerical analysis and comparison outcomes. The conclusions are summarized in Section 5.
2. The System Architecture of Wireless Charging Electric Transit Bus
2.1. Configuration of WCETB System
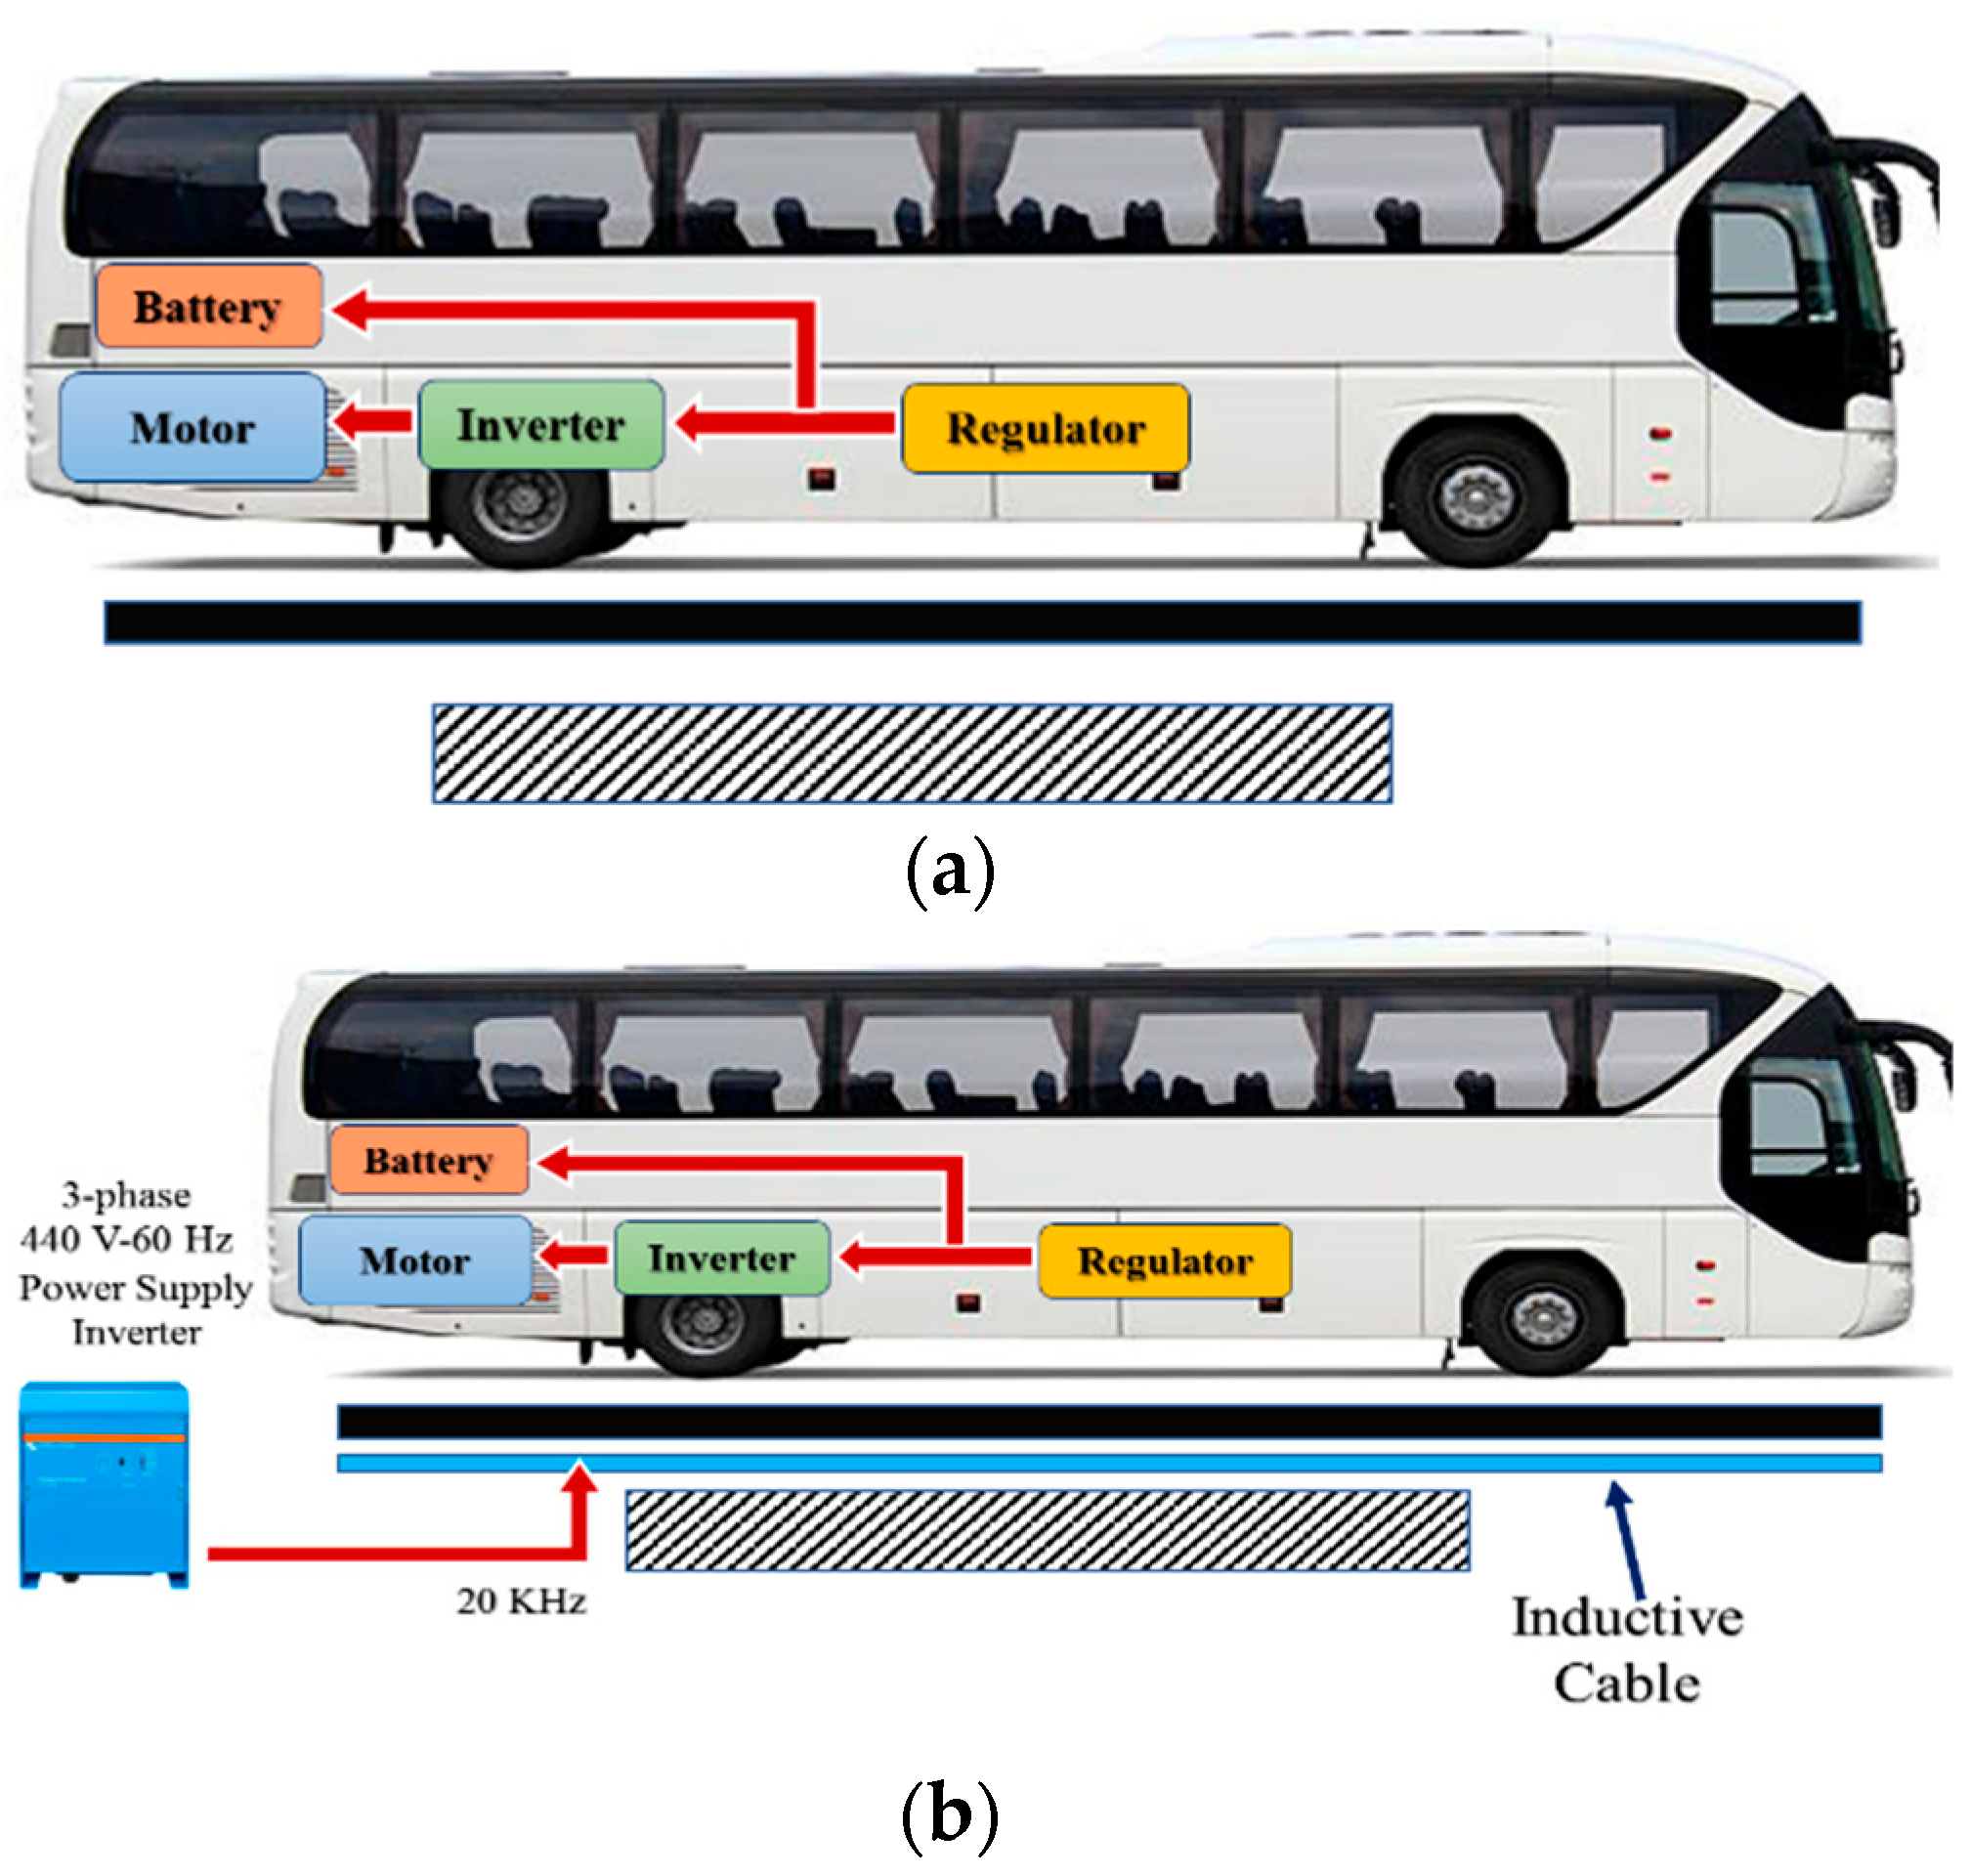
The WCETB system is a commercial wireless charging system that comprises electric buses and a charging infrastructure [21,22]. In this system, the charging infrastructure consists of multiple power transmitters that are installed underground. An inverter is employed to convert the frequency and regulate the current flow through an inductive cable. The electric buses are equipped with pickup elements that generate DC power for the vehicle’s engine. These pickup elements extract power from the transmitter and distribute it to both the engine and the battery system, based on the energy requirements of the respective components. In instances where a transmitter is not available while the WCETB system is in operation, the bus’s engine is powered by the battery [23,24].
2.2. Location Problem of WCETB System
Since the wireless transmitter provides the possibility for the motor to obtain energy wirelessly during the operation of the vehicle on the road, the bus system does not need to be in idle mode for recharging the storage system. As an ideal consequence, the WCETB system will move without the need for any bulky battery [25]. However, the initial investment of the WCETB system due to the utilization of the power transmitters is higher than that of the plug-in electric vehicle system. In the long run, the deployment of the WCETB system is more cost-effective, i.e., the battery’s size is reduced, and the operating time is enhanced by eliminating the time that would be dedicated to recharging. Moreover, the costs of the battery system and the transmitters include the major portion of the entire cost of the WCETB [17].
In particular, the size of the battery system and the allocation of the power transmitters are inversely proportional to each other. Thus, the energy consumption of the electric bus and the charging level of the transmitters need to be quantified to optimally place the transmitters and choose the battery size. In the model of WCETB, some physical constraints should be considered for practicality, e.g., it is not possible to install the transmitter on the bridge. The quantitative model that evaluates the optimal capacity of the battery and the location of the transmitters must take these physical constraints into account [5].
3. Development of the Electric Transit Bus with Wireless Charging Infrastructure
In this section, the mathematical modeling of the WCETB system is developed to build an optimization problem for minimizing the entire system. In the optimization problem, the battery’s size and allocation of the transmitter are the main design factors.
Before formulating the system’s model, the operational rules along with the notations are presented [17]. The scheme of the architecture of the WCETB system is shown in Figure 2.

Figure 2.
WCETB system: Charging/depleting the energy in the vehicle. (a) A vehicle is operating on the road where no transmitter unit is installed. (b) A vehicle is operating on the road where the transmitter unit is installed.
- The Model Rules and Notations:
- (I).
- The operation of the bus is on a fixed path with multiple stopping points for loading and unloading passengers. The length of route L is assumed to be known.
- (II).
- The route data including the accurate position of the bus stops, stopping points, and the degree of slope of the route are available.
- (III).
- Battery units of an identical size are assumed for each bus system. Battery cost is commensurate with capacity, and its cost per unit capacity in kilowatt-hours is defined by .
- (IV).
- A number of transmitters are buried along the route.
- (V).
- The start and end positions of the power cable belonging to the th transmitter unit are denoted by and , respectively. These variables represent the distance between the unit and the bus station. The length of cable for the th transmitter is obtained as under the following assumptions:
- (VI).
- Since there is a limitation for the power supply of the inverter, the length of the transmitter cable is limited. The maximum cable length is represented by , which is expressed by
- (VII).
- The cost of the transmitter unit comprises:
- (a)
- the cost of the inverter [cost per unit of inverter];
- (b)
- the cost of the transmitter cable [cost per unit length of cable].
- The cost of the th transmitter unit is given by the following function:
- (VIII).
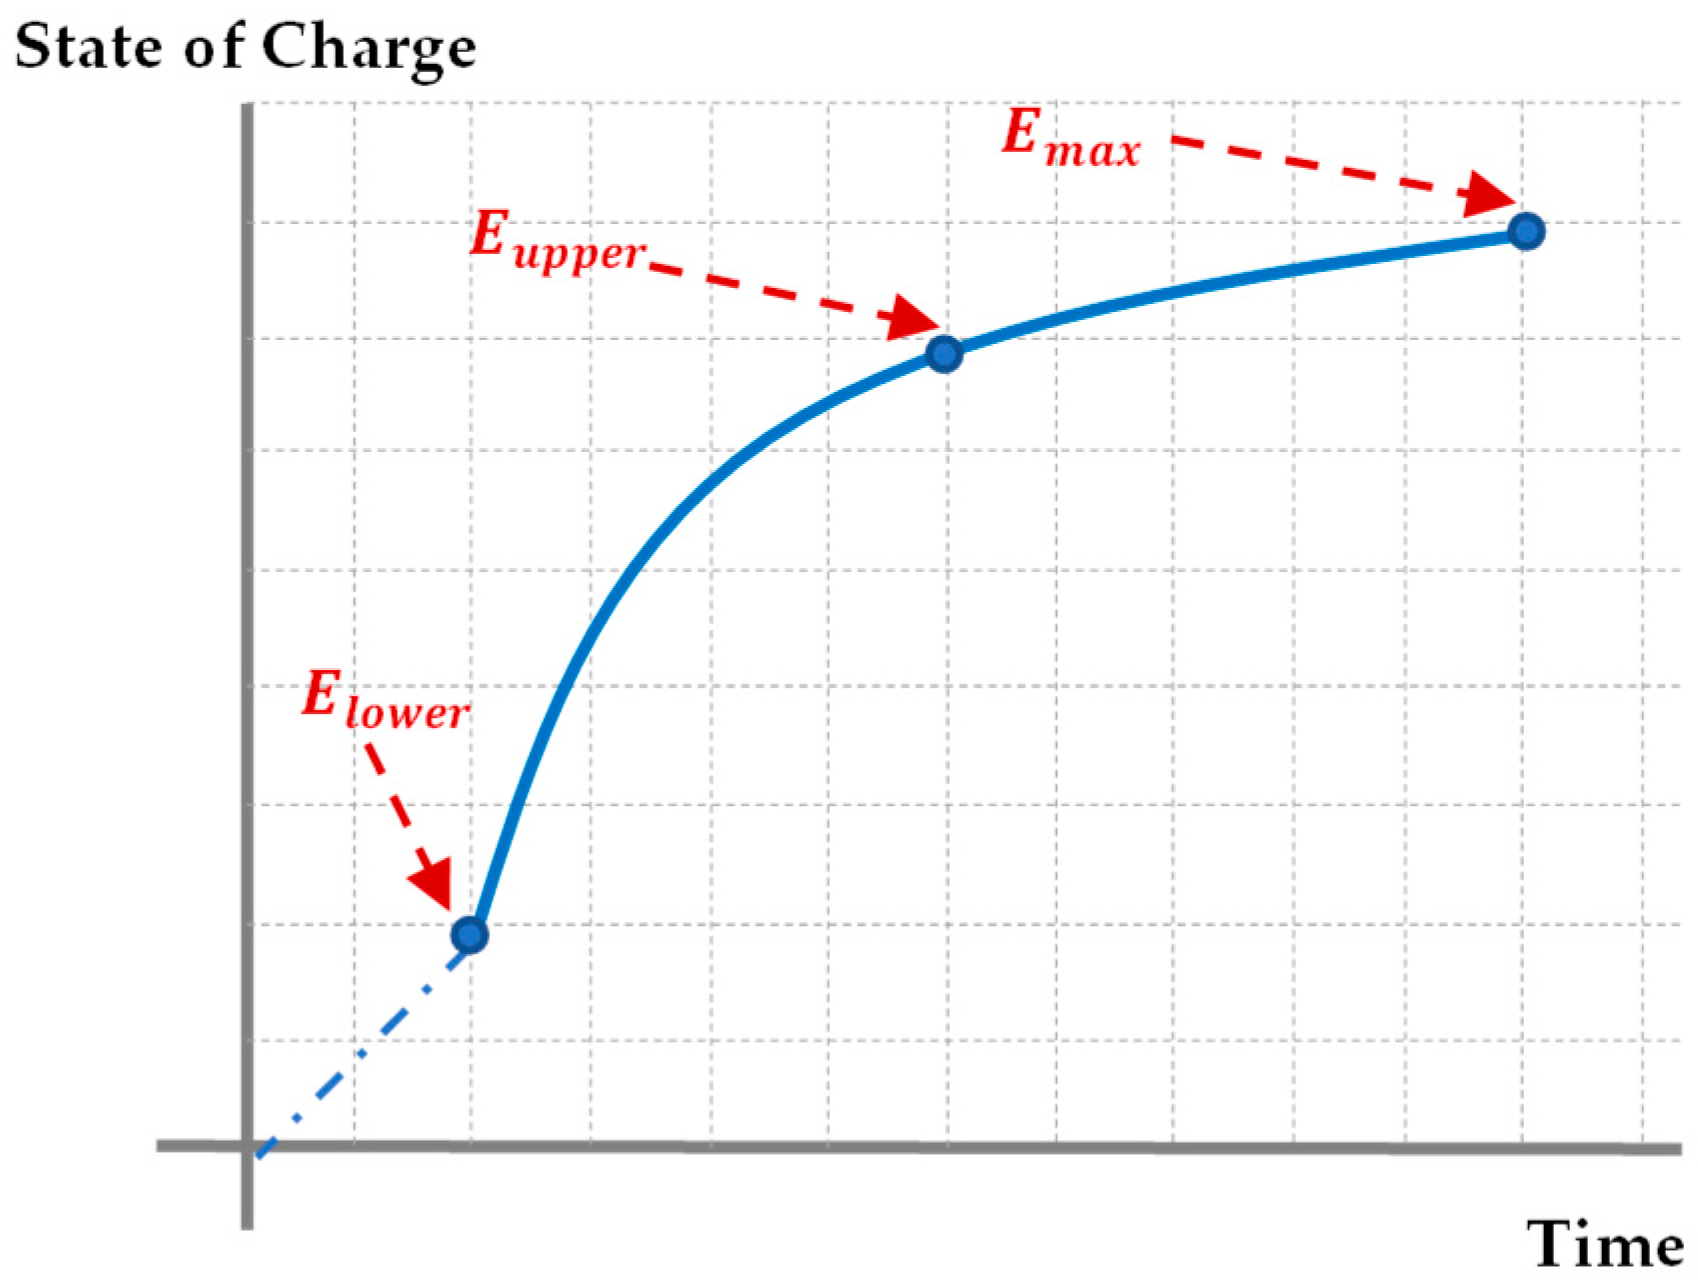
- The energy stored in the battery at time is denoted by . The maximum possible allowed battery capacity is shown by ; and denote the upper and lower battery capacities, respectively (see Figure 3). The mentioned terms should satisfy the following relationships:where terms of α and β are constant with the following definitions: , and .
 Figure 3. Illustration of charging/depleting power in the battery of the WCETB system.
 - (IX).
- At the starting point, the level of state of charge (SOC) is , and the remaining energy level should be greater than .
- Decision Variables:
The position of transmitter units is described by a spatial set, given as [6]:
where . Then, the terms and are the bus travel time and velocity projection of the vehicle at time , respectively. Under the above definitions, the displacement variable () is described by
By the description of (6), the time in which the bus travels over a transmitter unit is defined by a temporal set:
where .
3.1. Configuration of Wireless Bus with Considering Traffic
In this work, the goal is to find the battery size and to allocate the transmitter units by minimizing the operational costs of the vehicle, while the battery capacity is kept within . For the studied WCETB system, the optimization problem with consideration of traffic congestion for vehicles are illustrated as:
subject to
where , , , respectively, denote the battery cost (cost/kWh), the fixed installation cost of a transmitter (cost/transmitter), and the installation cost of the transmitter’s length (cost/length). In this realistic scenario, vehicle speed is a function of time, and certain traffic routes experience congestion. An illustrative example of such an environment is electric buses operating alongside regular traffic, a common occurrence in traffic networks worldwide.
3.2. Configuration of Wireless Bus without Considering Traffic
The second model focuses on a WCETB system operating in an environment with no traffic and minimal vehicle interactions and uncertainties. This scenario is representative of dedicated bus lanes where public buses can operate independently. For the formulation of this system, a decision variable is defined by , which denotes the length of the transmitter at the station . Generally, the optimization problem without considering traffic congestion can be formulated as follows [6]:
subject to
4. Whale Optimization Algorithm
Mirjalili et al. [26] introduced a new population-based algorithm, called the Whale optimization algorithm (WOA), which mimics the unique hunting manner of humpback whales, i.e., spiral bubble-net foraging mechanism. The foraging behavior in the native algorithm is conducted by generating distinctive bubbles on a circular or ‘9-shaped’ path. This particular species of whale is able to dive about 10 m to15 m down and produce bubbles in a spiral form around the prey to move to the surface. Then, the prey is encircled by the humpback whales which prevents its escape. The mathematical model of the original WOA is elaborated in two steps, i.e., encircling prey and bubble-net attacking mechanism [27,28].
4.1. Encircling Prey
The movement characteristic of humpback whales towards the best search agent (best position of whales) is determined using (26) and (27) [29,30].
where and represent the variable vector, denotes the best solution obtained to the tth iteration, and | | denotes the absolute value. Moreover, the vectors and can be calculated by the relationships given in (28) and (29), respectively.
where denotes a random vector within [0, 1] and is linearly reduced from 2 to 0 during the course of generations.
4.2. Bubble-Net Attacking Mechanism (Exploitation Phase)
The mathematical formulation to model the bubble-net attacking movement of the whales is described in the following sections:
4.3. Shrinking Encircling Approach
This mechanism is realized by reducing from 2 to 0 over the course of generations. The search agent is located between the position of the best solution and the original location of the agent by generating the random values for in the interval [−1, 1].
4.4. Logarithmic Movement of Spiral Updating
The helix-shaped behavior of whales is imitated by a spiral relationship, given as
where denotes the distance between the ith whale and the prey (the best search agent obtained thus far).
The humpback whales will perform a logarithmic spiral movement for hunting herds of fish. In this mechanism, it is assumed that the locations of the whales will be modified by Equation (32), where the possibility of 50% is dedicated to each of the modifications, given as
where is a random number generated in the interval [0, 1].
4.5. Search for Prey (Exploration Phase)
For exploration, the term is adopted, which is selected to be more than 1 or less than −1. By considering , the mathematical formulation of this phase is described as
where is a random search agent.
4.6. The Proposed Approach (IWOA Algorithm)
Although the WOA algorithm has shown a high ability to solve engineering problems, the native algorithm suffers the trapping into a local optimum due to the utilization of the randomness pattern at updating the search agents, especially at the early stages of the iterative process. To alleviate this, two perturbation mechanisms around the best- search whale are applied to prevent premature convergence. In this scheme, two mechanisms of polynomial mutation (PLM) techniques in regards to opposition-based learning (OBL) and quasi-OLB (QOBL) are utilized. A distribution with the polynomial probability is implemented in the PLM, which makes the current value of a coefficient change to its neighbor value. The distribution of PLM is defined by a mean and variance index q. By adopting the PLM operator, the mutation of solutions from the best whale is defined as in [31]:
where q denotes the shape parameter, which has a positive real value, and denotes a constant quantity. The value of according to the concept of OBL () and QOBL () is obtained by
where the lower and upper bounds of the search agent are denoted by lj and uj.
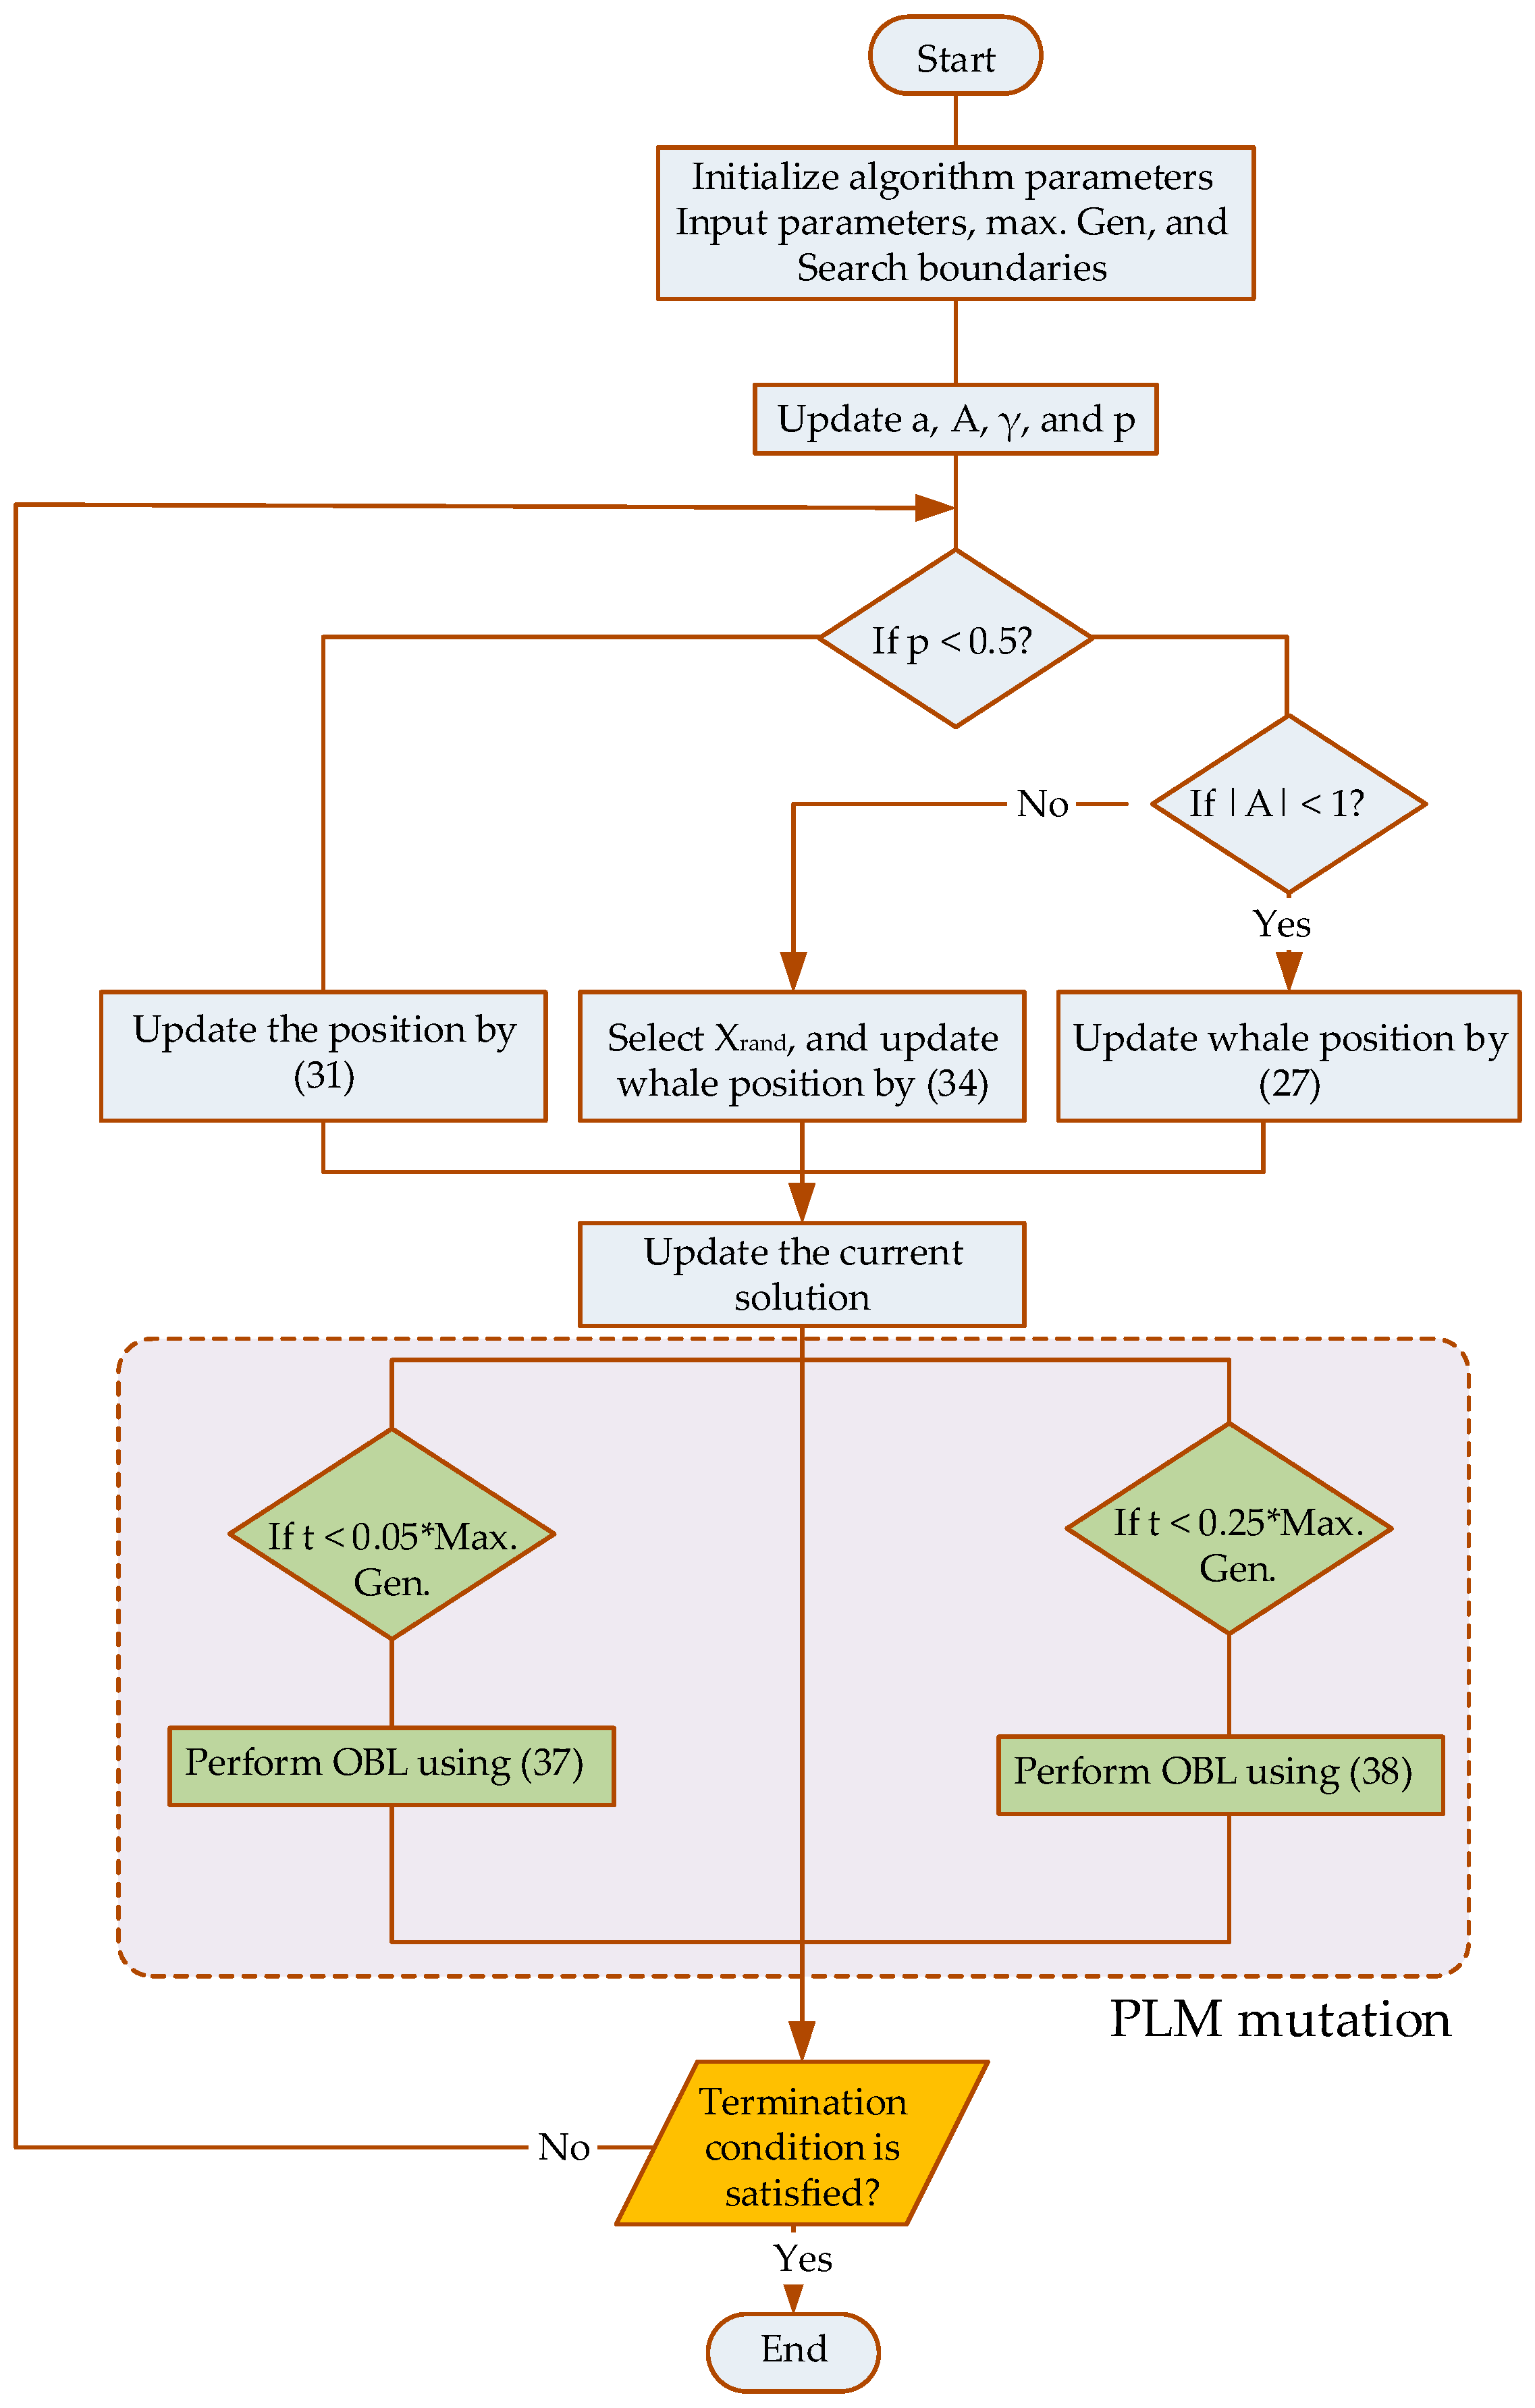
The flowchart of the IWOA is elaborated in Figure 4 [31].
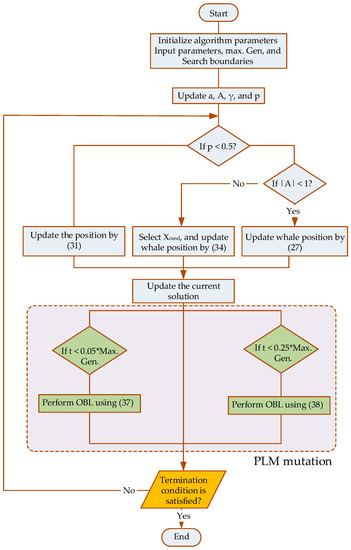
Figure 4.
Flowchart of IWOA algorithm.
5. Numerical Verifications
This section involves a quantitative analysis using real operational data gathered from an actual route in Wakefield, United Kingdom. In the first scenario, the suggested IWOA algorithm is applied to the Wakefield road map while considering traffic congestion. A detailed comparison is made between the proposed IWOA algorithm and several other established algorithms, including the harmony search algorithm, the sine-cos algorithm, the JAYA algorithm, and the PSO algorithm. This comparison serves to highlight the effectiveness of the proposed meta-heuristic algorithm discussed in Section 4.6. Moving to the second scenario, a comprehensive exploration of the simplified model of the WCETB system is conducted. This investigation is focused on the absence of traffic congestion, aiming to showcase the proposed method and thoroughly analyze the characteristics of the WCETB system. Furthermore, a specific portion of the numerical analysis is dedicated to sensitivity analysis. This analysis encompasses variations in the number of buses, different load scenarios, and the extension of route length. The primary objective here is to illustrate the impact of these parameters on the WCETB system, shedding light on its behavior and performance under diverse conditions.
5.1. Scenario I: Computational Outcomes by Considering Traffic Congestion (Realized by Met-heuristic Methodologies)
A numerical test network along with the real data are considered to appraise the suitability of the suggested optimization scheme for the WCETB system. Note that all the cases are run on a desktop PC with a 64-bit Windows operating system, an Intel Core i7 @ 3.3 GHz processor, and 8 GB of RAM. Figure 5, and Table 1 illustrate the road information of the WCETB system that operates in Wakefield, located in the United Kingdom (UK). As shown in Figure 5, 16 bus stations (start/end station to the 15th station) are considered on the road map. The profile of the route’s velocity and road gradient is the main feature of the studied WCETB system, which is depicted in Figure 6.
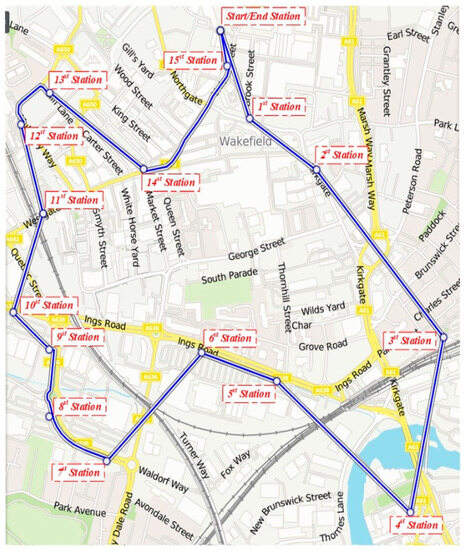
Figure 5.
Wireless charging transit bus real road map in Wakefield.

Table 1.
Parameters of Case Study.
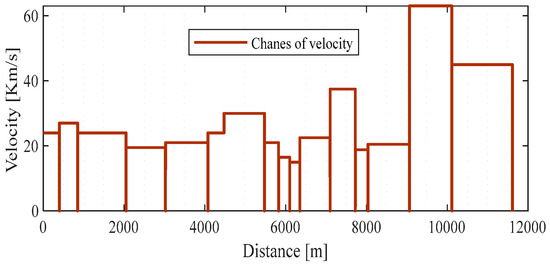
Figure 6.
Velocity profile of WECTB system in Wakefield.
From the curve of Figure 6, it is evident that the movement of the vehicle varies during the path, while the speed becomes zero at each station. The optimal solution with the application of IWOA is illustrated in Figure 7.

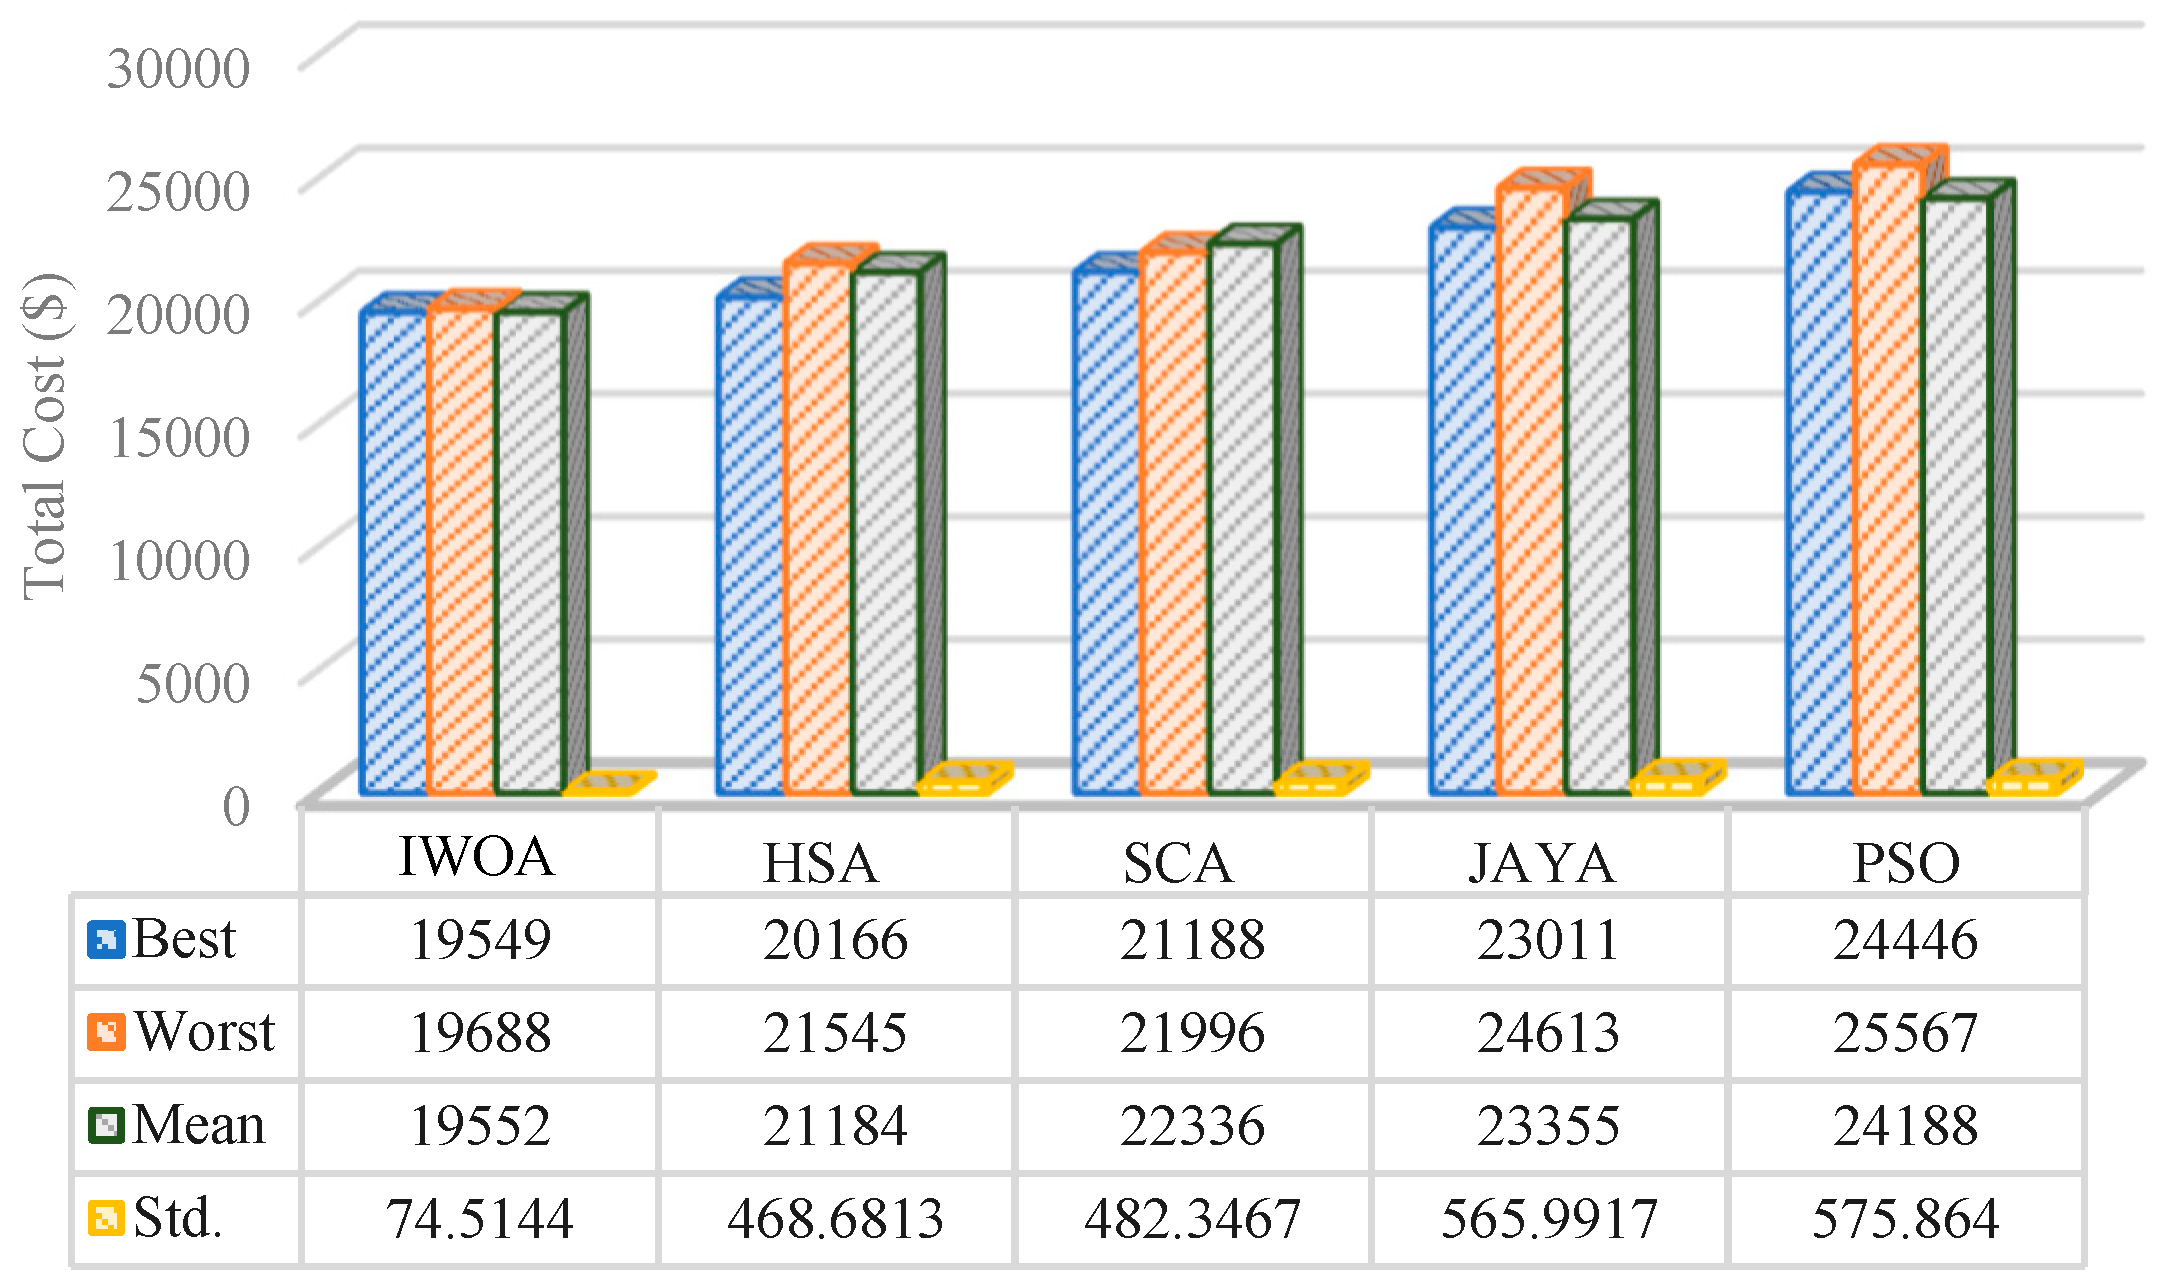
Figure 7.
The quantitative comparison of the total cost with various meta-heuristic methodologies.
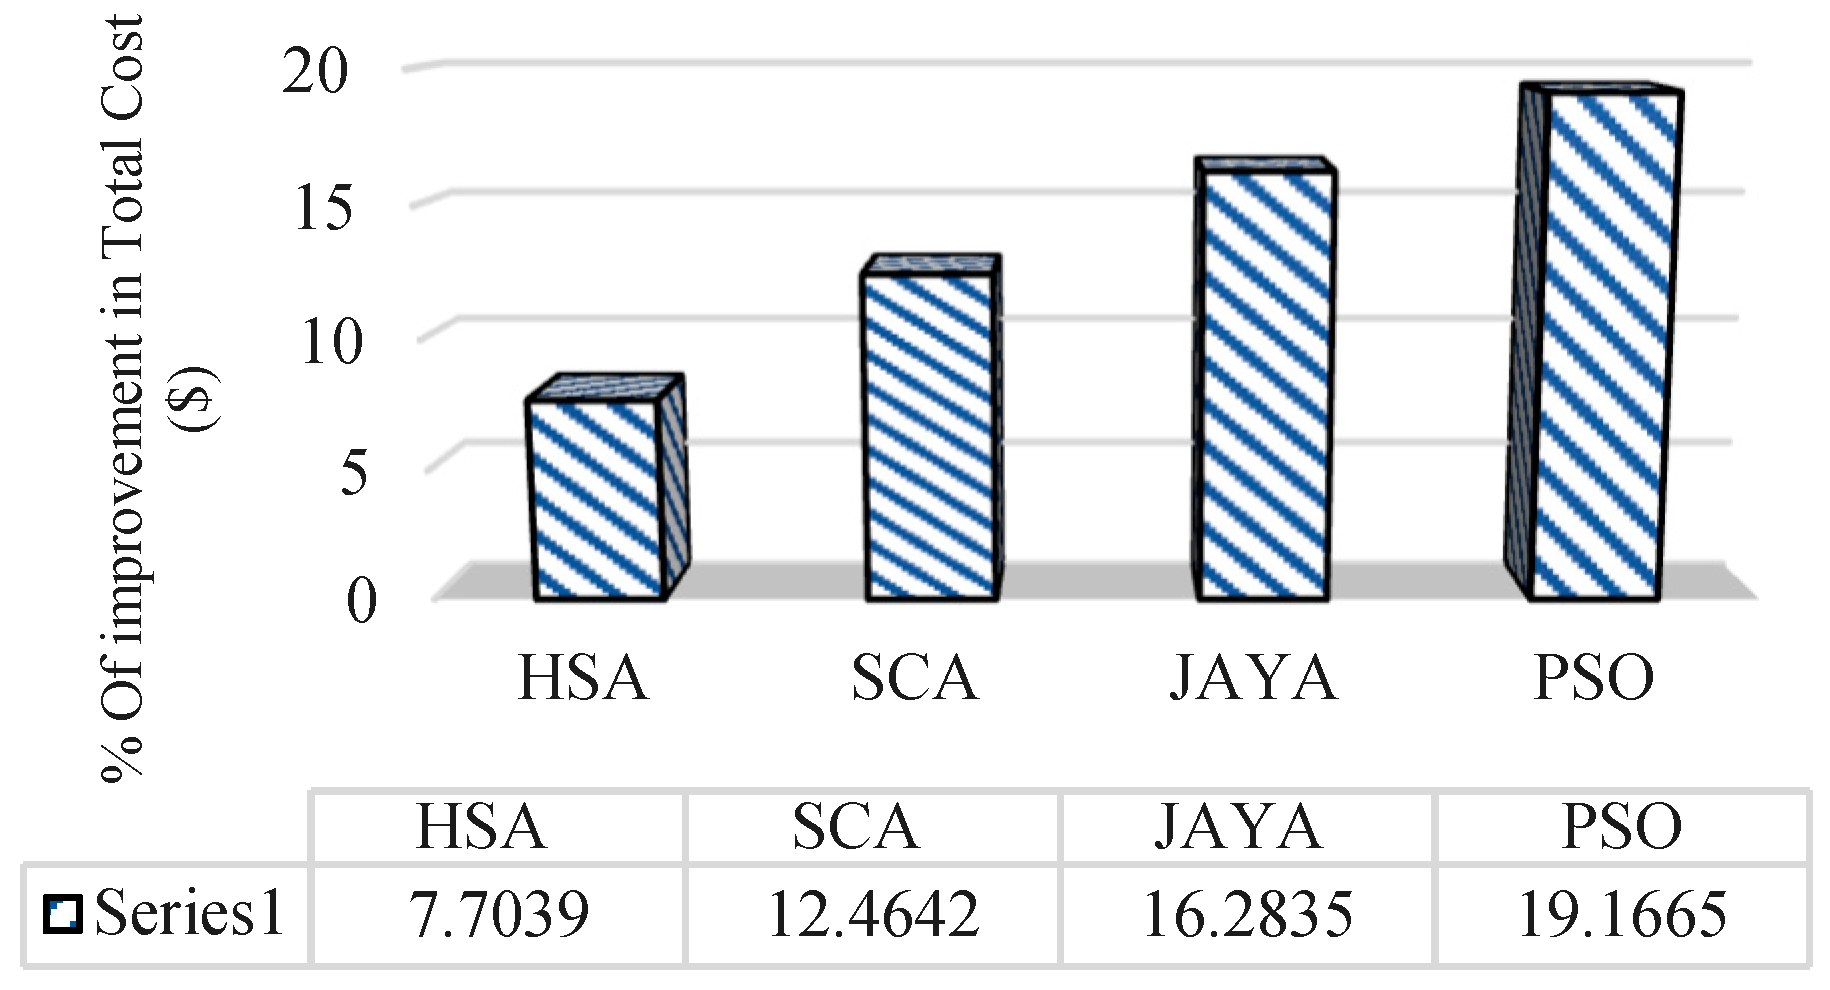
To appraise the superiority of the suggested optimal design-based IWOA, the obtained outcomes are compared with HSA (harmony search algorithm) [32], SCA (sine-cos algorithm) [33], JAYA [34], and PSO [6] algorithms. From the numerical outcomes of Figure 7, it is revealed that by employing IWOA, a lower value of total cost in terms of best, worst, average (mean), and standard deviation is reached over the compared approaches. The percent improvement of IWOA over the HAS, SCA, JAYA, and PSO is depicted in Figure 8. The quantitative analysis confirms the suitability of the suggested optimal scheme for selecting the size of the battery and planning WCETB infrastructure.

Figure 8.
The percent improvement of the total cost with the application of IWOA over meta-heuristic methodologies.
5.2. Scenario II: Computational Outcomes by Neglecting Traffic Congestion (Realized by Algebraic Scheme, GAMS)
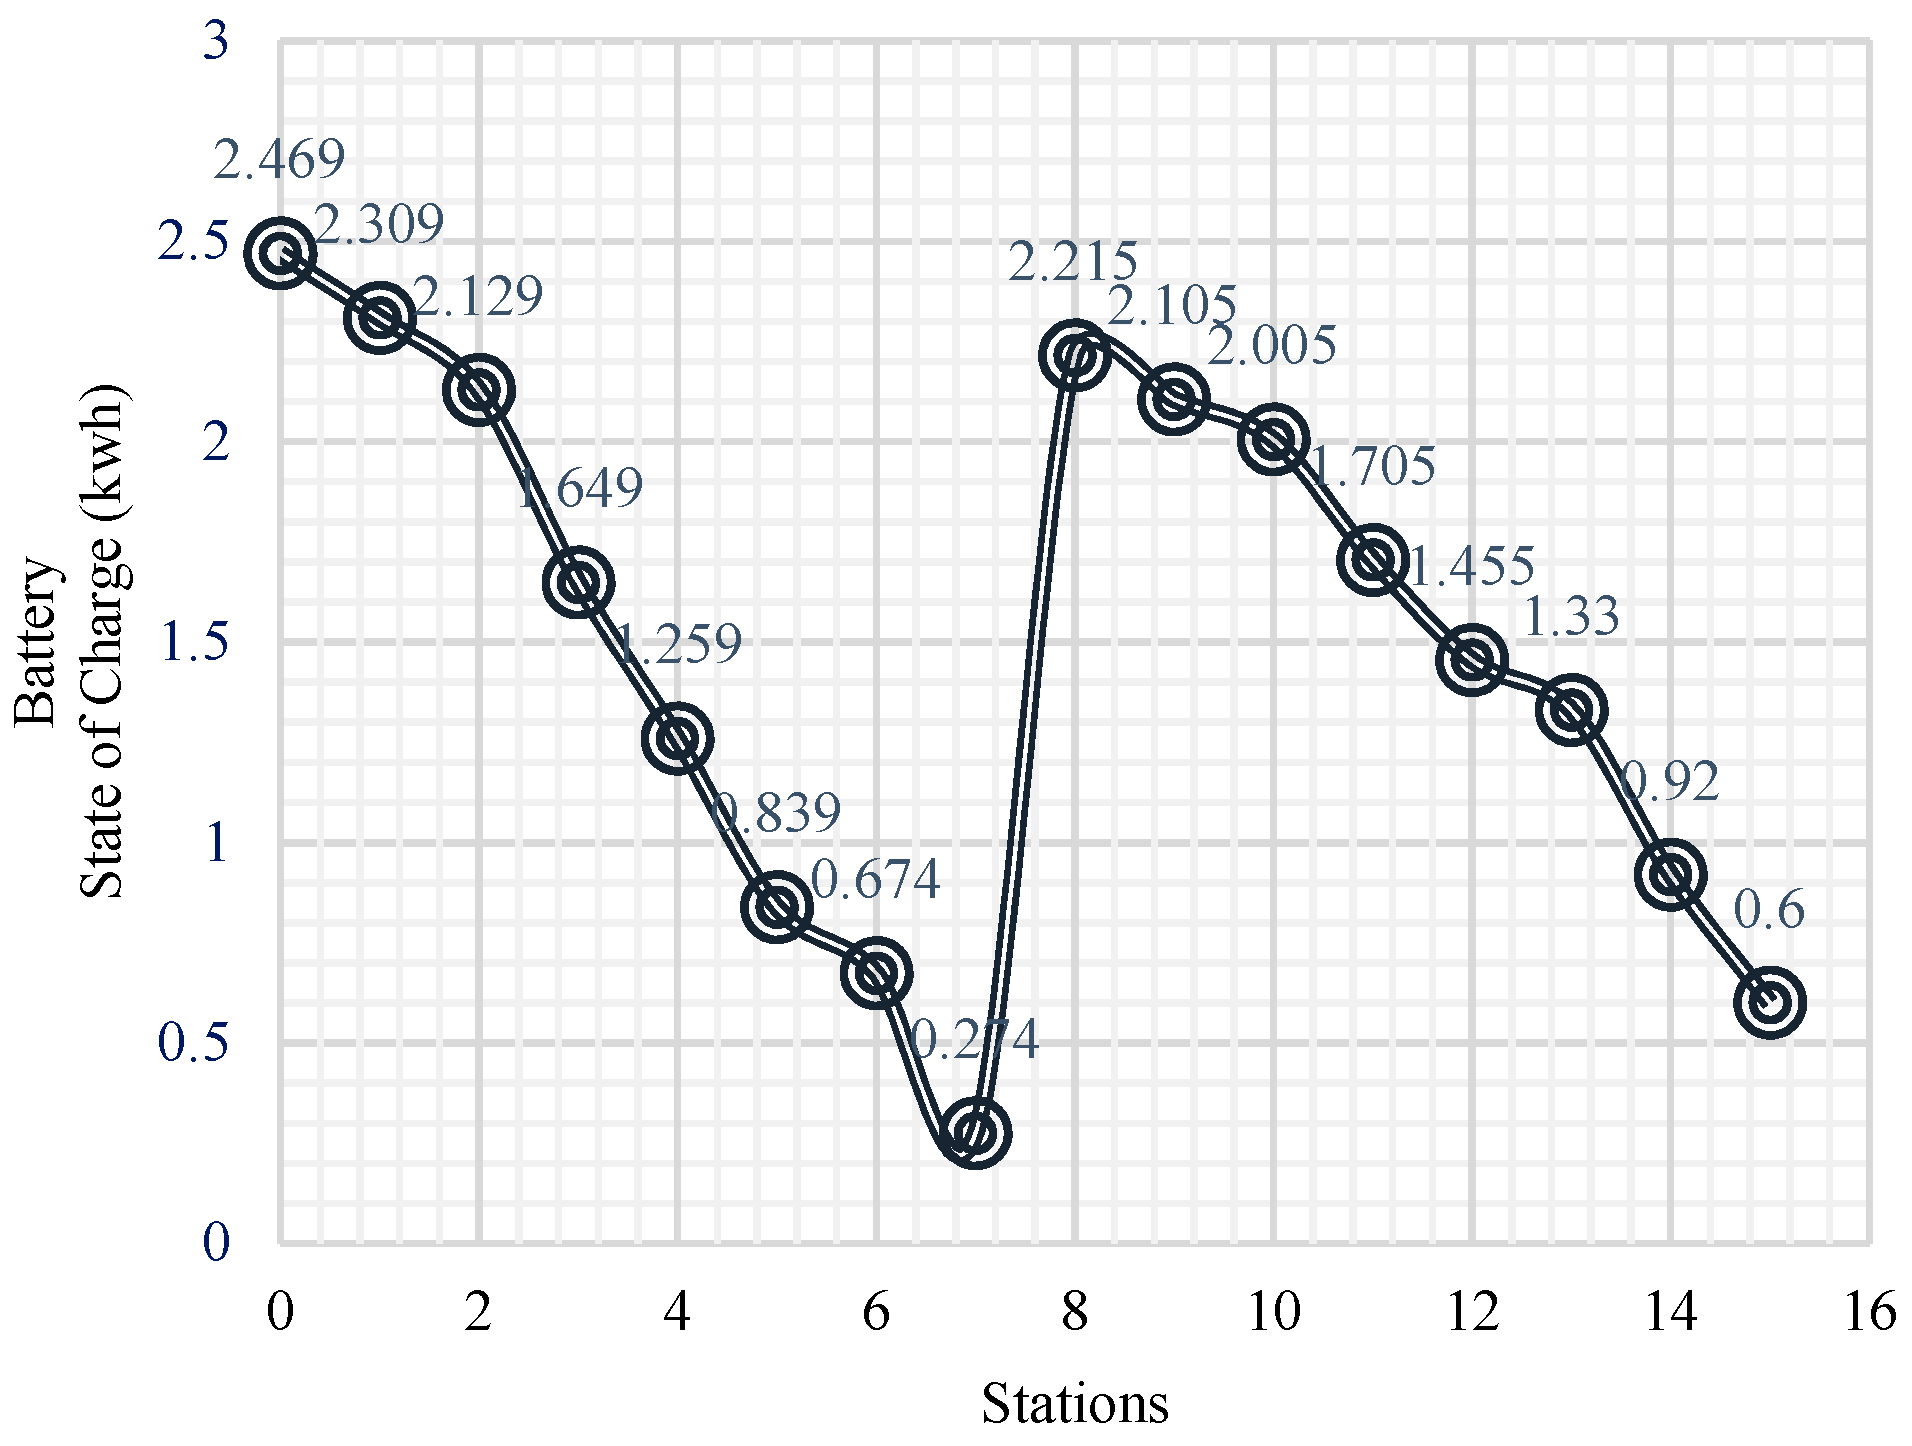
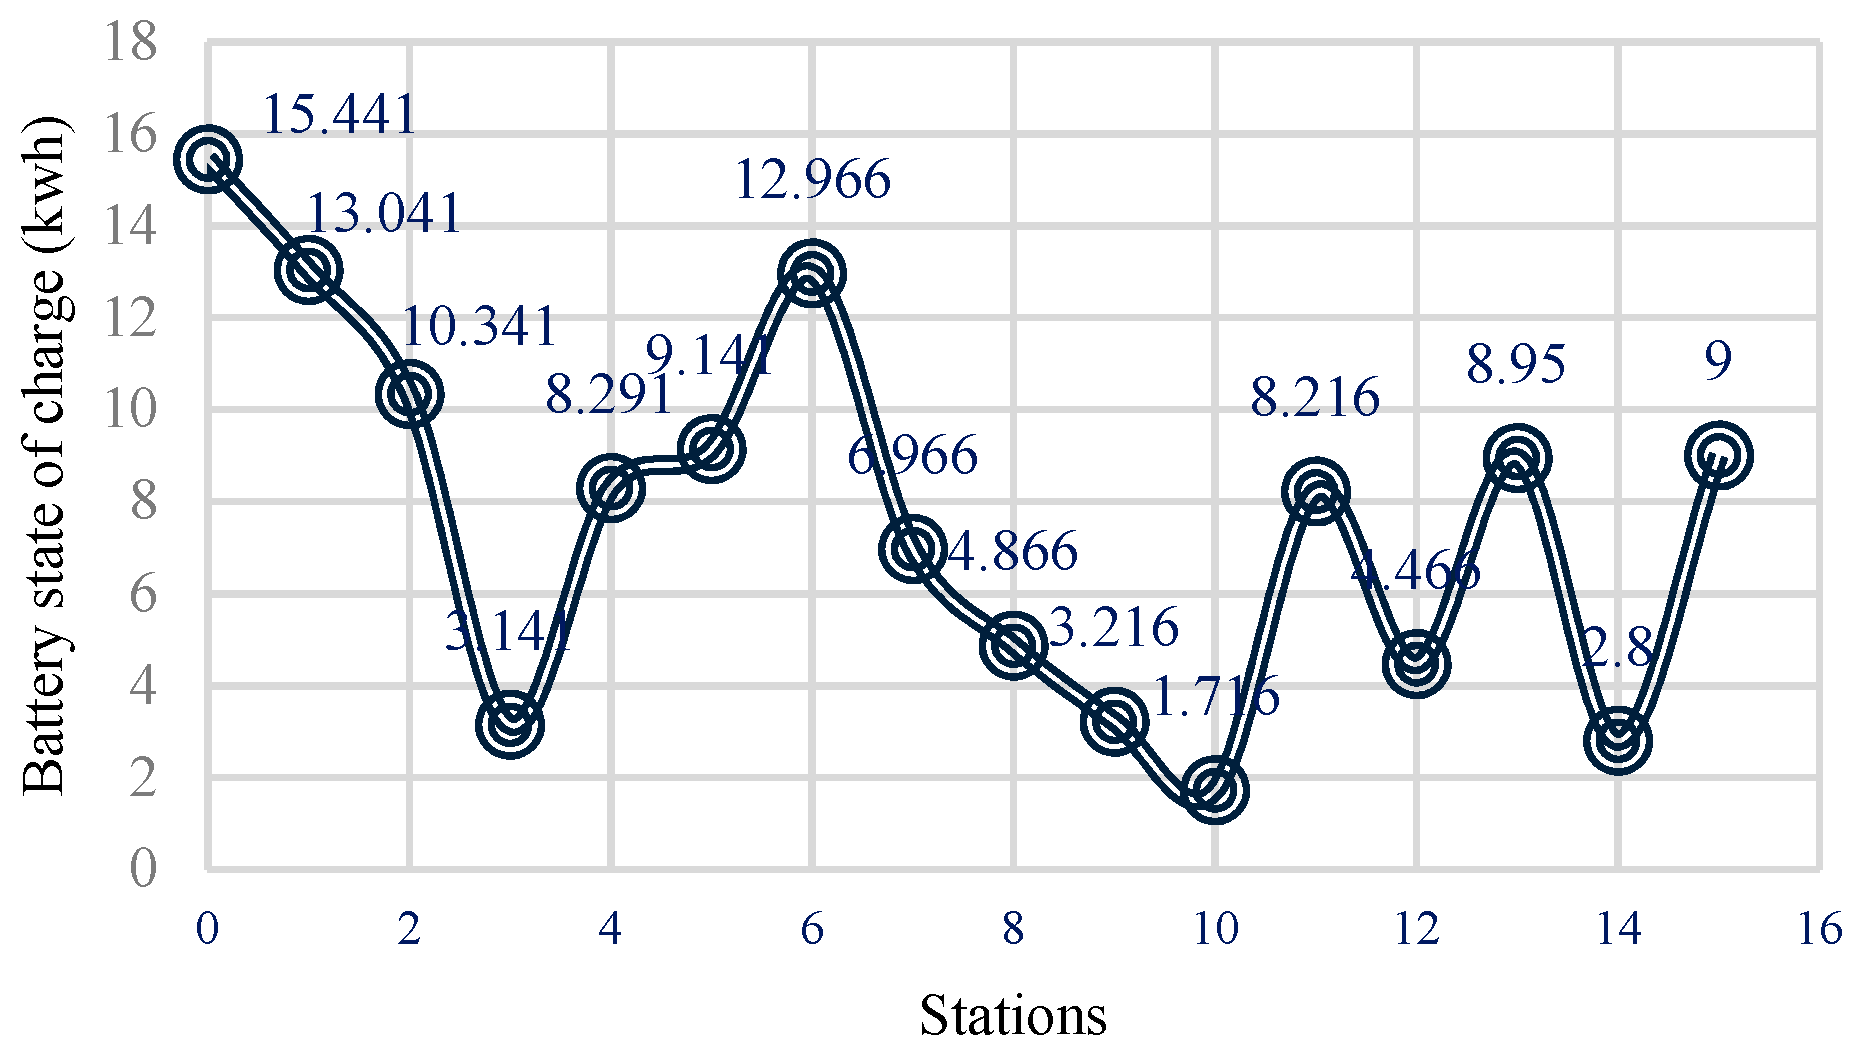
In this scenario, the WCETB system’s numerical analysis is conducted using data collected from a route within Wakefield City. This analysis is performed under the assumption of no traffic congestion. In this application, the GAMS Software is adopted to appraise the efficiency of the suggested optimal approach. In this case, the CPLEX solver within the GAMS environment (GAMS Development Corporation 2018, Fairfax, VA, USA) is utilized to solve the MILP formulation of this scenario, which involves computational outcomes without traffic congestion realized through an algebraic scheme. The amount of energy demand (di (kWh)) from the station to is shown in Table 2. The outcomes of this basic numerical test system are summarized in Table 3. The state of charge for the test-system vehicle at each station is depicted in Figure 9. As shown in Table 4, one power transmitter in station 7 is sufficient for the studied WCETB system under traffic congestion on the Wakefield road map. The length of power transmitters for the seventh station is obtained as 20.806.
Table 2.
Station (Si) and energy demand (di).
Table 3.
Optimal Outcomes of WCETB with Traffic Congestion.
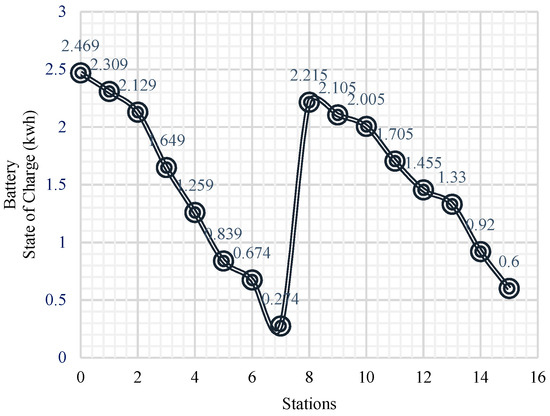
Figure 9.
Bus battery state of charge in each station.
Table 4.
Numerical Analysis Parameters—Battery Cost Variation.
5.3. Numerical Analysis under Change in Number of Buses, Various Loads, and Increasing Route Length
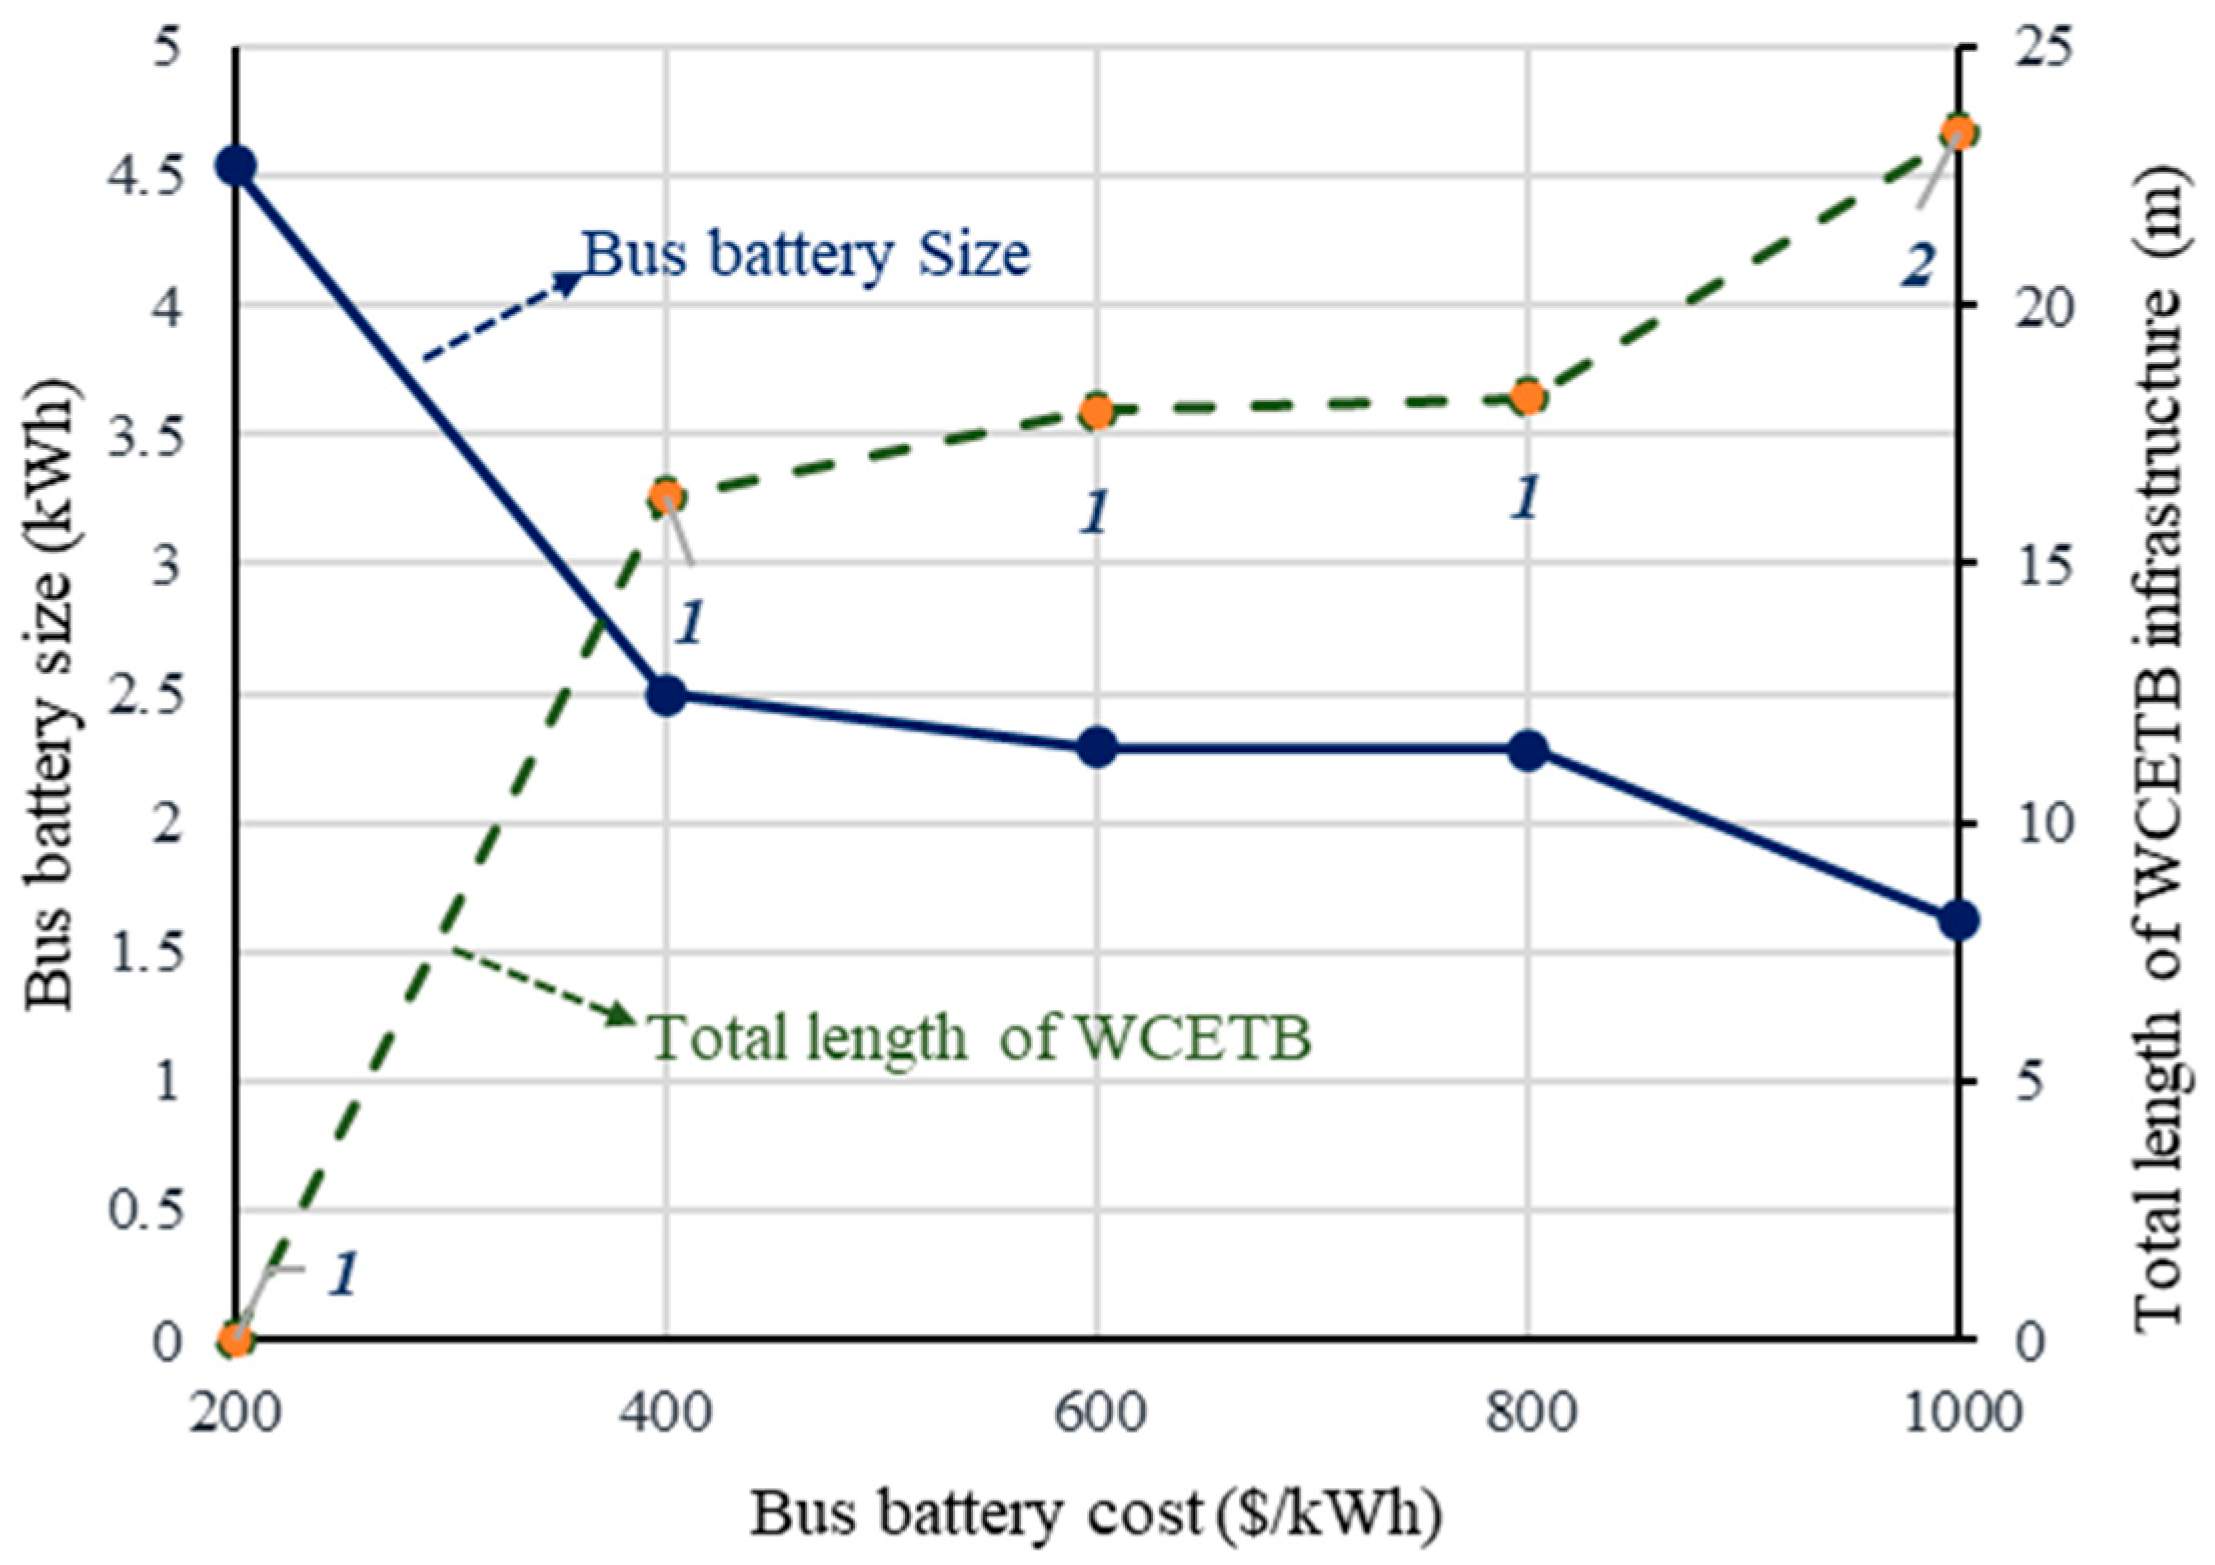
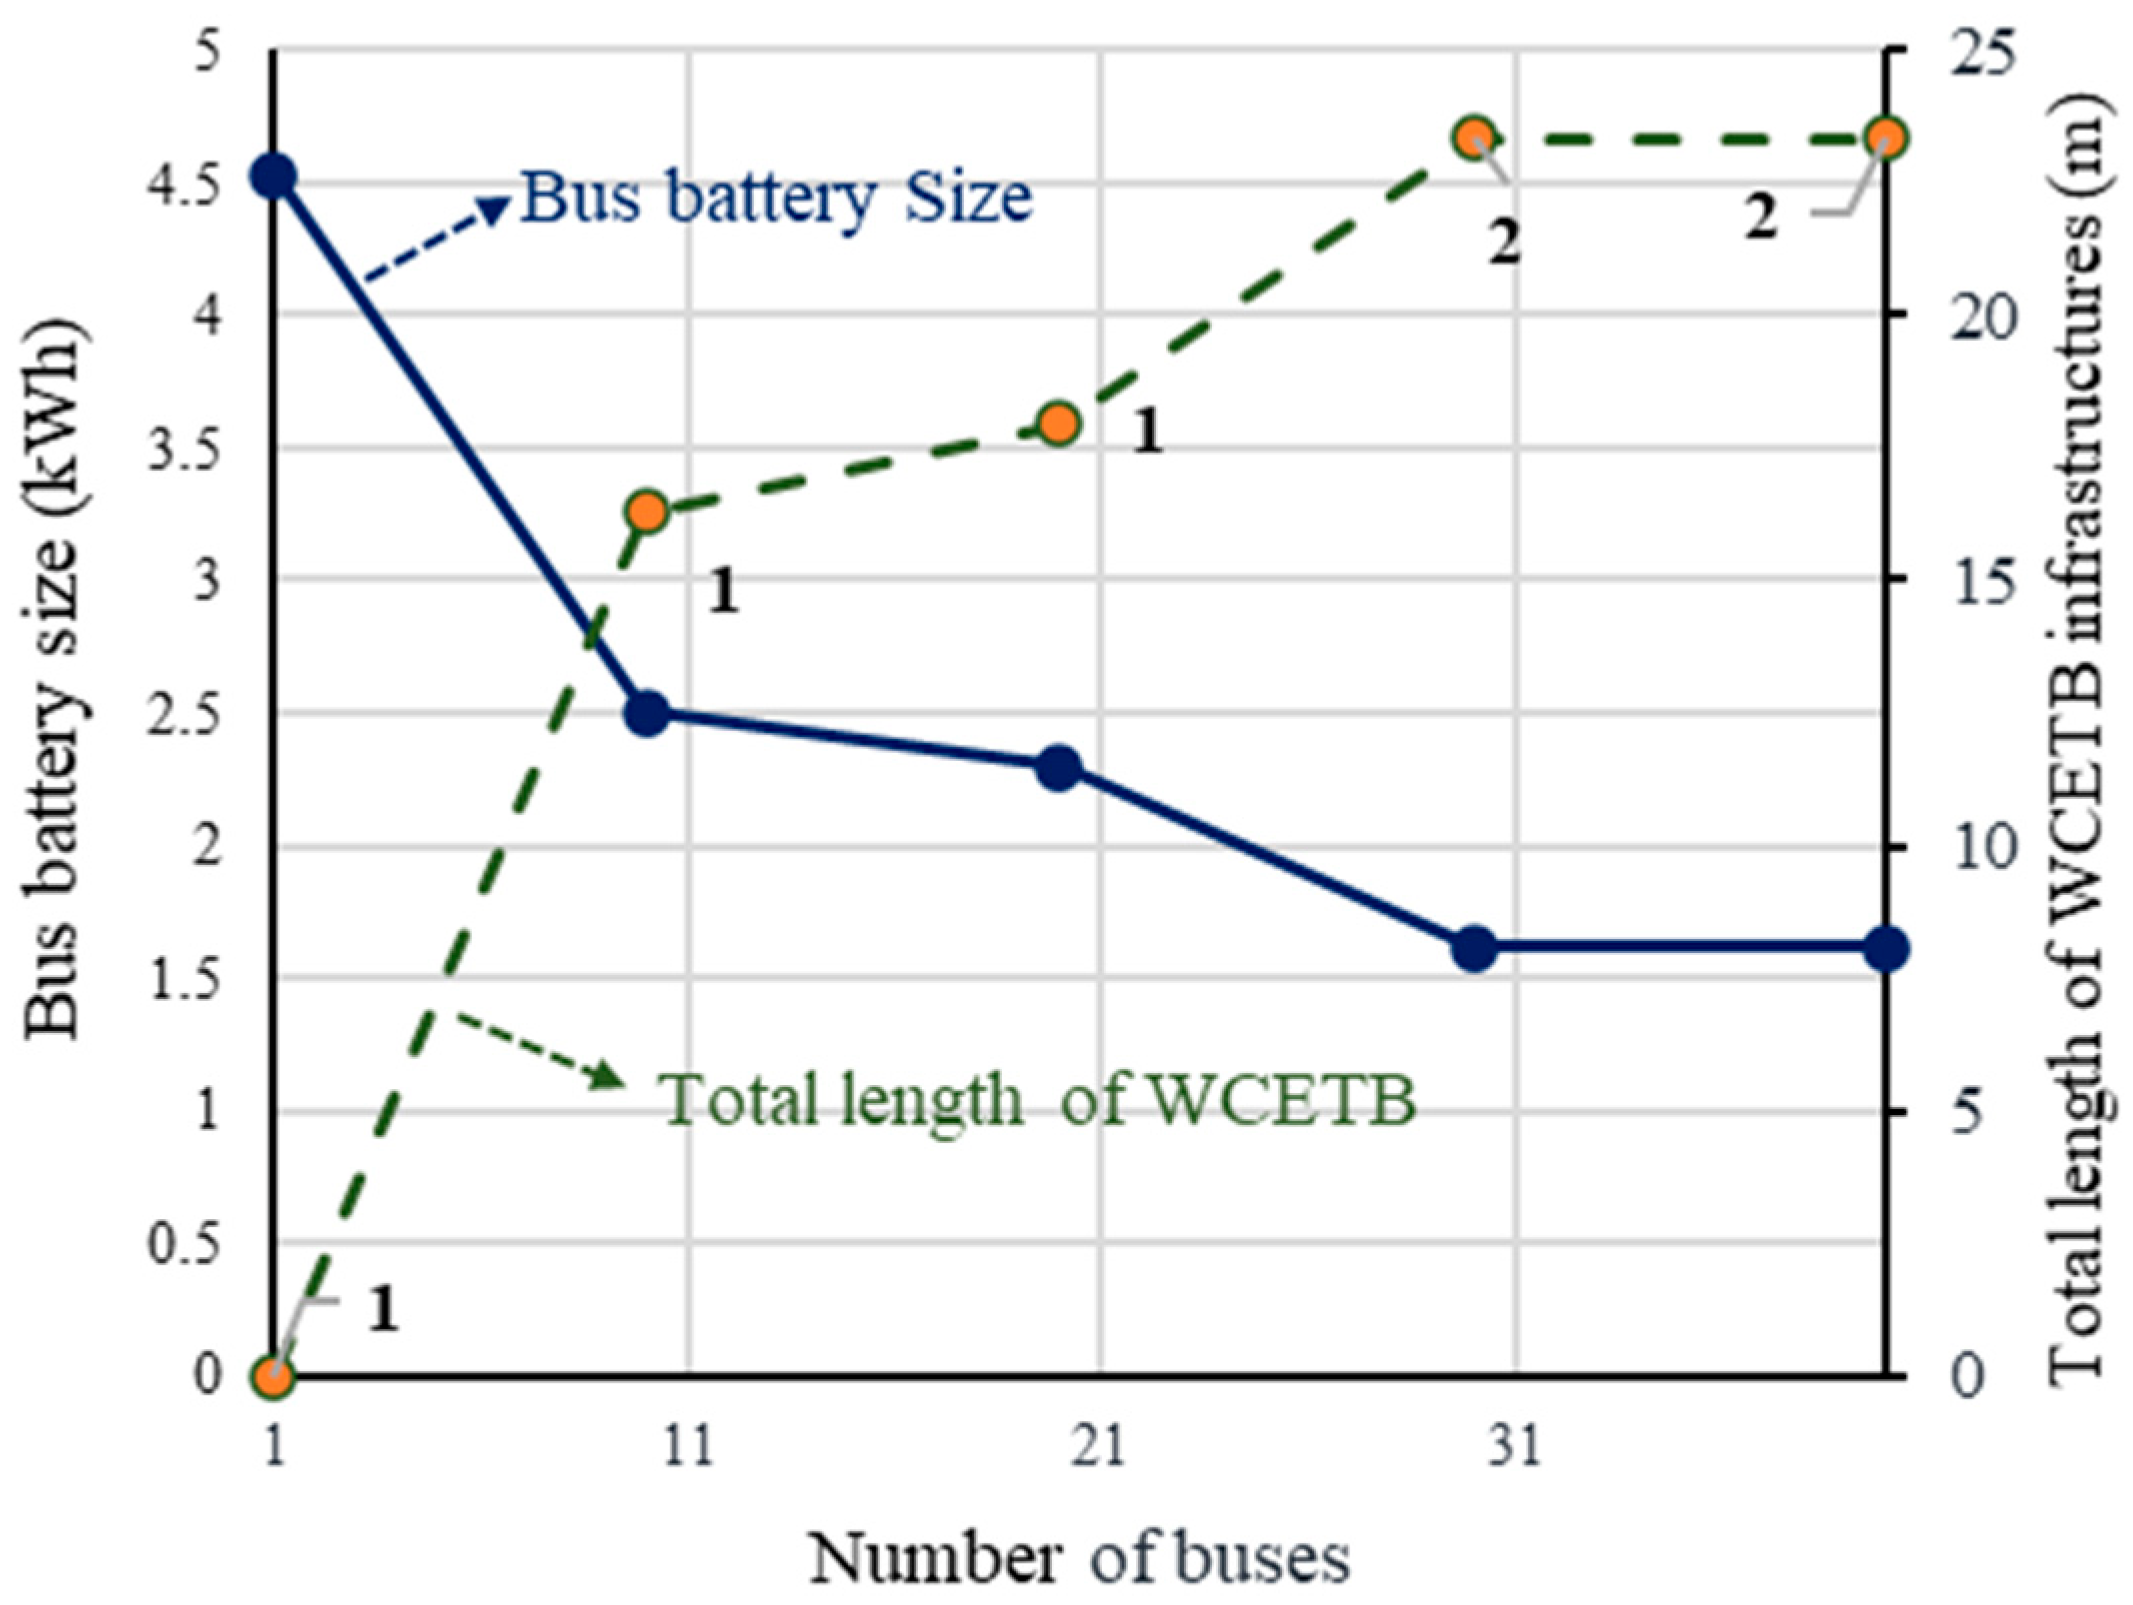
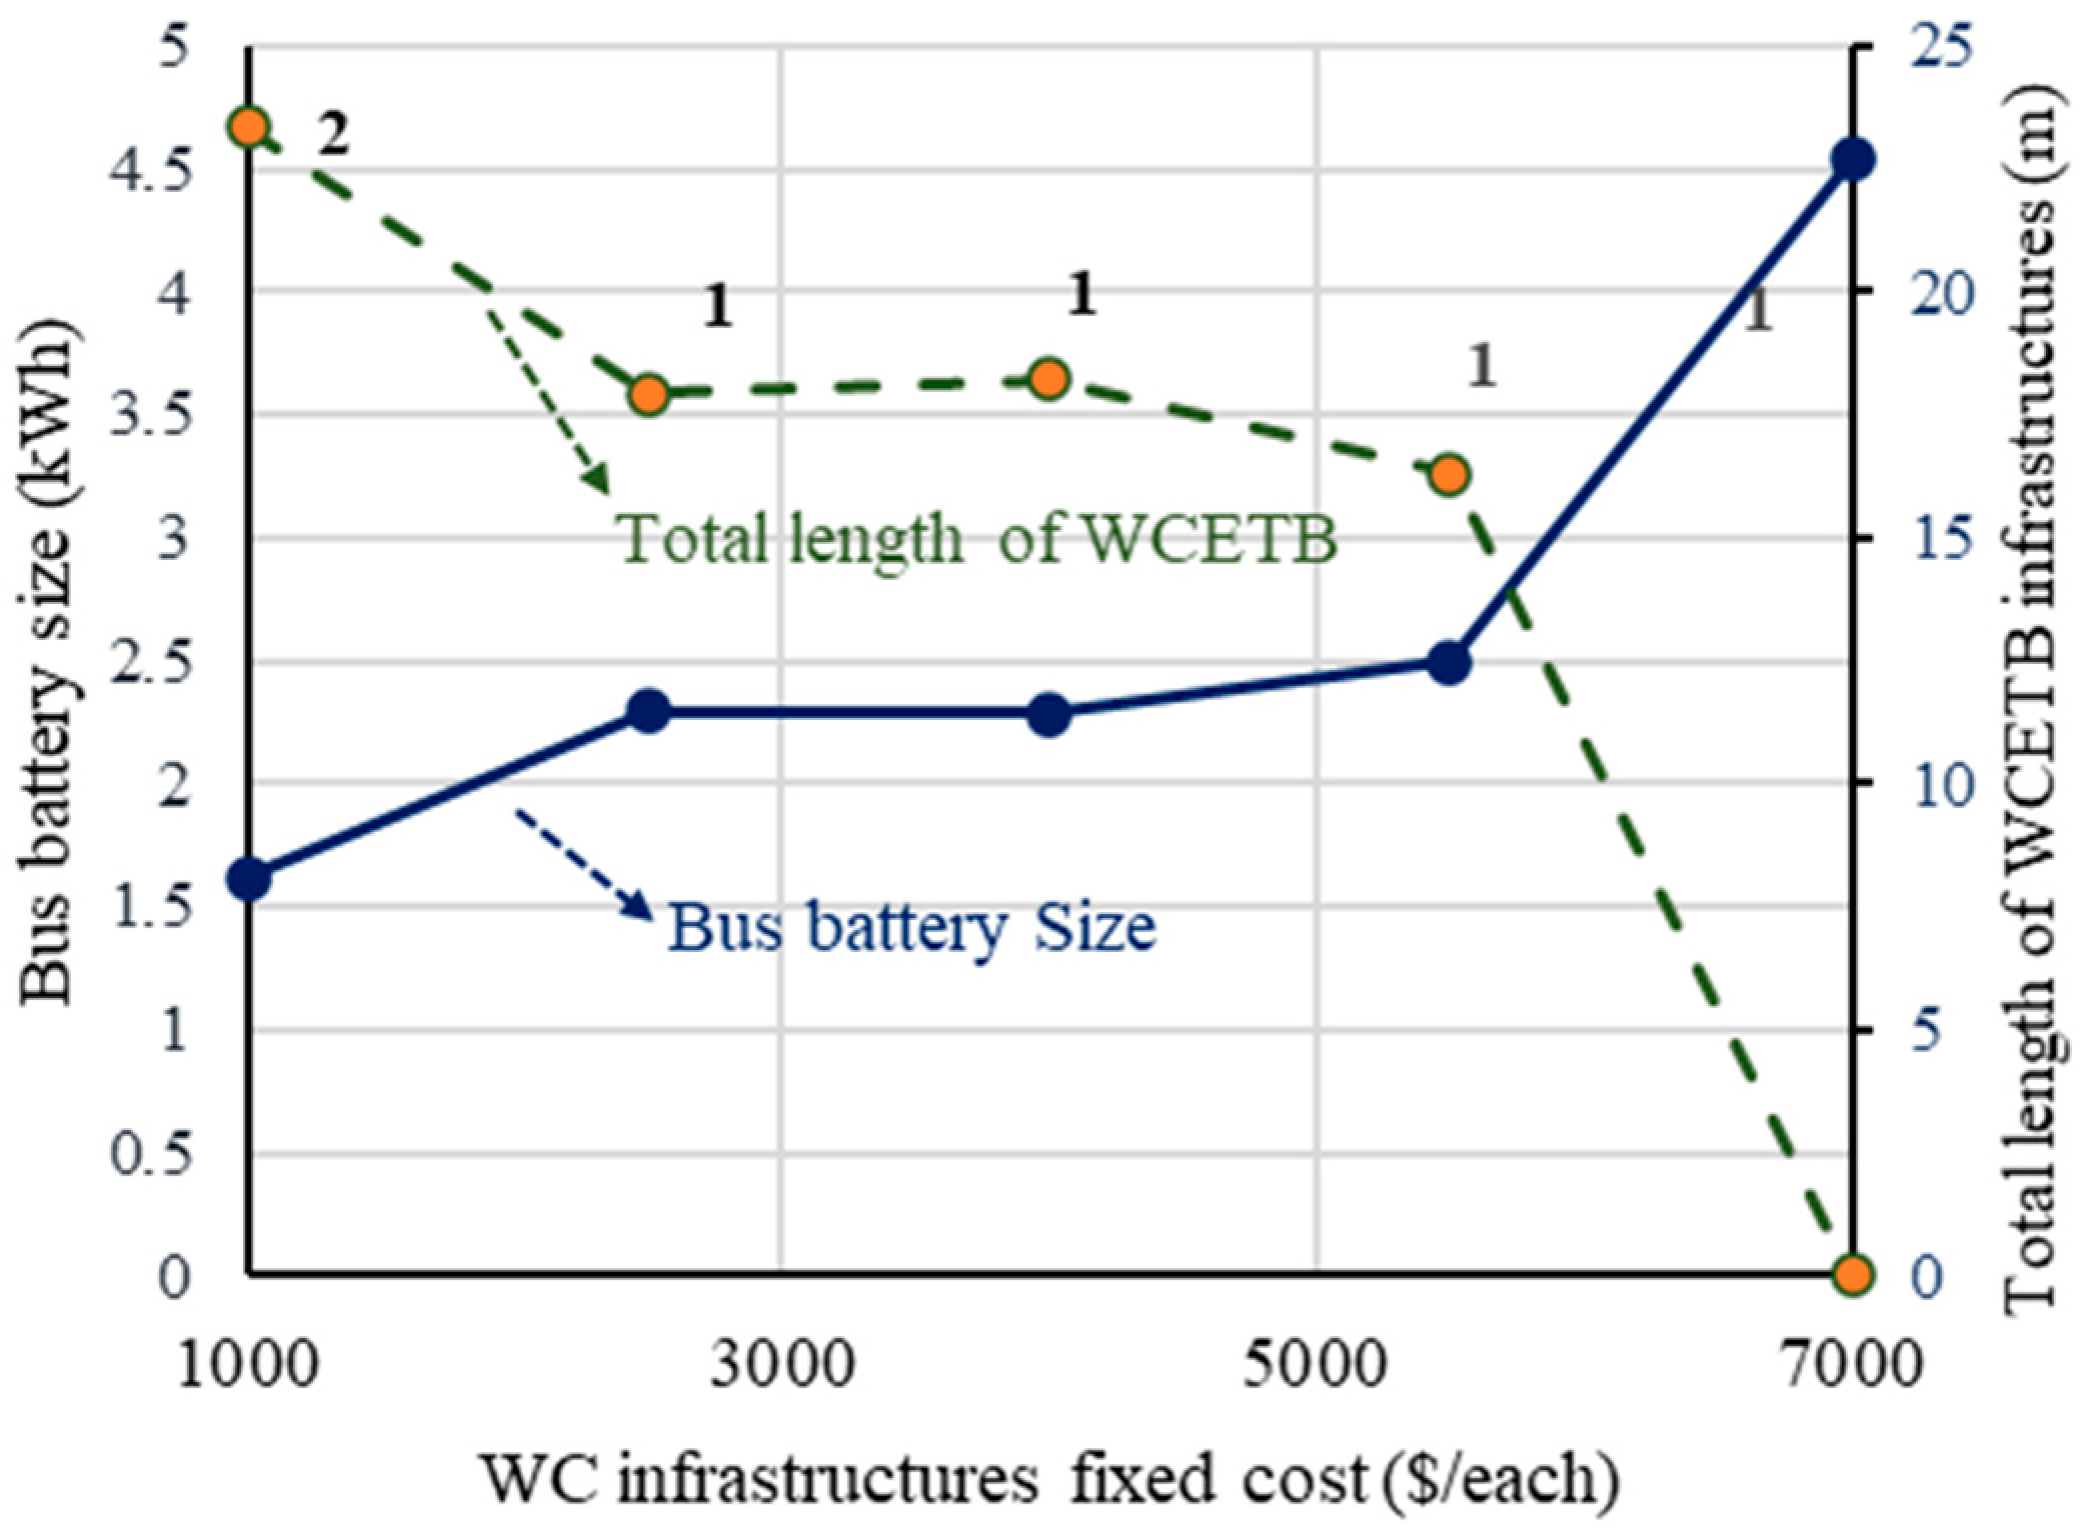
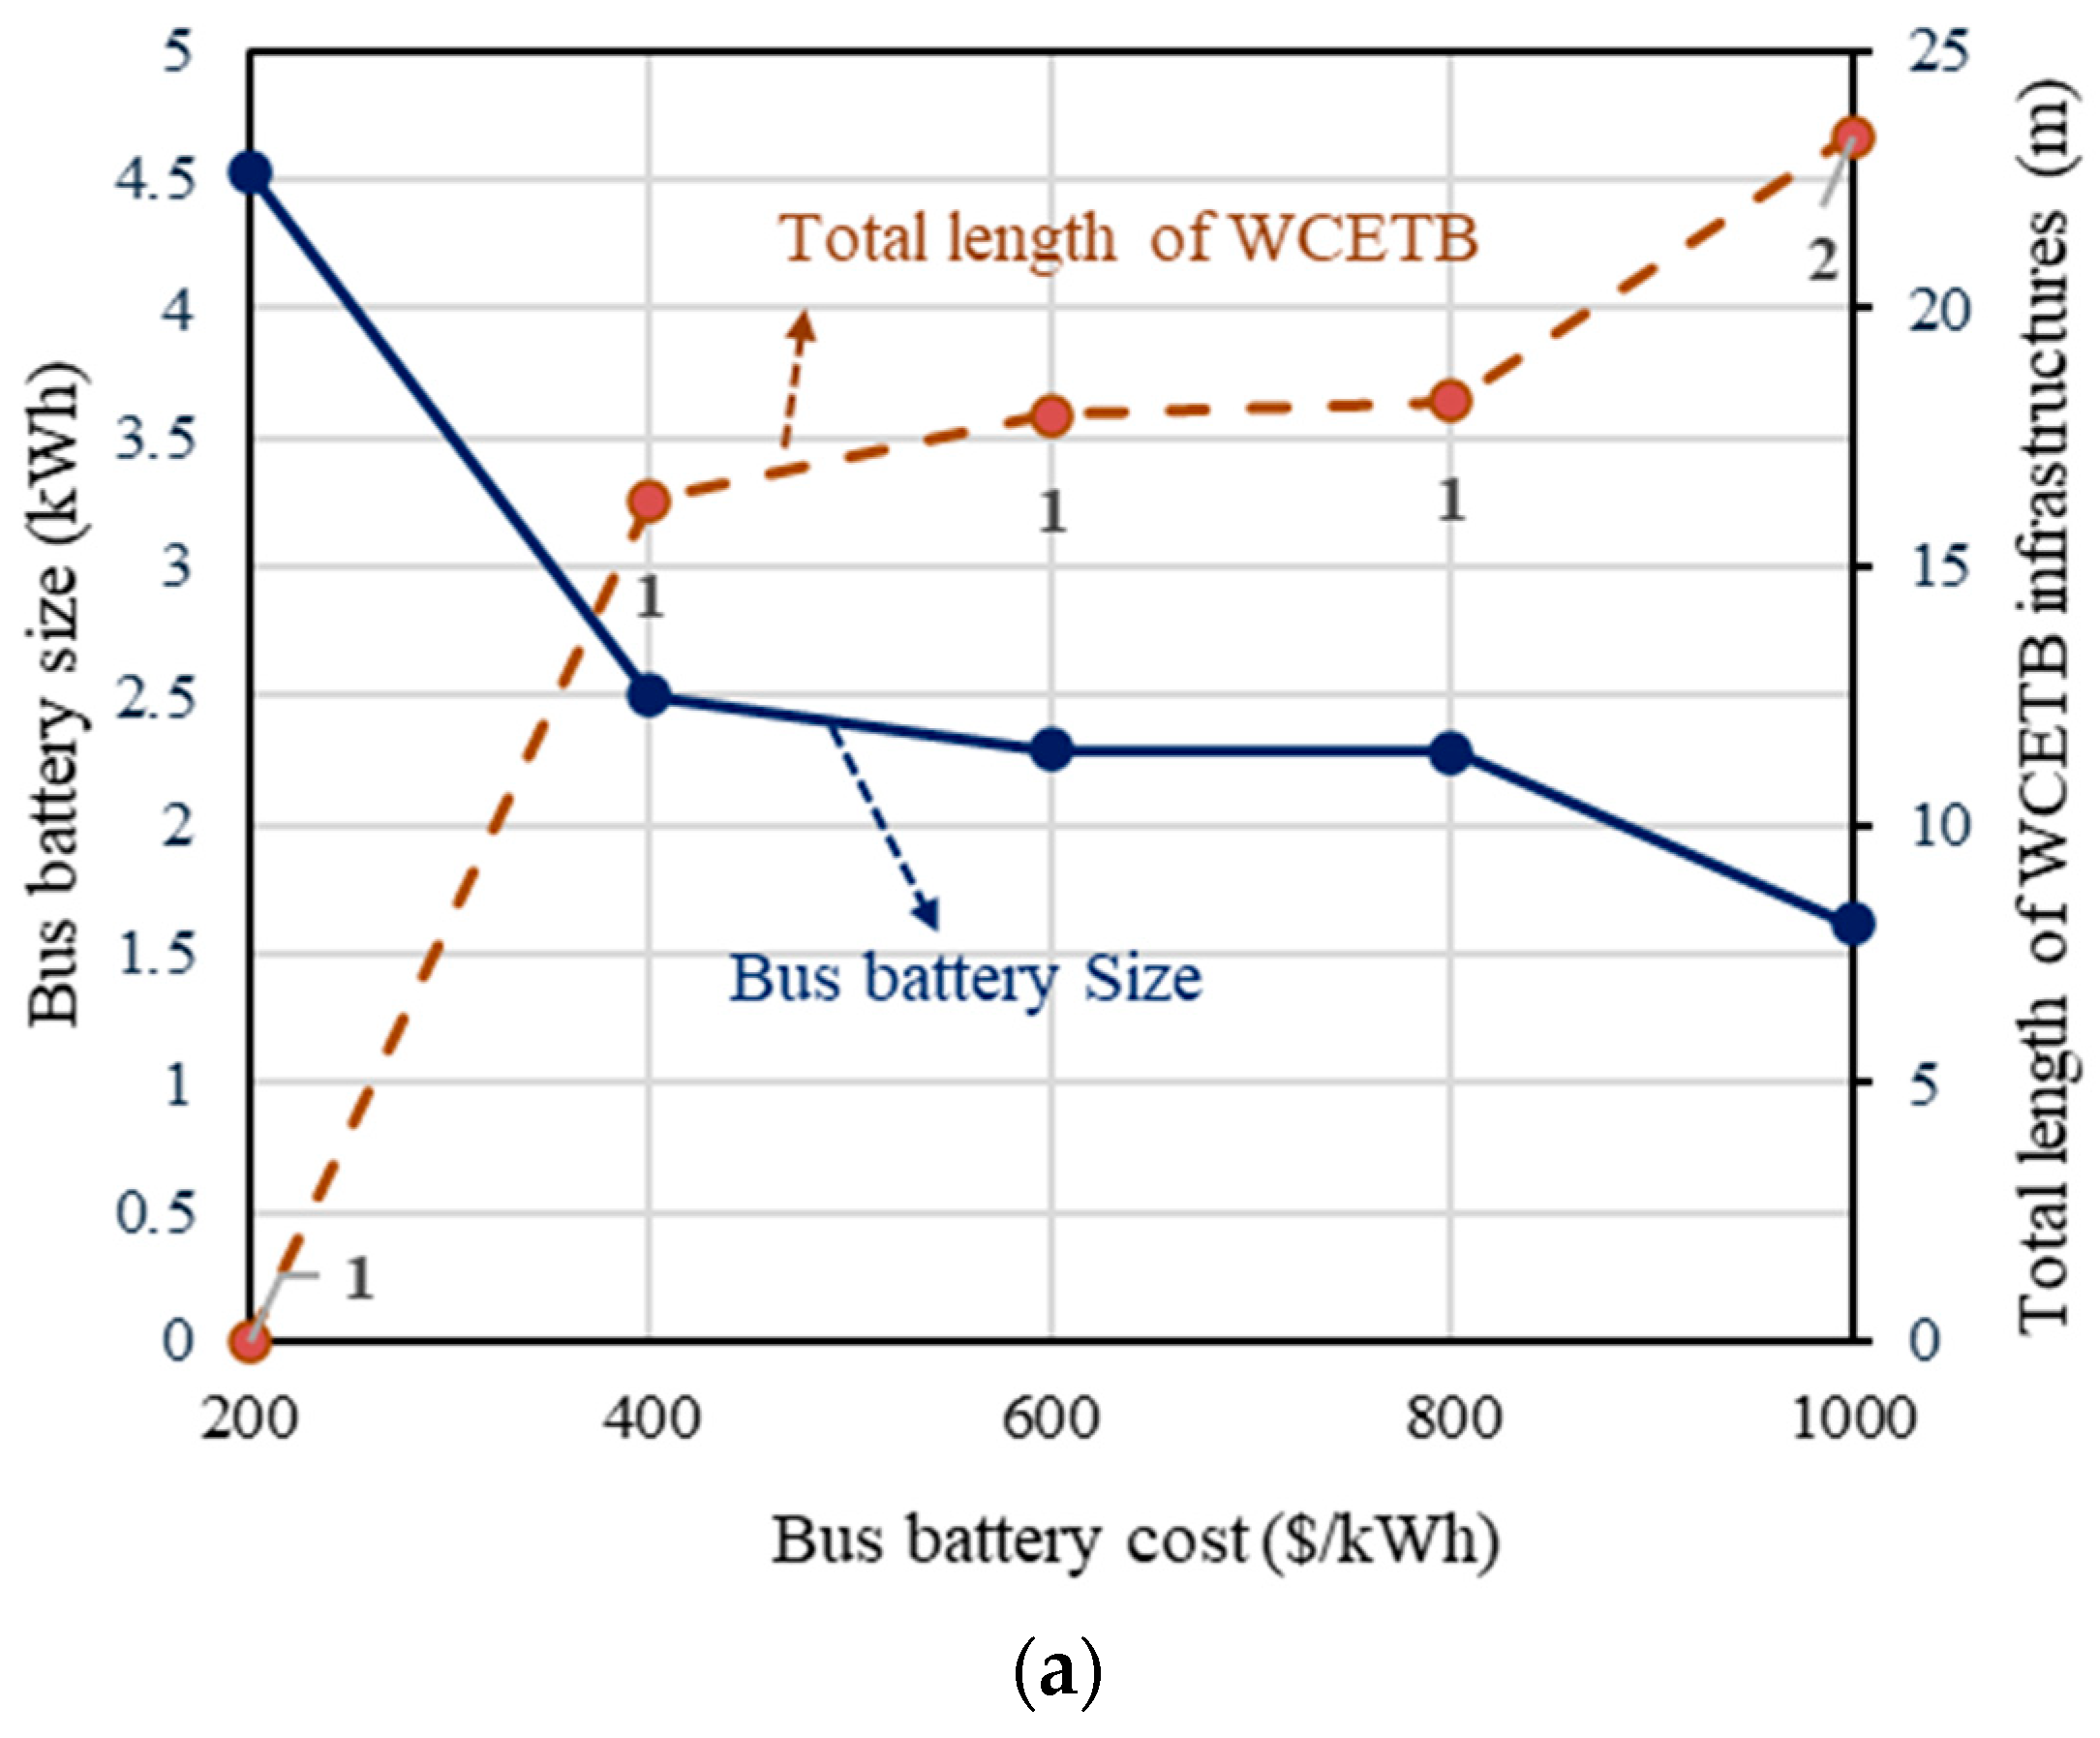
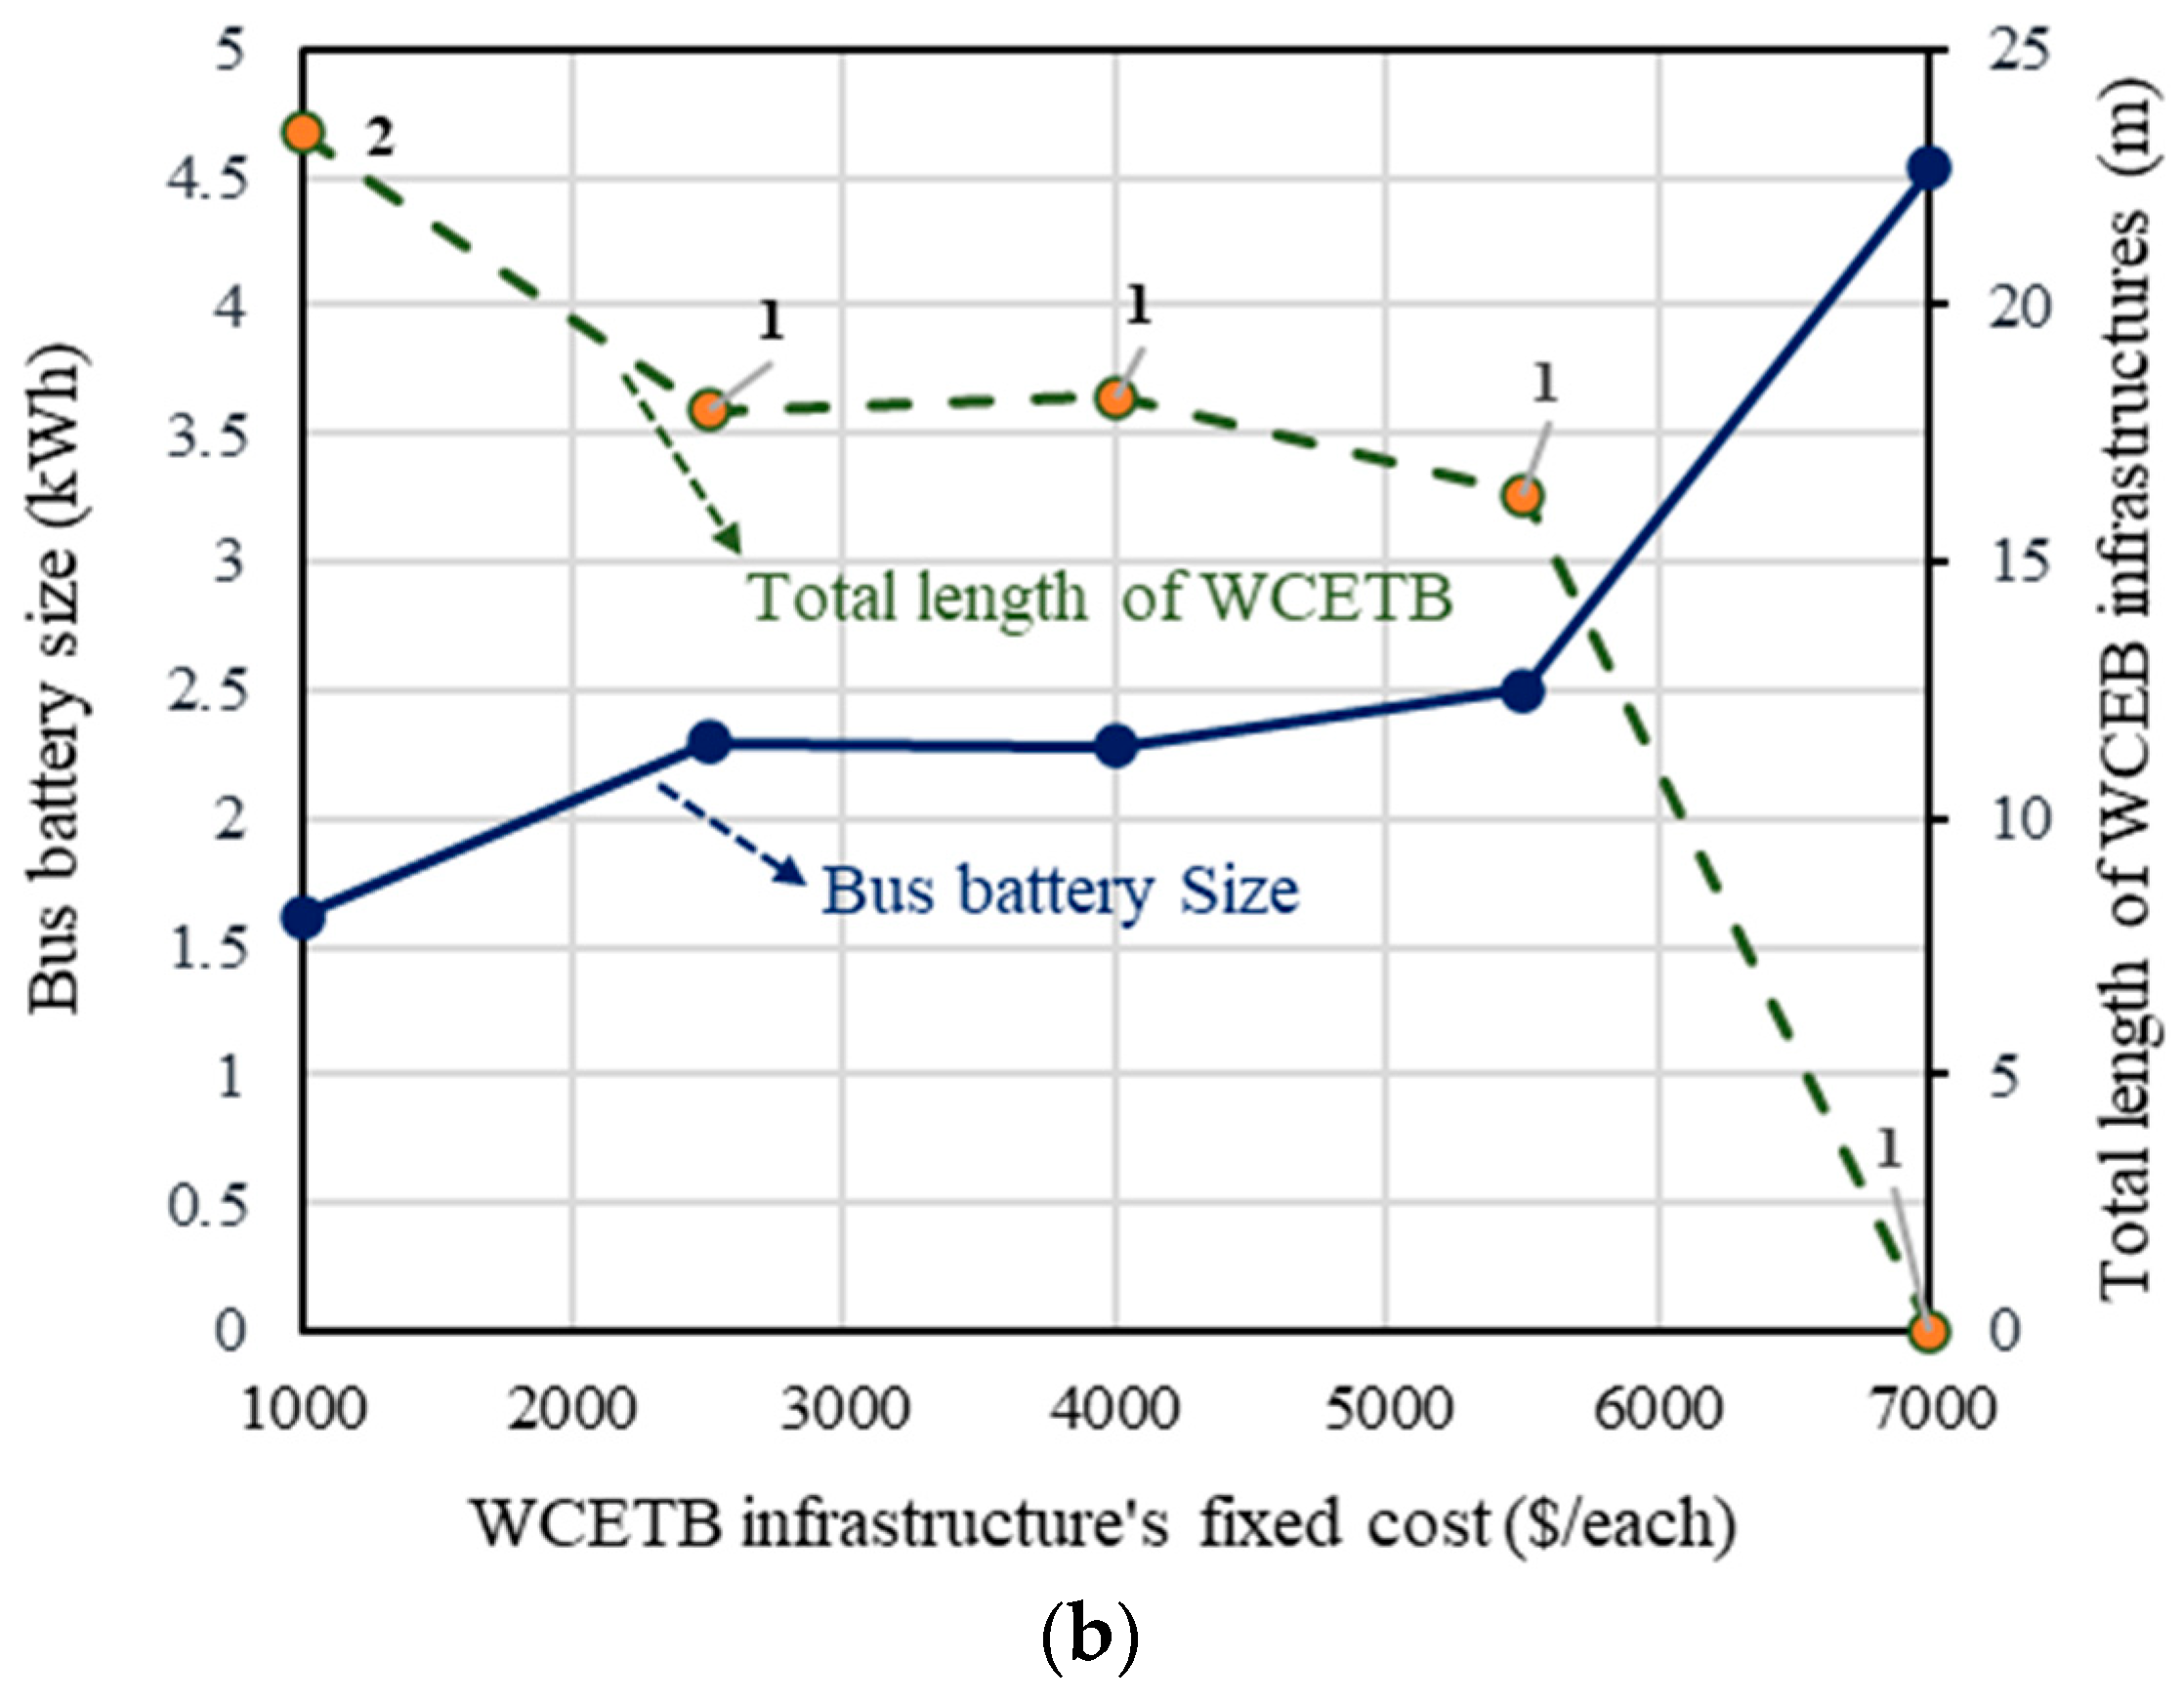
In the next step, the battery cost (i.e., Cb is increased from 200 to 1000) is changed, while other parameters are not varied. The related results under the variation in battery cost are given in Table 4 and Figure 10. When the battery cost increases, a smaller transmitter is required. Therefore, the optimization scheme tries to seek a solution that minimizes the total length of the cable, either by installing more transmitters with a short cable or by increasing the battery capacity. Moreover, numerical analysis results with variation in the number of buses and fixed cost are depicted in Table 5, Figure 11, Table 6, and Figure 12, respectively.
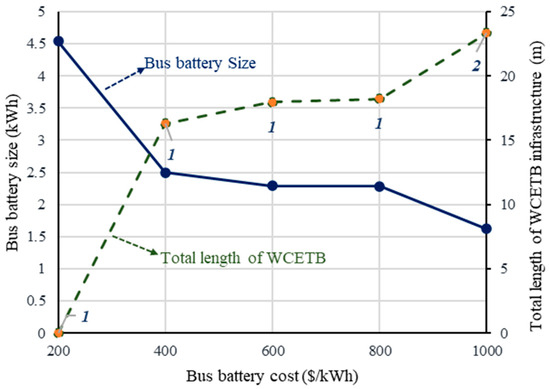
Figure 10.
Numerical analysis results with battery cost variation.
Table 5.
Numerical Analysis for Change in Number of Buses.
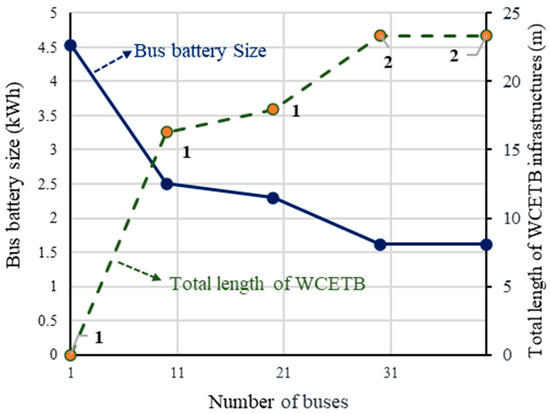
Figure 11.
Numerical analysis results with variation in number of buses.
Table 6.
Numerical Analysis Parameters—Fixed Cost.
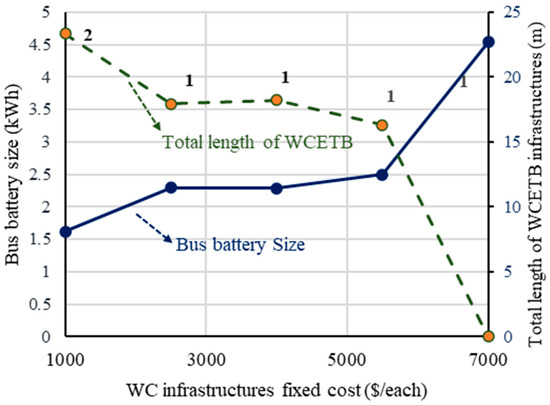
Figure 12.
Numerical analysis results with variation in fixed cost.
Furthermore, the efficiency of the suggested optimal scheme is investigated under various types of load consumption for buses. For this purpose, three distinct types of buses with various loads are considered in this scenario. The outcomes obtained under the various load consumptions are provided in Table 7.
Table 7.
Optimization Results under Various Load Consumptions.
In this stage, the length between stations is increased to 15 times that in the previous case to evaluate the suitability of the suggested optimization approach for long routes. The corresponding results according to this scenario are shown in Table 8. When the length of the route is enhanced, six power transmitters (S3, S4, S5, S10, S12, and S14) are required to supply the vehicle for the entire route, while the vehicle should be equipped with a bigger battery (E0 = 17.156) than in normal conditions. Figure 13 illustrates the battery state of charge for various stations, while Figure 14a,b demonstrate the results for various battery sizes and variations in WCETB infrastructure.
Table 8.
Optimization Results under Various Load Consumptions.
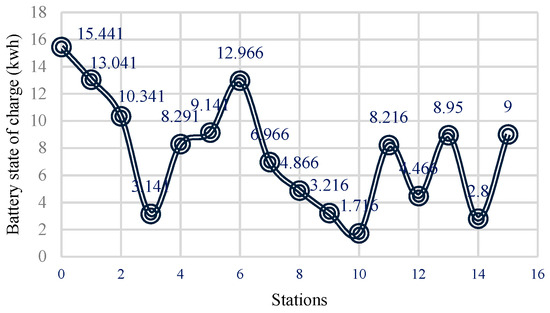
Figure 13.
Numerical analysis results with variation in fixed cost.

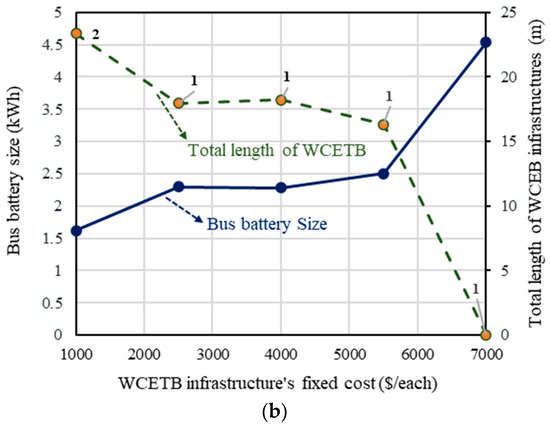
Figure 14.
Numerical analysis with (a) various battery sizes and (b) variations in WCETB infrastructure.
6. Conclusions
The WCETB system is a promising electricity-powered transportation technology that remotely transfers power from transmitters buried underground. In this paper, an optimal placement methodology is proposed for the WCETB system from the energy logistics point of view. Two mathematical models are built to elaborate the cost balance between transmitter allocation and battery capacity, one neglecting traffic congestion and one considering traffic congestion. The established models are developed for a public transportation system with a fixed path, in which the bus moves with a pre-defined velocity. The IWOA algorithm is adopted to optimally allocate the transmitter and select the battery size by considering both factors in an objective function. The numerical outcomes revealed the usefulness of the suggested optimal planning technique for the WCETB system compared to the state-of-the-art methods. For the verification of the WCETB’s design of the suggested meta-heuristic methodology, the optimal values for the studied optimization system are mathematically obtained by GAMS. The outcomes of the paper revealed excellent performance of the proposed framework in comparison with other heuristic optimization tools applied to the WCETB problem. As future work, the maximum output power of the battery and motor based on the WCETB’s required performance (e.g., max. speed, max. acceleration) according to its specification (e.g., weight) can be considered as constraints in the optimization problem.
Author Contributions
Conceptualization, A.F. and M.G.; methodology, A.F., M.G. and J.B.; software, A.F.; validation, A.F. and M.G.; formal analysis, S.Y.D. and M.H.K.; investigation, J.B.; resources, J.B.; data curation, A.F.; writing—original draft preparation, A.F. and M.G.; writing—review and editing, J.B., S.Y.D. and M.H.K.; visualization, A.F.; supervision, J.B., S.Y.D. and M.H.K.; All authors have read and agreed to the published version of the manuscript.
Funding
This research received no external funding.
Data Availability Statement
Not applicable.
Conflicts of Interest
The authors declare no conflict of interest.
Nomenclature
| , | Start and end positions of power cable at the th transmitter |
| , | Start and end of bus travel times at the th transmitter |
| Number of transmitters | |
| Limitation of cable | |
| Maximum level of the battery capacity | |
| , | Upper and lower battery capacities |
| Rate of energy consumption | |
| Arrival time to the station | |
| The energy demand between two stations | |
| The number of candidate stations | |
| , | Constant coefficients corresponding to the battery capacities |
| cost of the inverter | |
| Cost of transmitter cable | |
| Number of vehicles on the road | |
| Travel time of bus | |
| Velocity projection of vehicle | |
| Spatial set of transmitter’s positions | |
| Temporal set of bus travel times | |
| Maximum length of transmitter | |
| , | Coefficient variables of whale optimization algorithm |
| Best search agent | |
| Vector of random variable | |
| q | Shape coefficient |
| Constant quantity | |
| Observer Design Coefficient | |
| , | Lower and upper bound of decision variables |
| Abbreviations | |
| ETB | Electric Transit Bus |
| WC | Wireless Charging |
| WCETB | Wireless Charging Electric Transit Bus |
| KAIST | Korean Advanced Institute of Science and Technology |
| OLEV | On-line Electric Vehicle |
| PSO | Particle Swarm Optimization |
| WOA | Whale Optimization Algorithm |
| IWOA | Improved version of Whale Optimization Algorithm |
| SCA | Sin-Cos Algorithm |
| HSA | Harmony Search algorithm |
| GAMS | General Algebraic Modeling System |
| PLM | Polynomial Mutation |
| OBL | Opposition-Based Learning |
| QOBL | Quasi Opposition-Based Learning |
| MIP | Mixed Integer Programming |
References
- Li, J.-Q. Battery-electric transit bus developments and operations: A review. Int. J. Sustain. Transp. 2016, 10, 157–169. [Google Scholar]
- Ko, Y.D.; Jang, Y.J.; Hwang, H. Innovative Green Transportation System-On-Line Electrie Vehicle Applied to Airport Passenger Logistics. Int. Inf. Inst. 2012, 15, 6139–6153. [Google Scholar]
- Rafiei, M.; Boudjadar, J.; Griffiths, M.P.; Khooban, M.-H. Deep Learning-Based Energy Management of an All-Electric City Bus With Wireless Power Transfer. IEEE Access 2021, 9, 43981–43990. [Google Scholar]
- Abrazeh, S.; Mohseni, S.-R.; Zeitouni, M.J.; Parvaresh, A.; Fathollahi, A.; Gheisarnejad, M.; Khooban, M.-H. Virtual Hardware-in-the-Loop FMU Co-Simulation Based Digital Twins for Heating, Ventilation, and Air-Conditioning (HVAC) Systems. IEEE Trans. Emerg. Top. Comput. Intell. 2022, 7, 65–75. [Google Scholar]
- Ko, Y.D.; Jang, Y.J. The optimal system design of the online electric vehicle utilizing wireless power transmission technology. IEEE Trans. Intell. Transp. Syst. 2013, 14, 1255–1265. [Google Scholar]
- Jang, Y.J.; Suh, E.S.; Kim, J.W. System architecture and mathematical models of electric transit bus system utilizing wireless power transfer technology. IEEE Syst. J. 2015, 10, 495–506. [Google Scholar]
- Rezaei, M.A.; Fathollahi, A.; Rezaei, S.; Hu, J.; Gheisarnejad, M.; Teimouri, A.R.; Rituraj, R.; Mosavi, A.H.; Khooban, M.-H. Adaptation of A Real-Time Deep Learning Approach with An Analog Fault Detection Technique for Reliability Forecasting of Capacitor Banks Used in Mobile Vehicles. IEEE Access 2022, 10, 132271–132287. [Google Scholar]
- Liu, Z.; Song, Z.; He, Y. Optimal deployment of dynamic wireless charging facilities for an electric bus system. Transp. Res. Rec. 2017, 2647, 100–108. [Google Scholar]
- Jang, Y.J.; Jeong, S.; Ko, Y.D. System optimization of the On-Line Electric Vehicle operating in a closed environment. Comput. Ind. Eng. 2015, 80, 222–235. [Google Scholar]
- Huh, J.; Park, E.-h.; Jung, G.-H.; Rim, C.-T. High Efficient Inductive Power Supply System Implemented for on Line Electric Vehicles; Korean Institute of Power Electronics: Seoul, Republic of Korea, 2009; pp. 105–110. [Google Scholar]
- Ahn, S.-Y.; Chun, Y.-B.; Cho, D.-H.; Kim, J.-H. Wireless power transfer technology in on-line electric vehicle. J. Electromagn. Eng. Sci. 2011, 11, 174–182. [Google Scholar] [CrossRef]
- Bi, Z.; Keoleian, G.A.; Ersal, T. Wireless charger deployment for an electric bus network: A multi-objective life cycle optimization. Appl. Energy 2018, 225, 1090–1101. [Google Scholar]
- Hwang, I.; Jang, Y.J.; Ko, Y.D.; Lee, M.S. System optimization for dynamic wireless charging electric vehicles operating in a multiple-route environment. IEEE Trans. Intell. Transp. Syst. 2017, 19, 1709–1726. [Google Scholar]
- Helber, S.; Broihan, J.; Jang, Y.J.; Hecker, P.; Feuerle, T. Location planning for dynamic wireless charging systems for electric airport passenger buses. Energies 2018, 11, 258. [Google Scholar] [CrossRef]
- Ahn, S.; Suh, N.P.; Cho, D.-H. Charging up the road. IEEE Spectr. 2013, 50, 48–54. [Google Scholar]
- “You Could Soon Be Riding Utah? Gloriously Wireless Electric Bus”, Wired Magazine, October 2013. Available online: http://www.wired.com/autopia/2013/10/utah-ev-bus/ (accessed on 6 September 2023).
- Fathollahi, A.; Derakhshandeh, S.Y.; Ghiasian, A.; Khooban, M.H. Utilization of dynamic wireless power transfer technology in multi-depot, multi-product delivery supply chain. Sustain. Energy Grids Netw. 2022, 32, 100836. [Google Scholar]
- Azad, A.N.; Echols, A.; Kulyukin, V.A.; Zane, R.; Pantic, Z. Analysis, optimization, and demonstration of a vehicular detection system intended for dynamic wireless charging applications. IEEE Trans. Transp. Electrif. 2018, 5, 147–161. [Google Scholar]
- Alwesabi, Y.; Liu, Z.; Kwon, S.; Wang, Y. A novel integration of scheduling and dynamic wireless charging planning models of battery electric buses. Energy 2021, 230, 120806. [Google Scholar]
- Alwesabi, Y.; Wang, Y.; Avalos, R.; Liu, Z. Electric bus scheduling under single depot dynamic wireless charging infrastructure planning. Energy 2020, 213, 118855. [Google Scholar]
- Bi, Z.; Song, L.; De Kleine, R.; Mi, C.C.; Keoleian, G.A. Plug-in vs. wireless charging: Life cycle energy and greenhouse gas emissions for an electric bus system. Appl. Energy 2015, 146, 11–19. [Google Scholar]
- Bi, Z.; De Kleine, R.; Keoleian, G.A. Integrated Life Cycle Assessment and Life Cycle Cost Model for Comparing Plug-in versus Wireless Charging for an Electric Bus System. J. Ind. Ecol. 2017, 21, 344–355. [Google Scholar]
- Liu, Z.; Song, Z. Robust planning of dynamic wireless charging infrastructure for battery electric buses. Transp. Res. Part C: Emerg. Technol. 2017, 83, 77–103. [Google Scholar]
- Mosayebi, M.; Fathollahi, A.; Gheisarnejad, M.; Farsizadeh, H.; Khooban, M.H. Smart Emergency EV-to-EV Portable Battery Charger. Inventions 2022, 7, 45. [Google Scholar]
- Fathollahi, A.; Derakhshandeh, S.Y.; Ghiasian, A.; Masoum, M.A.S. Optimal Siting and Sizing of Wireless EV Charging Infrastructures Considering Traffic Network and Power Distribution System. IEEE Access 2022, 10, 117105–117117. [Google Scholar] [CrossRef]
- Mirjalili, S.; Lewis, A. The whale optimization algorithm. Adv. Eng. Softw. 2016, 95, 51–67. [Google Scholar]
- Ling, Y.; Zhou, Y.; Luo, Q. Lévy flight trajectory-based whale optimization algorithm for global optimization. IEEE Access 2017, 5, 6168–6186. [Google Scholar]
- Mafarja, M.M.; Mirjalili, S. Hybrid whale optimization algorithm with simulated annealing for feature selection. Neurocomputing 2017, 260, 302–312. [Google Scholar]
- Wang, J.; Du, P.; Niu, T.; Yang, W. A novel hybrid system based on a new proposed algorithm—Multi-Objective Whale Optimization Algorithm for wind speed forecasting. Appl. Energy 2017, 208, 344–360. [Google Scholar]
- Kaur, G.; Arora, S. Chaotic whale optimization algorithm. J. Comput. Des. Eng. 2018, 5, 275–284. [Google Scholar]
- Fathollahi, A.; Gheisarnejad, M.; Boudjadar, J.; Homayounzadeh, M.; Khooban, M.H. Optimal design of wireless charging electric buses-based machine learning: a case study of Nguyen-Dupuis network. IEEE Trans. Veh. Technol. 2023, 72, 8449–8458. [Google Scholar]
- Ala’a, A.; Alsewari, A.A.; Alamri, H.S.; Zamli, K.Z. Comprehensive review of the development of the harmony search algorithm and its applications. IEEE Access 2019, 7, 14233–14245. [Google Scholar]
- Hao, Y.; Song, L.; Cui, L.; Wang, H. A three-dimensional geometric features-based SCA algorithm for compound faults diagnosis. Measurement 2019, 134, 480–491. [Google Scholar]
- Warid, W. Optimal power flow using the AMTPG-Jaya algorithm. Appl. Soft Comput. 2020, 91, 106252. [Google Scholar]


Disclaimer/Publisher’s Note: The statements, opinions and data contained in all publications are solely those of the individual author(s) and contributor(s) and not of MDPI and/or the editor(s). MDPI and/or the editor(s) disclaim responsibility for any injury to people or property resulting from any ideas, methods, instructions or products referred to in the content. |
© 2023 by the authors. Licensee MDPI, Basel, Switzerland. This article is an open access article distributed under the terms and conditions of the Creative Commons Attribution (CC BY) license (https://creativecommons.org/licenses/by/4.0/).