Article

Non-Contact Blood Pressure Estimation Using Forehead and Palm Infrared Video

by
Thomas Stogiannopoulos
* and
Nikolaos Mitianoudis
Electrical and Computer Engineering Department, Democritus University of Thrace, 67100 Xanthi, Greece
*
Author to whom correspondence should be addressed.
BioMedInformatics 2024, 4(1), 437-453; https://doi.org/10.3390/biomedinformatics4010025
Submission received: 21 August 2023 / Revised: 14 December 2023 / Accepted: 5 February 2024 / Published: 7 February 2024
(This article belongs to the Special Issue Feature Papers in Applied Biomedical Data Science)

Abstract

:
This study investigates the potential of low-cost infrared cameras for non-contact monitoring of blood pressure (BP) in individuals with fragile health, particularly the elderly. Previous research has shown success in developing non-contact BP monitoring using RGB cameras. In this study, the Eulerian Video Magnification (EVM) technique is employed to enhance minor variations in skin pixel intensity in specific facial regions captured by an infrared camera from the forehead and palm. The primary focus of this study is to explore the possibility of using infrared cameras for non-contact BP monitoring under low-light or night-time conditions. We have successfully shown that by employing a series of straightforward signal processing techniques and regression analysis, we were able to achieve commendable outcomes in our experimental setup. Specifically, we were able to surpass the stringent accuracy standards set forth by the British Hypertension Society (BHS) and the Association for the Advancement of Medical Instrumentation (AAMI) protocol.

1. Introduction

Non-contact measuring techniques have made significant progress in recent years in the monitoring of physiological parameters such as heart rate, oxygen saturation, and blood pressure. One of the most important advantages of non-contact measuring techniques is that they are non-invasive and therefore eliminate the risk of infection and discomfort associated with the use of invasive procedures. For the elderly, non-contact measuring techniques have even more significant benefits. Aging often brings with it a decline in health and functional status, making the elderly more susceptible to age-related diseases, such as cardiovascular diseases [1]. Therefore, non-contact measuring techniques provide a valuable tool for monitoring the health status of the elderly, without causing discomfort or stress. Non-contact measuring techniques also offer the advantage of continuous monitoring, which allows for real-time monitoring of physiological parameters without the need for frequent interruptions. This can be particularly useful in critically ill patients, who require constant monitoring of their vital signs. In this paper, our primary objective is to comprehensively investigate the use of non-contact techniques for blood pressure monitoring in order to help detecting early warning signs of potential health problems in the elderly.
Hypertension and hypotension are both medical conditions that relate to blood pressure levels. Blood pressure is the force exerted by circulating blood against the walls of blood vessels. Hypertension refers to persistently elevated blood pressure, while hypotension refers to persistently low blood pressure. Tracking blood pressure levels is particularly important for elderly individuals due to the increased prevalence of these conditions and their association with various health risks. Hypertension, also known as high blood pressure, is defined as a systolic blood pressure (SBP) of 140 mmHg or higher and/or a diastolic blood pressure (DBP) of 90 mmHg or higher [2]. It is a leading risk factor for cardiovascular diseases, including stroke, heart attack, heart failure, and kidney disease. Hypertension can result from multiple factors, such as genetic predisposition, unhealthy lifestyle choices, and age-related changes in blood vessel function [3]. In the elderly, hypertension is highly prevalent and has distinct characteristics compared to younger individuals. It is estimated that approximately 46% of adults in the United States have hypertension [4]. As people age, their blood vessels become stiffer, and the risk of developing hypertension increases [5]. Hypertension in older adults is associated with a higher risk of cardiovascular events, cognitive decline, kidney disease, and mortality [6].
Hypotension, or low blood pressure, is generally defined as a systolic blood pressure below 90 mmHg and/or a diastolic blood pressure below 60 mmHg [7]. Elderly individuals with hypertension may also experience transient hypotensive episodes, which refer to temporary drops in blood pressure that can have significant clinical implications. These episodes may indicate compromised blood flow to vital organs like the brain and heart, and they can be associated with acute cardiovascular and cerebrovascular incidents [8]. Managing hypotension in elderly hypertensive patients requires careful consideration, as tailored therapy is necessary to balance the risks associated with medications [8].
Direct blood pressure monitoring, while providing valuable insights into cardiovascular health, is not without its limitations. These limitations span both practical considerations and physiological factors, warranting a comprehensive examination to inform the broader context of blood pressure assessment. Direct blood pressure monitoring often involves invasive procedures, such as catheterization, which can lead to discomfort and potential complications. The insertion of catheters or other invasive devices can cause tissue damage, infection, or discomfort, thereby limiting the feasibility and acceptability of continuous monitoring in various clinical settings [9,10,11]. Additionally, the act of invasive monitoring itself can elicit physiological responses, including stress, pain, and sympathetic activation, collectively known as the “white coat effect” [12]. These responses can transiently elevate blood pressure, confounding accurate interpretation and clinical decision-making. In contrast, a non-contact system relies on optical techniques, such as image photoplethysmography (iPPG) and remote photoplethysmography (rPPG), to capture physiological signals from the skin’s surface, minimizing the psychological and physiological stressors.
There exists a substantial body of prior research dedicated to the investigation of non-contact methods for blood pressure estimation and monitoring with plain RGB cameras and non-magnifying signal processing approaches [13,14,15,16,17]. Nevertheless, as far as our understanding goes, our approach distinguishes itself through the utilization of an infrared camera, in conjunction with motion magnification. There have been non-contact methodologies primarily centered on facial signals [14,16,17] or, in some cases, the combined utilization of facial and raised hand signals [13,15].
This study aims to assess the feasibility of using single-channel infrared videos for accurate blood pressure estimation in the elderly. The motivation behind this research is the potential benefits offered by these videos, including reduced computational complexity, lower hardware requirements, and immunity to varying light conditions. By leveraging these advantages, we seek to develop a novel approach that overcomes current limitations in blood pressure measurement. Our goal is to enhance eldercare by providing healthcare professionals with a reliable tool for unobtrusive and accurate blood pressure monitoring, thereby advancing the field of geriatric healthcare.

2. Dataset Protocol & Equipment

In order to assess the performance of the proposed method for estimating systolic and diastolic blood pressure, a dataset of infrared videos with blood pressure measurements was created in which fifteen (15) participants participated, ranging in age from 55 to 92 years, predominantly representing an elderly demographic. The reference point for each participant’s blood pressure was a clinically validated [18,19] commercial automatic upper arm blood pressure monitor (Omron M6 Comfort (HEM-7360-E), manufactured in Shimogyo ku, Kyoto, Japan) that monitored the blood pressure levels. All the subjects were filmed in a room with natural sunlight using an infrared camera. We employed a carefully designed approach that involved taking three consecutive readings within a span of two minutes, with a 30-s interval between each measurement, totalling 3 min. The rationale behind this methodology stems from the fact that blood pressure readings can exhibit inherent variability due to a multitude of factors, such as physiological fluctuations, environmental conditions, and measurement artifacts [20]. By acquiring multiple readings in quick succession, we aimed to reach the highest level of accuracy [4]. The participants were instructed to remain as still as possible during the recordings. To avoid potential registration issues, the participants were seated at a fixed distance from the camera, strategically chosen to include the forehead region and the upper palm region within the field of view. By ensuring that both the forehead region and the upper palm region were within the camera’s view, we aimed to maximize the capture of relevant physiological signals during our data acquisition process. But, due to the inclusion of elderly participants in our study, we considered various factors to ensure their comfort and accurate data collection. Recognizing the potential challenges posed by any unnecessary movement or instability, we made a thoughtful decision regarding their hand positioning. To facilitate the most conducive conditions for data gathering, we opted to utilize a rectangular mirror as a pivotal component of our setup. Volunteers were directed to gently glide their right hand underneath the mirror and comfortably rest it on a designated table, exposing their upper palm region via the mirror’s reflection.
In the existing literature, we observed that authors have employed a range of camera types, including expensive cameras [17], high-speed cameras [16], moderately high-spec cameras [13,15], and webcams [14]. Many of these options fall within the price range of a few hundred dollars. Our goal was to strike a balance between cost and performance. In this study, we utilized a wired Google Nest Cam, listed with a retail price of 70 USD, to record video footage of the participants. The camera settings were configured to “Infrared Always” mode, providing a resolution of 1920 × 1080 Full HD and a frame rate of 30 fps. To minimize potential distortion caused by the camera’s wide-angle lenses, the camera was positioned at eye level, maintaining a distance of 85 cm from the participants. To obtain the video clips, the researchers downloaded them from Google’s Cloud service, where they had been uploaded. It is important to note that the video clips obtained from the cloud service contained compression noise, which had the potential to impact the accuracy of the process. Due to limitations imposed by the provided software from Google, direct extraction of raw sensor data was not feasible, necessitating the use of the compressed video clips available through the Google Cloud service. This approach was adopted to showcase the feasibility of the proposed method, even when employing lower-end commercial equipment, as opposed to high-end cameras with higher resolution or frame rates that may not be easily accessible to the average home user. Despite the presence of compression noise in the video clips, the proposed approach still yielded satisfactory results, thereby validating the proof of concept put forth by this study. An example frame of the acquired video is shown in Figure 1.

3. Proposed Methodology

The proposed methodology comprises five key steps:
  • Face & Hand Detection: Precisely locating facial and hand regions of interest using advanced computer vision techniques.
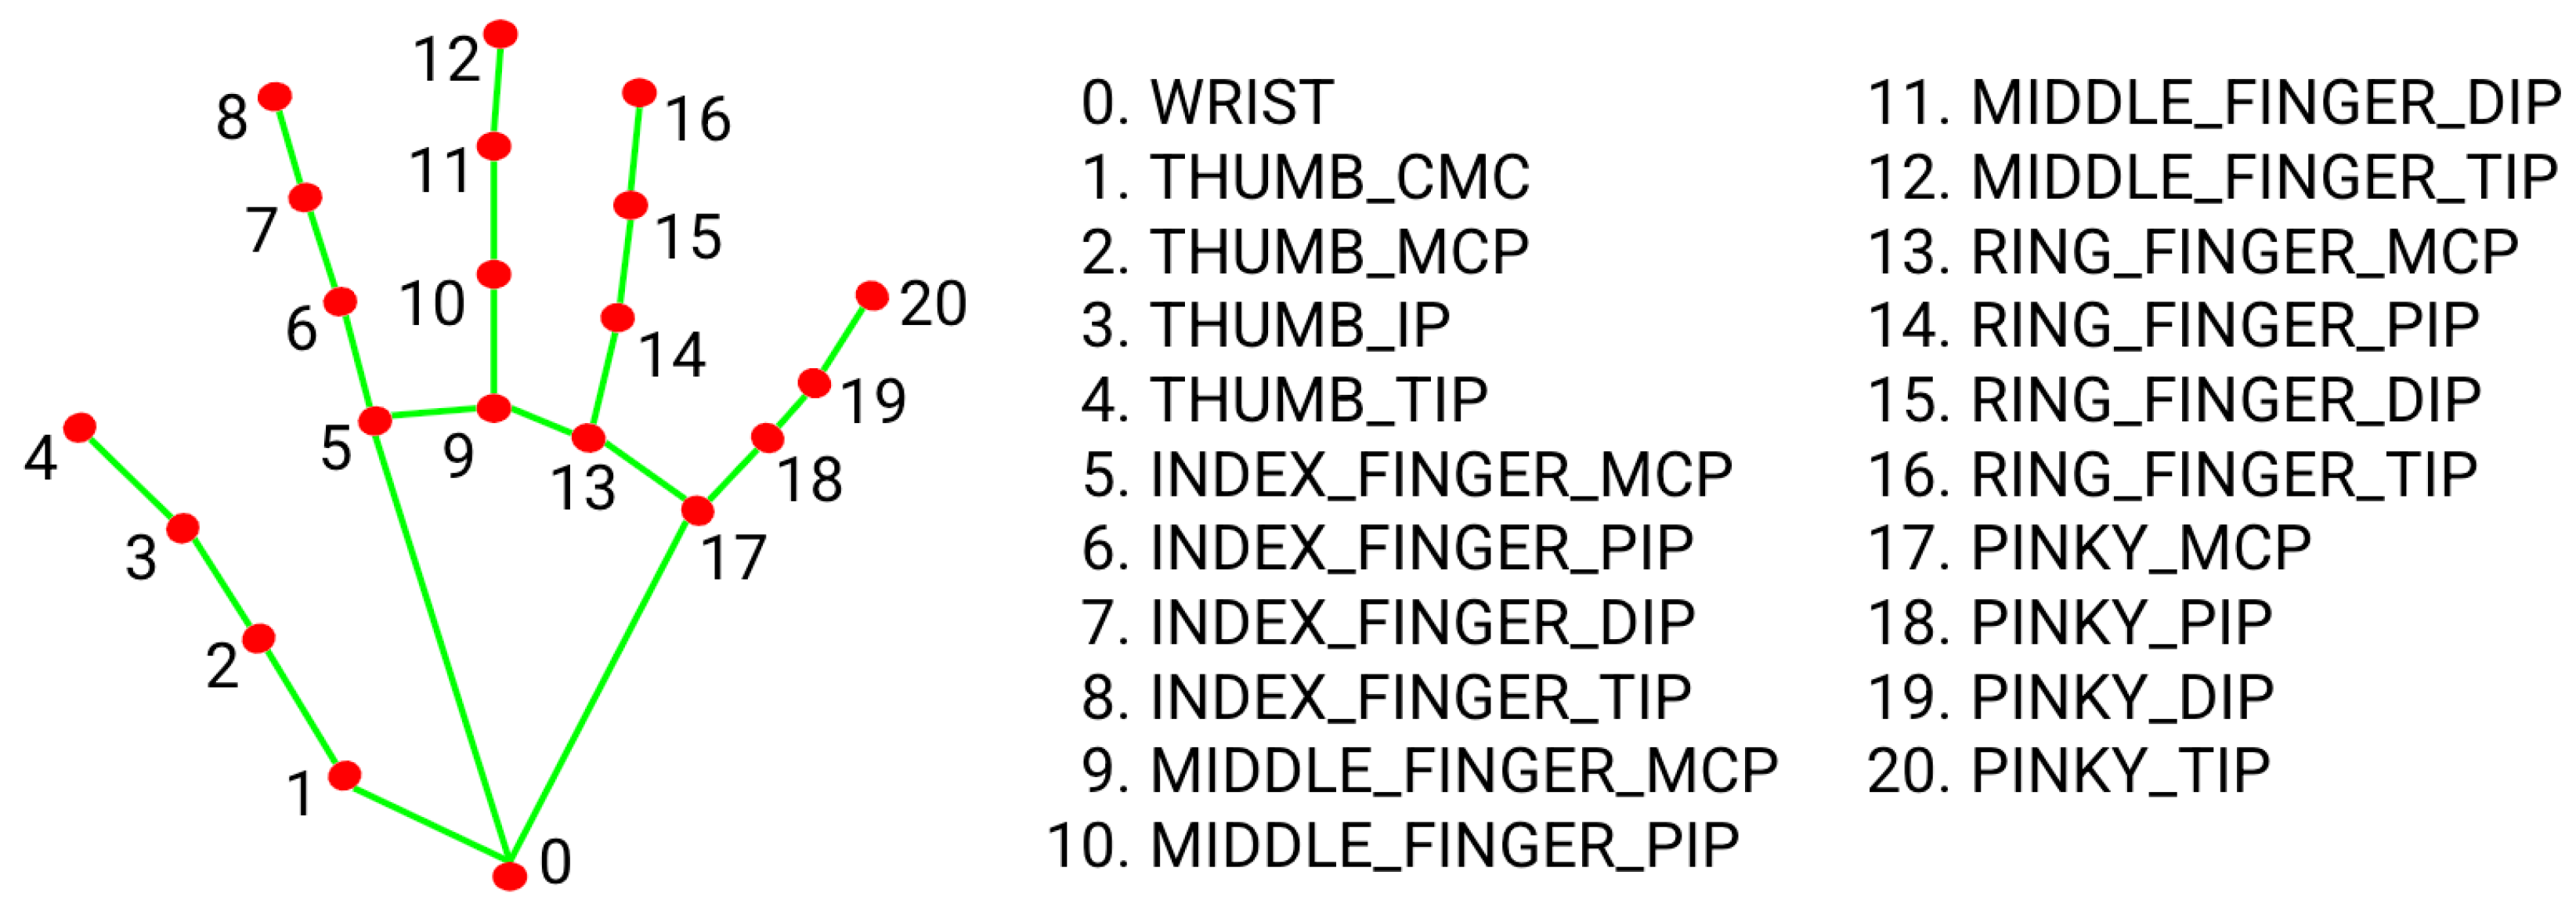
  • ROI Extraction: Extracting critical facial landmarks and hand-knuckle coordinates from the detected areas.
  • Motion Magnification: Amplifying subtle movements and physiological signals to reveal important dynamics.
  • Filtering: Removing noise and artifacts to enhance data accuracy.
  • Peak Detection: Identifying and characterizing relevant peaks in the signals.
The proposed methodology uses the above five steps to perform noninvasive estimation of blood pressure. Figure 2 illustrates a flowchart representing the proposed system.

3.1. Facial & Palmar Segmentation

The forehead region was deliberately chosen due to its well-established association with reliable cardiovascular signals, including pulse rate and blood flow. The forehead region offers convenient accessibility for individuals of all genders. It is essential to take into account that facial hair, particularly in the jaw, lips, and chin areas, is more common in men, which may present challenges, when utilizing these areas for monitoring purposes. Simultaneously, the upper palm region was also strategically targeted for blood pressure estimation. The upper palm’s consistent blood supply provided by the superficial palmar arch and deep palmar arch [21] and stable skin characteristics contribute to its suitability for noninvasive blood pressure estimation. At first, we employed OpenCV’s deep learning Face Detector, specifically the Single Shot Detector (SSD) model, as a fundamental component of our facial detection process in the 3-min video clip, followed by the next step of isolating the region of the forehead. The isolation process is facilitated by utilizing standard ratios between essential face landmarks typically found in the average human face, as elaborated in more detail in [22,23,24]. In prior research, we elucidated the process of isolating the forehead region through the employment of mathematical methodologies. Then, we delineated a computational framework to accurately extract and segregate the forehead region from the rest of the facial anatomy [25]. Given the comprehensive treatment of this mathematical underpinning in our prior research, we have opted to refrain from redundant repetition within the context of the current study. Next, we use mediapipe’s hand detection framework, which allows for the detection of hand landmarks in an image, enabling the rendering of visual effects over the hands. The approach infers 21 3D keypoints of a hand from a single frame, enabling real-time hand and finger tracking. Figure 3 visually demonstrates the accurate and precise localization of 21 3D hand-knuckle coordinates [26]. In the context of this application, our primary focus lies on the specific area formed by the landmarks 0, 1, 5, 9, 13, and 17. These key landmarks serve as critical reference points, precisely marking the boundaries and spatial extent of the upper palm area that we are keenly interested in analyzing.

3.2. Motion Magnification

In the subsequent step, we implement the Eulerian Video Magnification (EVM) method, initially proposed by Wu et al. [27], to enhance blood flow signals captured by the infrared camera in the facial and palmar region. The EVM technique involves amplifying the subtle variations in the intensity of infrared light due to changing blood flow, achieved by setting the amplification factor to α = 120 . Specifically, we assume the presence of a small invisible movement δ ( t ) at pixel r = ( x , y ) in the original video sequence V ( x , y , t ) . The motion magnification approach aims to magnify this movement, producing the magnified video sequence I ( x , y , t ) using the following relation:
I ( r , t ) = V ( r , t ) + α B ( r , t ) f ( r + ( 1 + α ) δ ( t ) )
To perform motion amplification, Wu et al. [27] utilize a Laplacian pyramid decomposition for each frame, and the amplification is applied along the time axis t. The concept can be extended to encompass multiple frequencies, thereby enabling the selection of a range of motion frequencies for amplification within the framework. For this particular application, we carefully selected a frequency range of amplification between 0.4 and 4 Hz. This range includes the typical human heart rate range and even accounts for instances of high heart rate, such as supraventricular tachycardia (SVT), where the heart rate may reach a peak of 240 beats per minute (bpm) [28]. A similar frequency range was employed by Kong et al. [29] in their blood flow signal amplification experiments. To optimize computational efficiency, motion magnification is exclusively applied to the extracted forehead area, rather than the entire face, and the upper palm area. This strategic approach contributes to reducing the computational cost of the proposed methodology.
Eulerian Video Magnification (EVM) has emerged as a powerful tool for visualizing subtle temporal variations in videos that may not be discernible with the naked eye. Its efficacy has been demonstrated in diverse applications, including the extraction of vital physiological information from videos of human faces [30,31] and animals [32]. This technique can be relatively immune to variations in human skin complexion due to its underlying mathematical principles [27]. The adoption of EVM in our research aims to unlock valuable insights into blood flow dynamics and provide a comprehensive understanding of physiological processes in the facial and palmar regions.

3.3. Post-Processing & Peak Detection

For every recorded video segment focused on the forehead and palm regions, a systematic computational procedure is executed to compute both the mean and standard deviation metrics for each individual frame in order to quantify the temporal characteristics of the physiological signals embedded within the video sequences. The next step involves the application of a fundamental band-pass filtering technique within the frequency spectrum of 0.4 to 4 Hz. The primary objective of this filtering procedure is to eliminate unwanted noise and artifacts from the signal. Following the completion of the filtering procedure, our analysis enters a critical phase where the detection of discrete peaks within the refined signals obtained from both the forehead and palm regions becomes the focal point. A discerning criterion is applied whereby pairs of detected peaks, should their temporal separation exceed 5 frames, are purposefully omitted from further consideration. The rationale behind the selection of a 5-frame threshold is rooted in a contextual understanding of temporal dynamics and the specific parameters of our experimental setup. Drawing inspiration from the work of Fan et al. [13], who similarly endeavored to compute pulse transit time between facial and palm regions, we recognize that pulse transit time spans a range of approximately 60 milliseconds (ms) in their study. Considering our camera’s recording speed of 30 frames per second (fps), we extrapolate that a 5-frame interval equates to a temporal window of approximately 167 ms. Our methodology involves the systematic accumulation of median time intervals among peak pairs for each individual video recording. These collected median time intervals serve as crucial temporal markers. Subsequently, an averaging procedure is employed to compute the mean value of these individual median time intervals across all video recordings within a given volunteer’s dataset. Ultimately, a comprehensive summation of our investigative process results in the derivation of dual definitive measurements per individual volunteer. Building upon this foundational framework, our pursuit extends towards the application of basic machine learning regression methodologies. The objective therein is the formulation and refinement of two distinctive functions, each characterized by a dual-input configuration. Figure 4 demonstrates the procedure of determining the time distance between the local peaks of the forehead and the upper palm signal. Specifically, we endeavor to construct a two-input function tailored to prognosticate systolic blood pressure, as well as a parallel counterpart calibrated to anticipate diastolic blood pressure.

4. Regression Techniques

4.1. Generalized Additive Models

Generalized Additive Models (GAMs) represent a type of regression model designed to capture intricate non-linear connections between a response variable and one or more predictor variables [33]. These models excel in regression tasks by accommodating more intricate relationships present in the data compared to conventional linear regression models like Generalized Linear Models (GLMs). Unlike GLMs, which are restricted to linear relationships and impose distribution assumptions on the response variable, GAMs offer a more versatile approach [34]. They were introduced to overcome these limitations by utilizing Additive Models, which amalgamate various functions of predictor variables (basis functions) to model non-linear relationships. A noteworthy feature of GAMs is their capacity to manage an array of response variable distributions without requiring predefined assumptions.
Mathematically, a GAM expresses the relationship between a random variable Y and a series of predictor random variables X 1 , X 2 , , X p through summation:
E { Y | X 1 , X 2 , , X p } = f 0 + j = 1 p f j ( X j )
Here, f j ( · ) signifies smooth nonparametric functions that are standardized so that E { f j ( X j ) } = 0 [33]. In essence, Generalized Additive Models stand out as a more adaptable and potent tool for regression tasks compared to Generalized Linear Models. Their effectiveness is particularly notable when confronted with intricate, non-linear associations within the data.
Determining the number of splines in a GAM is a balancing act between model intricacy and goodness of fit. Opting for fewer splines may result in a more concise model but risk underfitting, whereas increasing the number of splines can heighten complexity and lead to overfitting. In our study, the selection of the number of splines in the Linear GAM model was influenced by prior insights and assumptions regarding the complexity of relationships between predictor variables and the response variable. Additionally, factors like the available sample size and computational resources played a role. Through experimentation, we have reached the deduction that employing seven splines represents the optimal choice for this specific application and dataset. This decision is driven by the imperative to minimize both the mean absolute error and standard deviation, while simultaneously upholding the accuracy of the model.

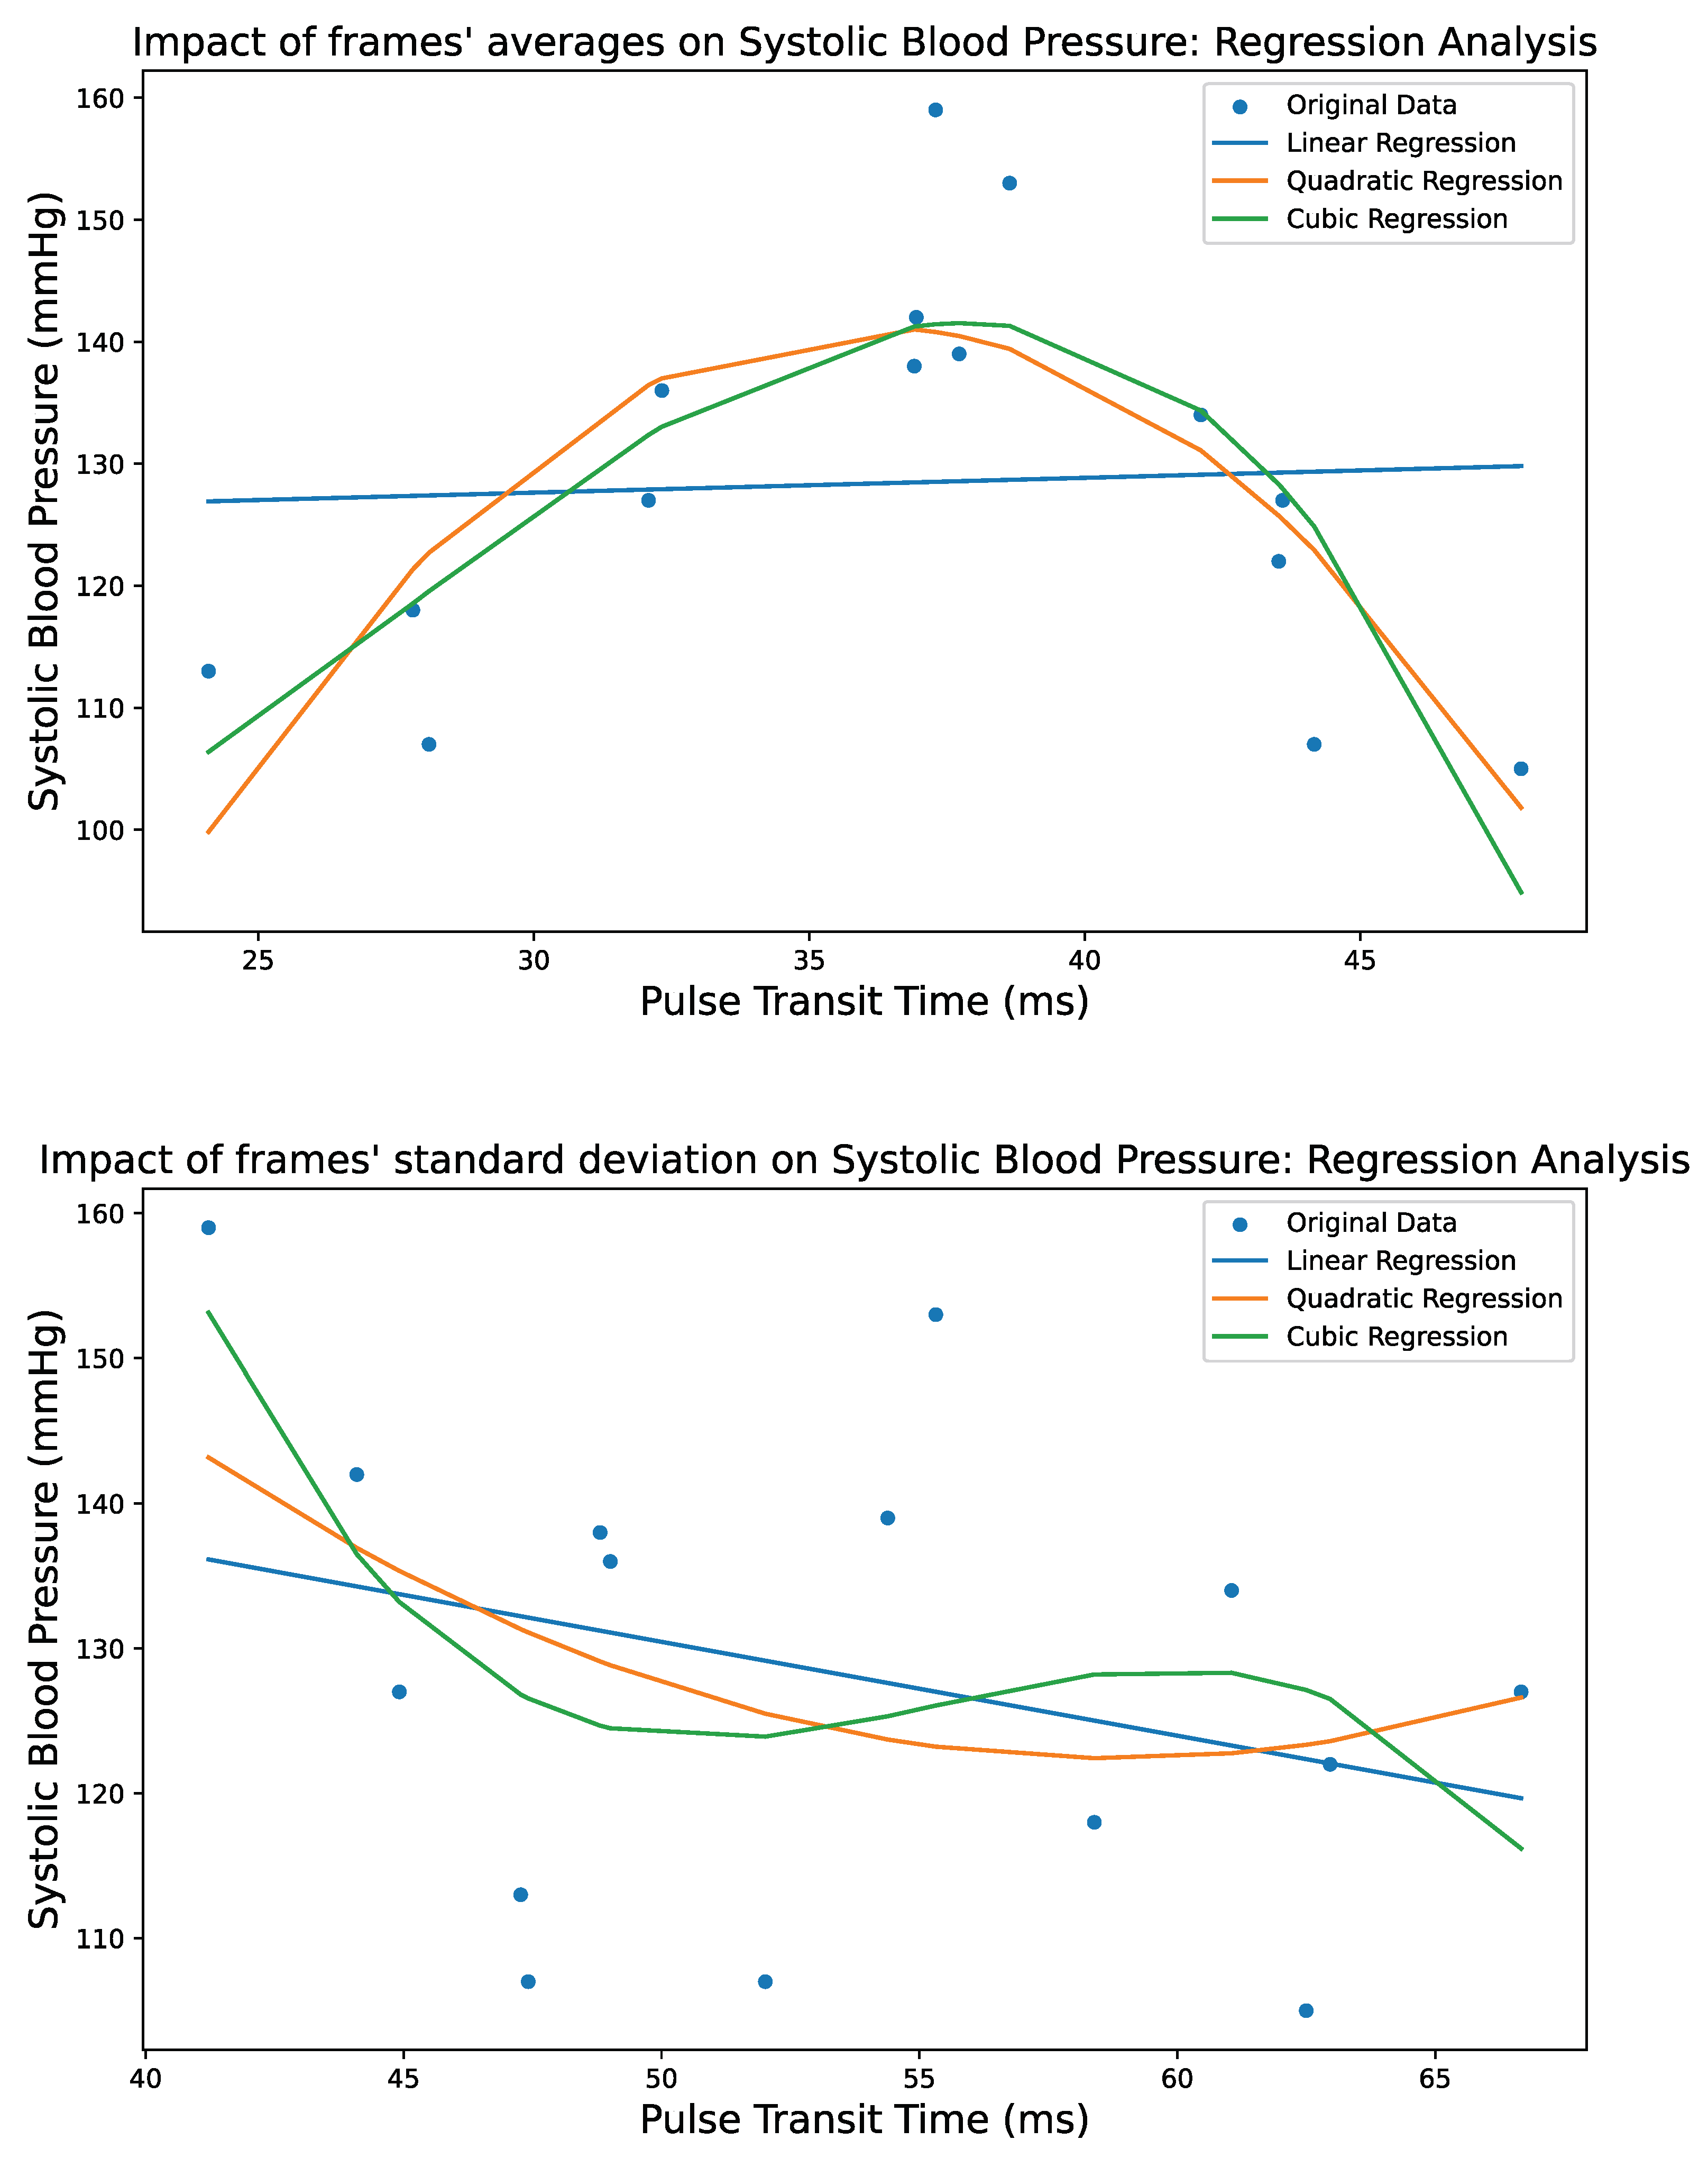
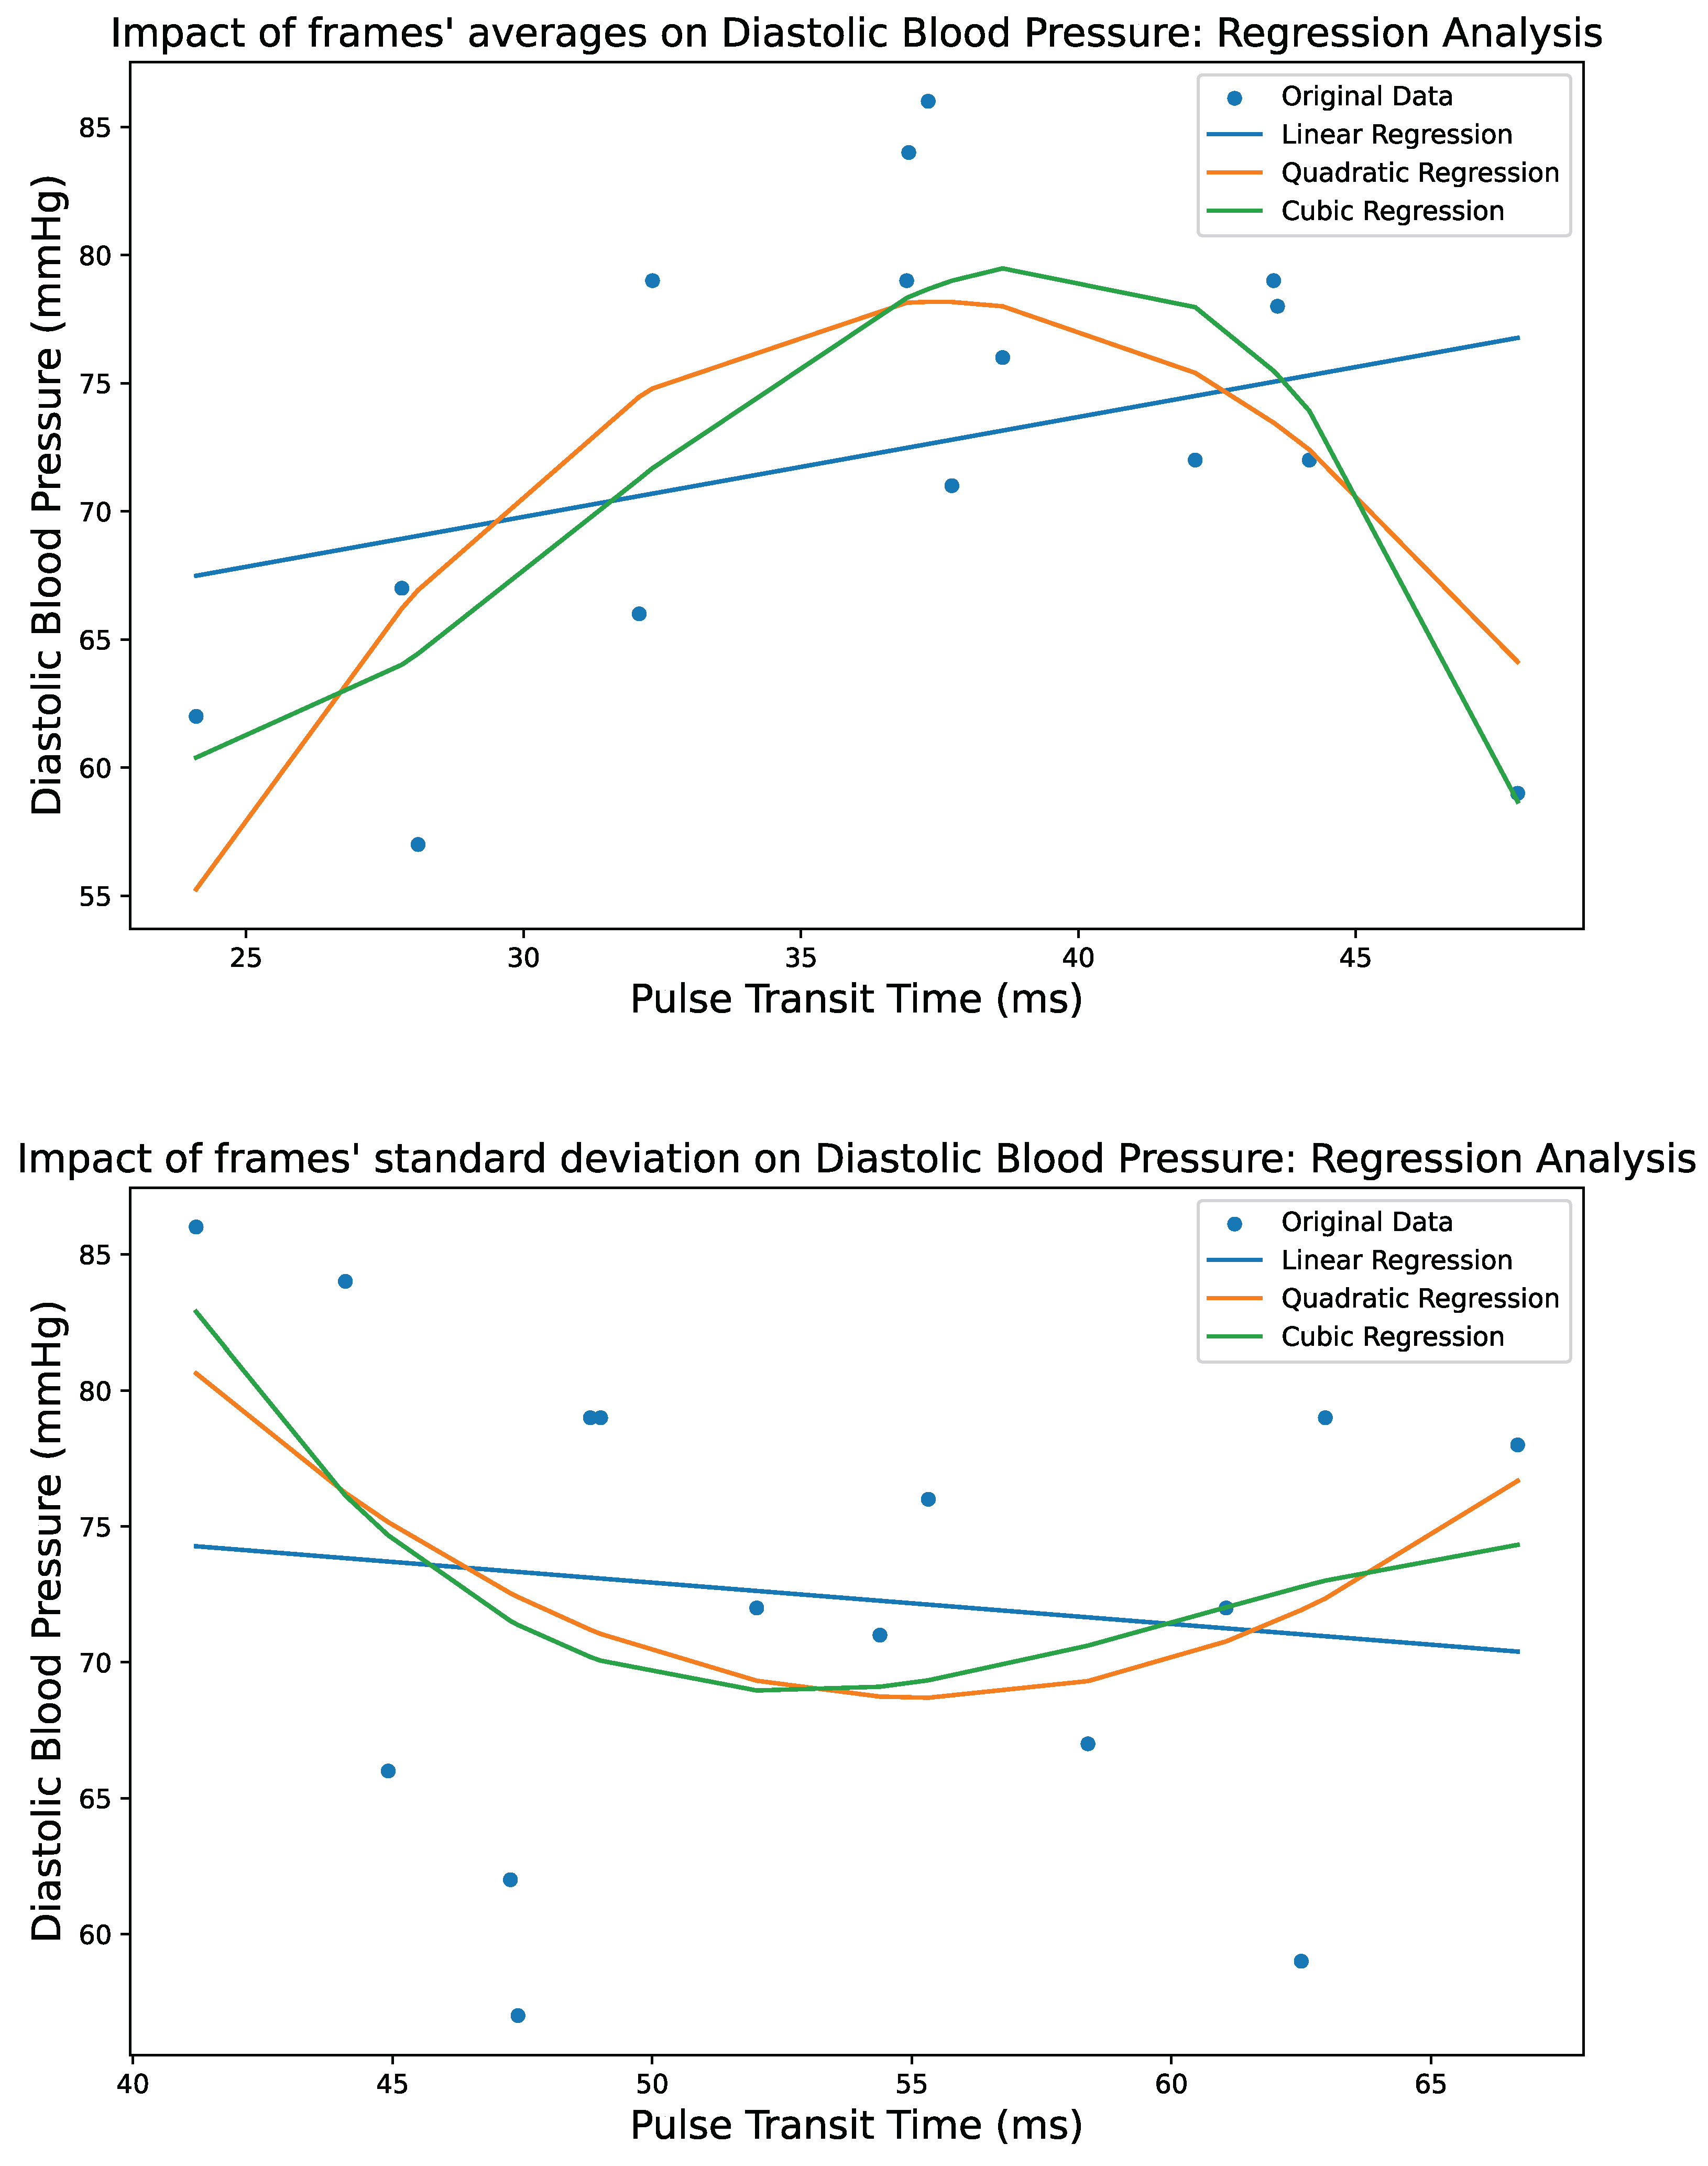
4.2. Polynomial Regression

Linear Regression, Quadratic Regression, and Cubic Regression are fundamental statistical techniques that serve as powerful tools for modeling and analyzing the relationships between variables in empirical data, each offering distinct degrees of complexity and flexibility.

4.2.1. Linear Regression

Linear Regression entails fitting a straight line to the data points, thus establishing a linear relationship between the independent (predictor) variable, usually denoted as x, and the dependent (response) variable, typically denoted as y. The equation takes the form
y = β 0 + β 1 x + ε
where β 0 is the intercept, β 1 is the slope, and ε represents the residual error. The goal is to find the best-fit line that minimizes the sum of squared residuals, effectively capturing the overall trend between the variables.

4.2.2. Quadratic Regression

Quadratic Regression, building upon the foundation of Linear Regression, introduces curvature to the model by incorporating a quadratic term. The equation becomes
y = β 0 + β 1 x + β 2 x 2 + ε
where β 2 represents the coefficient of the quadratic term. This technique accommodates situations where the relationship between variables is more nuanced, potentially exhibiting a parabolic pattern (upward or downward curvature).

4.2.3. Cubic Regression

Cubic Regression further extends the repertoire by incorporating cubic terms, enabling the representation of even more intricate curves within the data. The equation takes the form
y = β 0 + β 1 x + β 2 x 2 + β 3 x 3 + ε
where β 3 signifies the coefficient of the cubic term. This technique is invaluable when the underlying relationship demonstrates pronounced curvature, including scenarios where the data follow an “S” or “U” shaped trajectory.

5. Results

5.1. Implementation

Motion magnification tasks were executed using Mathworks MATLAB R2018b, primarily due to the availability of the original motion magnification code by Wu et al. [27] in MATLAB [35]. On the other hand, the proposed machine learning regression approaches were implemented using Python v3.10.8, employing the scikit-learn package. For the face/hand detection and segmentation algorithm, Python v3.10.8 was employed, meeting MediaPipe’s and PyGAM’s python version requirements for total compatibility. For conducting the experiments, we utilized a high-performance Ubuntu 22.04 PC equipped with 64 GB RAM, an Intel i9 11900F 2.5 GHz 16-Core CPU, and an NVIDIA GeForce RTX 3090 GPU with 24 GB of RAM. The computer system, provided by the ASPiDA project, was utilized for conducting our experiments. It is noteworthy that the algorithms tested exhibit optimal performance even when executed on a considerably less powerful computer. Our objective was to ensure that our models were highly efficient and capable of real-time execution in various practical applications and scenarios. The average memory used for Linear, Quadratic and Cubic Regression is just 125.85 Megabytes and the average time consumed in data loading and data processing is 4 milliseconds, while the average memory used for Generalized Additive Model Regression is 109.45 Megabytes and the average time consumed in data loading and data processing is 834 milliseconds.

5.2. Validation Standards

The American Association for the Advancement of Medical Instrumentation (AAMI) and the British Hypertension Society (BHS) have independently published comprehensive standards pertaining to sphygmomanometers, encompassing rigorous protocols for evaluating the accuracy and performance of these medical devices [36,37]. The grading criteria, employed by the British Hypertension Society (BHS), are depicted in Table 1. The BHS protocol assigns grades to devices based on their agreement with the mercury standard for systolic and diastolic pressures. The highest level of agreement is denoted by grade A, while the lowest level is indicated by grade D. For a sphygmomanometer to fulfill the BHS protocol, it must achieve at least grade B for both systolic and diastolic readings, reflecting a clinically acceptable level of accuracy and agreement with the mercury standard [36]. Similarly, the Association for the Advancement of Medical Instrumentation (AAMI) has formulated its own evaluation criteria for sphygmomanometers. According to the AAMI protocol, the test device’s measurements should closely match the mercury standard, with a mean difference from the standard not exceeding 5 mm Hg for blood pressure readings. Additionally, the standard deviation, which represents the variability of differences between the test device and the mercury standard, should not exceed 8 mm Hg [37]. Compliance with both of these standardized criteria provides confidence in the reliability of these medical devices for blood pressure measurement.

5.3. Performance

Through rigorous experimentation, we evaluated four distinct regression models, and our findings reveal that the Cubic and Generalized Additive Model (GAM) regression models have demonstrated consistent adherence to the established criteria outlined by both the British Hypertension Society (BHS) and the Association for the Advancement of Medical Instrumentation (AAMI) protocols. Notably, the substantial R2 scores attained by these models serve as robust indicators of the considerable correlation achieved between the estimated blood pressure values and the reference standards, thereby substantiating the efficacy and potential clinical relevance of our approach. Detailed results and model performance metrics are provided in Table 2. We have systematically generated regression fitness curves for each individual model concerning both systolic and diastolic blood pressure parameters. These fitness curves graphically encapsulate the relationship between the predicted and actual blood pressure values, providing a visual representation of the models’ efficacy in approximating blood pressure dynamics. These graphical representations, offer a comprehensive insight into the models’ performance, aiding in the assessment of their precision and suitability for blood pressure estimation. Additionally, we must emphasize that while Cubic Regression initially outperforms a generalized additive model (GAM) due to its ability to capture complex data patterns, the situation may change with an increase in the amount of data. With more data, the GAM has the potential to surpass cubic regression in terms of accuracy and generalization. This shift occurs because the GAM, being a more flexible and less prone to overfitting model, can better adapt to the growing complexity of the data. It can effectively capture nuanced relationships and generalize more accurately, striking a balance between fitting the training data and making predictions relevant to a wider range of scenarios. The corresponding plots illustrating these regression fitness curves are available in Figure 5, Figure 6, Figure 7 and Figure 8.
In Table 3, the presented data provide a comparative analysis of the outcomes yielded by our proposed methodology in contrast to those obtained by alternative approaches. While we may not have exceeded the performance of the current state-of-the-art approach, it is noteworthy that our results, achieved employing an infrared camera, which inherently provides a more limited information spectrum, compared to a conventional RGB camera, along with the application of video motion magnification for the first time, demonstrate a commendable level of efficacy and potential. It is essential to reiterate that, as it is evident from Table 3, not all methods meet the criteria for both medical protocols, or in some cases, an exploration of their compatibility with these criteria has not been undertaken.

5.4. Potential Biases

Our study acknowledges the presence of certain potential biases that warrant consideration and mitigation for the sake of comprehensive research integrity. One such bias pertains to the exclusive inclusion of male volunteers in our dataset. In order to augment the scope and generalizability of our findings, future investigations should be thoughtfully designed to encompass a diverse gender representation, thereby facilitating a more comprehensive exploration of physiological responses across genders. Moreover, the current study’s participant demographic skews towards an elderly population, introducing another potential bias. A crucial avenue for enhancing the robustness of our methodology involves broadening participant recruitment to encompass individuals spanning a spectrum of age groups. This expansion would foster a richer dataset, enabling a more nuanced understanding of the interplay between age and blood pressure dynamics. Furthermore, the monocultural composition of our volunteer cohort, predominantly comprising individuals of Caucasian ethnicity, is a potential bias that necessitates attention. To bolster the robustness and applicability of our methodology, future endeavors should strive to incorporate individuals from diverse ethnic backgrounds, thereby capturing the variability in skin complexions and potentially unveiling ethnicity-specific patterns in blood pressure estimation.

6. Conclusions

Our study has effectively showcased compelling evidence supporting the feasibility of non-contact, non-invasive blood pressure monitoring utilizing data derived from a monochromatic infrared stream, while simultaneously upholding cost-efficiency. The method put forth in this study leverages precise facial and palmar segmentation combined with the technique of motion magnification. Through this approach, we successfully deduce the pulse transit time between the corresponding signals acquired from each video within our dataset. This transit time data are further aggregated and analyzed to compute the average transit time specific to each participant. Leveraging an array of regression tools, the obtained results were subjected to rigorous validation against internationally recognized health protocols, exceeding the stipulated criteria. In our investigation, our approach, which utilized a substantially smaller dataset compared to the most precise method examined in our comparative study, has demonstrated considerable promise. The results obtained thus far indicate that the accuracy of our approach can be further enhanced through the acquisition of additional data.

Author Contributions

Conceptualization, N.M. and T.S.; methodology, T.S. and N.M.; software, T.S.; validation, T.S.; formal analysis, N.M.; investigation, T.S.; writing—original draft preparation, T.S.; writing—review and editing, T.S. and N.M.; supervision, N.M.; project administration, N.M.; funding acquisition, N.M. All authors have read and agreed to the published version of the manuscript.

Funding

This study was made possible through the project “Improvement of the Quality of Life and Activity for the Elderly” (MIS 5047294) which was implemented under the “Support for Regional Excellence” program, financed by the “Competitiveness, Entrepreneurship and Innovation” program (NSRF 2014–2020) and funded jointly by Greece and the European Union (European Regional Development Fund).

Institutional Review Board Statement

The study was conducted in compliance with the ethical principles outlined in the Declaration of Helsinki of 1975, which was later revised in 2013, and approved by the Institutional Review Board (or Ethics Committee) of Democritus University of Thrace (protocol code: 5902, date of approval: 31 December 2020) for studies involving humans.

Informed Consent Statement

Written informed consent has been obtained from all participants in the study, including the patient(s) whose information is included in this paper. The consent form includes a full explanation of the nature and purpose of the study, as well as any potential risks and benefits of participation. The participants were informed that their participation is voluntary, and that they have the right to withdraw from the study at any time without any negative consequences. The participants were also informed that their information will be kept confidential and anonymous, and that the data collected will only be used for the purposes of the research study.

Data Availability Statement

The developed code and data used in this study can be found at the mentioned link: https://github.com/TomStog/Infrared-BP, accessed on 4 February 2024.

Acknowledgments

The authors would like to extend their appreciation to all participants who volunteered for the study.

Conflicts of Interest

The authors declare that they have no financial, personal, or professional conflicts of interest that may have influenced the design, conduct, analysis, or interpretation of this study. Additionally, the authors have not been involved in any other studies or research projects that could be perceived as conflicting with the current study. The authors assure that the results of this study have been reported honestly and accurately, and that the data presented have not been manipulated or falsified in any way.

References

  1. Li, Z.; Zhang, Z.; Ren, Y.; Wang, Y.; Fang, J.; Yue, H.; Ma, S.; Guan, F. Aging and age-related diseases: From mechanisms to therapeutic strategies. Biogerontology 2021, 22, 165–187. [Google Scholar] [CrossRef]
  2. Mancia, G.; Kreutz, R.; Brunström, M.; Burnier, M.; Grassi, G.; Januszewicz, A.; Muiesan, M.L.; Tsioufis, K.; Agabiti-Rosei, E.; Algharably, E.A.E.; et al. 2023 ESH Guidelines for the Management of Arterial Hypertension the Task Force for the Management of Arterial Hypertension of the European Society of Hypertension Endorsed by the International Society of Hypertension (ISH) and the European Renal Association (ERA). J. Hypertens. 2023, 41, 1874–2071. [Google Scholar] [PubMed]
  3. Cheng, S.; Xanthakis, V.; Sullivan, L.M.; Vasan, R.S. Blood Pressure Tracking over the Adult Life Course. Hypertension 2012, 60, 1393–1399. [Google Scholar] [CrossRef] [PubMed]
  4. Muntner, P.; Shimbo, D.; Carey, R.M.; Charleston, J.B.; Gaillard, T.; Misra, S.; Myers, M.G.; Ogedegbe, G.; Schwartz, J.E.; Townsend, R.R.; et al. Measurement of Blood Pressure in Humans: A Scientific Statement from the American Heart Association. Hypertension 2019, 73, e35–e66. [Google Scholar] [CrossRef]
  5. Buford, T.W. Hypertension and Aging. Ageing Res. Rev. 2016, 26, 96–111. [Google Scholar] [CrossRef]
  6. Oliveros, E.; Patel, H.; Kyung, S.; Fugar, S.; Goldberg, A.; Madan, N.; Williams, K.A. Hypertension in Older Adults: Assessment, Management, and Challenges. Clin. Cardiol. 2019, 43, 99–107. [Google Scholar] [CrossRef]
  7. Magny, E.; Donadio, C.; Maronnat, F.; Nghiem, D.; Berthelot, E.; Belmin, J.; Lafuente-Lafuente, C. Hypotensions in the Elderly: Clinical and Therapeutic Features. Presse Medicale 2019, 48, 134–142. [Google Scholar] [CrossRef] [PubMed]
  8. Ermasova, S.A.; Shvarts, Y.G. Transient Hypotension in Elderly Hypertensive Patients: What and How to Manage? e-J. Cardiol. Pract. 2022, 22. Available online: https://www.escardio.org/Journals/E-Journal-of-Cardiology-Practice/Volume-22/transient-hypotension-in-elderly-hypertensive-patients-what-and-how-to-manage (accessed on 4 February 2024).
  9. Frezza, E.E.; Mezghebe, H.M. Indications and complications of arterial catheter use in surgical or medical intensive care units: Analysis of 4932 patients. Am. Surg. 1998, 64, 127–131. [Google Scholar]
  10. Paik, J.J.; Hirpara, R.; Heller, J.A.; Hummers, L.K.; Wigley, F.M.; Shah, A.A. Thrombotic Complications after Radial Arterial Line Placement in Systemic Sclerosis: A Case Series. Semin. Arthritis Rheum. 2016, 46, 196–199. [Google Scholar] [CrossRef]
  11. Scheer, B.; Perel, A.; Pfeiffer, U.J. Clinical Review: Complications and Risk Factors of Peripheral Arterial Catheters Used for Haemodynamic Monitoring in Anaesthesia and Intensive Care Medicine. Crit. Care 2002, 6, 199–204. [Google Scholar] [CrossRef] [PubMed]
  12. Shimbo, D.; Artinian, N.T.; Basile, J.N.; Krakoff, L.R.; Margolis, K.L.; Rakotz, M.K.; Wozniak, G. Self-Measured Blood Pressure Monitoring at Home: A Joint Policy Statement from the American Heart Association and American Medical Association. Circulation 2020, 142, e42–e63. [Google Scholar] [CrossRef] [PubMed]
  13. Fan, X.; Ye, Q.; Yang, X.; Choudhury, S.D. Robust Blood Pressure Estimation Using an RGB Camera. J. Ambient. Intell. Humaniz. Comput. 2018, 11, 4329–4336. [Google Scholar] [CrossRef]
  14. Rong, M.; Li, K. A Blood Pressure Prediction Method Based on Imaging Photoplethysmography in Combination with Machine Learning. Biomed. Signal Process. Control 2021, 64, 102328. [Google Scholar] [CrossRef]
  15. Yoshizawa, M.; Sugita, N.; Abe, M.; Tanaka, A.; Homma, N.; Yambe, T. Non-Contact Blood Pressure Estimation Using Video Pulse Waves for Ubiquitous Health Monitoring. In Proceedings of the 2017 IEEE 6th Global Conference on Consumer Electronics (GCCE), Nagoya, Japan, 24–27 October 2017. [Google Scholar]
  16. Takahashi, R.; Ogawa-Ochiai, K.; Tsumura, N. Non-Contact Method of Blood Pressure Estimation Using Only Facial Video. Artif. Life Robot. 2020, 25, 343–350. [Google Scholar] [CrossRef]
  17. Goudarzi, R.H.; Mousavi, S.S.; Charmi, M. Using Imaging Photoplethysmography (IPPG) Signal for Blood Pressure Estimation. In Proceedings of the 2020 International Conference on Machine Vision and Image Processing (MVIP), Qom, Iran, 18–20 February 2020. [Google Scholar]
  18. Topouchian, J.A.; Agnoletti, D.; Blacher, J.; Youssef, A.E.; Ibanez, I.; Khabouth, J.; Khawaja, S.; Beaino, L.; Asmar, R. Validation of four automatic devices for self-measurement of blood pressure according to the international protocol of the European Society of Hypertension. Vasc. Health Risk Manag. 2011, 7, 709–717. [Google Scholar]
  19. Stride BP. BP Monitors. Available online: https://www.stridebp.org/bp-monitors (accessed on 11 October 2023).
  20. Parati, G.; Ochoa, J.E. Blood Pressure Variability. In Updates in Hypertension and Cardiovascular Protection; Springer: Cham, Switzerland, 2018; pp. 395–417. [Google Scholar]
  21. McLean, K.M.; Sacks, J.M.; Kuo, Y.R.; Wollstein, R.; Rubin, J.P.; Lee, W.P.A. Anatomical Landmarks to the Superficial and Deep Palmar Arches. Plast. Reconstr. Surg. 2008, 121, 181–185. [Google Scholar] [CrossRef]
  22. Milutinovic, J.; Zelic, K.; Nedeljkovic, N. Evaluation of Facial Beauty Using Anthropometric Proportions. Sci. World J. 2014, 2014, 428250. [Google Scholar] [CrossRef]
  23. Kaya, K.S.; Türk, B.; Cankaya, M.; Seyhun, N.; Coşkun, B.U. Assessment of Facial Analysis Measurements by Golden Proportion. Braz. J. Otorhinolaryngol. 2019, 85, 494–501. [Google Scholar] [CrossRef]
  24. Fernandes, J.W. The Legacy of Art in Plastic Surgery. Plast. Reconstr.-Surg.-Glob. Open 2021, 9, e3519. [Google Scholar] [CrossRef] [PubMed]
  25. Stogiannopoulos, T.; Cheimariotis, G.A.; Mitianoudis, N. A Study of Machine Learning Regression Techniques for Non-Contact SPO2 Estimation from Infrared Motion-Magnified Facial Video. Information 2023, 14, 301. [Google Scholar] [CrossRef]
  26. Fernandez, J. Mediapipe Hands. GitHub. Available online: https://github.com/google/mediapipe/blob/master/docs/solutions/hands.md (accessed on 4 April 2023).
  27. Wu, H.Y.; Rubinstein, M.; Shih, E.; Guttag, J.; Durand, F.; Freeman, W. Eulerian Video Magnification for Revealing Subtle Changes in the World. ACM Trans. Graph. 2012, 31, 1–8. [Google Scholar] [CrossRef]
  28. Garratt, C.; Ward, D.; Antoniou, A.; Camm, A.J. Misuse of Verapamil in Pre-Excited Atrial Fibrillation. Lancet 1989, 333, 367–369. [Google Scholar] [CrossRef] [PubMed]
  29. Kong, L.; Zhao, Y.; Dong, L.; Jian, Y.; Jin, X.; Li, B.; Feng, Y.; Liu, M.; Liu, X.; Wu, H. Non-Contact Detection of Oxygen Saturation Based on Visible Light Imaging Device Using Ambient Light. Opt. Express 2013, 21, 17464–17471. [Google Scholar] [CrossRef] [PubMed]
  30. Brieva, J.; Moya-Albor, E.; Ponce, H. A Non-Contact SpO2 Estimation Using a Video Magnification Technique. In Proceedings of the 17th International Symposium on Medical Information Processing and Analysis, Campinas, Brazil, 17–19 November 2021. [Google Scholar]
  31. de Fátima Galvão Rosa, A.; Betini, R.C. Noncontact SPO2 Measurement Using Eulerian Video Magnification. IEEE Trans. Instrum. Meas. 2019, 69, 2120–2130. [Google Scholar] [CrossRef]
  32. Lauridsen, H.; Hedwig, S.D.; Perrin, K.L.; Williams, C.J.; Wrege, P.H.; Bertelsen, M.F.; Pedersen, M.; Butcher, J.T. Extracting Physiological Information in Experimental Biology via Eulerian Video Magnification. BMC Biol. 2019, 17, 103. [Google Scholar] [CrossRef] [PubMed]
  33. Hastie, T.; Tibshirani, R. Generalized Additive Models. In Statistical Science; Routledge: Oxfordshire, UK, 1986; Volume 1. [Google Scholar]
  34. MacCullagh, P.; Nelder, J.A. Generalized Linear Models; Chapman and Hall: London, UK, 1989. [Google Scholar]
  35. Video Magnification. Available online: https://people.csail.mit.edu/mrub/vidmag/#code (accessed on 14 October 2023).
  36. O’Brien, E.; Petrie, J.; Littler, W.; De Swiet, M.; Padfield, P.L.; Altman, D.; Bland, M.; Coats, A.; Atkins, N. The British Hypertension Society protocol for the evaluation of blood pressure measuring devices. J. Hypertens. 1993, 11 (Suppl. S2), S43–S62. [Google Scholar]
  37. White, W.B.; Berson, A.S.; Robbins, C.; Jamieson, M.J.; Prisant, L.M.; Roccella, E.; Sheps, S.G. National Standard for Measurement of Resting and Ambulatory Blood Pressures with Automated Sphygmomanometers. Hypertension 1993, 21, 504–509. [Google Scholar] [CrossRef] [PubMed]
  38. Rong, M.; Li, K. A Multi-Type Features Fusion Neural Network for Blood Pressure Prediction Based on Photoplethysmography. Biomed. Signal Process. Control. 2021, 68, 102772. [Google Scholar] [CrossRef]
Figure 1. The experimental setup showcases an anonymized volunteer, with the specific regions of interest highlighted. The delineated blue rectangle denotes the targeted forehead area, while the encompassed red rectangle corresponds to the upper palm region. These demarcated zones represent the focal points for data acquisition and analysis in this study.
Biomedinformatics 04 00025 g001
Figure 2. The figure displays a flowchart outlining the blood pressure estimation methodology under consideration. The primary objective is to obtain the average Pulse Transit Time (PTT) for each volunteer and investigate its correlation with both systolic and diastolic blood pressure.
Biomedinformatics 04 00025 g002
Figure 3. The analytical localization of 21 3D hand-knuckle coordinates.
Biomedinformatics 04 00025 g003
Figure 4. The presented graph illustrates a part of the waveform derived from the forehead signal (depicted in blue) alongside the waveform originating from the upper palm signal (depicted in red), both exhibiting discernible local peaks. Our analysis involves the computation of the mean temporal disparity between corresponding peaks, with a specific criterion set at an interval equal to or less than five frames.
Biomedinformatics 04 00025 g004
Figure 5. This graph illustrates the regression curves depicting the dynamic interplay between frames’ averages and systolic/diastolic blood pressure regarding Linear, Quadratic and Cubic Regression. The data points, plotted along with their corresponding regression lines, provide insights into the nature and strength of the association between chosen variables and systolic/diastolic blood pressure.
Biomedinformatics 04 00025 g005
Figure 6. This graph illustrates the regression curves depicting the dynamic interplay between frames’ standard deviation and systolic/diastolic blood pressure regarding Linear, Quadratic and Cubic Regression. The data points, plotted along with their corresponding regression lines, provide insights into the nature and strength of the association between chosen variables and systolic/diastolic blood pressure.
Biomedinformatics 04 00025 g006
Figure 7. This graph illustrates the regression curves depicting the dynamic interplay between frames’ averages and systolic/diastolic blood pressure regarding GAM Regression. The data points, plotted along with their corresponding regression lines, provide insights into the nature and strength of the association between chosen variables and systolic/diastolic blood pressure.
Biomedinformatics 04 00025 g007
Figure 8. This graph illustrates the regression curves depicting the dynamic interplay between frames’ standard deviation and systolic/diastolic blood pressure regarding GAM Regression. The data points, plotted along with their corresponding regression lines, provide insights into the nature and strength of the association between chosen variables and systolic/diastolic blood pressure.
Biomedinformatics 04 00025 g008
Table 1. This table presents the grading criteria employed by the British Hypertension Society (BHS). The grades in the table correspond to the cumulative percentage of readings that fall within 5 mm Hg, 10 mm Hg, and 15 mm Hg of the mercury standard. To achieve a specific grade, all three percentages must be equal to or greater than the corresponding values indicated in the table.
Grade≤5 mm Hg≤10 mm Hg≤15 mm Hg
A608595
B507590
C406585
D≤40≤65≤85
Table 2. This table showcases the outcomes of linear, quadratic, cubic, and generalized additive model (GAM) regressions for predicting blood pressure using the BHS and AAMI protocols.
Linear RegressionQuadratic RegressionCubic RegressionGAM
Systolic Blood Pressure-CP5 120
(D)
60
(A)
80
(A)
58
(B)
Systolic Blood Pressure-CP10 253.33
(D)
60
(D)
93.33
(A)
92.53
(A)
Systolic Blood Pressure-CP15 366.67
(D)
86.67
(C)
100
(A)
100
(A)
Diastolic Blood Pressure-CP5 140
(C)
66.67
(A)
80
(A)
68.4
(A)
Diastolic Blood Pressure-CP10 286.67
(A)
100
(A)
100
(A)
100
(A)
Diastolic Blood Pressure-CP15 393.33
(B)
100
(A)
100
(A)
100
(A)
Systolic Blood Pressure-MAE 412.017.043.84.99
Systolic Blood Pressure-SD 58.435.413.113.37
Diastolic Blood Pressure-MAE 46.383.862.084.03
Diastolic Blood Pressure-SD 53.912.712.332.48
Systolic Blood Pressure- R 2 Score0.16640.69480.90680.8598
Diastolic Blood Pressure- R 2 Score0.23110.69440.86580.6924
1 (Cumulative Percentage of readings that fall within 5 mm Hg of error); 2 (Cumulative Percentage of readings that fall within 10 mm Hg of error); 3 (Cumulative Percentage of readings that fall within 15 mm Hg of error); 4 (Mean Absolute Error-mm Hg); 5 (Standard Deviation-mm Hg).
Table 3. Quantitative Performance Analysis: A Comparative Evaluation of the Presented Method and Established Approaches. The cell values are represented in the format of Mean Absolute Error (MAE) ± Standard Deviation, aligning with the guidelines established by the AAMI protocol.
BHS-SBPBHS-DBPAAMI-SBPAAMI-DBP
Fan [13]-- 8.42 ± 8.81 12.34 ± 7.10
Rong [14]PassedPassed 2.1 ± 3.35 0.79 ± 2.58
Goudarzi [17]-- 0.45 ± 12.39 0.2 ± 6.41
Rong [38]PassedPassed 1.13 ± 7.25 0.14 ± 4.48
Proposed MethodPassedPassed 3.8 ± 3.11 2.08 ± 2.33
Disclaimer/Publisher’s Note: The statements, opinions and data contained in all publications are solely those of the individual author(s) and contributor(s) and not of MDPI and/or the editor(s). MDPI and/or the editor(s) disclaim responsibility for any injury to people or property resulting from any ideas, methods, instructions or products referred to in the content.

