Abstract
In this article, a comprehensive review is presented of recent technological advancements utilizing electromagnetic sensors in the microwave range for detecting human vital signs and lung water levels. With the main objective of improving detection accuracy and system robustness, numerous advancements in front-end architecture, detection techniques, and system-level integration have been reported. The benefits of non-contact vital sign detection have garnered significant interest across a range of applications, including healthcare monitoring and search and rescue operations. Moreover, some integrated circuits and portable systems have lately been shown off. A comparative examination of various system architectures, baseband signal processing methods, system-level integration strategies, and possible applications are included in this article. Going forward, researchers will continue to focus on integrating radar chips to achieve compact form factors and employ advanced signal processing methods to further enhance detection accuracy.
1. Introduction
Healthcare continues to be a critical challenge in the United States and globally, as documented by various sources [1,2]. The idea of intelligent and autonomous decision-making systems combined with home-based continuous patient monitoring is proposed as a solution to these problems in healthcare delivery [3,4]. Utilizing a variety of technologies, such as digital telecommunications, telemedicine, electronic medical records (EMRs), wireless communications, artificial intelligence, and cutting-edge medical sensors, is crucial to the effective implementation of home-based continuous patient monitoring programs. While components such as digital communication, EMR, and wireless communications have reached a stage where they meet the demands of continuous monitoring applications, certain key technologies, notably medical sensors, still necessitate significant development.
Detecting and monitoring the heart rate provides valuable insights into the individual’s cardiovascular health. The heart rate is responsive to a person’s reactions to various situations, including fear, illness, or depression. Similar to this, changes in respiration rate can be used as a precursor to both short- and long-term physiological abnormalities. Consequently, heart rate (HR) as well as breathing rate (RR) find utility in a range of applications, such as sleep monitoring, elderly health monitoring at home, monitoring the health of premature and term infants, keeping an eye on patients following surgery, and locating those who are trapped during search and rescue missions [5].
In recent years, the detection of human vital signs has captured the attention of numerous scientists, who have employed various methods and technologies for this purpose. Some researchers choose contact-based methodologies, employing wearable devices and sensors affixed to the human body to obtain vital sign readings. On the other hand, certain researchers prefer contactless technologies like laser technology, cameras, and radar systems. Among these options, the radar-based non-invasive detection technique stands out as a popular choice among researchers. This preference is primarily driven by the ability of radar systems to mitigate the inconveniences associated with wearable technology and electrocardiography (ECG) apparatuses.
Applying direct contact approaches to the body of the human has the potential to induce discomfort or even harm to the individual, with these issues becoming particularly pronounced in scenarios such as monitoring preterm infants and during sleep tracking where skin sensitivity is a concern. Additionally, the utilization of direct contact approaches may lead to behavioral changes in the subjects because of their knowledge of and discomfort with the equipment, which affects the measurement’s accuracy. Radar system use, on the other hand, reduces these potentialities and the related sources of inaccuracy.
A number of medical sensors currently in use still rely on wired data connections, which restrict patient mobility. Moreover, these sensors often focus on measuring just one specific vital sign (VS), making them unsuitable for continuous monitoring [6,7]. For instance, Welch Allyn’s FDA-approved Propaq LT [8,9], with an approximate base price of $5000, was chosen as a benchmark for our study. This selection was based on its lightweight design and its ability to simultaneously measure respiration rate (RR) and heart rate (HR). However, motion artefacts can affect this device and thus it is not the best choice for monitoring mobile patients.
The measurement of lung water content (LWL) holds significant medical significance as it serves as a dependable means of early detection of pulmonary edema. It is also valuable in monitoring the state of care for patients undergoing life-saving heart and burn surgeries [10]. The Microwave Stethoscope (MiSt) was introduced as an all-in-one, affordable, and non-invasive microwave sensor capable of obtaining various vital sign measurements, including LWL, through a single microwave measurement [11].
This survey offers an overview of the most recent advancements in the growing field of vital sign detection and lung water level measurement. It covers various dimensions of the research, including processing platforms, operating frequencies, and wireless communication hardware. To the best of the authors’ understanding, this review represents the first of its kind. The following sections of this review are organized as follows: the upcoming section provides a comprehensive description and summary of vital signs techniques, categorizing the various types of sensors and diverse vital signs detection systems, encompassing both contact and contactless systems. The review culminates by delving into lung water level measurement techniques, commencing with conventional methods and concluding with the exploration of microwave-based techniques.
2. Vital Signs Detection
Essential physiological markers, known as vital signs, play a pivotal role in assessing an individual’s physical well-being and overall health. These vital signs include blood pressure, body temperature, heart rate, and respiration rate, among others. The information gleaned from these vital signs provides healthcare practitioners with indispensable knowledge for the diagnosis, monitoring, and treatment of diverse medical conditions.
2.1. Types of Microwave Sensors
Of utmost importance in any vital signs detection system are sensors. In this section, we will delve into various types of microwave sensors utilized in the detection of distinct vital signs. Electromagnetic systems serve a purpose beyond communication; they are a highly beneficial approach for tracking physiological activities, behavioral trends, and disease identification across various organs. Within the vital signs detection sector, electromagnetic sensor-based systems can primarily be categorized into the following three groups shown in Figure 1. This subsection introduces and examines microwave sensors and their applications within the vital signs and LWL measurement sector, as depicted in Figure 1.
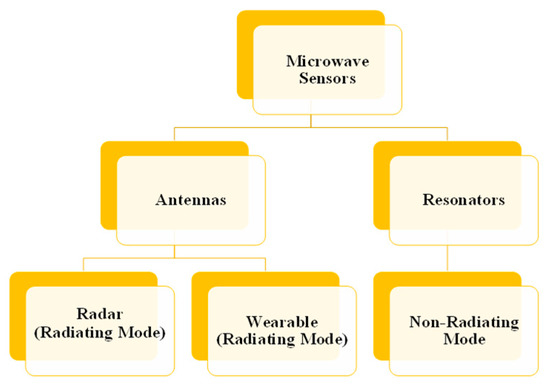
Figure 1.
Electromagnetic sensor-based system categories.
2.1.1. Techniques Based on Microwave Resonators
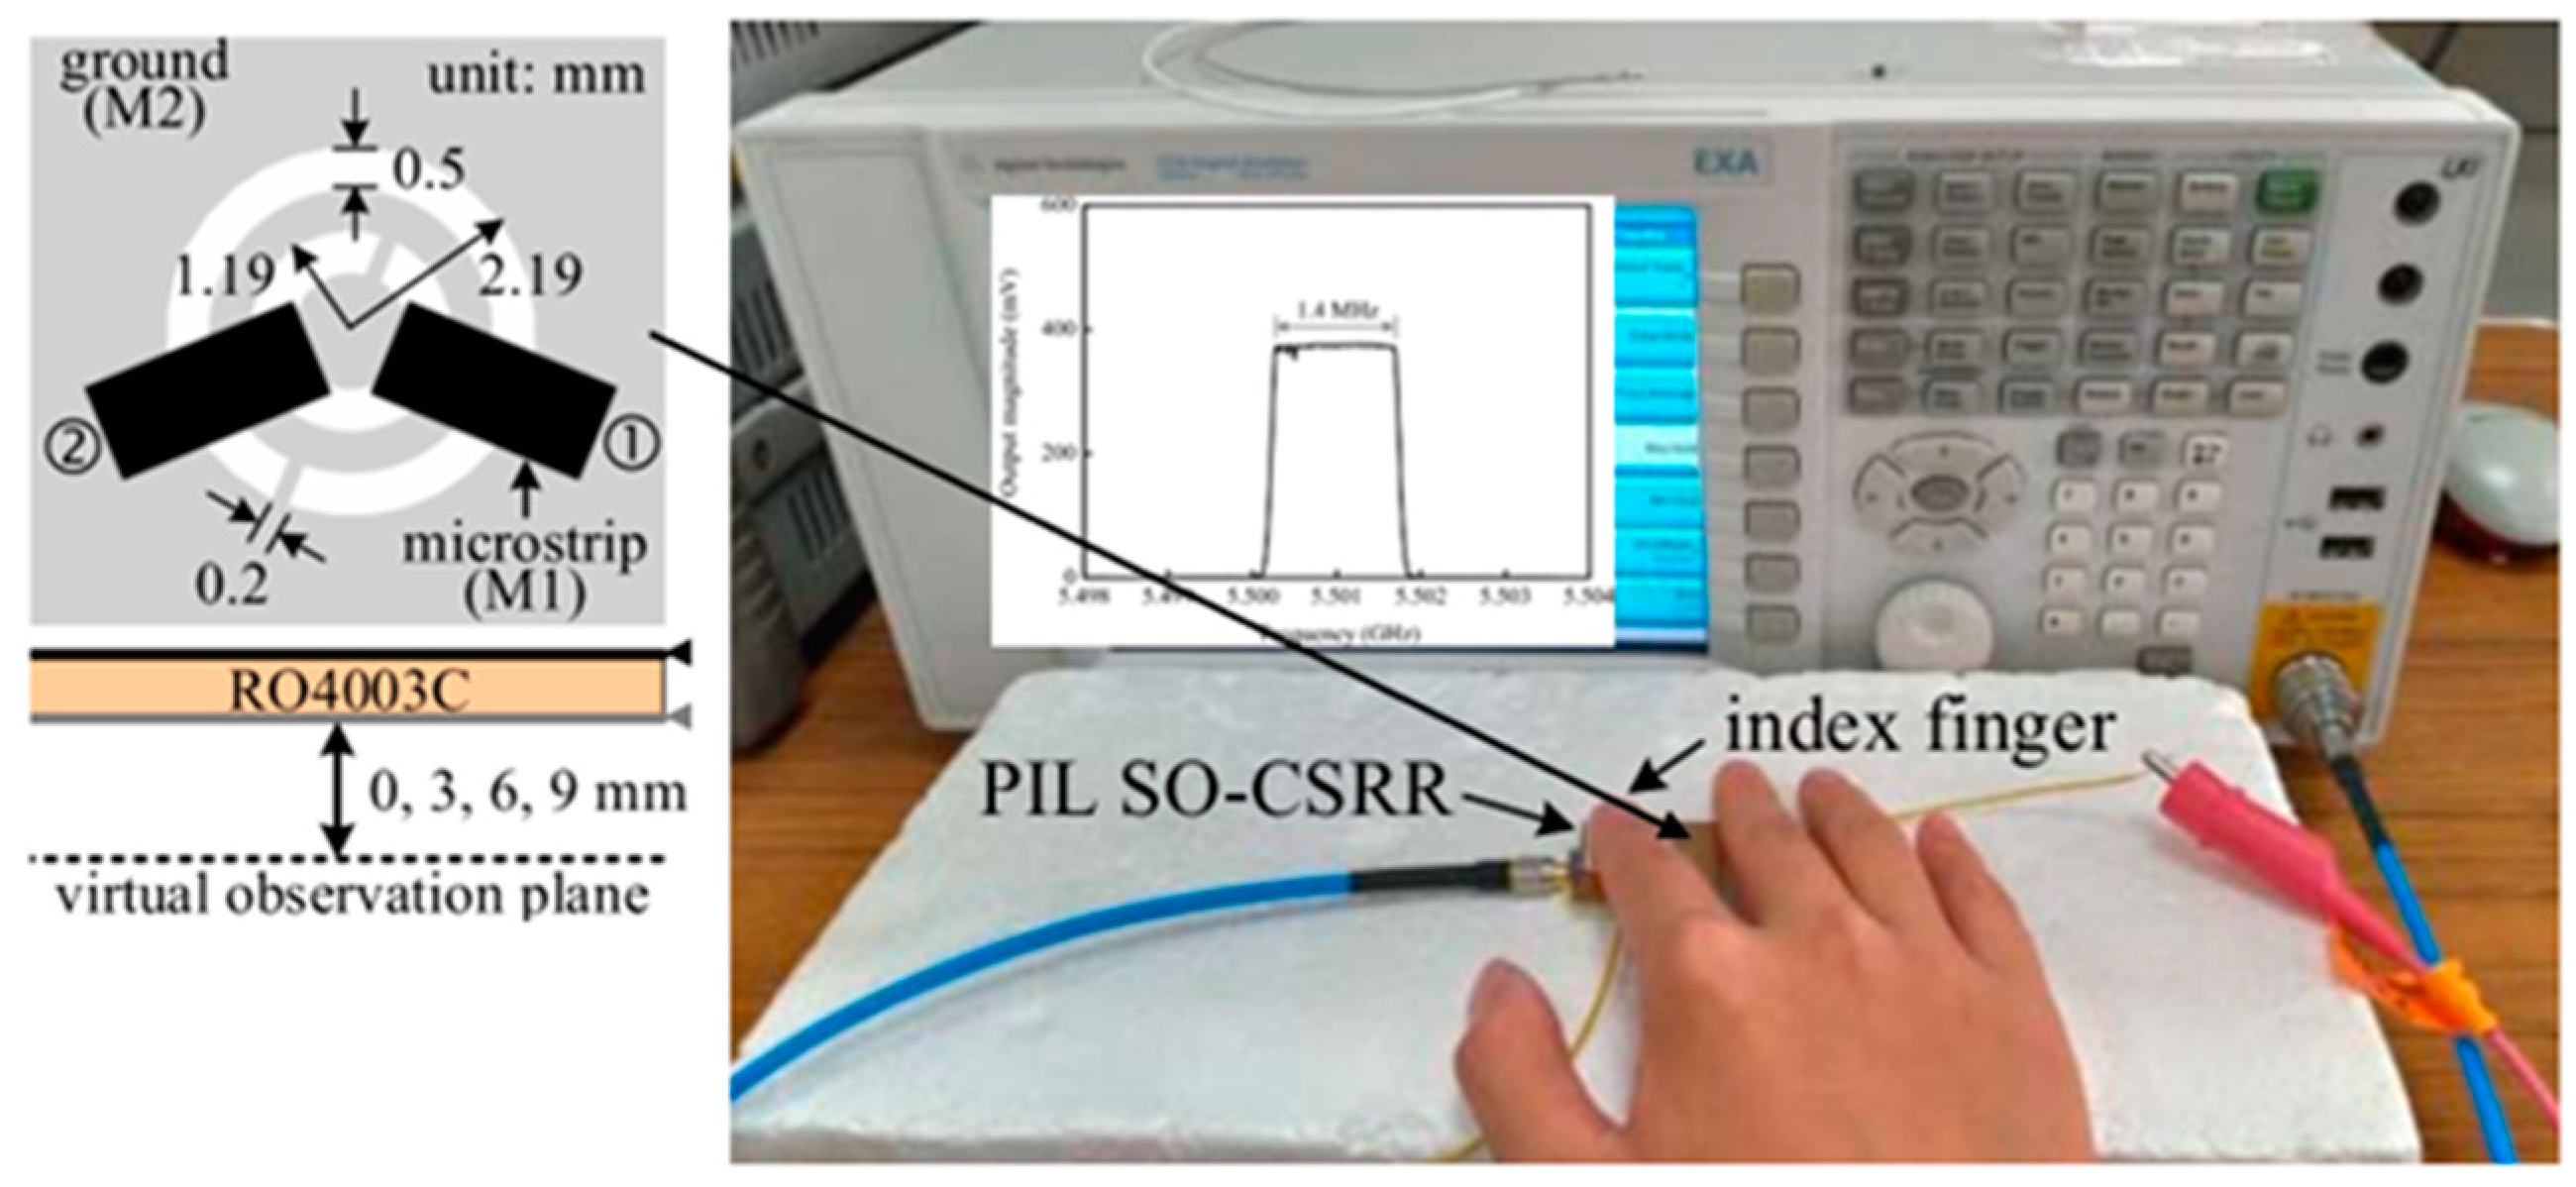
A microwave resonator is a transmission line segment with either short or open ends. Depending on the type of transmission line, the resonators might be referred to as cavity, microstrip, slot, or strip line resonators. A component of the EM field produced by the resonator interacts with the sample to be examined when the resonator is used as a sensor. Consequently, the object’s permittivity affects the resonant frequency and quality factor. Sensors may be produced for a multitude of healthcare applications because of the large range of conceivable structural designs. One of the main benefits of microwave resonators is their capacity to use penetrating waves to enable close quarter, non-invasive, contactless monitoring. This technology’s nonionizing qualities are particularly noteworthy since they remove major health risks associated with other types of sensors, particularly in the healthcare industry. One of their drawbacks is that material measurements with microwaves typically call for a high level of expertise and are subject to simultaneous influence from a variety of parameters, including structure, temperature, density, moisture content, and so forth [12]. Figure 2 shows some examples of how microwave resonators are used. As seen in Figure 3, a sensor that uses microwave technology, using a phased- and perturbation injection-locked (PPIL) sensor, and according to reference [13], a self-oscillating complementary split-ring resonator (SO-CSRR), is advised for the detection of vital signs.
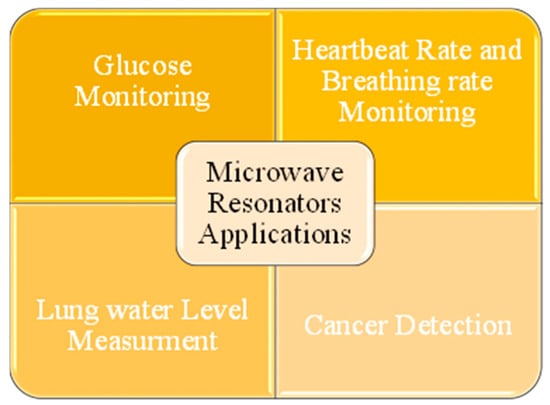
Figure 2.
Uses for microwave resonator technology.
Figure 2.
Uses for microwave resonator technology.
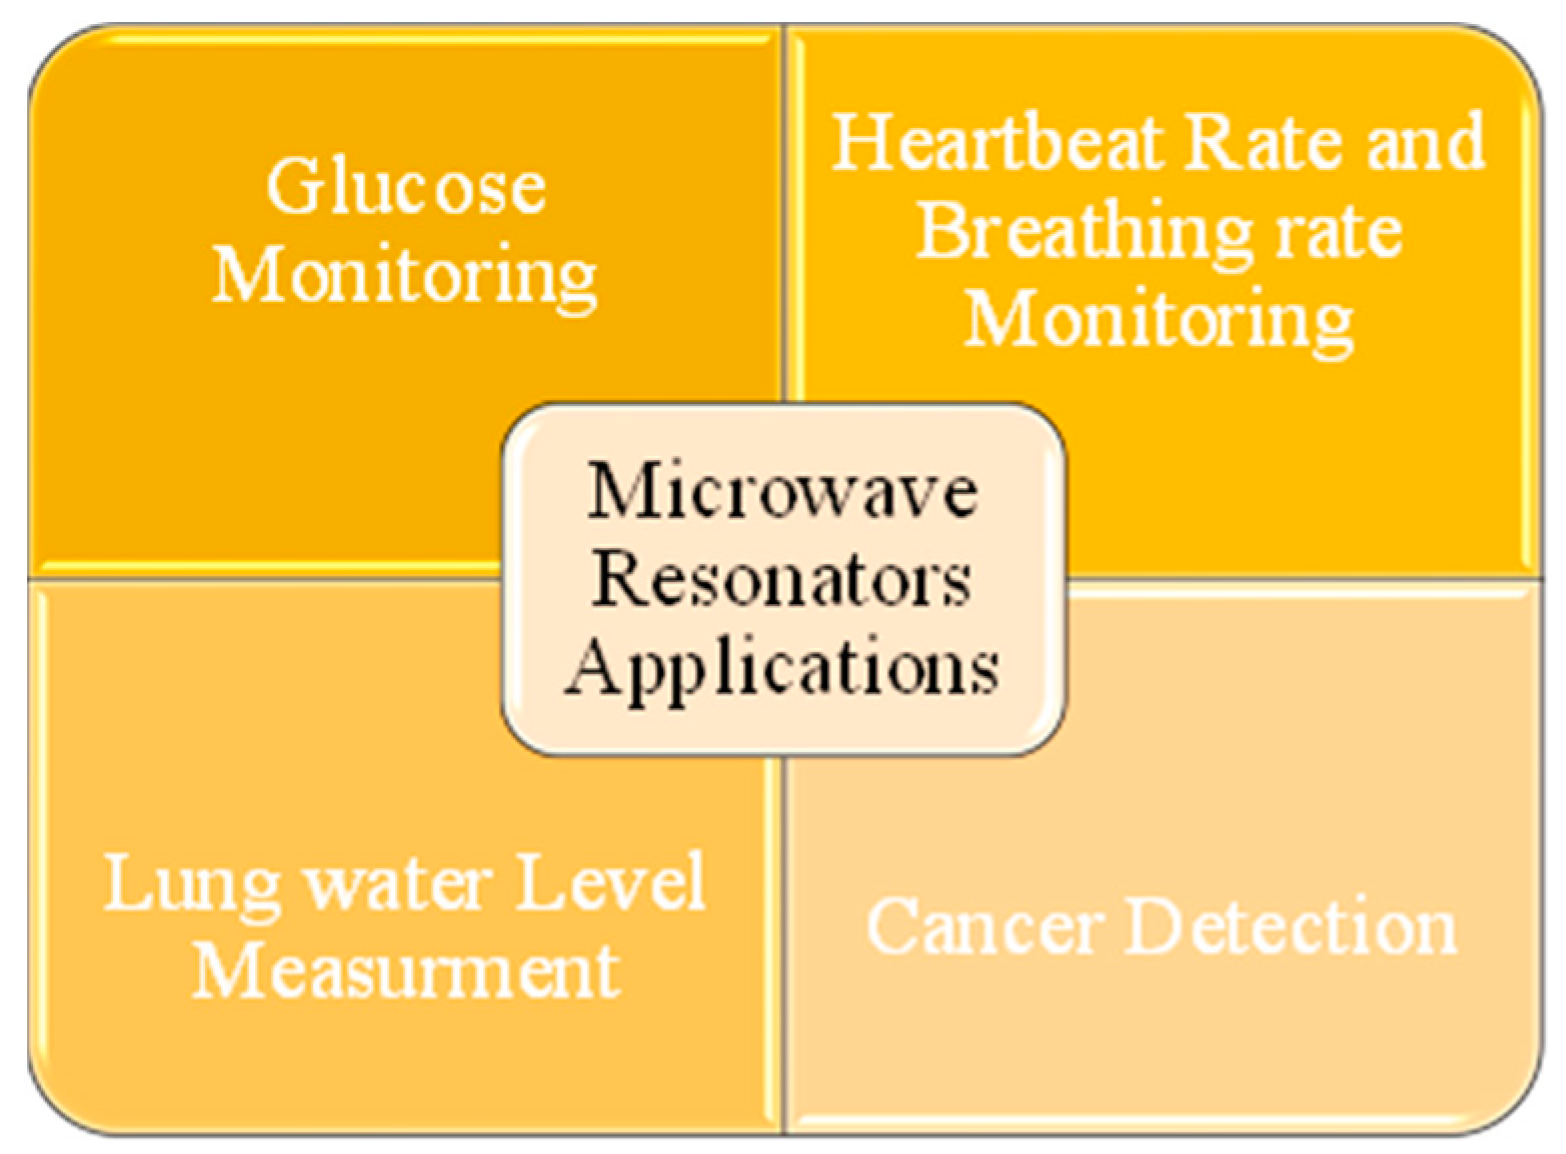
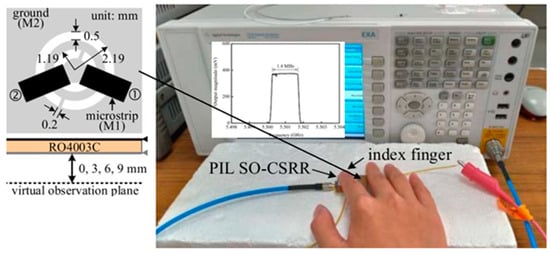
Figure 3.
Vital signs detection using microwave phased and perturbation injection-locked (PPIL) sensor with a self-oscillating and complementary split-ring resonator (SO-CSRR) that operates at 5.71 GHz [13].
Figure 3.
Vital signs detection using microwave phased and perturbation injection-locked (PPIL) sensor with a self-oscillating and complementary split-ring resonator (SO-CSRR) that operates at 5.71 GHz [13].
2.1.2. Antenna
Antennas play a crucial role in vital signs detection, offering diverse options to capture physiological signals. Contact antennas, particularly wearable ones, provide a direct interface with the body, enabling the keeping an eye on crucial indicators including heart and breathing rates. These antennas, integrated into wearable devices, ensure continuous and unobtrusive monitoring. On the other hand, contactless antennas operate without direct skin contact, making them suitable for non-intrusive vital signs detection. These antennas are often deployed in environments where contact-based monitoring may be impractical or uncomfortable. Both contact and contactless antenna technologies contribute significantly to advancing healthcare by providing flexible options for vital signs monitoring tailored to individual preferences and specific medical contexts.
In recent decades, there has been a substantial surge in the request for wearable systems, which have found diverse applications in our daily lives. Wearable technology is no longer limited to wristwatches, fitness bands, or eyewear; it now has a wide range of medical applications. The use of wearable technology in the medical industry to track vital signs and other critical patient health metrics is growing quickly. Wearable health monitoring devices are becoming increasingly popular due to their non-invasive diagnostic capabilities for essential bodily functions. However, creating antennas that can be seamlessly integrated into clothing poses several design challenges, as shown in Figure 4. Creating wearable antennas presents a series of design challenges as they must blend seamlessly with clothing, remain flexible, and maintain optimal functionality even in close proximity to human beings. Designing antennas that can be worn can be difficult due to various factors, including limited space on specific body locations, the impact of the dielectric characteristics of human tissue, as well as performance deterioration induced by deformation of the structure. These considerations must be factored in during the design phase. The future potential of wearable electronics is being investigated, with a particular emphasis on recent improvements in healthcare applications using wearable antennas (as depicted in Figure 5, along with an examination of their current obstacles and limitations). Ref. [14] outlined a microwave-based method and related measuring tool for tracking changes in lung water content and multiple vital signs (VS).
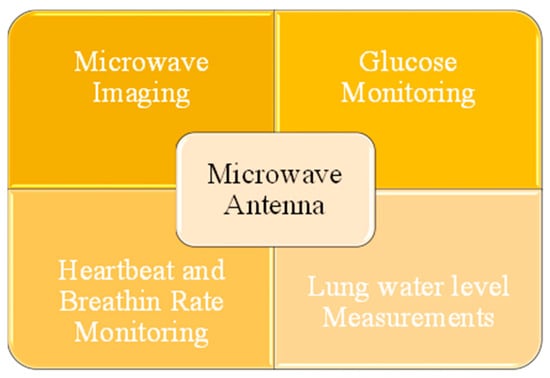
Figure 4.
Applications of antenna-based technique.
Figure 4.
Applications of antenna-based technique.
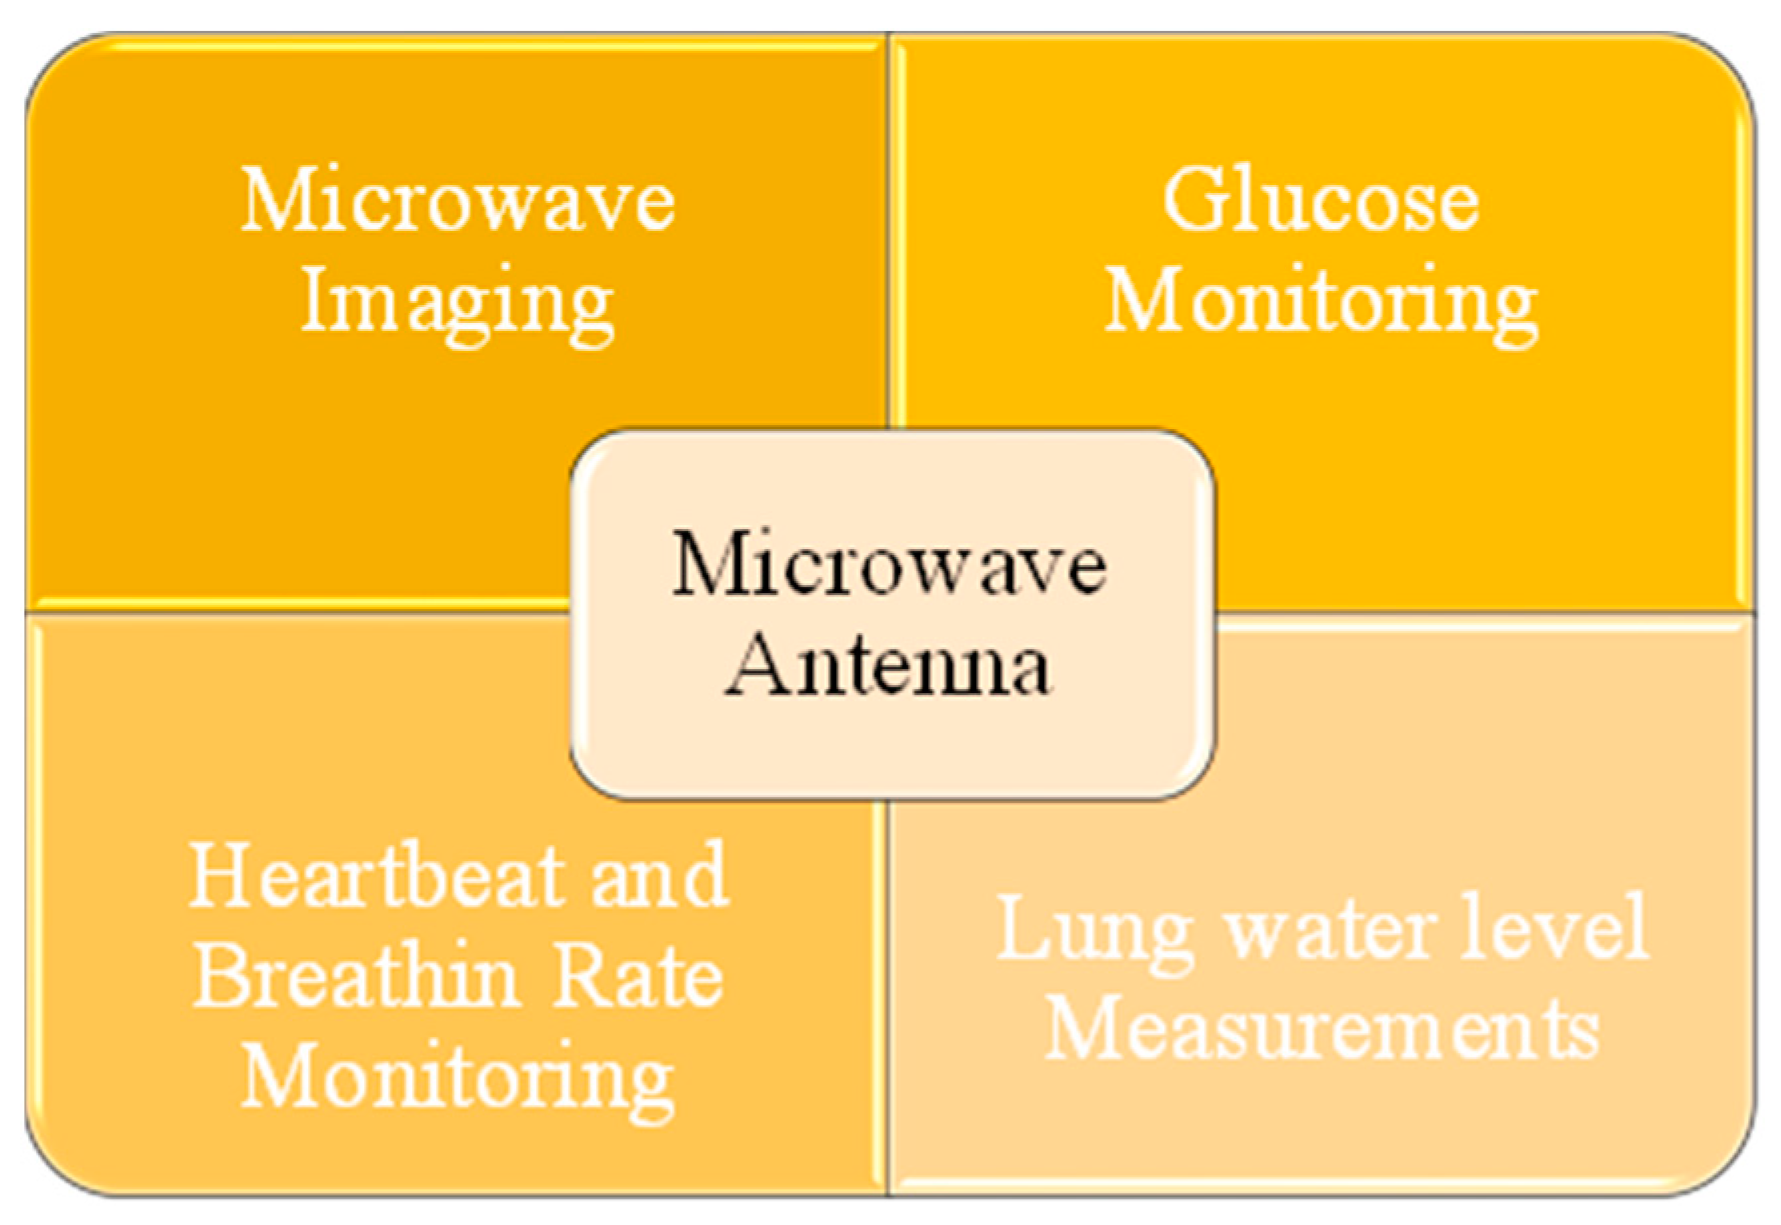
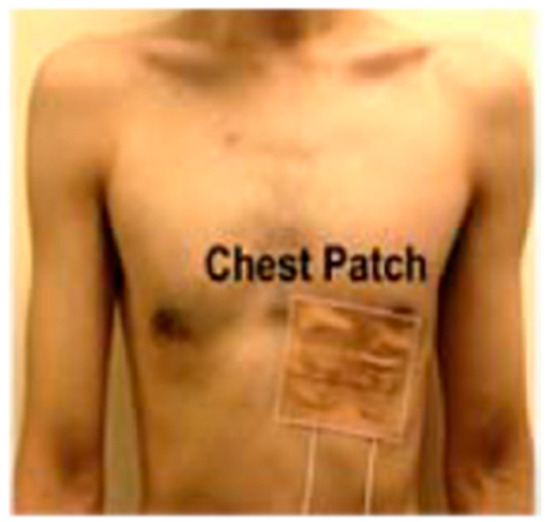
Figure 5.
Two couplers constructed with the conductive textiles placed side by side on a human body [14].
Figure 5.
Two couplers constructed with the conductive textiles placed side by side on a human body [14].
2.2. Vital Signs Detection Methods
Methods for detecting vital signs encompass a range of techniques and approaches used to identify and measure essential physiological characteristics such as blood pressure, oxygen saturation, body temperature, heart rate, and respiration rate. These methods typically involve the application of specific instruments or technologies to monitor and assess vital signs for medical purposes, diagnosis, and general health monitoring. In this subsection, we will explore several prominent approaches that involve direct contact and contactless methods to measure human respiratory and cardiac rates.
2.2.1. Traditional Contact-Based Vital Signs Collection
This subsection provides insights into the underlying principles of these methods and sheds light on their limitations. The contact-based techniques discussed here encompass electrocardiography, photoplethysmography, blood pressure, airflow, sound-based, and mechanical displacement sensors on the chest wall. All of these techniques are explored in more detail in the parts that follow.
- (a)
- Electrocardiography (ECG)
Electrocardiography, is a method for capturing the heart’s electrical activity produced by its rhythmic contractions. In this process, the electrical potential difference between a minimum of two locations on the patient’s body surface is detected [15]. The resulting signal is referred to as an electrocardiogram (ECG). ECG monitoring systems play a vital role in diagnosing heart conditions like arrhythmia and myocardial ischemia [16]. ECG devices can be used to estimate the breathing rate from ECG data, even though they are primarily used to monitor cardiac signals [17]. This process, known as ECG-derived respiration (EDR), is predicated on sinus arrhythmia [18]. Twelve-lead clinical ECG systems and portable ambulatory ECG systems are the two categories of ECG systems.
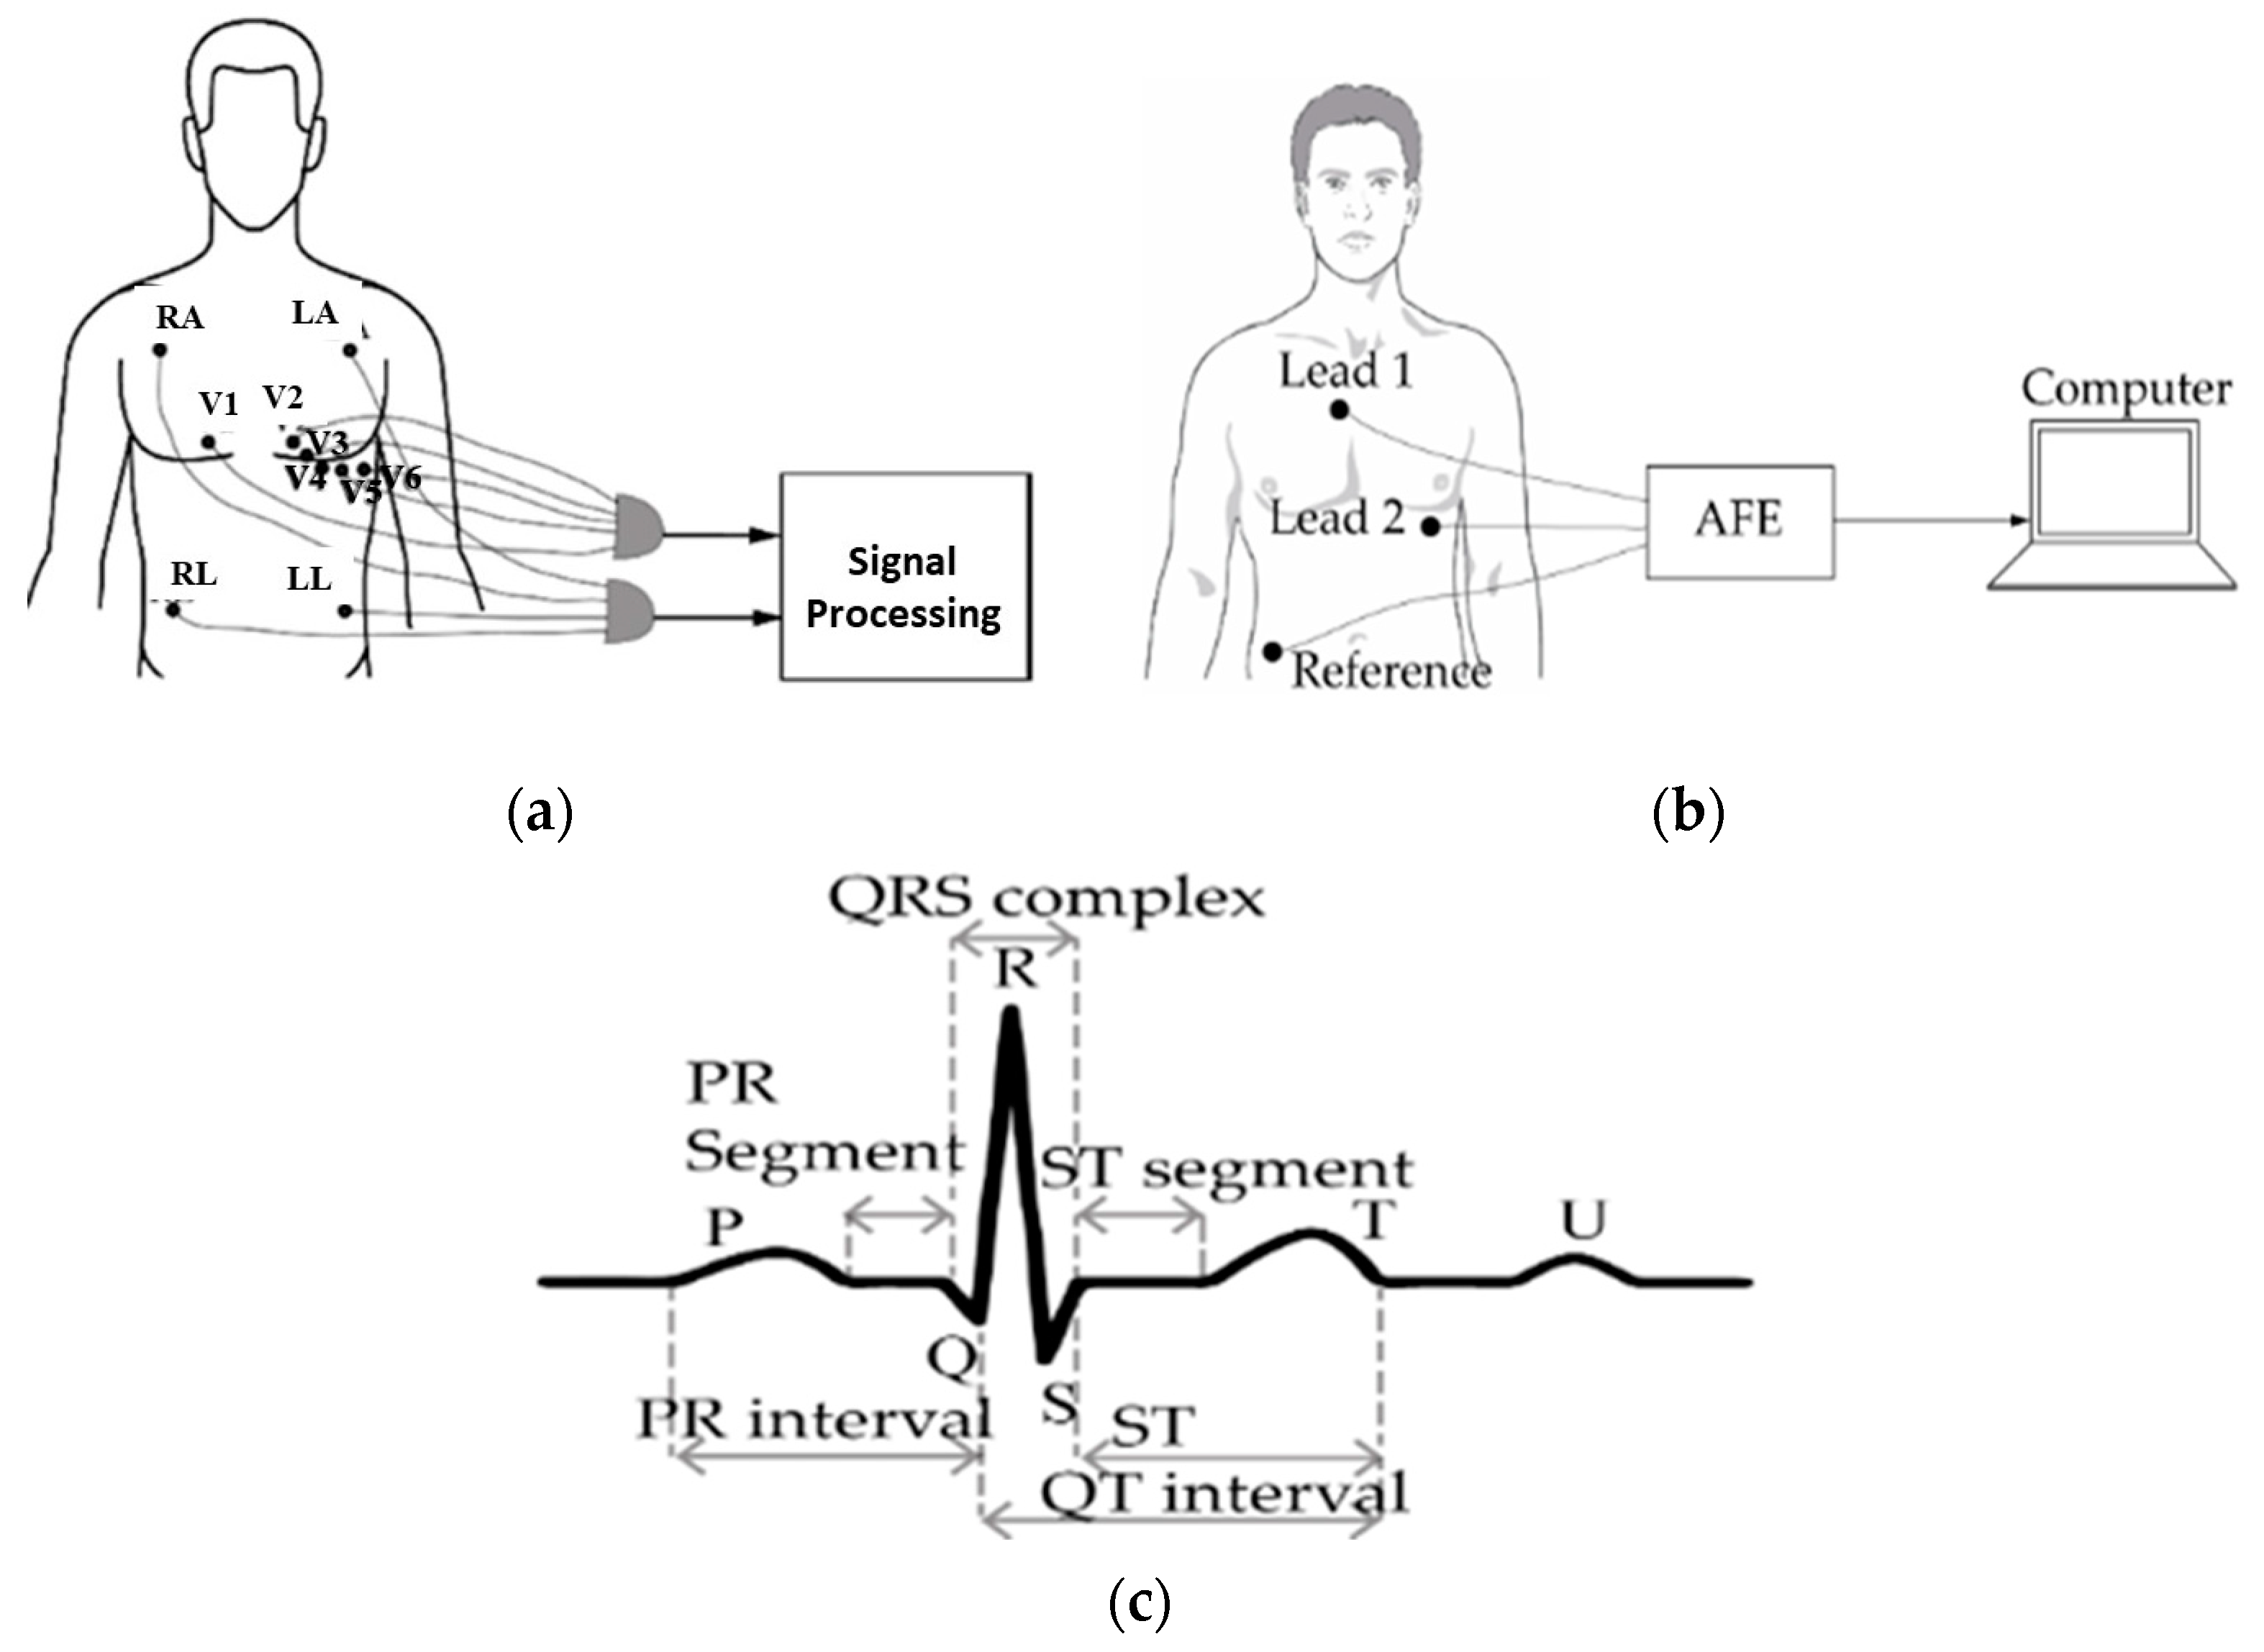
Ten electrodes are affixed to the patient’s limbs and chest using the 12-lead ECG method, producing twelve sets of signals [19] (see Figure 6a). Right arm (RA) and left arm (LA) electrodes are commonly put on the patient’s wrist or upper chest area. Electrodes RL (right leg) and LL (left leg) are placed on the leg or lower abdominal region, respectively. The information gathered from these leads is analyzed by a processer and shown on a screen. Traditionally, a signal processing unit is directly connected to the ECG. Modern clinical ECGs, on the other hand, are equipped with Bluetooth or ZigBee, excluding the necessity for physical cords [20].
However, there is still a barrier in the form of the requirement to adhere electrodes to the patient’s skin. Although a portable ambulatory ECG system is less precise at reading cardiac signals than a 12-lead ECG system, the latter’s practical application outside of clinical settings is limited by its large bulk and multiple electrode and sensor requirements. Moreover, even though basic clinical ECG devices are inexpensive, they require the expertise of a competent operator. Conversely, ambulatory ECG devices are often smaller and feature three or fewer leads, as Figure 6b illustrates. An analogue front-end (AFE) unit filters and amplifies the electrode-captured biopotential signals before sending them to a digital signal processing (DSP) unit for processing. Unlike standard clinical ECG systems, this kind of ECG equipment is suitable for use in the home [21].
Ambulatory ECG devices that are small and energy-efficient can be created [22,23], but they may offer lower accuracy in comparison to clinical ECG systems. Figure 6c displays a typical ECG waveform, where the P wave represents the sequential activation of the right and left atria. T and U waves depict ventricular repolarization and interventricular septum repolarization, respectively. The QRS complex, which includes the ‘Q’ wave, ‘R’ wave, and ‘S’ wave, indicates that the right and left ventricles are active at the same time [24].

Figure 6.
(a) Clinical electrocardiogram (ECG) device with 12 leads; (b) portable ECG equipment; and (c) depiction of the ECG signal [24].
Figure 6.
(a) Clinical electrocardiogram (ECG) device with 12 leads; (b) portable ECG equipment; and (c) depiction of the ECG signal [24].
Conventional ECG systems use hydrogel between the electrode’s surface and the skin’s surface to improve the system’s response [21]. However, these conductive gels, though effective, can lead to skin irritation in patients due to their toxic properties [25]. Additionally, the acrylic glue used in disposable conductive hydrogel-based ECG electrodes may cause allergies in certain patients [26,27]. Consequently, the usage of moist electrodes is inappropriate. for extended and frequent patient monitoring. Various newly designed ECG systems now use dry capacitive electrodes instead of wet capacitive electrodes [18,21,28,29].
Unlike its wet electrode predecessor, the dry electrode sensor does not need an intermediary substance, which makes it better suited for prolonged monitoring durations. Nevertheless, because they have less skin contact, dry electrodes have a greater electrode tissue impedance (ETI) and are more prone to motion artefacts [20]. Furthermore, maintaining the proper electrode location is essential to getting precise readings [30,31]. Moreover, respiration-related variations in electrode impedance that result in amplitude modulation of the ECG data and motion artefacts (MA) from electrode leads are additional factors impacting the accuracy of ECG signals [32,33]. The ECG signal undergoes frequency modulation during the inhalation and exhalation phases of respiration, which raises and lowers the heart rate, respectively, and can be utilized to detect heartbeats [34]. The gold standard for determining heart rate as well as its variability is thought to be a clinical ECG device. But they are expensive and heavy. Photoplethysmography is a more economical way to take vital signs; it is covered in the section that follows.
- (b)
- Photoplethysmography
Using optical techniques, photoplethysmography is a technology that measures changes in human tissue volume instantaneously [35]. Photoplethysmogram (PPG) is the term used to describe the time-varying signal produced by photoplethysmography. The green and yellow regions of the spectrum, which span from 500 to 600 nm, are often produced by at least one light-emitting diode (LED) that is in close proximity to the tissue [36,37]. A frequent method for acquiring heart rate (HR) uses a green light. For blood oxygen monitoring, however, a lot of photoplethysmography systems take advantage of the infrared and red optical regions [38,39,40]. A component of the light is absorbed and a portion is reflected when it interacts with human tissue. Throughout the systolic and diastolic phases of the cardiac cycle, the intensity of the incoming light changes, and a photodetector (PD) is employed to collect this information [37].
The photodetector (PD) can be placed on the same side as the light emitter or on the opposite side, depending on whether the acquisition is in reflectance mode or transmission mode [41]. Because body tissue greatly attenuates light in the lower optical wavelength area, PPG systems that use the green–yellow wavelength regions are often more suited for reflectance-mode operations. In contrast, optical signals that are red or infrared are better transmitted via transmission mode. Transmission mode is more efficient in obtaining accurate blood oxygen readings, but there is not much of a difference between these two approaches in the precision of heart rate and heart rate variability measurements. Transmission mode is used in pulse oximetry because it produces fewer noticeable venous oscillations, which raises the signal-to-noise ratio (SNR) of the obtained signal [42].
As seen in Figure 7a, the subject’s finger or other outlying regions, such as their ears or toes, can be used to attach the oximeter probe sensor. Since light’s wavelength and penetration depth are correlated, infrared (IR) light is used to measure blood flow in deeper tissues. Prior to wireless transmission or cable transmission to a computer for signal processing, an analogue front-end is utilized to raise the quality of the signal. As seen in Figure 7b, the arteries exhibit the greatest change in blood volume. Furthermore, because breathing modifies the received signal in both amplitude and frequency, from the PPG data, the breathing rate can be inferred [34,41]. Nonetheless, the PPG signal is mostly utilized for blood oxygen saturation and heart rate estimation.

Figure 7.
(a) Setting up a photoplethysmogram (PPG) measurement; (b) light’s influence on the body’s various tissues [37]; and (c) an explanation of the PPG waveform.
It is important to remember that respiratory cycles may result in DC offset or baseline drift. Because reflectance mode is more susceptible to variations in venous pressure when breathing, it is frequently used to estimate the breathing rate [41]. Figure 7c is a typical PPG waveform that amply demonstrates both the pulsatile components of the heartbeat and the modulation brought on by breathing. Although photoplethysmography (PPG) systems are inexpensive, a number of factors, including the measurement site, the surrounding temperature, and the subject’s location, frequently influence the signals that they produce [35,37,43]. Moreover, subject motion artefacts may jeopardise the raw PPG signal’s correctness [43]. The use of a camera—which can be a laptop or mobile camera—has been essential to recent advancements in PPG remote monitoring [24,44,45,46]. This technique, called video plethysmography (VPG), uses ambient light as the light source and the camera as a photodetector [32]. Variations in blood volume and pulse are captured using the ambient optical conditions.
- (c)
- Methods Based on Temperature, Humidity, and Air Components
The temperature, humidity, and carbon dioxide (CO2) content of the air that is inhaled and exhaled can be used to calculate the rate at which humans breathe.
- ➢
- Air Components-Based Technique
As we breathe in and out, the air’s concentration of carbon dioxide (CO2) varies. Carbon dioxide is typically found in exhaled air at a concentration of around 6% and inhaled air at a concentration of about 0.04% [34]. By measuring the breathing rate with chemical sensors, this variation in CO2 concentrations is found. The primary sensors commonly employed for this task are infrared and fibre-optic, with the former being more widely applied. Capnography is the word for the technique used to calculate an individual’s breathing rate using differences in CO2 levels in exhaled and inhaled air. The main components of a capnography system are a CO2 sensor, a tube for gas samples, and a device for signal processing and acquisition.
Figure 8a,b show the configurations used to measure CO2 levels. The mainstream approach and the side stream method are the two major ways to set up capnography [24]. The primary processing units and the sensor are positioned independently of the subject in the side stream measuring technique. Figure 8b illustrates how the mainstream chemical sensor, in contrast, is positioned between the endotracheal tube and the processing unit, which is fastened to the subject’s face. Compared to the side stream method, the mainstream acquisition methodology is faster and more precise. It is more expensive, though, because its sensor has a maximum temperature of 40 degrees Celsius. A capnogram is the waveform derived from capnography.
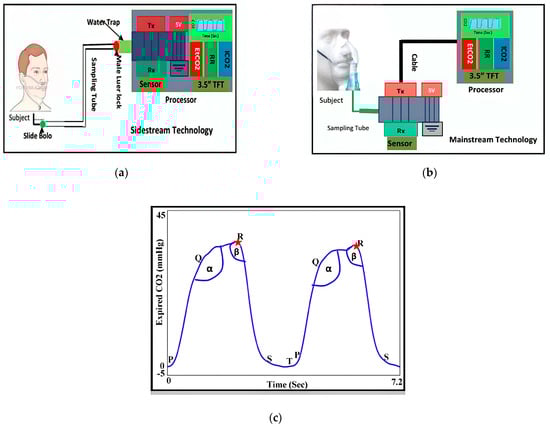
Figure 8.
Techniques for measuring CO2 include: (a) mainstream; (b) side stream; and (c) a description of a capnogram [47].
As Figure 8c illustrates, the inspiration, alveolar, and expiration phases are the three independent phases that make up a standard capnogram. The latency phase is denoted by ST, whereas PQ, QR, and RS stand for expiration, alveolar, and start of inspiration, respectively. The transitions between each of these phases are represented by the angles α and ß [47].
Yet, breath rate measurement using capnography can be uncomfortable for prolonged monitoring and is susceptible to changes in other gas components, humidity, and temperature in the surrounding environment, even though it is resistant to motion artefacts from the individual [36]. Furthermore, the subject’s skin may be harmed by the sensor’s heating to approximately 40 °C [44,45].
The use of capnography for respiratory rate measurement can be uncomfortable for long-term monitoring due to its sensitivity to changes in temperature, humidity, and other gas components, even if it is resistant to subject motion artefacts [36].
- ➢
- Air Temperature-Based Technique
A variety of transducers can be utilized to convert the airflow’s temperature into an electrical signal, which can then be used to estimate the breath rate depending on the temperature difference between the air being breathed and exhaled [48]. Some examples of these transducers are thermocouples, pyroelectric sensors, fibre-optic sensors, and thermo resistors.
Resistors that exhibit nonlinear temperature variation in resistance are known as thermos witches [49]. Thermocouples are thermoelectric sensors that, in accordance with the Seebeck effect, provide a voltage signal when two conductors’ temperatures differ [50]. Thermistors and thermocouples can be used for accurate and reasonably priced breath rate detection.
Conversely, pyroelectric sensors work by creating an electric current when exhaled air heats the sensor contact [51]. These sensors can be incorporated into a face mask or earphone for the purpose of breath monitoring [52]. The performance of pyroelectric sensors is similar to that of thermocouples and thermistors when used for measuring the breath rate.
Moreover, fibre-optic sensors are used in a few recent investigations for this purpose [53,54]. The Bragg wavelength shift caused by temperature variations in the airflow is what these sensors rely on. Despite costing more than thermistors, fibre-optic sensors respond more quickly. However, because of their large size, their use is usually restricted to clinical settings.
The response of a typical respiratory rate monitoring system based on air temperature and using thermistor sensors is shown in Figure 9b. It represents the variations in airflow temperature during breathing and looks like a sine wave. Systems for detecting breath rate based on changes in air temperature are typically less complicated and more affordable. They do not, however, provide heart rate information and are mainly appropriate for simple breath rate detection.
- ➢
- Air Humidity-Based Technique
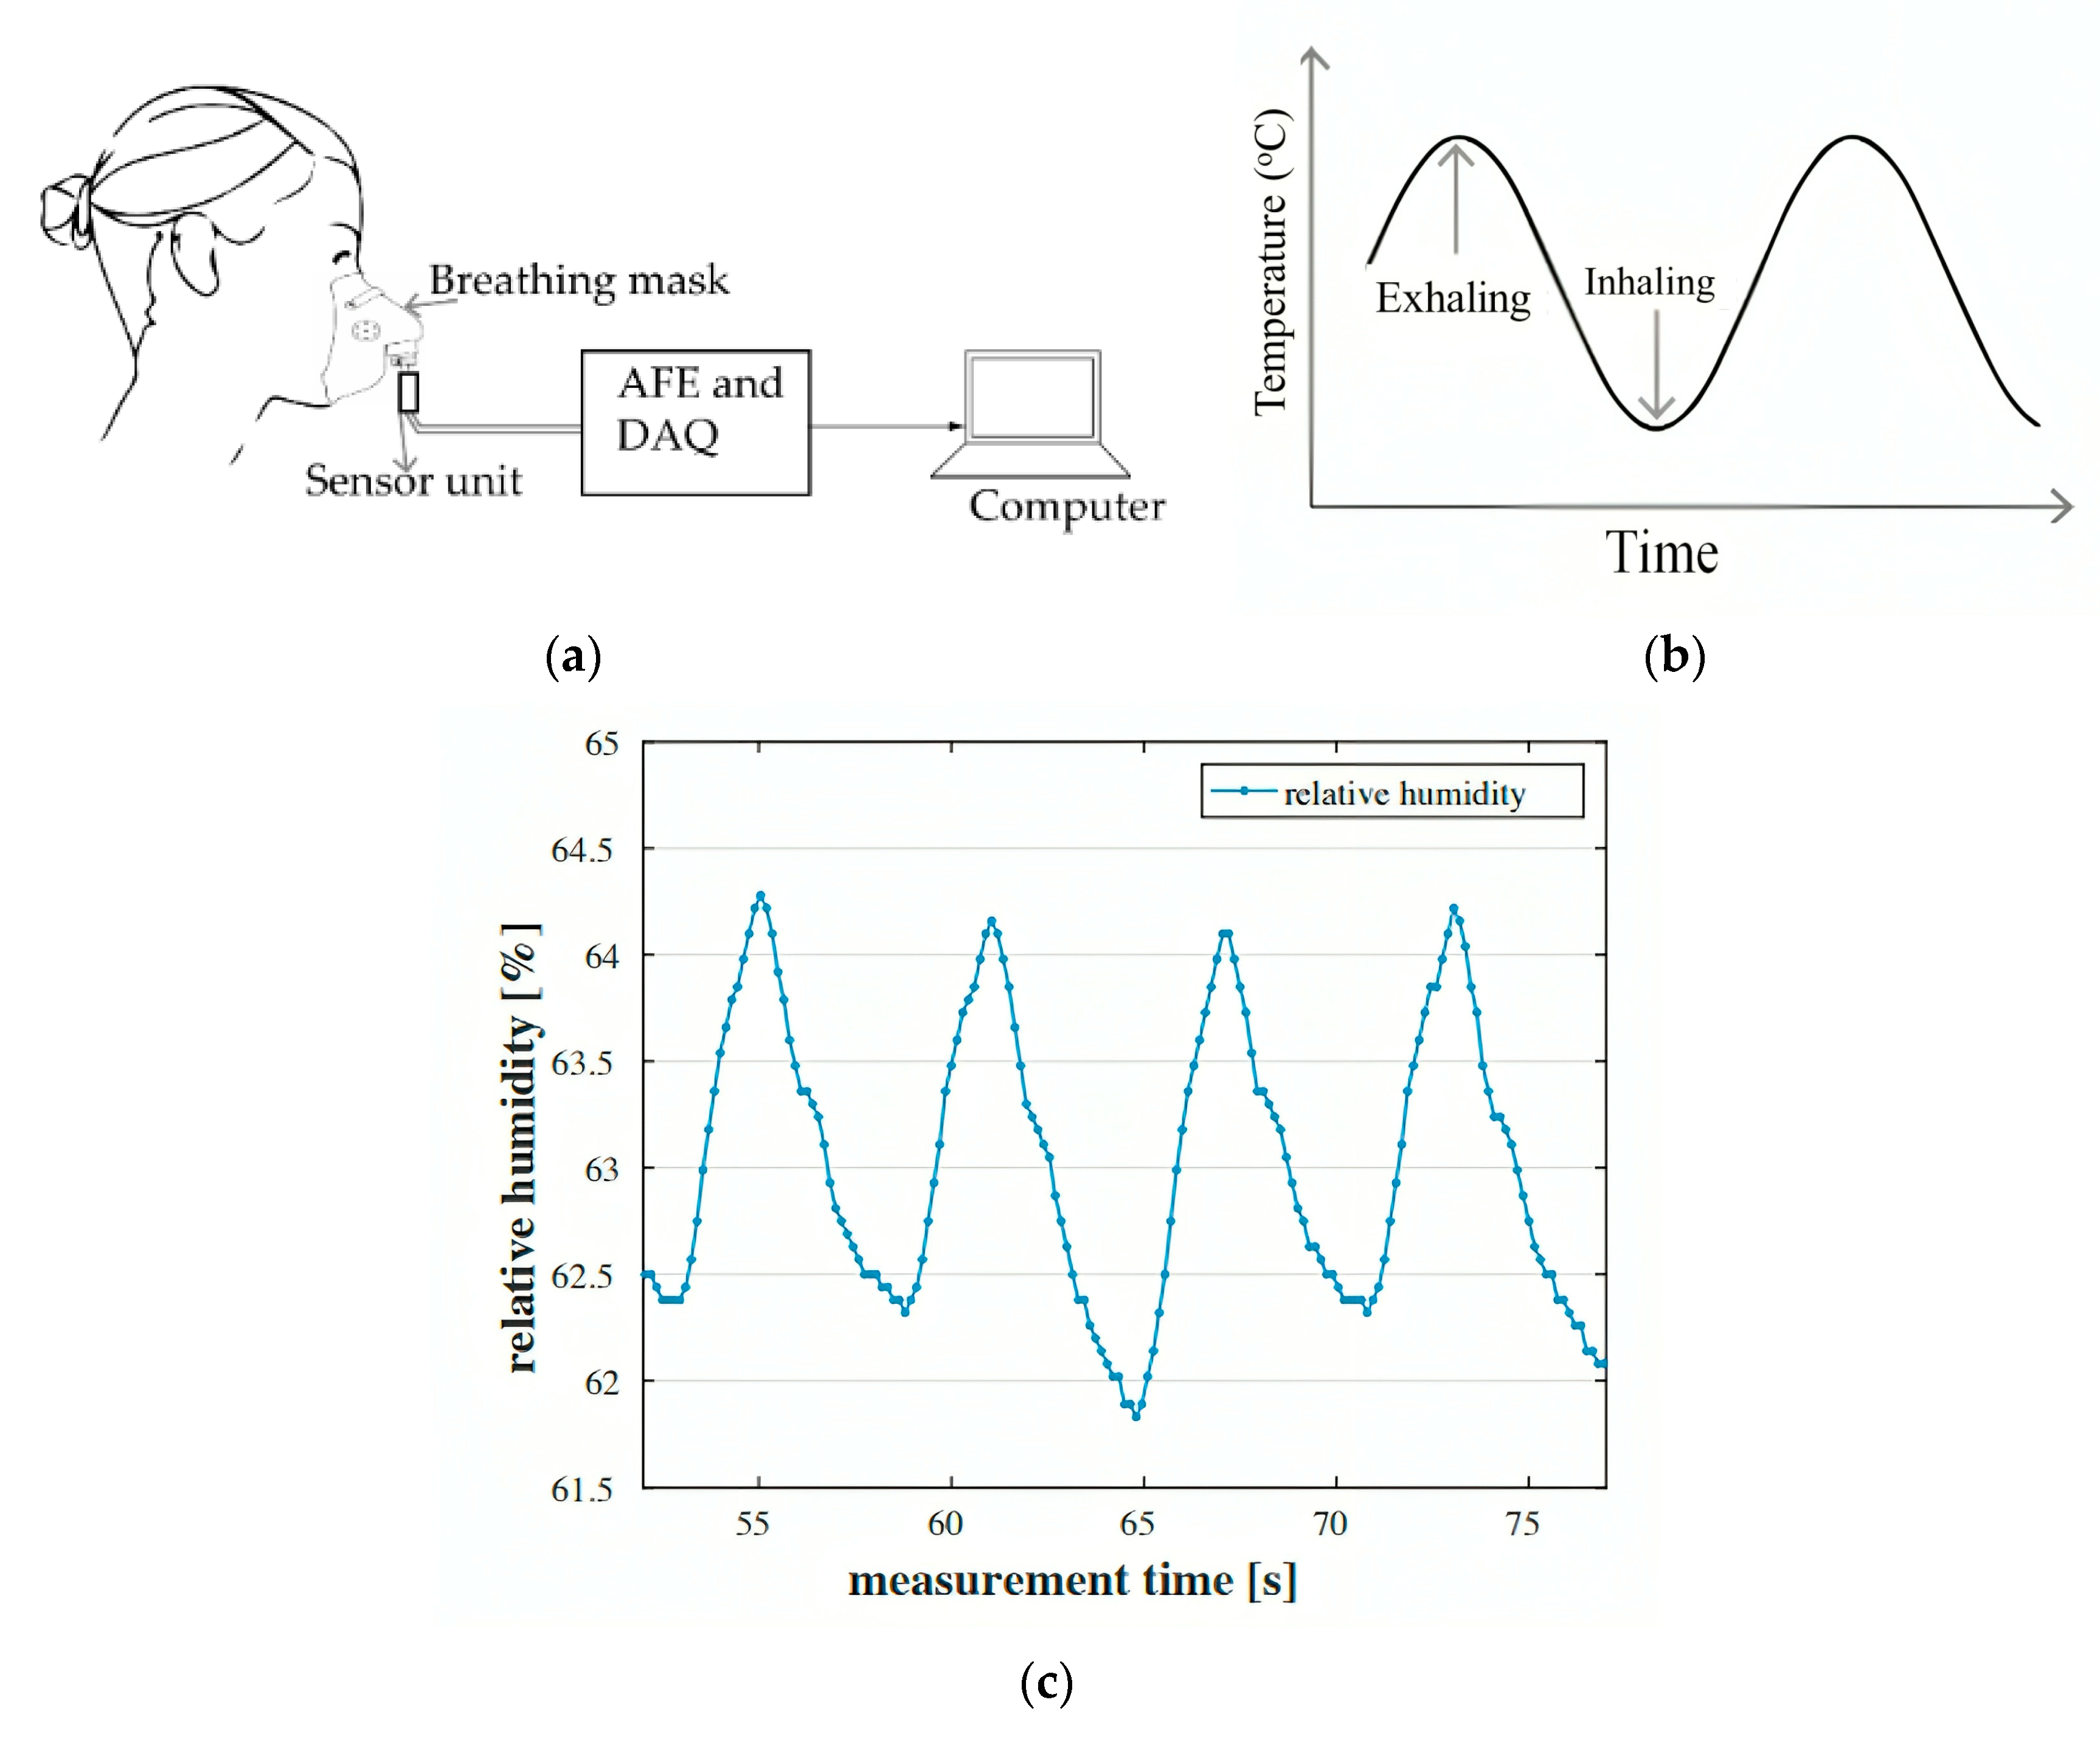
Analysing the amount of water vapour ingested and in exhaled air can also be used to determine breath rate; this method is comparable to the capnography technique that was previously covered. Inhaled air has a relative humidity that is usually 20% to 60% different from exhaled air [54]. The instantaneous respiration pattern can be determined by detecting and charting this difference in humidity. Figure 9a depicts a general overview of breath rate detection devices based on air humidity. Here, the sensor being used is a humidity sensor, which might be capacitive or resistive. When subjected to humidity, both types of sensors show changes in resistance and capacitance values, respectively. It is possible to quantify these changes in capacitance or resistance and link them to air intake and exhalation. Furthermore, different kinds of sensors can be used as humidity sensors, including those that make use of nanoparticles [55], nanocomposites [56], fibre Bragg gratings (FBG) [57], and surface acoustic waves (SAW) [58]. Nevertheless, the response times of monitoring systems that use nanoparticles and nanocomposites are typically slower [56]. The human subject’s immediate shift in breath air humidity is shown in Figure 9c, which was taken from a reference [59].
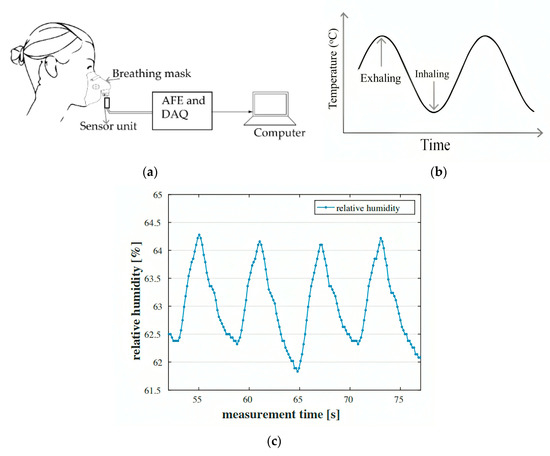
Figure 9.
(a) Basic configuration of airflow-based breathing system for monitoring vital indicators; (b) thermistor sensor time reaction for the acquisition of breath rate (BR); and (c) changes in humidity over time [59].
Figure 9.
(a) Basic configuration of airflow-based breathing system for monitoring vital indicators; (b) thermistor sensor time reaction for the acquisition of breath rate (BR); and (c) changes in humidity over time [59].
Systems for measuring breath rate using humidity sensors, like the previously discussed systems for detecting and monitoring vital signs based on air, frequently demand that the participant use a tube around their nose or wear a face mask to prevent motion artefacts from interfering with the respiration signal. Nonetheless, chest displacement sensing vital sign measurement devices are able to be non-intrusive and still yield good accuracy, as we demonstrated in the following subsection.
2.2.2. Chest-Wall Mechanical Displacement Sensing Methods
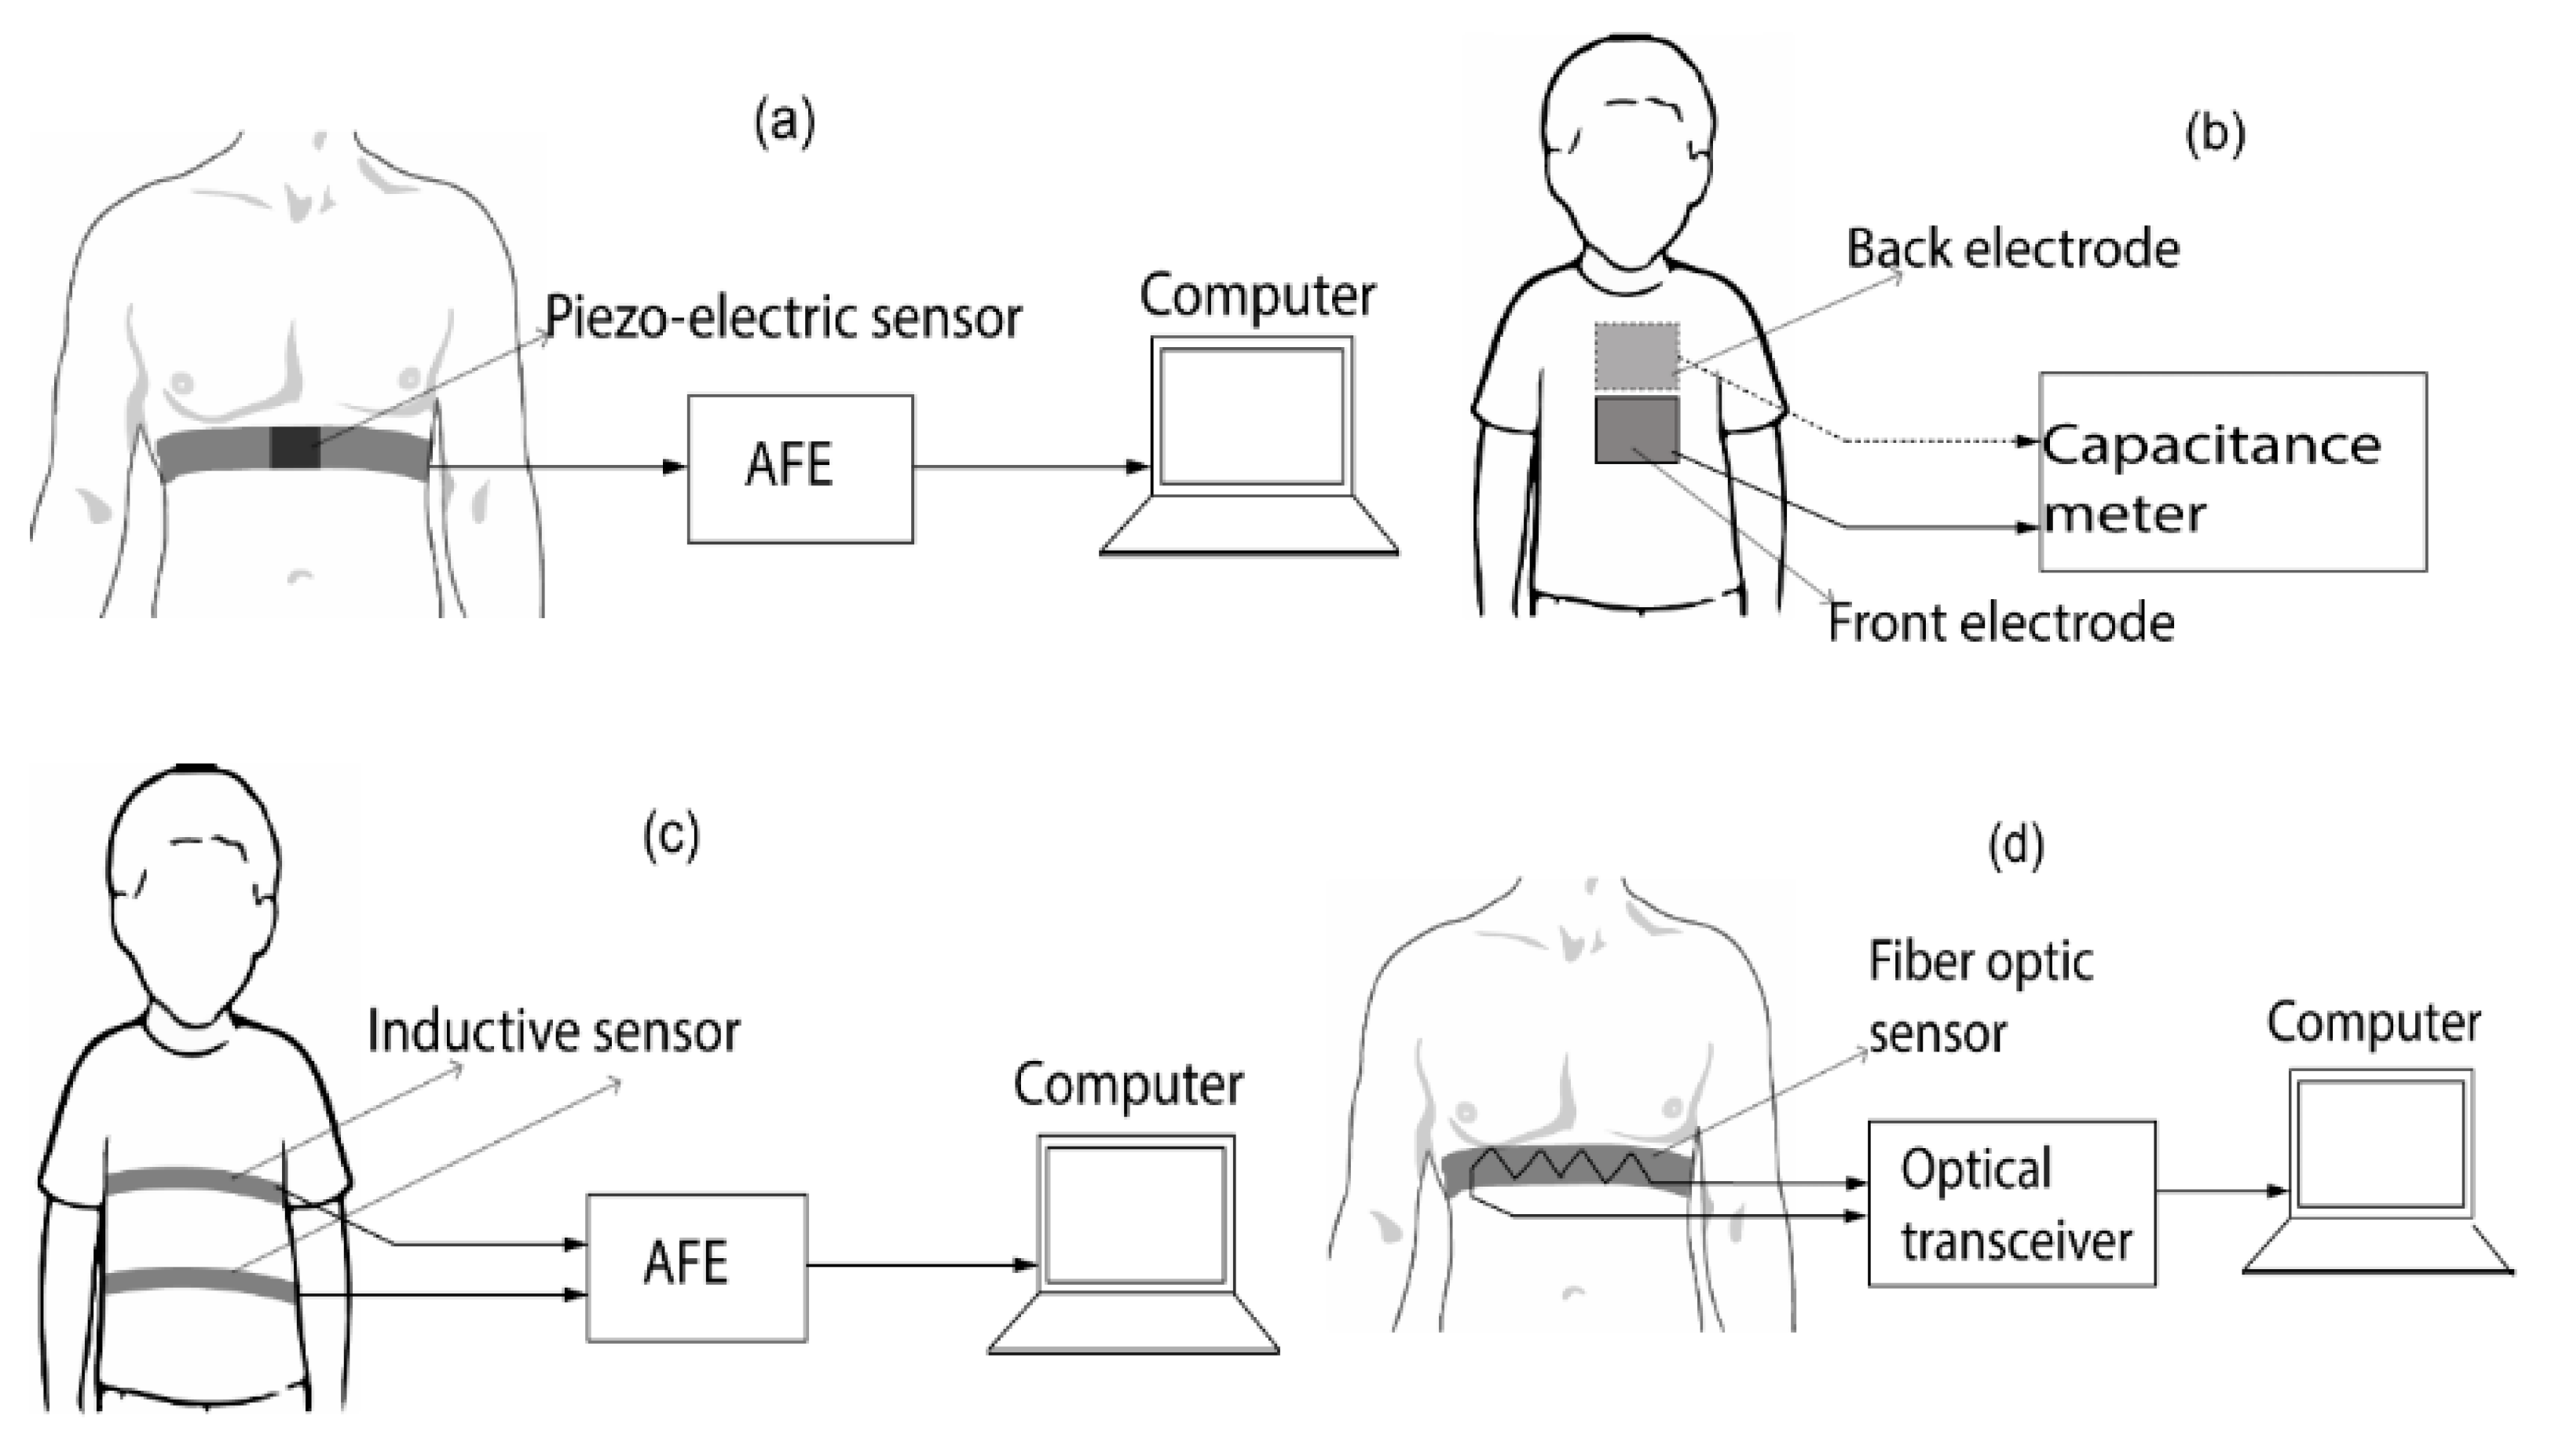
By observing the heart and lungs’ physical or mechanical activity at the body’s surface, one can quantify the heart rate and breath of an individual. The diaphragm expands and contracts with the intercostal muscles during normal human breathing, letting air come in and go out of the lungs more easily. The chest can expand by as much as 7.37 cm circumferentially as a consequence of the respiratory muscles’ and diaphragm’s muscular activity [60]. The actual motion of the chest can be detected using a variety of sensor types. Nonetheless, accelerometers, gyroscopes, magnetometers, strain sensing, transthoracic impedance sensing (impedance pneumography), and movement sensing are the most widely used techniques for determining chest-wall displacement. To detect sudden variations in strain, the strain-sensing technique makes use of a variety of sensors, such as fibre-optic, inductive, capacitive, and resistive sensors. Elements used in piezo-resistive strain sensors change shape in response to physical displacement. Their resistance values are altered as a result of this shape change, and these resistance values are then measured via an electrical circuit, as seen in Figure 10a. “Strain gauges” is a common term used to describe the strain-sensing components used in piezo-resistive sensors [61]. These strain gauges can be constructed from textiles that have a conducting element implanted or coated [62,63].
Capacitive strain sensors use two independent electrodes around the subject’s belly that are placed opposite to one another, as seen in Figure 10b. A capacitance parameter is used to measure the capacitance between these two electrodes [64]. The values of capacitance for both electrodes varies as a result of the subject’s inhaling and exhalation since the capacitance is dependent on the dielectric material’s permittivity between the electrodes and their distance apart. This shift happens as the permittivity is changed by the lung air, and the distance between the electrodes is changed by the thoracic expansion and contraction. While the electrodes can be flexibly attached to the human body, securely attached electrodes offer superior noise and sensitivity performance [65]. Monitoring the variation in alternating current in a magnetic coil while breathing can also be used to estimate the respiratory rate [66].
As seen in Figure 10c, respiratory inductive plethysmography (RIP) uses the alternating current fluctuation in a magnetic coil affixed to the subject’s thorax or belly to determine the subject’s breathing pattern. The magnetic coil’s inductance value and, consequently, the alternating current flowing through it, can both be monitored when the coil’s volume changes during respiration. Positive outcomes have been shown when sleep apnea is monitored with RIP systems [67,68]. Nevertheless, the breath signal’s dependability could be impacted by motion artefacts coming from the subject’s thorax [66].
Finally, as Figure 10d illustrates, fibre-optic sensors can function as strain-based respiration sensors. Textiles can contain embedded fibre Bragg grating (FBG) sensors [69,70]. In comparison to their resistive, capacitive, and inductive equivalents, these sensors have better sensitivity and faster response times. They are useful in the detection of heartbeat signals because of their increased sensitivity to minute mechanical motions [71]. In order to monitor human respiration and identify disorders connected to breathing, smart textiles are widely used in the literature for strain-based respiration sensing [72,73,74,75].
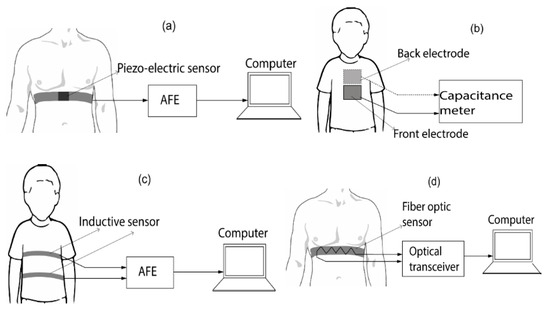
Figure 10.
Breath rate sensing techniques based on strain: (a) resisted detection, (b) capacitive perception, (c) inductive sense and (d) fiber-optic detection [71].
Figure 10.
Breath rate sensing techniques based on strain: (a) resisted detection, (b) capacitive perception, (c) inductive sense and (d) fiber-optic detection [71].
The measurement of the thoracic impedance, which is correlated with lung volume, is known as impedance pneumography. The impedance pneumography measurement setup is shown in Figure 11a. Using electrodes on the subject’s chest, an alternating current (AC) is administered via the skin in this configuration, and the voltage difference between these electrodes is then monitored [76]. The injected current and the thoracic impedance have a direct bearing on this voltage differential. Systems can be configured with two or four electrodes; the use of four electrodes often yields higher accuracy [76].

Figure 11.
(a) Impedance pneumography setup. (b) Breath rate capture using a 3D movement sensor configuration [77].
In impedance pneumography systems, the injected current is often less than 1 mA, while the AC frequency is typically high, approximately 50 kHz. Thoracic impedance typically has a value of 500 ohms, yet this number fluctuates during breathing. Techniques for measuring transthoracic impedance have been effective in tracking heart rate during exercise [77], diagnosing childhood pneumonia [78], and monitoring sleep apnea [78,79]. Impedance pneumography devices have been shown to provide precise breath rate acquisition without requiring the person to have sensors firmly attached to their body; nevertheless, these systems are prone to noise resulting from motion artefacts (MA).
The respiratory rate can also be monitored by measuring the abdomen’s acceleration, angular velocity, and magnetic field strength during breathing. The abdomen’s mechanical movement is translated into an electrical signal by means of an accelerometer. The accelerometer’s inertial response is matched by the thoracic motion. Breathing patterns can be recorded by attaching this electromechanical device to the upper thorax [80,81]. Compared to single or dual-axis accelerometers, triaxial accelerometers have shown more reliable measurement findings in a range of body positions [82]. Accelerometer-based breath monitoring has received little investigation [82,83], yet it is known that this kind of technology has more measurement errors when exercising and walking. Furthermore, breath rate can be estimated using micro-electromechanical system (MEMS) gyroscopes, which measure the angular motion of the thorax during respiration. To learn about the operation of gyroscopes, see [84]. Breath rate detection problems can result from drifts in the three-dimensional (3D) position of gyroscopes, which are only able to detect rotational motions of the thorax [85]. Because of this, they are frequently combined with accelerometers to produce signals that are more precise [86].
A magnetometer can also be used to measure the strength of the magnetic field surrounding the chest region in order to identify movements linked to breathing activities. One way to measure the variation in the magnetic field is to use a belt to place a magnetometer on the subject’s chest [87] or to place a magnet and a magnetometer on the subject’s back and chest, respectively [88]. On the other hand, using a magnet usually requires less power. Since motion artefacts can severely impair sensor data, magnetometers work best for silent respiration.
As an alternative, a sensor unit that tracks the three-dimensional movement of the thorax can be made by combining a magnetometer, gyroscope, and triaxial accelerometer. This innovative sensor, called the inertial movement unit, has shown to be less sensitive to motion artefacts [89], which allows it to deliver respiration data that is more accurate. Figure 11b shows the standard setup of a respiratory rate monitoring system based on 3D movement detection.
It should be notice that temperature changes, such as those caused by fever, have a profound impact on the |S11| parameter of microwave sensors used for vital signs detection. These changes affect the dielectric properties of body tissues, causing the |S11| values to vary [90]. When the body temperature rises, the dielectric constant and loss factor of the tissues increase, potentially altering the sensor’s resonant frequency and introducing measurement inaccuracies. Additionally, thermal expansion of sensor materials can further shift the resonant frequencies, while increased electronic thermal noise degrades the signal-to-noise ratio (SNR) [91]. To combat these effects, temperature compensation mechanisms and calibration algorithms are essential to ensure accurate monitoring. This ensures that real-time adjustments can be made to maintain the reliability and precision of vital signs detection in varying thermal conditions.
2.2.3. Contactless Vital Signs Monitoring Employing Radar Methods
Radar can accurately measure heart and respiration rates without requiring a contact probe to be affixed to the human body, in contrast to the previously described contact-based vital sign monitoring systems. Radar for detecting vital signs relies on the modulation effect of a radio signal directed at the patient by a transceiver. The patient’s chest-wall displacement, which includes electronic and ambient disturbances as well as the respiratory and cardiac signals, is the reason for this variation. The noise is removed via signal processing to display the subject’s vital signs. Keep in mind that the vital signs radar only needs to emit light when used at short ranges (up to a few meters). For a two-meter range application, the radar’s power transmission often does not go above 12 dBm, which is lower than the typical power released by a smartphone. That is why these radar systems are safe. Depending on the type of signal it transmits, the radar can be categorized as continuous-wave (CW), pulsed, frequency-modulated continuous wave (FMCW), or stepped-frequency continuous wave (SFCW).
- (a)
- Radar with Continuous Waves (CW)
CW radar is commonly utilized due to its ease of usage. A typical radar is comprised of a digital signal processing unit and a transceiver unit coupled to broadcasting and receiving antennas, as seen in Figure 12. Under this setup, the transceiver’s transmitter (Tx) antenna sends a continuous-wave signal—typically a single tone—at the subject’s moving chest. The reflected wave is then picked up by the receiver (Rx) antenna. The received signal is demodulated, and a computer processes it to get information on the subject’s respiration and heart rate.
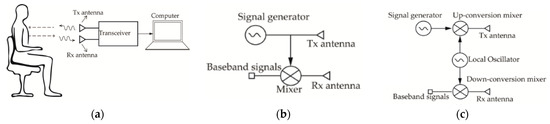
Figure 12.
(a) Doppler block diagram for vital signs. Basic architectures for transceivers: (b) zero intermediate frequency (IF) and (c) heterodyne [89].
CW radar is highly sensitive to small movements, which makes it effective for detecting vital signs such as heart rate and respiration. However, its specificity can be compromised in environments with substantial background motion or electromagnetic interference. This is because CW radar lacks the ability to distinguish between the motion of the target and other movements in the environment, leading to false positives. In cluttered environments, motion artefacts from other sources can interfere with the accuracy of CW radar, reducing its reliability [89].
- (b)
- Radar with frequency modulation continuous wave (FMCW)
FMCW radar systems exhibit a linear variation in frequency over time. This signal type is comprised of a unity signal, also called a chirp, that is created at regular intervals T, as seen in Figure 13. The chirp can be produced by a voltage-controlled oscillator (VCO) fed a linear control voltage or a phase-locked-loop (PLL) with frequency synthesizers [92]. FMCW radar transceiver topologies are similar to CW Doppler radar transceiver systems. However, a direct-conversion technique is frequently used to reduce computing needs [93]. De-chirping is the technique of directly replacing the received signal with a copy of the transmitted signal. The resulting demodulated signal, which is sometimes referred to as the “beat signal”, contains micro-Doppler and range information. The radar data, which includes both slow-time and fast-time data, can be arranged in a matrix. Slow-time data correlate with the number of sent ramps and include range information, whereas fast-time data show the number of samples per ramp and include vital sign information.
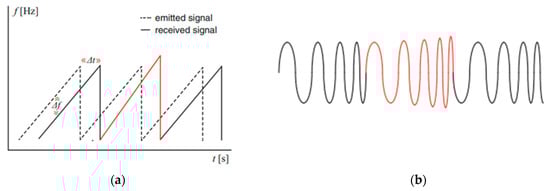
Figure 13.
FMCW signal: (a) frequency variability versus time, (b) instantaneous chirp signals [93].
FMCW radar offers superior range resolution compared to CW radar, which enhances both sensitivity and specificity. This radar type can distinguish between multiple targets at different distances, reducing the likelihood of false positives caused by nearby moving objects. In complex environments, FMCW radar performs better due to its ability to handle moderate levels of clutter and interference. Its range discrimination capability allows it to accurately identify and isolate the target’s vital signs from other environmental noise.
- (c)
- SFCW Radar: Stepped-Frequency Continuous Wave
SFCW radar and stepped-frequency continuous wave (SFCW) radar are comparable. Specifically, they both have a sequence of N frames. As demonstrated in Figure 14, SFCW radar functions similarly in that it is linearly broadcast towards the target with a time interval of ∆f between each frame. To determine the beat intermediate frequency, a copy of the sent signal is down-converted using the reflected signal.
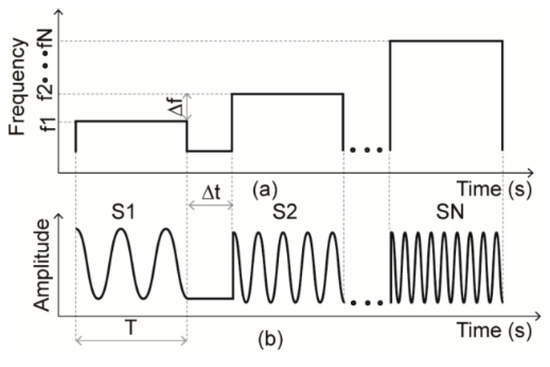
Figure 14.
SFCW signal: (a) frequency variance versus time, (b) instantaneous chirp signals.
SFCW radar combines the benefits of CW and FMCW radar by transmitting a series of discrete frequency steps, which allows for precise range measurement and high sensitivity to small motions. SFCW radar enhances specificity by leveraging its ability to differentiate between various targets at different distances, similar to FMCW radar. Additionally, SFCW radar is less prone to interference from environmental clutter compared to CW radar, as its stepped frequency approach enables better discrimination of target signals from background noise. This makes SFCW radar particularly effective in complex environments where accurate detection of vital signs is required despite the presence of multiple moving objects or electromagnetic interference.
- (d)
- Pulse-Based Ultra-Wideband (UWB) Radar
Radar systems employing pulse-based sensing, particularly those operating in the sub-nanosecond range, utilize a short-duration (sub-nanosecond) modulated or unmodulated pulse transmitted from the radar’s transmitter towards the subject. The receiver captures the reflected echo and analyses it in the temporal domain to derive cardio-respiratory signals from the individual. Among the pulse-based radar technologies, impulse radio ultra-wideband radar (IR-UWB) stands out as the most commonly employed method for detecting vital signs.
Figure 15c shows the conventional architecture of IR-UWB radar. An analogue receiver receives the transmitted pulses’ echoes and samples them using a delayed duplicate of the original pulse [94]. The offset block denotes a delay equal to the pulse’s time-of-flight. The duration of the pulse’s journey from the transmitter antenna to the receiving antenna is known as the time-of-flight. Figure 15a,b depicts the typical pulse produced by IR-UWB radar. The radar’s transmitter sends a modulated pulse in the direction of the patient. The receiver records the reflected echo and processes it in the temporal domain to extract the subject’s cardio-respiratory signals. The impulse radio ultra-wideband radar (IR-UWB) is the most widely used pulse-based radar for vital sign detection. Figure 15c shows the conventional architecture of IR-UWB radar. An analogue receiver receives the transmitted pulses’ echoes and samples them using a delayed duplicate of the original pulse [94].
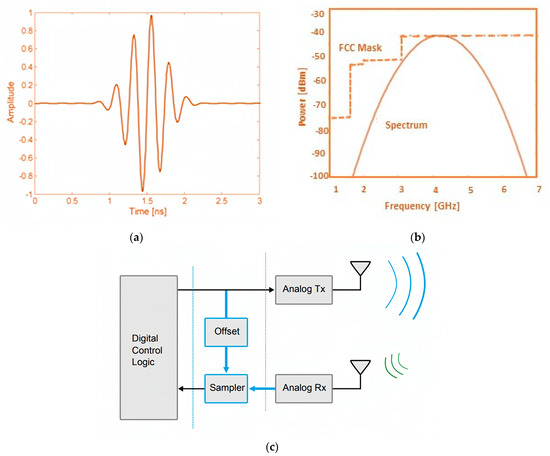
Figure 15.
(a) Time domain and (b) spectrum of UWB signal; (c) simple UWB radar block diagram [94].
UWB radar emits very short pulses across a wide frequency spectrum, providing high resolution and the ability to penetrate various materials. This results in improved sensitivity to small physiological movements and enhanced specificity by distinguishing between different types of motion. UWB radar is less affected by environmental clutter and can operate effectively through obstacles such as walls or clothing, making it suitable for diverse conditions. Its broad frequency range enables it to maintain high accuracy even in challenging environments.
- (e)
- Techniques for Cancelling Random Body Movement (RBM) in Doppler Radar
As was covered in previous sections, the main obstacle to using radar techniques to detect human vital signs is respiratory body movement (RBM). Numerous approaches of reducing RBM have been investigated in the body of current literature. Using two identical continuous wave (CW) transceivers in conjunction with the cross-spectral density (CSD) technique is one method [95]. This technique involves placing one transceiver in front of the subject and the other at their back. As seen in Figure 16, both transceivers simultaneously send a CW signal to the subject. The subject’s bodily movement velocities are directed in different directions, while their cardiac and respiratory activity synchronise for both transceivers. The RBM effect is eliminated by computing the scalar product of the signals that were received by the two transceivers. Although this method works well for retrieving vital signs during large forward and backward motions of the body, it requires the use of two identical transceivers that can send identical signals at the same time.
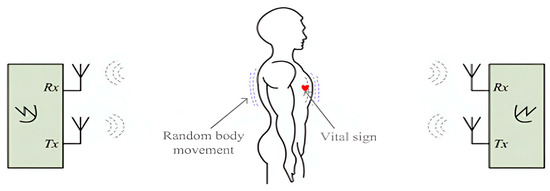
Figure 16.
Cancellation of random body movement (RBM) with two identical transceivers [95].
Using radar implementation with self-injection locking is another strategy used to mitigate the RBM effect in vital sign capture [96]. This radar system uses a pair of antennas, one at the front and one at the back of the person, as Figure 16 illustrates. To solve the RBM challenge, a CW signal is sent from the front antenna in the direction of the person’s chest.
The received signal is picked up by the same front antenna and sent to the subject’s back via circulators and the rear antenna. The back antenna gathers the reflected signal from the subject’s back and feeds it into a self-injection locked oscillator (SILO). The signal received by the back antenna is free of the RBM impact because of the RBM’s opposite reflection coefficient when seen from the front and back.
Although this radar system is successful in cancelling out large-scale body movements, couplers, phase shifters, and calibration are needed in order to remove reflections from the surrounding environment, which adds complexity to the system as a whole.
Additionally, signal processing methods provide a way to remove unwanted body motions from Doppler radar used to detect vital signs. Empirical mode decomposition (EMD) was used in a study described in [97] to remove motion artefacts coming from the subject and the antenna. Another method, covered in [98], demonstrated how the cyclostatic transformation of Doppler radar could be used to measure human vital signs when respiratory body movement (RBM) was present. But in order to keep important information from degrading throughout the non-linear transformation process, the received signal’s signal-to-noise ratio (SNR) must be high enough.
Doppler radar detects changes in frequency due to motion, making it highly sensitive to movement. However, its specificity can be lower in environments with multiple moving objects, as it may detect all motion without distinction. Environmental vibrations and other movements can also affect Doppler radar, leading to false positives if not properly filtered. This makes Doppler radar more susceptible to interference from non-target movements. Accordingly, the choice of front-end architecture in radar-based vital signs detection systems is crucial in determining the system’s sensitivity and specificity. Each architecture has its advantages and limitations, and the optimal choice depends on the specific application and environmental conditions.
It should be noted that advanced detection techniques in vital signs detection systems significantly enhance sensitivity and specificity, thereby minimizing false positives and negatives. Continuous wave radar uses adaptive filtering and motion compensation to differentiate target movements from background noise, while FMCW radar leverages range and Doppler information to isolate specific targets in complex environments. Ultra-wideband radar’s high resolution allows it to penetrate materials and focus on subtle physiological movements, crucial in scenarios like disaster recovery. Doppler radar employs spectral analysis and clutter rejection to improve specificity by filtering out non-target movements. These advanced techniques collectively improve the accuracy and reliability of radar-based vital sign detection across diverse conditions.
Furthermore, integrating radar chips into small forms for monitoring human vital signs involves several architectural and technological challenges that impact sensor performance [1]. The process begins with design and miniaturization, where miniaturized antennas, such as printed microstrip patch antennas on PCBs, are essential to maintain performance in compact systems. Advanced semiconductor technologies are used to create system-on-chip (SoC) systems that integrate radar transceivers, CPUs, and memory into a single chip or small package. Additionally, integration systems involve combining radar devices with other sensors, like cameras and inertial measurement units, through sensor fusion. This requires careful consideration of how these sensors communicate and share data within the limited space, ensuring effective performance [21].
2.2.4. Advancements in Signal Processing
Recent advancements in signal processing have played a crucial role in enhancing the detection accuracy of vital signs using microwave technology. One of the significant breakthroughs is the implementation of FMCW radar, especially at higher frequencies like 79 GHz [99]. This technology enables precise, non-contact, and non-invasive monitoring of human heart and breathing rates, essential for continuous health assessment without causing discomfort to the patient. The high-frequency FMCW radar operates by transmitting continuous signals that vary in frequency, which upon reflection from the human body, provide detailed information on movement and vital signs. This method ensures high-resolution data, allowing for more accurate vital sign detection [100].
Another pivotal advancement is the integration of sophisticated algorithms and machine learning techniques to analyse the radar data. Algorithms such as Fourier series analysis are employed to extract specific signals related to heartbeats from the radar data. These extracted signals are then processed using advanced machine learning models, including artificial neural networks (ANNs). The use of a three-layer ANN model has shown remarkable improvements in the detection and diagnosis capabilities, particularly in identifying cardiac arrhythmias. This integration of signal processing and machine learning not only enhances the accuracy of vital sign monitoring but also paves the way for more intelligent and predictive healthcare systems [101,102].
Additionally, recent developments in spectrum sharing and automatic localization have significantly enhanced the reliability and practicality of microwave-based vital sign monitoring. Spectrum sharing methodologies allow radar systems to coexist with existing communication infrastructures, minimizing signal interference and improving detection accuracy in real-world environments. Automatic localization techniques have been refined to detect and track multiple stationary individuals accurately, such as patients in a hospital ward or residents in an elderly care facility. These techniques estimate the number and positions of individuals, which is crucial for comprehensive monitoring. By combining high-resolution radar data with localization algorithms, these advancements ensure that vital sign monitoring systems are both accurate and scalable, making them applicable in various healthcare settings [103,104].
3. Lung Water Level Measurement
For the purpose of evaluating lung health and treating ailments like pulmonary oedema, it is essential to comprehend and keep an eye on lung water levels. Lung water levels have been measured using a variety of methods, each with unique benefits and drawbacks. An overview of the many techniques used to monitor the lung water level is provided by this study of the literature, with an emphasis on the application of microwave sensors in this particular setting.
3.1. Traditional Techniques
Classically, techniques like chest X-rays and computed tomography (CT) scans have been employed to visualize lung water content. While these methods offer high-resolution images, they involve ionizing radiation, making them less suitable for frequent monitoring due to potential health risks [105,106].
3.2. Ultrasound Imaging
A non-invasive imaging technique called lung ultrasound (LUS) can be used to evaluate pleural effusions, consolidations, pneumothorax, pleural anomalies, and oedema [107,108,109,110,111]. Ultrasound has gained prominence for its non-invasive nature and real-time imaging capabilities. Ultrasound-based lung water measurement techniques, such as lung ultrasound, provide valuable insights into lung conditions. The precision and operator reliance of these techniques, however, might be constrained.
Four ultrasonic aeration patterns were identified [112], as shown in Figure 17: a. normal aeration (N), indicated by less than three B lines or the line sliding indicator linked to respiratory action; b. a moderate loss of lung aeration, indicated by a definite number of visible B-lines (B1 lines), with a horizontal distance of 7 mm between adjacent B lines; c. a significant reduction in lung aeration, as evidenced by the difficult to count many B lines fused together and the 3 mm horizontal space between successive B lines, which encompass the appearance of a “white lung” (B2 lines); and d. pulmonary consolidation (C), which is characterized by a dynamic air bronchogram and hyperechoic lung tissue.
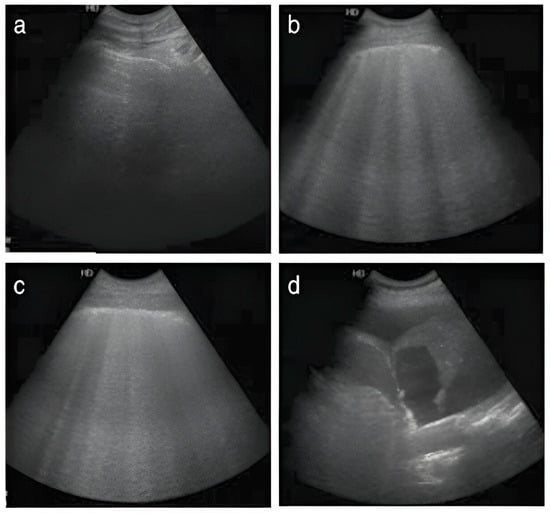
Figure 17.
Four ultrasound patterns are delineated based on lung aeration: (a) normal aeration (N), characterized by the presence of lung sliding with A lines or fewer than two isolated B lines; (b) moderate loss of lung aeration, represented by multiple, well-defined B lines (B1 lines); (c) severe loss of lung aeration, indicated by multiple coalescent B lines (B2 lines); and (d) lung consolidation (C), denoting the presence of a tissue pattern. Each region of interest was assigned points based on the most severe ultrasound pattern observed: N = 0, Bl lines 1, B2 lines = 2, C = 3.
Lung ultrasonography (LUS) was assessed using four defined lung ultrasonographs: N = 0, B1 = 1, B2 = 2, and C = 3. All patients underwent a comprehensive lung ultrasound examination, where each of the 12 lung areas was systematically assessed. The ultimate LUS for an individual patient was determined by summing the scores from each regional ultrasound evaluation, resulting in a cumulative score ranging from 0 to 36.
3.3. Bioimpedance and Electrical Impedance Tomography (EIT)
Bioimpedance techniques, including electrical impedance tomography (EIT), utilize electrical conductivity variations in lung tissues to estimate fluid content. While these methods are non-invasive, they may be influenced by factors like body composition and electrode placement.
A block schematic (a) and a picture (b) of the experimental system are shown in Figure 18. To reduce baseline drift, the system consists of an eight-electrode belt that is worn around the thorax and an extra reference electrode attached to the waist [113]. Ag/AgCl disposable electrodes make up all nine of the electrodes. The belt is made up of eight sections, each of which has five length adjustment settings. This allows the belt to be adjusted to fit thorax sizes ranging from 85 to 135 cm while keeping electrode locations uniformly spaced. A 20 kHz current with an amplitude of 3 mA is produced by a current source circuit and directed in an opposite configuration towards the body via a switch matrix. Differential voltages are measured for each injection using the four-electrode approach [113]. These values are then amplified by a factor of 50 to a level of several volts. A band-pass filter (BPF) with a centre frequency of 20 kHz and a bandwidth of 1 kHz is used to filter these voltage values. They are then sampled using an A/D chip (TI-ADS8323) at fs = 250 kHz and 16 bits of resolution.
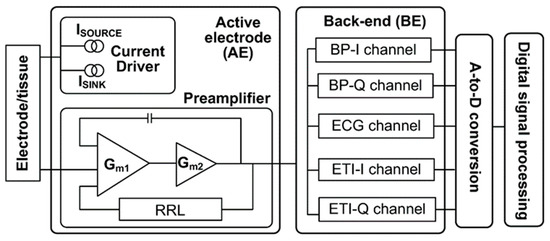
Figure 18.
Block diagram of the ECG/ETI measurement system [113].
The device also measures the ECG signal using two of the eight electrodes (electrodes 3 and 8 in Figure 19) for five seconds, going from the right to the left side of the thorax. The band-pass filter (BPF) in the 0.05–30 Hz range is used to filter the ECG signal, which is then sampled at a rate of fs = 1 kHz. The measurements are sequenced in a particular order, coordinated by a microprocessor (TMS320VC5416): To extract the mean RR interval, a 5 s ECG signal is first obtained and simultaneously analysed in real-time. To guarantee that all bio-impedance measurements are made during the iso-potential interval of the cardiac cycle, a delay of 1/3 RR from the last detected R-wave is used as a trigger. The goal of this method is to keep the heart in the same form and location as much as feasible. To further reduce the effect of breathing on lung resistivity, all measurements are performed in a constant sitting position and during shallow tidal breaths. It takes less than 30 s to complete the measurement process. As shown in Figure 19, the device is attached to the human body, and its observed signal-to-noise ratio, which is determined by averaging the standard deviation and the mean of voltage measurements, is roughly 75 dB [114].
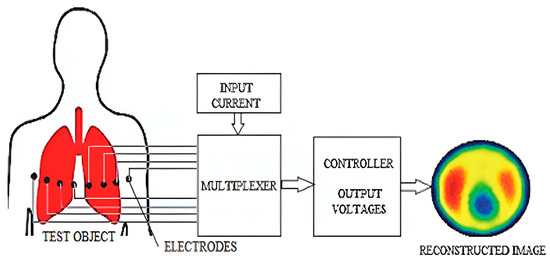
Figure 19.
General block diagram of an EIT system. A current is introduced via a pair of electrodes connected to the test object. The resulting voltages are then recorded, and an image depicting the conductivity distribution is reconstructed [114].
3.4. Microwave Sensors-Based Technique
Recent research has explored the application of microwave sensors for lung water level measurement. Microwave sensors offer the advantage of non-invasiveness, allowing for continuous and remote monitoring. These sensors operate on the principle that microwave signals are affected by changes in lung water content, providing a unique and potentially sensitive approach for assessing pulmonary conditions.
Microwave sensors can be classified into continuous wave (CW) and frequency modulated continuous wave (FMCW) types. CW radar systems, for instance, emit a continuous microwave signal, and changes in the reflected signal can be analysed to infer variations in lung water levels. FMCW radar systems, on the other hand, modulate the frequency of the emitted signal, offering additional capabilities for range resolution.
Challenges and Future Directions: Despite the promise of microwave sensors, challenges such as signal interference and the need for sophisticated signal processing techniques must be addressed. Future research should focus on refining sensor technologies, enhancing accuracy, and validating these methods in diverse clinical scenarios for broader adoption in pulmonary healthcare.
Based on the technique of microwave sensors, various systems were proposed. The Cardiopulmonary Stethoscope (CPS) project was awarded 2-year NIH funding (R21HL124457) in 2014 with the goal of conducting human clinical studies to further validate the accuracy and dependability of the CPS system. Validating the clinical sensitivity of the CPS system in monitoring respiratory and cardiac rates as well as evaluating alterations in lung water content in hospitalised patients was the main goal. The human clinical trials were carried out in cooperation with a medical team at The Queen’s Medical Centre (QMC) in Honolulu, HI, under the direction of Dr. Todd Seto. The University of Hawaii’s and QMC’s institutional review boards approved the study procedure [115].
As part of the investigation, a commercial phantom was modified further in [115] to account for variations in lung water content (LWC). A life-sized phantom was used in the experiment, which is comparable to the setup outlined in [116]. As shown in Figure 20, the alterations included inserting tiny sponge pieces directly into the airbags and adding a sponge layer to the airbags that functioned as lungs. Water was pumped into the airbags using a syringe and a branching Tygon tubing system to achieve uniform water distribution in the lungs, simulating fluid accumulation in parallel with the breathing cycle. One microwave sensor was placed above the sponge layer and the other one was placed right beneath the airbags to make direct contact with a muscle phantom layer. A solution of TX151, NaCl, and deionized water was prepared to meet the desired electrical muscle properties (ε = 55, σ = 0.95 S/m) in order to accurately duplicate the tissue properties at 915 MHz [109]. These two sensors were used to track the transmission and reflection coefficients during the experiment. After 30 s of baseline data collection, participants in the experiment underwent a 10 min breathing cycle and a water infusion. A chronometer was used to manually pump air into the lungs to simulate a respiratory rate (RR) of 10–11 breaths per minute (BrPM) while water was fed into the sponges at a rate of 0.2 cc/s. Based on variations in the transmission coefficient, the water level was extracted. Figure 20 illustrates the 3D lung model constructed in HFSS.
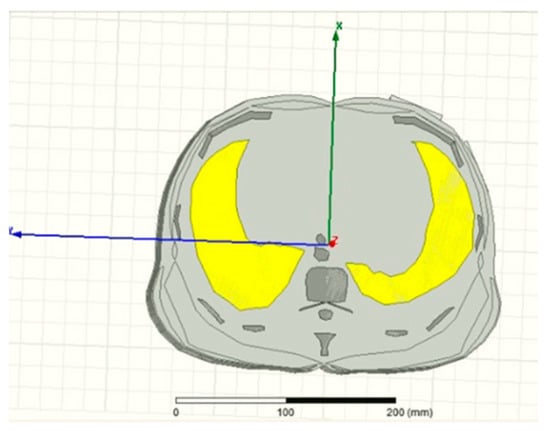
Figure 20.
Illustration of a cylindrical lung model constructed from an axial CT scan using HFSS [14].
Another study examined the use of UWB and narrowband sensors to measure LWL and contrasted their effectiveness using frequency shift analysis [117]. The lung phantom was prepared in the laboratory as presented in Figure 21. Three scenarios’ sensors were used to detect water in the lung. Firstly, narrowband sensors are frequently employed in medical applications due to their simplicity and ease of implementation. The electromagnetic waves that these sensors created travelled through the body at a precise frequency. There was a frequency shift that occurred when these waves came into contact with dielectric materials that were not present in the air, such as lung tissue or water. Electromagnetic waves propagated at various speeds in different materials, which was what caused this shift. Utilizing frequency and amplitude shift analysis, which entailed passing a known frequency signal through a human chest, was the most straightforward method for determining the water level in the lung [117]. Secondly, in contrast, when the same set of experiments was applied to the UWB sensor, parallel conclusions could be drawn. The results of these experiments are showcased in Figure 22 and Figure 23. Thirdly, applying the same experimental setup to the coupler sensor, analogous findings could be derived. The outcomes of these experiments are illustrated in Figure 24 for the coupled sensor.
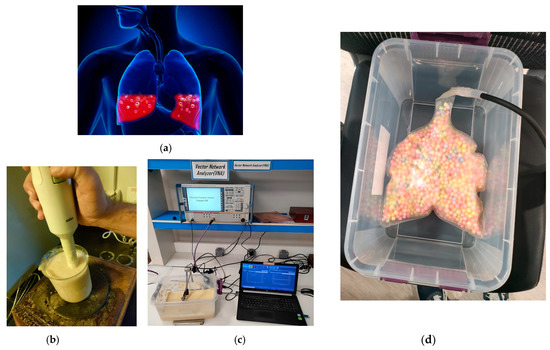
Figure 21.
(a) Image of the water in a human lung [117]. (b) Phantom preparation and fabrication. (c) Measurement. (d) Image of an artificial plastic lung filled with foam.
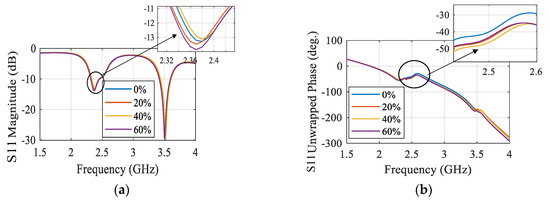
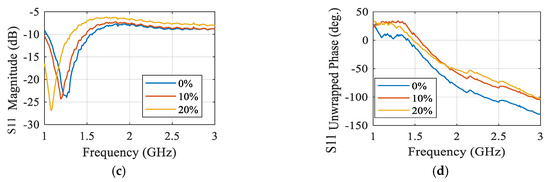
Figure 22.
Simulated S-parameters of different water contents for narrowband sensor. (a) S11 magnitude and (b) S11 unwrapped phase. Measured S-parameters of different water contents for narrowband sensor. (c) S11 magnitude and (d) S11 unwrapped phase [117].
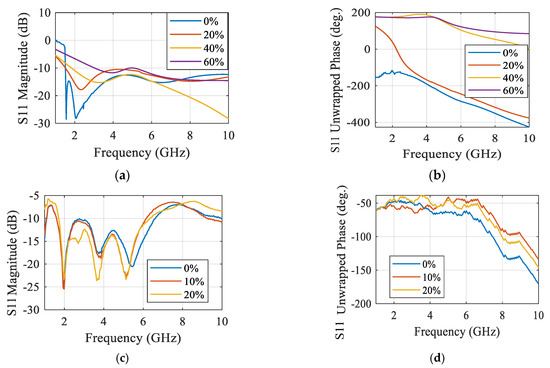
Figure 23.
Simulated S-parameters of different water contents for UWB sensor. (a) S11 magnitude and (b) S11 unwrapped phase. Measured S-parameters of different water contents for UWB sensor. (c) S11 magnitude and (d) S11 unwrapped phase.
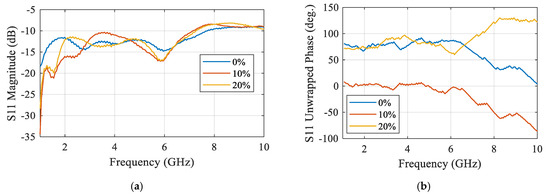
Figure 24.
Measured S-parameters of different water content for coupler sensor. (a) S11 magnitude, (b) S11 unwrapped phase.
The comparison of lung water measurement using NB and UWB textile antenna sensors showed interesting applications in healthcare and everyday life for athletes. Because UWB technology outperforms other options, it could be easily integrated into healthcare systems to provide reliable and trustworthy continuous monitoring. Since UWB sensors are non-invasive, they improve patient comfort, encourage adherence, and make long-term chronic disease monitoring easier. Thanks to this technology, healthcare professionals can now monitor and control patients’ health from a distance. Additionally, by adapting these wearable devices for home use, individuals would be able to monitor their vital signs and lung water levels, promoting proactive health management and potentially reducing the frequency of clinic visits.
These findings establish a solid groundwork for the development of innovative and cost-effective wearable medical technology, with linked technology showing promise in enhancing patient care and wellness. However, this characteristic also presents structural challenges and performance instability due to the CPW-based coupler’s structural displacement, which impacts the coupling efficiency of the microwave signal to the body. In light of this, the objectives for the production of the textile coupler prototype were conformal planar surfaces that are also sufficiently stiff to support the feeding mechanism and CPW feed, which are employed to assist the integration of the feeding element to the sensor. Good findings were obtained for sensitivity at 0.5 degrees using the connected sensors.
4. Vital Signs Radar-Based Techniques versus Traditional Methods
When compared to conventional techniques, the reviewed human vital sign sensors using radar technology have both benefits and downsides, particularly when it comes to cost, user friendliness, and patient compliance for extended monitoring. This is an in-depth comparison (see Table 1).

Table 1.
Comparison between radar-based techniques and traditional methods of measuring vital signs.
For long-term monitoring, radar-based human vital sign sensors have a number of benefits in terms of user-friendliness and patient compliance. They offer a continuous, comfortable, and non-intrusive monitoring solution that fits in well with day-to-day activities. Their long-term advantages and potential for lower maintenance costs make them a viable substitute for traditional techniques, even though the initial cost can be greater. In clinical settings, however, older procedures remain indispensable due to their proven dependability and accuracy advantage. Radar technology is expected to be used increasingly often for long-term vital sign monitoring as it develops and becomes more affordable.
5. Conclusions
In conclusion, the imperative nature of monitoring human cardio-respiratory rates for predicting and diagnosing cardiovascular and pulmonary diseases has driven significant advancements in detection methods. While contact-based modalities like ECG have traditionally served as the gold standard, their practicality for extended monitoring periods is hindered by the use of body sensors and cabling. Recognizing this limitation, recent research has strategically shifted toward contactless-based approaches, leveraging radar techniques to eliminate the need for electrodes and achieving accurate vital sign detection. This paper illuminates the challenges encountered by vital signs systems and highlights the contemporary solutions. In the end, although conventional and ultrasonic methods have been crucial in measuring lung water levels, the development of microwave sensors offers a promising new direction in non-invasive, continuous monitoring that has the potential to revolutionize the study of pulmonary health assessment.
Author Contributions
Conceptualization, A.S.A.E.-H. and D.M.E.; methodology A.S.A.E.-H. and G.M.E.; software validation, D.M.E. and A.S.A.E.-H.; formal analysis, E.A.A. and D.M.E.; investigation, E.A.A., D.M.E. and G.M.E.; writing—original draft preparation, D.M.E. and A.S.A.E.-H.; writing—review and editing, A.S.A.E.-H. and G.M.E.; visualization, E.A.A. and D.M.E.; supervision administration, E.A.A. All authors have read and agreed to the published version of the manuscript.
Funding
This research received no external funding.
Institutional Review Board Statement
Not applicable.
Informed Consent Statement
Not applicable.
Data Availability Statement
Data are contained within the article.
Acknowledgments
All authors would like to thank the Electronics Research Institute (ERI) for facilitating the work until its completion through a project supported by the internal project committee at ERI.
Conflicts of Interest
The authors declare no conflicts of interest.
References
- Dhiah el Diehn, I.; Obermaisser, R.; Abuteir, M.; Darabkh, K.A. A Reliable System-of-Systems Healthcare Monitoring Framework. IEEE Access 2023, 11, 145679–145691. [Google Scholar]
- Zhang, E.; Trujillo, R.; Templeton, J.M.; Poellabauer, C. A Study on Mobile Crowd Sensing Systems for Healthcare Scenarios. IEEE Access 2023, 11, 40325–140347. [Google Scholar] [CrossRef]
- Marzouk, H.M.; Abd El-Hameed, A.S.; Allam, A.; Abdel-Rahman, A.B.A. Design of Non-Invasive Glucose Measurement Sensor. In Proceedings of the 2022 10th International Japan-Africa Conference on Electronics, Communications, and Computations (JAC-ECC), Alexandria, Egypt, 19–20 December 2022; pp. 212–215. [Google Scholar]
- Xu, Z.; Rodriguez-Villegas, E. Power Transfer Mattress Based System for Perpetually Operating Physiological Monitoring Wearables. IEEE Trans. Biomed. Circuits Syst. 2023, 18, 460–473. [Google Scholar] [CrossRef] [PubMed]
- Yavari, E. Distortion Reduction and Signal Estimation in Doppler Radar Physiological Monitoring Systems. Ph.D. Thesis, University of Hawaii, Manoa, HI, USA, 2015. [Google Scholar]
- Marzouk, H.M.; Hameed, A.S.A.E.; Allam, A.; Pokharel, R.K.; Rahman, A.B.A. A new rectangular dielectric resonator sensor for glucose measurement: Design, modeling, and experimental validation. Int. J. Circuit Theory Appl. 2023, 52, 3040–3051. [Google Scholar] [CrossRef]
- Marzouk, H.M.; Abd El-Hameed, A.S.; Allam, A.; Pokharel, R.K.; Abdel-Rahman, A.B. Circular DGS Resonator for Non-Invasive Sensing of Diabetes. In Proceedings of the 2023 17th European Conference on Antennas and Propagation (EuCAP), Florence, Italy, 26–31 March 2023; pp. 1–5. [Google Scholar]
- Perron, R.R.; Iskander, M.F.; Seto, T.B.; Huang, G.C.; Bibb, D.A. Electromagnetics in medical applications: The cardiopulmonary stethoscope journey. In The World of Applied Electromagnetics: In Appreciation of Magdy Fahmy Iskander; Springer: Berlin/Heidelberg, Germany, 2018; pp. 443–479. [Google Scholar]
- Gagarin, R.; Celik, N.; Huang, G.C.; Iskander, M.F. Microwave Stethoscope, a new noninvasive multiple vital signs sensor: Human clinical trials. In Proceedings of the 2012 IEEE International Symposium on Antennas and Propagation, Chicago, IL, USA, 8–14 July 2012; pp. 1–2. [Google Scholar]
- Staub, N.C. Measurement of lung water content. J. Microw. Power 1983, 18, 259–263. [Google Scholar] [CrossRef] [PubMed]
- Celik, N.; Gagarin, R.; Huang, G.C.; Iskander, M.F.; Berg, B.W. Microwave stethoscope: Development and benchmarking of a vital signs sensor using computer-controlled phantoms and human studies. IEEE Trans. Biomed. Eng. 2013, 61, 2341–2349. [Google Scholar] [CrossRef] [PubMed]
- Korostynska, O.; Mason, A.; Al-Shamma’a, A. Microwave sensors for the noninvasive monitoring of industrial and medical applications. Sens. Rev. 2014, 34, 182–191. [Google Scholar] [CrossRef]
- Tseng, C.H.; Wu, C.Z. A novel microwave phased-and perturbation-injection-locked sensor with self-oscillating complementary split-ring resonator for finger and wrist pulse detection. IEEE Trans. Microw. Theory Tech. 2020, 68, 1933–1942. [Google Scholar] [CrossRef]
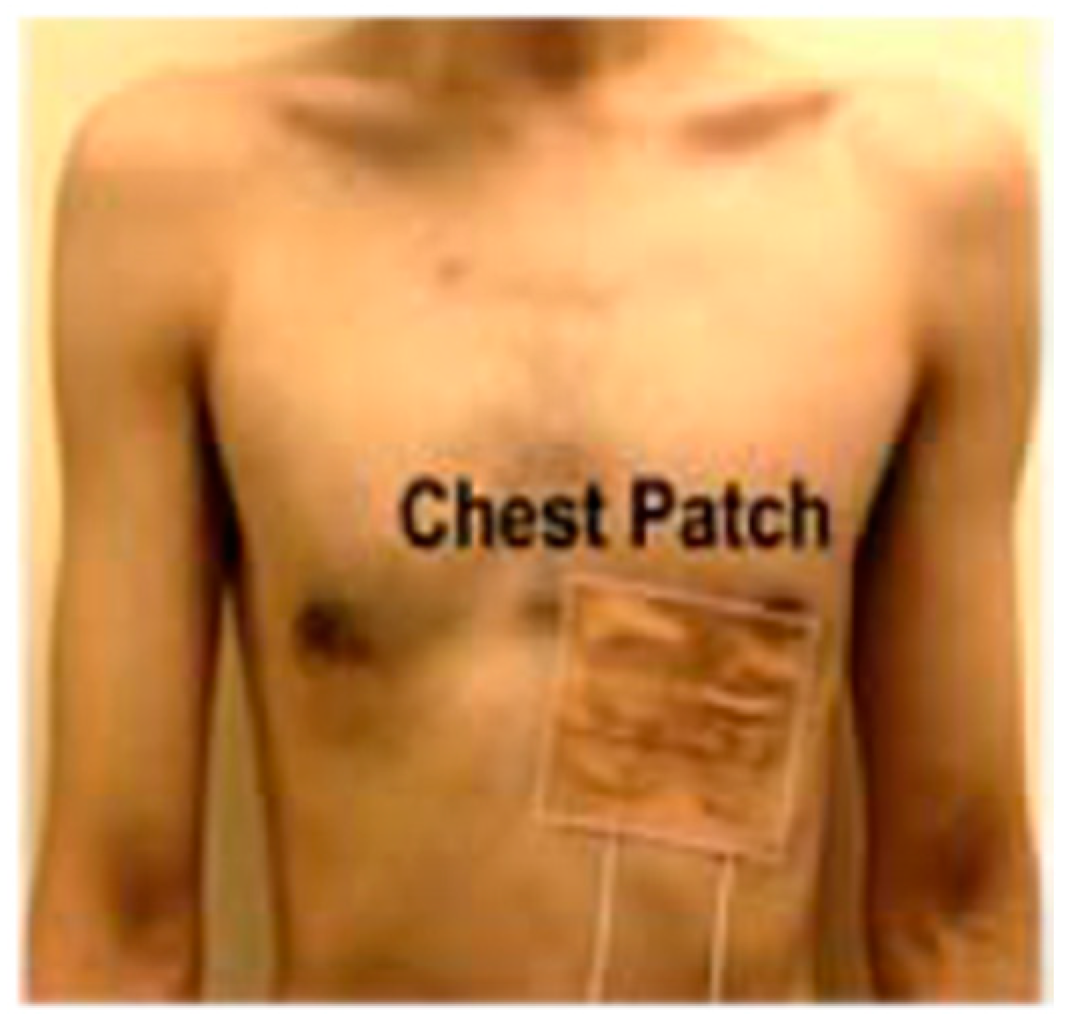
- Leong, C.; Xiao, Z.; Yun, Z.; Iskander, M.F.I. Non-Invasive assessment of lung water content using chest patch RF sensors: A computer study using NIH patients CT scan database and AI classification algorithms. IEEE Access 2023, 11, 13058–13066. [Google Scholar] [CrossRef]
- Atlef, J.L. Principles of Clinical Electrocardiography. Anesthesiology 1980, 52, 195. [Google Scholar] [CrossRef]
- Hsu, C.C.; Lin, B.S.; He, K.Y.; Lin, B.S. Design of a Wearable 12-Lead Noncontact Electrocardiogram Monitoring System. Sensors 2019, 19, 1509. [Google Scholar] [CrossRef] [PubMed]
- Schmidt, M.; Schumann, A.; Müller, J.; Bär, K.J.; Rose, G. ECG derived respiration: Comparison of time-domain approaches and application to altered breathing patterns of patients with schizophrenia. Physiol. Meas. 2017, 38, 601–615. [Google Scholar] [CrossRef] [PubMed]
- Hallfors, N.; Jaoude, M.A.; Liao, K.; Ismail, M.; Isakovic, A. Graphene oxide—Nylon ECG sensors for wearable IoT healthcare. In Proceedings of the 2017 Sensors Networks Smart and Emerging Technologies (SENSET), Beirut, Lebanon, 12–14 September 2017. [Google Scholar]
- Hsieh, J.C.; Hsu, M.W. A cloud computing based 12-lead ECG telemedicine service. BMC Med. Inform. Decis. 2012, 12, 77. [Google Scholar] [CrossRef] [PubMed]
- 12-Lead ECG Systems in Clinical Trials. Available online: https://www.clinicaltrialsarena.com/features/12-lead-ecg-systems-in-clinical-trials/ (accessed on 20 December 2019).
- Majumder, S.; Chen, L.; Marinov, O.; Chen, C.H.; Mondal, T.; Deen, M.J. Noncontact Wearable Wireless ECG Systems for Long-Term Monitoring. IEEE Rev. Biomed. Eng. 2018, 11, 306–321. [Google Scholar] [CrossRef] [PubMed]
- Bayasi, N.; Tekeste, T.; Saleh, H.; Mohammad, B.; Khandoker, A.; Ismail, M. Low-Power ECG-Based Processor for Predicting Ventricular Arrhythmia. IEEE Trans. Very Large Scale Integr. VLSI Syst. 2016, 24, 1962–1974. [Google Scholar] [CrossRef]
- Yasin, M.; Tekeste, T.; Saleh, H.; Mohammad, B.; Sinanoglu, O.; Ismail, M. Ultra-Low Power, Secure IoT Platform for Predicting Cardiovascular Diseases. IEEE Trans. Circuits Syst. I Reg. Papers 2017, 64, 2624–2637. [Google Scholar] [CrossRef]
- Sinha, R. An Approach for Classifying ECG Arrhythmia Based on Features Extracted from EMD and Wavelet Packet Domains. Master Dissertation. 2012. Available online: https://www.researchgate.net/publication/287200946_An_Approach_for_Classifying_ECG_Arrhythmia_Based_on_Features_Extracted_from_EMD_and_Wavelet_Packet_Domains (accessed on 3 March 2020).
- Stingeni, L.; Cerulli, E.; Spalletti, A.; Mazzoli, A.; Rigano, L.; Bianchi, L.; Hansel, K. The role of acrylic acid impurity as a sensitizing component in electrocardiogram electrodes. Contact Dermat. 2015, 73, 44–48. [Google Scholar] [CrossRef]
- Özkaya, E.; Bozkurt, P.K. Allergic contact dermatitis caused by self-adhesive electrocardiography electrodes: A rare case with concomitant roles of nickel and acrylates. Contact Dermat. 2014, 70, 121–123. [Google Scholar] [CrossRef]
- Deswysen, A.C.; Zimerson, E.; Goossens, A.; Bruze, M.; Baeck, M. Allergic contact dermatitis caused by self-adhesive electrocardiography electrodes in an infant. Contact Dermat. 2013, 69, 379–381. [Google Scholar] [CrossRef]
- Nemati, E.; Deen, M.; Mondal, T. A wireless wearable ECG sensor for long-term applications. IEEE Commun. Mag. 2012, 50, 36–43. [Google Scholar] [CrossRef]
- Arcelus, A.; Sardar, M.; Mihailidis, A. Design of a capacitive ECG sensor for unobtrusive heart rate measurements. In Proceedings of the 2013 IEEE International Instrumentation and Measurement Technology Conference (I2MTC), Minneapolis, MN, USA, 13 July 2013. [Google Scholar]
- Khayatzadeh, M.; Zhang, X.; Tan, J.; Liew, W.S.; Lian, Y. A 0.7-V 17.4-_W 3-lead wireless ECG SoC. IEEE Trans. Biomed. Circuits Syst. 2013, 7, 583–592. [Google Scholar] [CrossRef] [PubMed]
- Jevon, P. Procedure for recording a standard 12-lead electrocardiogram. Br. J. Nurs. 2010, 19, 649–651. [Google Scholar] [CrossRef] [PubMed]
- Charlton, P.H.; Birrenkott, D.A.; Bonnici, T.; Pimentel, M.A.; Johnson, A.E.; Alastruey, J.; Tarassenko, L.; Watkinson, P.J.; Beale, R.; Clifton, D.A. Breathing Rate Estimation from the Electrocardiogram and Photoplethysmogram: A Review. IEEE Rev. Biomed. Eng. 2018, 11, 2–20. [Google Scholar] [CrossRef] [PubMed]
- Bailón, R.; Sörnmo, L.; Laguna, P. Advanced Methods and Tools for ECG Data Analysis. Artech House Lond. 2006, 1, 215–243. [Google Scholar]
- Berntson, G.G.; Cacioppo, J.T.; Quigley, K.S. Respiratory sinus arrhythmia: Autonomic origins, physiological mechanisms, and psychophysiological implications. Psychophysiology 1993, 30, 183–196. [Google Scholar] [CrossRef] [PubMed]
- Allen, J. Photoplethysmography and its application in clinical physiological measurement. Physiol. Meas. 2007, 28, R1. [Google Scholar] [CrossRef] [PubMed]
- Massaroni, C.; Nicolò, A.; Presti, D.L.; Sacchetti, M.; Silvestri, S.; Schena, E. Contact-Based Methods for Measuring Respiratory Rate. Sensors 2019, 19, 908. [Google Scholar] [CrossRef] [PubMed]
- Tamura, T.; Maeda, Y.; Sekine, M.; Yoshida, M. Wearable Photoplethysmographic Sensors—Past and Present. Electronics 2014, 3, 282–302. [Google Scholar] [CrossRef]
- Shao, D.; Liu, C.; Tsow, F.; Yang, Y.; Du, Z.; Iriya, R.; Yu, H.; Tao, N. Noncontact Monitoring of Blood Oxygen Saturation Using Camera and Dual-Wavelength Imaging System. IEEE Trans. Biomed. Eng. 2016, 63, 1091–1098. [Google Scholar] [CrossRef]
- Humphreys, K.; Ward, T.; Markham, C. Noncontact simultaneous dual wavelength photoplethysmography: A further step toward noncontact pulse oximetry. Rev. Sci. Instrum. 2007, 78, 044304. [Google Scholar] [CrossRef]
- Gastel, M.V.; Verkruysse, W.; Haan, G.D. Data-Driven Calibration Estimation for Robust Remote Pulse-Oximetry. Appl. Sci. 2019, 9, 3857. [Google Scholar] [CrossRef]
- Meredith, D.J.; Clifton, D.; Charlton, P.; Brooks, J.; Pugh, C.W.; Tarassenko, L. Photoplethysmographic derivation of respiratory rate: A review of relevant physiology. J. Med. Eng. Technol. 2011, 36, 1–7. [Google Scholar] [CrossRef] [PubMed]
- Reisner, A.; Shaltis, P.A.; Mccombie, D.; Asada, H.H. Utility of the Photoplethysmogram in Circulatory Monitoring. Anesthesiology 2008, 108, 950–958. [Google Scholar] [CrossRef] [PubMed]
- Castaneda, D.; Esparza, A.; Ghamari, M.; Soltanpur, C.; Nazeran, H. A review on wearable photoplethysmography sensors and their potential future applications in health care. Int. J. Biosens. Bioelectron. 2018, 4, 195–202. [Google Scholar] [PubMed]
- Fletcher, R.R.; Chamberlain, D.; Paggi, N.; Deng, X. Implementation of smart phone video plethysmography and dependence on lighting parameters. In Proceedings of the 2015 37th Annual International Conference of the IEEE Engineering in Medicine and Biology Society (EMBC), Milan, Italy, 25–29 August 2015; pp. 3747–3750. [Google Scholar]
- Guzman, J.H.; Couderc, J.P.; Tsouri, G.R. Accurate Hemodynamic Sensing using Video Plethysmography with High Quality Cameras. In Proceedings of the 2019 13th International Symposium on Medical Information and Communication Technology (ISMICT), Oslo, Norway, 8–10 May 2019; pp. 1–6. [Google Scholar]
- Kwon, S.; Kim, J.; Lee, D.; Park, K. ROI analysis for remote photoplethysmography on facial video. In Proceedings of the 2015 37th Annual International Conference of the IEEE Engineering in Medicine and Biology Society (EMBC), Milan, Italy, 25–29 August 2015; pp. 4938–4941. [Google Scholar]
- Singh, O.P.; Howe, T.A.; Malarvili, M. Real-time human respiration carbon dioxide measurement device for cardiorespiratory assessment. J. Breath Res. 2018, 12, 026003. [Google Scholar] [CrossRef] [PubMed]
- Höppe, P. Temperatures of expired air under varying climatic conditions. Int. J. Biometeorol. 1981, 25, 127–132. [Google Scholar] [CrossRef] [PubMed]
- Venkateshan, S. Measurements of Temperature. In Mechanical Measurements, 2nd ed.; Wiley: Hoboken, NJ, USA, 2015; pp. 103–182. [Google Scholar]
- Van Herwaarden, A.W.; Sarro, P.M. Thermal sensors based on the Seebeck effect. Sens. Actuators 1986, 10, 321–346. [Google Scholar] [CrossRef]
- Huang, Y.P.; Young, M.S.; Tai, C.C. Noninvasive respiratory monitoring system based on the piezoceramic transducer’s pyroelectric effect. Rev. Sci. Instrum. 2008, 79, 035103. [Google Scholar] [CrossRef] [PubMed]
- Huang, Y.P.; Huang, K.N. Monitoring of breathing rate by a piezofilm sensor using pyroelectric e_ect. In Proceedings of the 2013 1st International Conference on Orange Technologies (ICOT), Tainan, Taiwan, 12–16 March 2013; pp. 99–102. [Google Scholar]
- Liang, Y.; Mazzolini, A.P.; Stoddart, P.R. Fibre Bragg grating sensor for respiratory monitoring. In Proceedings of the ACOFT/AOS 2006—Australian Conference on Optical Fibre Technology/Australian Optical Society, Melbourne, VIC, Australia, 10–13 July 2006; pp. 75–77. [Google Scholar]
- Massaroni, C.; Presti, D.L.; Saccomandi, P.; Caponero, M.A.; Damato, R.; Schena, E. Fiber Bragg Grating Probe for Relative Humidity and Respiratory Frequency Estimation: Assessment During Mechanical Ventilation. IEEE Sens. J. 2018, 18, 2125–2130. [Google Scholar] [CrossRef]
- Kano, S.; Dobashi, Y.; Fujii, M. Silica Nanoparticle-Based Portable Respiration Sensor for Analysis of Respiration Rate, Pattern, and Phase During Exercise. IEEE Sens. Lett. 2018, 2, 1–4. [Google Scholar] [CrossRef]
- Zhang, D.; Sun, Y.E.; Li, P.; Zhang, Y. Facile Fabrication of MoS2-Modified SnO2 Hybrid Nanocomposite for Ultrasensitive Humidity Sensing. ACS Appl. Mater. Interfaces 2016, 8, 14142–14149. [Google Scholar] [CrossRef] [PubMed]
- Iacoponi, S.; Massaroni, C.; Presti, D.L.; Saccomandi, P.; Caponero, M.; Damato, R.; Schena, E. Polymer-coated fiber optic probe for the monitoring of breathing pattern and respiratory rate. In Proceedings of the 2018, 40th Annual International Conference of the IEEE Engineering in Medicine and Biology Society (EMBC), Honolulu, HI, USA, 18–21 July 2018; pp. 1616–1619. [Google Scholar]
- Tang, Y.; Li, Z.; Ma, J.; Wang, L.; Yang, J.; Du, B.; Yu, Q.; Zu, X. Highly sensitive surface acoustic wave (SAW) humidity sensors based on sol–gel SiO2 films: Investigations on the sensing property and mechanism. Sens. Actuators B Chem. 2015, 215, 283–291. [Google Scholar] [CrossRef]
- Scholz, R.; Bracio, B.R.; Brutscheck, M.; Trommler, P. Non-invasive respiratory rate detection in spontaneous respiration by humidity measurement. In Proceedings of the 2017 28th Irish Signals and Systems Conference (ISSC), Killarney, Ireland, 20–21 June 2017; pp. 1–6. [Google Scholar]
- Moll, J.M.; Wright, V. An objective clinical study of chest expansion. Ann. Rheum. Dis. 1972, 31, 1–8. [Google Scholar] [CrossRef] [PubMed]
- Fiorillo, A.; Critello, C.; Pullano, S. Theory, technology and applications of piezoresistive sensors: A review. Sens. Actuators A-Phys. 2018, 281, 156–175. [Google Scholar] [CrossRef]
- Rossi, D.D.; Carpi, F.; Lorussi, F.; Scilingo, E.P.; Tognetti, A. Electroactive fabrics and wearable man–machine interfaces. In Wearable Electronics and Photonics, 1st ed.; Tao, X., Ed.; Woodhead Publishing: Cambridge, UK, 2005; pp. 59–80. [Google Scholar]
- Egami, Y.; Suzuki, K.; Tanaka, T.; Yasuhara, T.; Higuchi, E.; Inoue, H. Preparation and characterization of conductive fabrics coated uniformly with polypyrrole nanoparticles. Synth. Met. 2011, 161, 219–224. [Google Scholar] [CrossRef]
- Ghasemzadeh, H.; Ostadabbas, S.; Guenterberg, E.; Pantelopoulos, A. Wireless Medical-Embedded Systems: A Review of Signal-Processing Techniques for Classification. IEEE Sens. J. 2013, 13, 423–437. [Google Scholar] [CrossRef]
- Kundu, S.K.; Kumagai, S.; Sasaki, M. A Wearable Capacitive Sensor for Monitoring Human Respiratory Rate. Jpn. J. Appl. Phys. 2013, 52, 04CL05. [Google Scholar] [CrossRef]
- Retory, Y.; Niedzialkowski, P.; Picciotto, C.D.; Bonay, M.; Petitjean, M. New Respiratory Inductive Plethysmography (RIP) Method for Evaluating Ventilatory Adaptation during Mild Physical Activities. PLoS ONE 2016, 11, e0151983. [Google Scholar] [CrossRef]
- Collop, N.A.; Tracy, S.L.; Kapur, V.; Mehra, R.; Kuhlmann, D.; Fleishman, S.A.; Ojile, J.M. Obstructive Sleep Apnea Devices for Out-Of-Center (OOC) Testing: Technology Evaluation. J. Clin. Sleep Med. 2011, 7, 531–548. [Google Scholar] [CrossRef]
- Kaplan, V.; Zhang, J.; Russi, E.; Bloch, K. Detection of inspiratory flow limitation during sleep by computer assisted respiratory inductive plethysmography. Eur. Respir. J. 2000, 15, 570. [Google Scholar] [CrossRef]
- Massaroni, C.; Saccomandi, P.; Schena, E. Medical Smart Textiles Based on Fiber Optic Technology: An Overview. J. Funct. Biomater. 2015, 6, 204–221. [Google Scholar] [CrossRef] [PubMed]
- Quandt, B.M.; Scherer, L.J.; Boesel, L.F.; Wolf, M.; Bona, G.-L.; Rossi, R.M. Body-Monitoring and Health Supervision by Means of Optical Fiber-Based Sensing Systems in Medical Textiles. Adv. Healthc. Mater. 2014, 4, 330–355. [Google Scholar] [CrossRef] [PubMed]
- Chethana, K.; Prasad, A.S.G.; Omkar, S.N.; Asokan, S. Fiber bragg grating sensor based device for simultaneous measurement of respiratory and cardiac activities. J. Biophoton. 2016, 10, 278–285. [Google Scholar] [CrossRef] [PubMed]
- Molinaro, N.; Massaroni, C.; Presti, D.L.; Saccomandi, P.; Tomaso, G.D.; Zollo, L.; Perego, P.; Andreoni, G.; Schena, E. Wearable textile based on silver plated knitted sensor for respiratory rate monitoring. In Proceedings of the 2018 40th Annual International Conference of the IEEE Engineering in Medicine and Biology Society (EMBC), Honolulu, HI, USA, 18–21 July 2018. [Google Scholar]
- Naranjo-Hernández, D.; Talaminos-Barroso, A.; Reina-Tosina, J.; Roa, L.; Barbarov-Rostan, G.; Cejudo-Ramos, P.; Márquez-Martín, E.; Ortega-Ruiz, F. Smart Vest for Respiratory Rate Monitoring of COPD Patients Based on Non-Contact Capacitive Sensing. Sensors 2018, 18, 2144. [Google Scholar] [CrossRef] [PubMed]
- Clarenbach, C.F.; Senn, O.; Brack, T.; Kohler, M.; Bloch, K.E. Monitoring of Ventilation During Exercise by a Portable Respiratory Inductive Plethysmograph. Chest 2005, 128, 1282–1290. [Google Scholar] [CrossRef] [PubMed]
- Ciocchetti, M.; Massaroni, C.; Saccomandi, P.; Caponero, M.; Polimadei, A.; Formica, D.; Schena, E. Smart Textile Based on Fiber Bragg Grating Sensors for Respiratory Monitoring: Design and Preliminary Trials. Biosensors 2015, 5, 602–615. [Google Scholar] [CrossRef] [PubMed]
- Gupta, A.K. Respiration Rate Measurement Based on Impedance Pneumography. In Application Report SBAA181; Texas Instruments: Dallas, TX, USA, 2011. [Google Scholar]
- Wang, F.T.; Chan, H.L.; Wang, C.L.; Jian, H.M.; Lin, S.H. Instantaneous Respiratory Estimation from Thoracic Impedance by Empirical Mode Decomposition. Sensors 2015, 15, 16372–16387. [Google Scholar] [CrossRef] [PubMed]
- Ginsburg, A.S.; Lenahan, J.L.; Izadnegahdar, R.; Ansermino, J.M. A Systematic Review of Tools to Measure Respiratory Rate in Order to Identify Childhood Pneumonia. Am. J. Respir. Crit. Care Med. 2018, 197, 1116–1127. [Google Scholar] [CrossRef] [PubMed]
- Chen, R.; Chen, K.; Dai, Y.; Zhang, S. Utility of transthoracic impedance and novel algorithm for sleep apnea screening in pacemaker patient. Sleep Breath. 2018, 23, 741–746. [Google Scholar] [CrossRef]
- Reinvuo, T.; Hannula, M.; Sorvoja, H.; Alasaarela, E.; Myllyla, R. Measurement of respiratory rate with high-resolution accelerometer and emfit pressure sensor. In Proceedings of the 2006 IEEE Sensors Applications Symposium, Houston, TX, USA, 7–9 February 2006; pp. 192–195. [Google Scholar]
- Phan, D.H.; Bonnet, S.; Guillemaud, R.; Castelli, E.; Thi, N.Y.P. Estimation of respiratory waveform and heart rate using an accelerometer. In Proceedings of the 2008 30th Annual International Conference of the IEEE Engineering in Medicine and Biology Society, Vancouver, BC, Canada, 20–25 August 2008; pp. 4916–4919. [Google Scholar]
- Bates, A.; Ling, M.J.; Mann, J.; Arvind, D. Respiratory Rate and Flow Waveform Estimation from Tri-axial Accelerometer Data. In Proceedings of the 2010 International Conference on Body Sensor Networks, Singapore, 7–9 June 2010; pp. 144–150. [Google Scholar]
- Liu, G.Z.; Guo, Y.W.; Zhu, Q.S.; Huang, B.Y.; Wang, L. Estimation of Respiration Rate from Three-Dimensional Acceleration Data Based on Body Sensor Network. Telemed. E-Health 2011, 17, 705–711. [Google Scholar] [CrossRef]
- Passaro, V.M.N.; Cuccovillo, A.; Vaiani, L.; Carlo, M.D.; Campanella, C.E. Gyroscope Technology and Applications: A Review in the Industrial Perspective. Sensors 2017, 17, 2284. [Google Scholar] [CrossRef] [PubMed]
- Lee, H.-J.; Jung, S. Gyro sensor drift compensation by Kalman filter to control a mobile inverted pendulum robot system. In Proceedings of the 2009 IEEE International Conference on Industrial Technology, Gippsland, VIC, Australia, 10–13 February 2009; pp. 1–6. [Google Scholar]
- Yoon, J.W.; Noh, Y.S.; Kwon, Y.S.; Kim, W.K.; Yoon, H.R. Improvement of Dynamic Respiration Monitoring Through Sensor Fusion of Accelerometer and Gyro-sensor. J. Electr. Eng. Technol. 2014, 9, 334–343. [Google Scholar] [CrossRef]
- Milici, S.; Lazaro, A.; Villarino, R.; Girbau, D.; Magnarosa, M. Wireless Wearable Magnetometer-Based Sensor for Sleep Quality Monitoring. IEEE Sens. J. 2018, 18, 2145–2152. [Google Scholar] [CrossRef]
- Yu, H.W.; Kim, H.K.; Kim, T.; Bae, K.M.; Seo, S.M.; Kim, J.M.; Kang, T.J.; Kim, Y.H. Self-Powered Humidity Sensor Based on Graphene Oxide Composite Film Intercalated by Poly(Sodium 4-Styrenesulfonate). ACS Appl. Mater. Interfaces 2014, 6, 8320–8326. [Google Scholar] [CrossRef] [PubMed]
- Cesareo, A.; Previtali, Y.; Biffi, E.; Aliverti, A. Assessment of Breathing Parameters Using an Inertial Measurement Unit (IMU)-Based System. Sensors 2018, 19, 88. [Google Scholar] [CrossRef] [PubMed]
- Vidjak, K.; Farina, L.; Ruvio, G.; O’Halloran, M.; Cavagnaro, M. Dielectric properties of healthy ex vivo ovine lung tissue at microwave frequencies. IEEE Trans. Dielectr. Electr. Insul. 2023, 30, 1162–1169. [Google Scholar] [CrossRef]
- Dicke, R.H. The measurement of thermal radiation at microwave frequencies. Rev. Sci. Instrum. 1946, 17, 268–275. [Google Scholar] [CrossRef] [PubMed]
- Thurn, K.; Ebelt, R.; Vossiek, M. Noise in Homodyne FMCW radar systems and its e_ects on ranging precision. In Proceedings of the 2013 IEEE MTT-S International Microwave Symposium Digest (MTT), Seattle, WA, USA, 2–7 June 2013; pp. 1–3. [Google Scholar]
- Wang, G.; Munoz-Ferreras, J.M.; Gu, C.; Li, C.; Gomez-Garcia, R. Application of Linear-Frequency-Modulated Continuous-Wave (LFMCW) Radars for Tracking of Vital Signs. IEEE Trans. Microw. Theory Tech. 2014, 62, 1387–1399. [Google Scholar] [CrossRef]
- Wisland, D.T.; Granhaug, K.; Pleym, J.R.; Andersen, N.; Stoa, S.; Hjortland, H.A. Remote monitoring of vital signs using a CMOS UWB radar transceiver. In Proceedings of the 2016 14th IEEE International New Circuits and Systems Conference (NEWCAS), Vancouver, BC, USA, 26–29 June 2016; pp. 1–4. [Google Scholar]
- Li, C.; Lin, J. Complex signal demodulation and random body movement cancellation techniques for non-contact vital sign detection. In Proceedings of the 2008 IEEE MTT-S International Microwave Symposium Digest, Atlanta, GA, USA, 15–20 June 2008; pp. 567–570. [Google Scholar]
- Tang, M.-C.; Wang, F.-K.; Horng, T.-S. Single Self-Injection-Locked Radar with Two Antennas for Monitoring Vital Signs With Large Body Movement Cancellation. IEEE Trans. Microw. Theory Tech. 2017, 65, 5324–5333. [Google Scholar] [CrossRef]
- Mostafanezhad, I.; Yavari, E.; Boric-Lubecke, O.; Lubecke, V.M.; Mandic, D.P. Cancellation of Unwanted Doppler Radar Sensor Motion Using Empirical Mode Decomposition. IEEE Sens. J. 2013, 13, 1897–1904. [Google Scholar] [CrossRef]
- Kazemi, S.; Ghorbani, A.; Amindavar, H.; Li, C. Cyclostationary approach to Doppler radar heart and respiration rates monitoring with body motion cancelation using Radar Doppler System. Biomed. Signal Process. 2014, 13, 79–88. [Google Scholar] [CrossRef]
- Wei, J.; Huang, L.; Tong, P.; Tan, B.; Bai, J.; Wu, Z. Realtime multi-target vital sign detection with 79ghz fmcw radar. In Proceedings of the 2020 IEEE MTT-S International Wireless Symposium (IWS), Shanghai, China, 20–23 September 2020; pp. 1–3. [Google Scholar]
- Dwinanda, A.R.; Pramudita, A.A.; Nugroho, B.S.; Dhiyani, A.A. In Effects of Drone Height Fluctuations on Detection of Respiratory Vital Signs Using FMCW Radar. In Proceedings of the 2023 IEEE International Symposium on Antennas and Propagation (ISAP), Kuala Lumpur, Malaysia, 30 October–2 November 2023; pp. 1–2. [Google Scholar]
- Numan, P.E.; Park, H.; Lee, J.; Kim, S. Machine learning-based joint vital signs and occupancy detection with IR-UWB sensor. IEEE Sens. J. 2023, 23, 7475–7482. [Google Scholar] [CrossRef]
- Chen, F.K.; Wang, Y.K.; Lin, H.P.; Chen, C.Y.; Yeh, S.M.; Wang, C.Y. In Feasibility study for apnea screening in patients’ homes using radar and machine learning method. In Proceedings of the 2022 IEEE 22nd International Conference on Bioinformatics and Bioengineering (BIBE), Taichung, Taiwan, 7–9 November 2022; pp. 282–287. [Google Scholar]
- Rihan, M.; Huang, L. Optimum co-design of spectrum sharing between MIMO radar and MIMO communication systems: An interference alignment approach. IEEE Trans. Veh. Technol. 2018, 67, 11667–11680. [Google Scholar] [CrossRef]
- Obadi, A.B.; Soh, P.J.; Aldayel, O.; Al-Doori, M.H.; Mercuri, M.; Schreurs, D. A survey on vital signs detection using radar techniques and processing with FPGA implementation. IEEE Circuits Syst. Mag. 2021, 21, 41–74. [Google Scholar] [CrossRef]
- Mayo Clinic. Chest X-rays. 2022. Available online: https://www.mayoclinic.org/tests-procedures/chest-x-rays/about/pac-20393494. (accessed on 20 June 2024).
- Volpicelli, G.; Mussa, A.; Garofalo, G.; Cardinale, L.; Casoli, G.; Perotto, F.; Fava, C.; Frascisco, M. Bedside lung ultrasound in the assessment of alveolar-interstitial syndrome. Am. J. Emerg. Med. 2006, 24, 689–696. [Google Scholar] [CrossRef] [PubMed]
- Seibel, A.; Zechner, P.M.; Berghold, A.; Holter, M.; Braß, P.; Michels, G.; Leister, N.; Gemes, G.; Donauer, R.; Giebler, R.M. B-Lines for the assessment of extravascular lung water: Just focused or semi-quantitative? Acta Anaesthesiol. Scand. 2020, 64, 953–960. [Google Scholar] [CrossRef] [PubMed]
- Zhao, Z.; Jiang, L.; Xi, X.; Jiang, Q.; Zhu, B.; Wang, M.; Xing, J.; Zhang, D. Prognostic value of extravascular lung water assessed with lung ultrasound score by chest sonography in patients with acute respiratory distress syndrome. BMC Pulm. Med. 2015, 15, 98. [Google Scholar] [CrossRef] [PubMed]
- Chiumello, D.; Mongodi, S.; Algieri, I.; Vergani, G.L.; Orlando, A.; Via, G.; Crimella, F.; Cressoni, M.; Mojoli, F. Assessment of lung aeration and recruitment by CT scan and ultrasound in acute respiratory distress syndrome patients*. Crit. Care Med. 2018, 46, 1761–1768. [Google Scholar] [CrossRef]
- Lichtenstein, D.A. Lung ultrasound in the critically ill. Ann. Intensive Care 2014, 4, 1. [Google Scholar] [CrossRef]
- Volpicelli, G.; Skurzak, S.; Boero, E.; Carpinteri, G.; Tengattini, M.; Stefanone, V.; Luberto, L.; Anile, A.; Cerutti, E.; Radeschi, G. Lung ultrasound predicts well extravascular lung water but is of limited usefulness in the prediction of wedge pressure. Anesthesiology 2014, 121, 320–327. [Google Scholar] [CrossRef]
- Grimnes, S.; Martinsen, Ø.G. Bioimpedance and Bioelectricity Basics; Academic Press: San Diego, CA, USA, 2000. [Google Scholar]
- Brown, B. Review of EIT systems available for medical use. In Clinical and Physiological Applications of Electrical Impedance Tomography; Holder, D., Ed.; UCL Press: London, UK, 1993; pp. 41–45. [Google Scholar]
- Chitturi, V.; Farrukh, N. Spatial resolution in electrical impedance tomography: A topical review. J. Electr. Bioimpedance 2017, 8, 66–78. [Google Scholar] [CrossRef]
- Gagarin, R.; Celik, N.; Youn, H.S.; Iskander, M.F. Microwave stethoscope: A new method for measuring human vital signs. In Proceedings of the 2011 IEEE International Symposium on Antennas and Propagation (APSURSI), Spokane, WA, USA, 3–8 July 2011. [Google Scholar]
- Gabriel, C. Compilation of the Dielectric Properties of Body Tissues at RF and Microwave Frequencies. King’s College London, Department of Physics: London, UK, 1996. [Google Scholar]
- Abd El-Hameed, A.S.; Elsheakh, D.M.; Elashry, G.M.; Abdallah, E.A. A Comparative Study of Narrow/Ultra-Wideband Microwave Sensors for the Continuous Monitoring of Vital Signs and Lung Water Level. Sensors 2024, 24, 1658. [Google Scholar] [CrossRef] [PubMed]

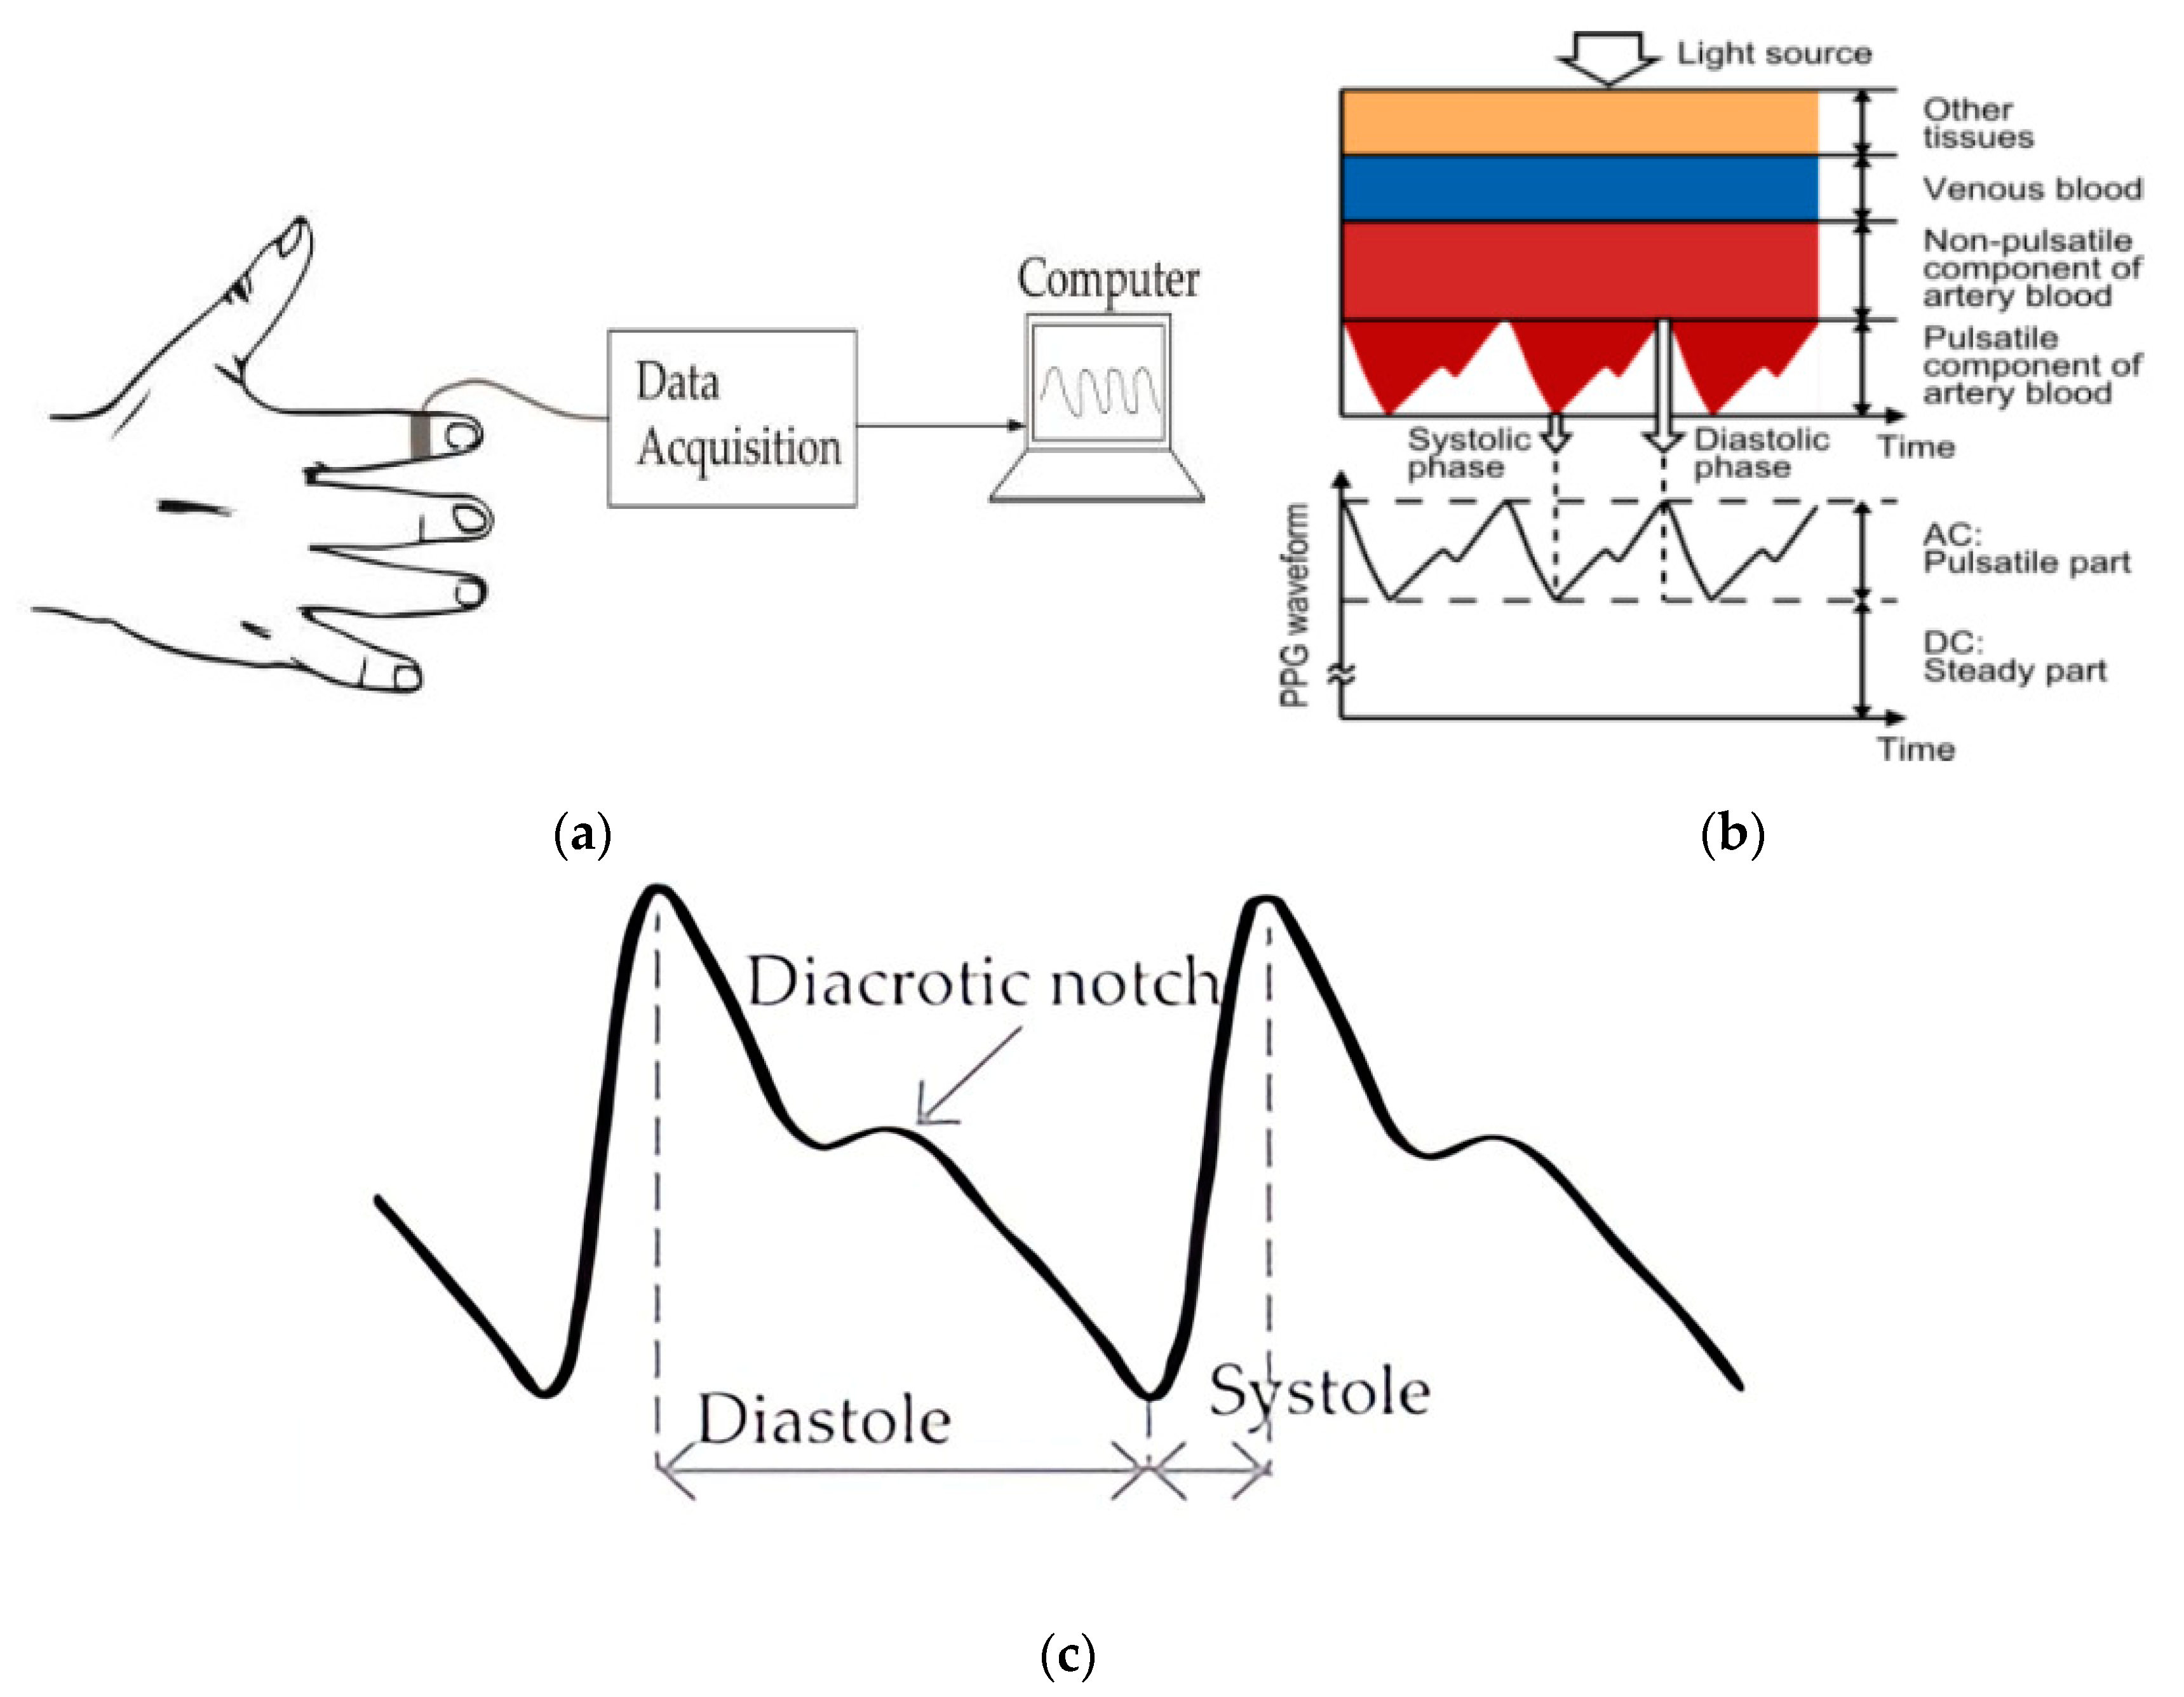
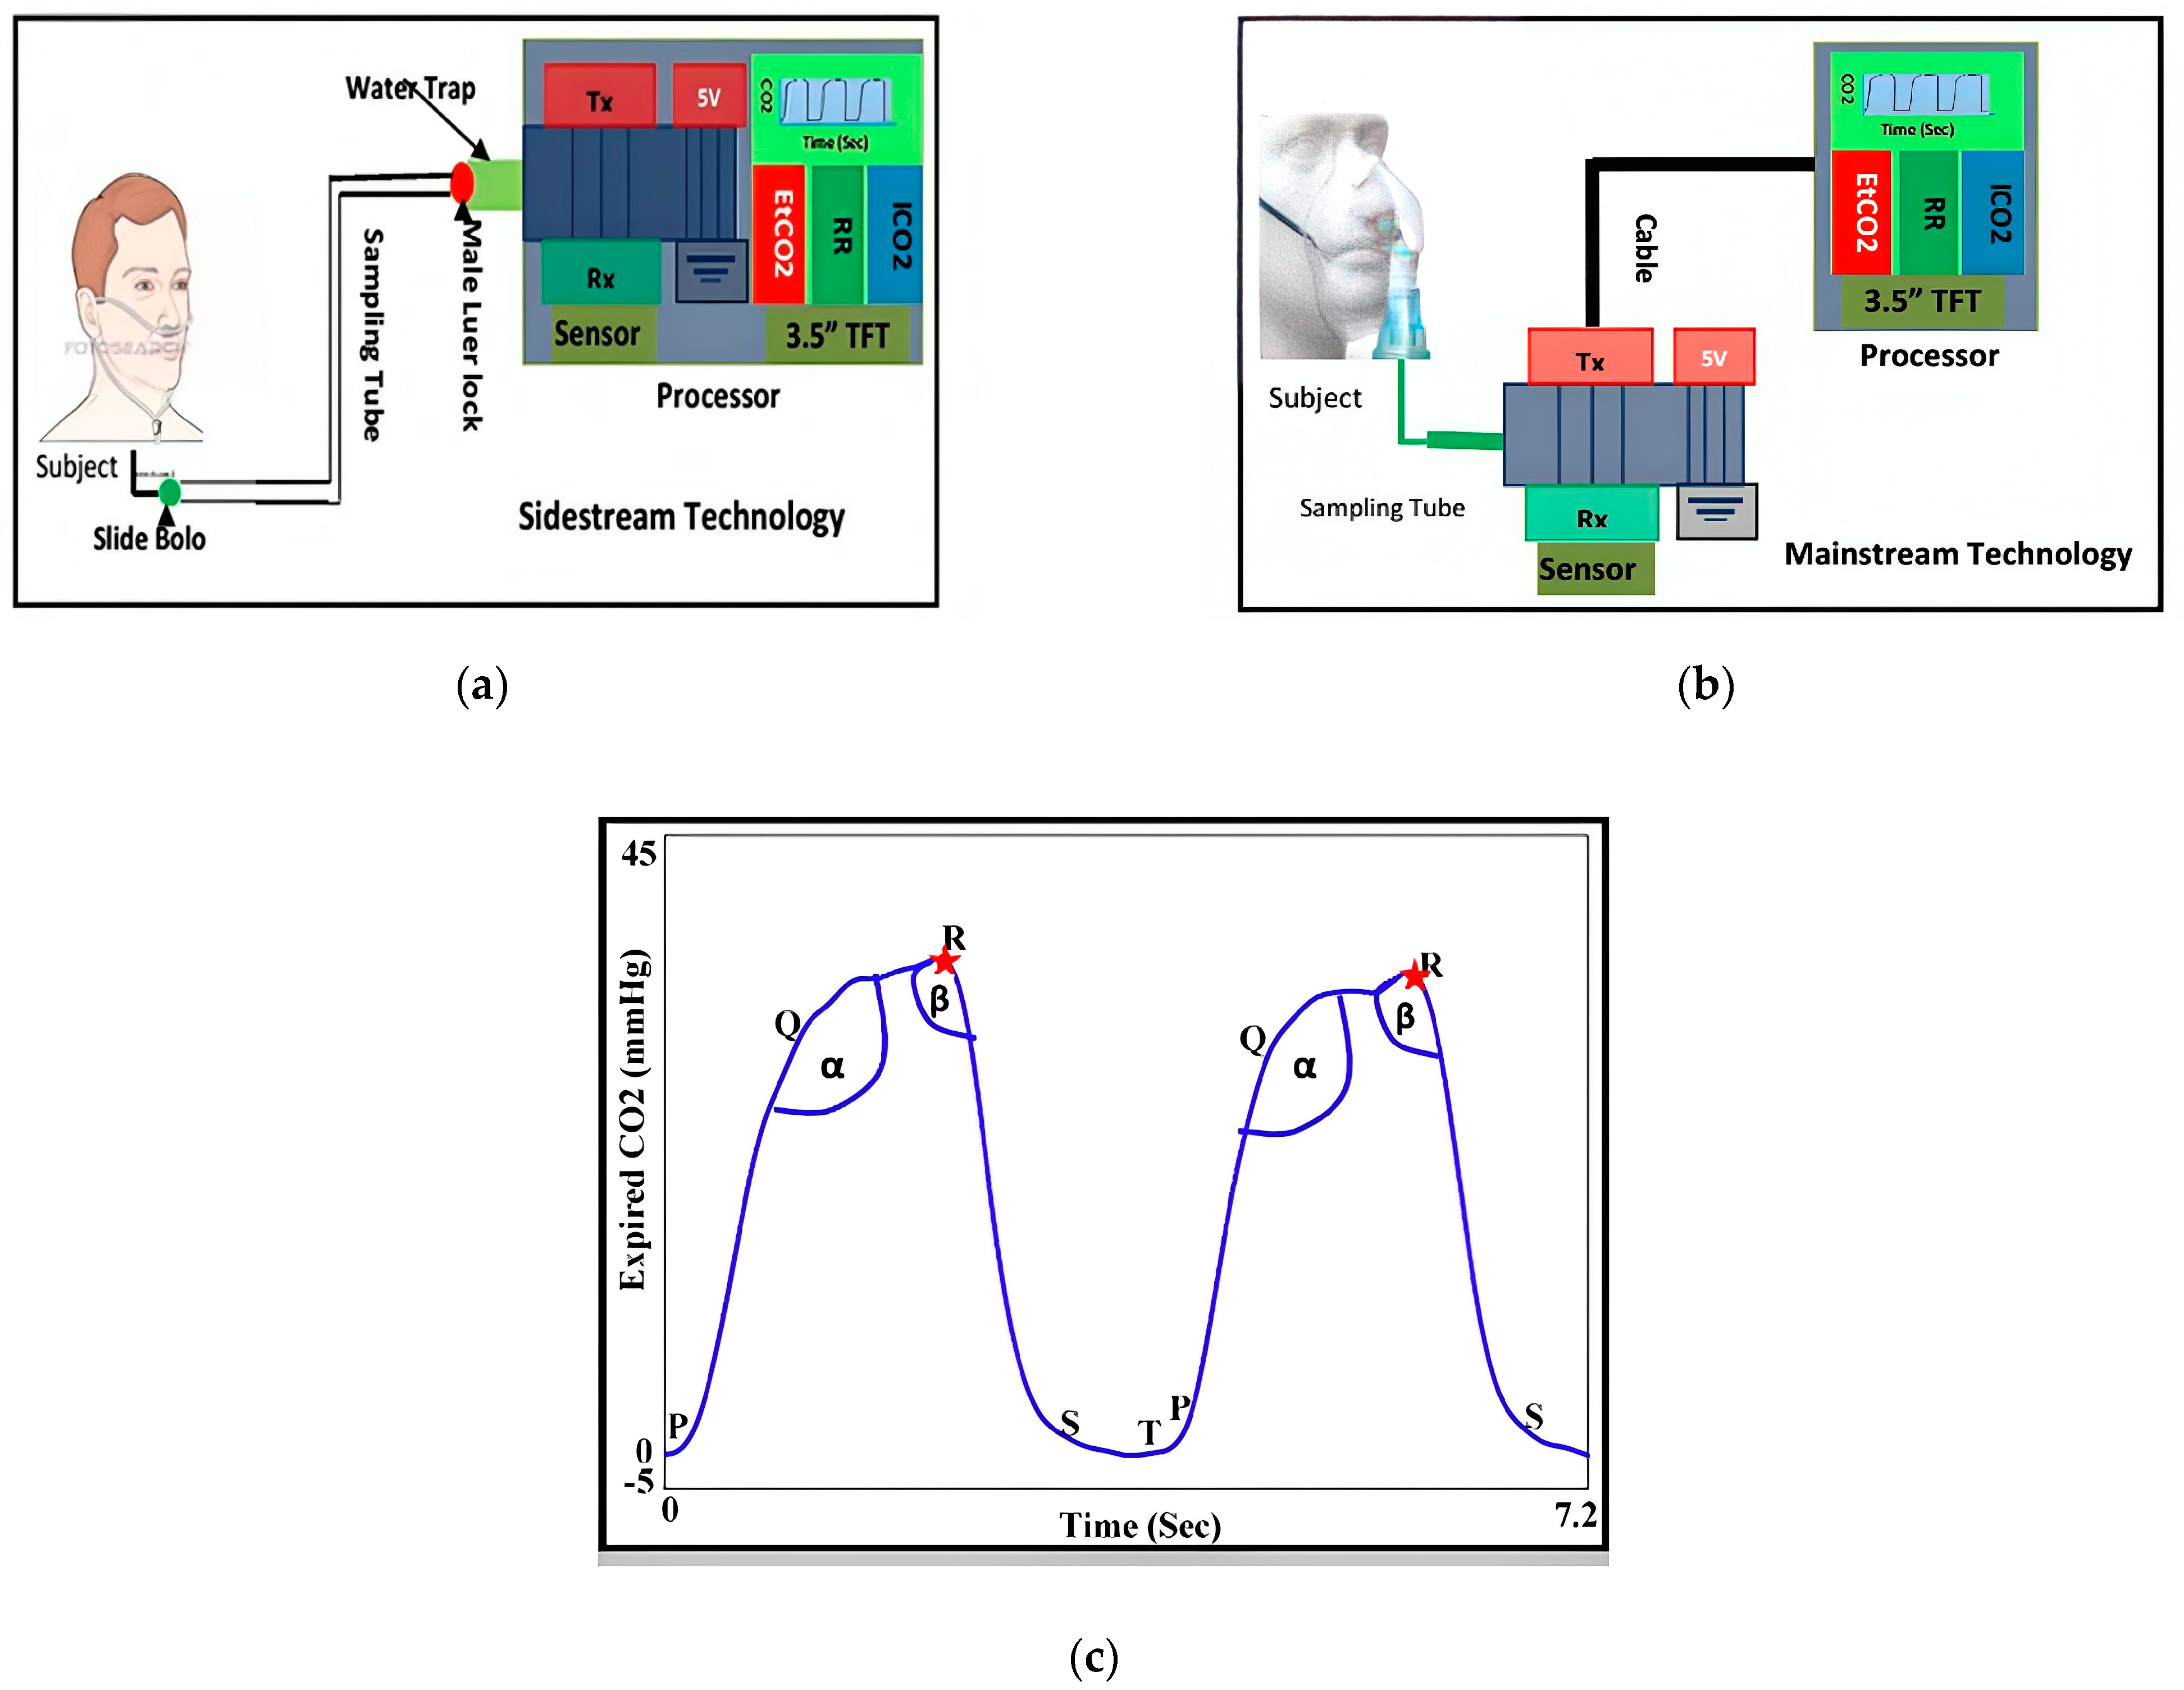
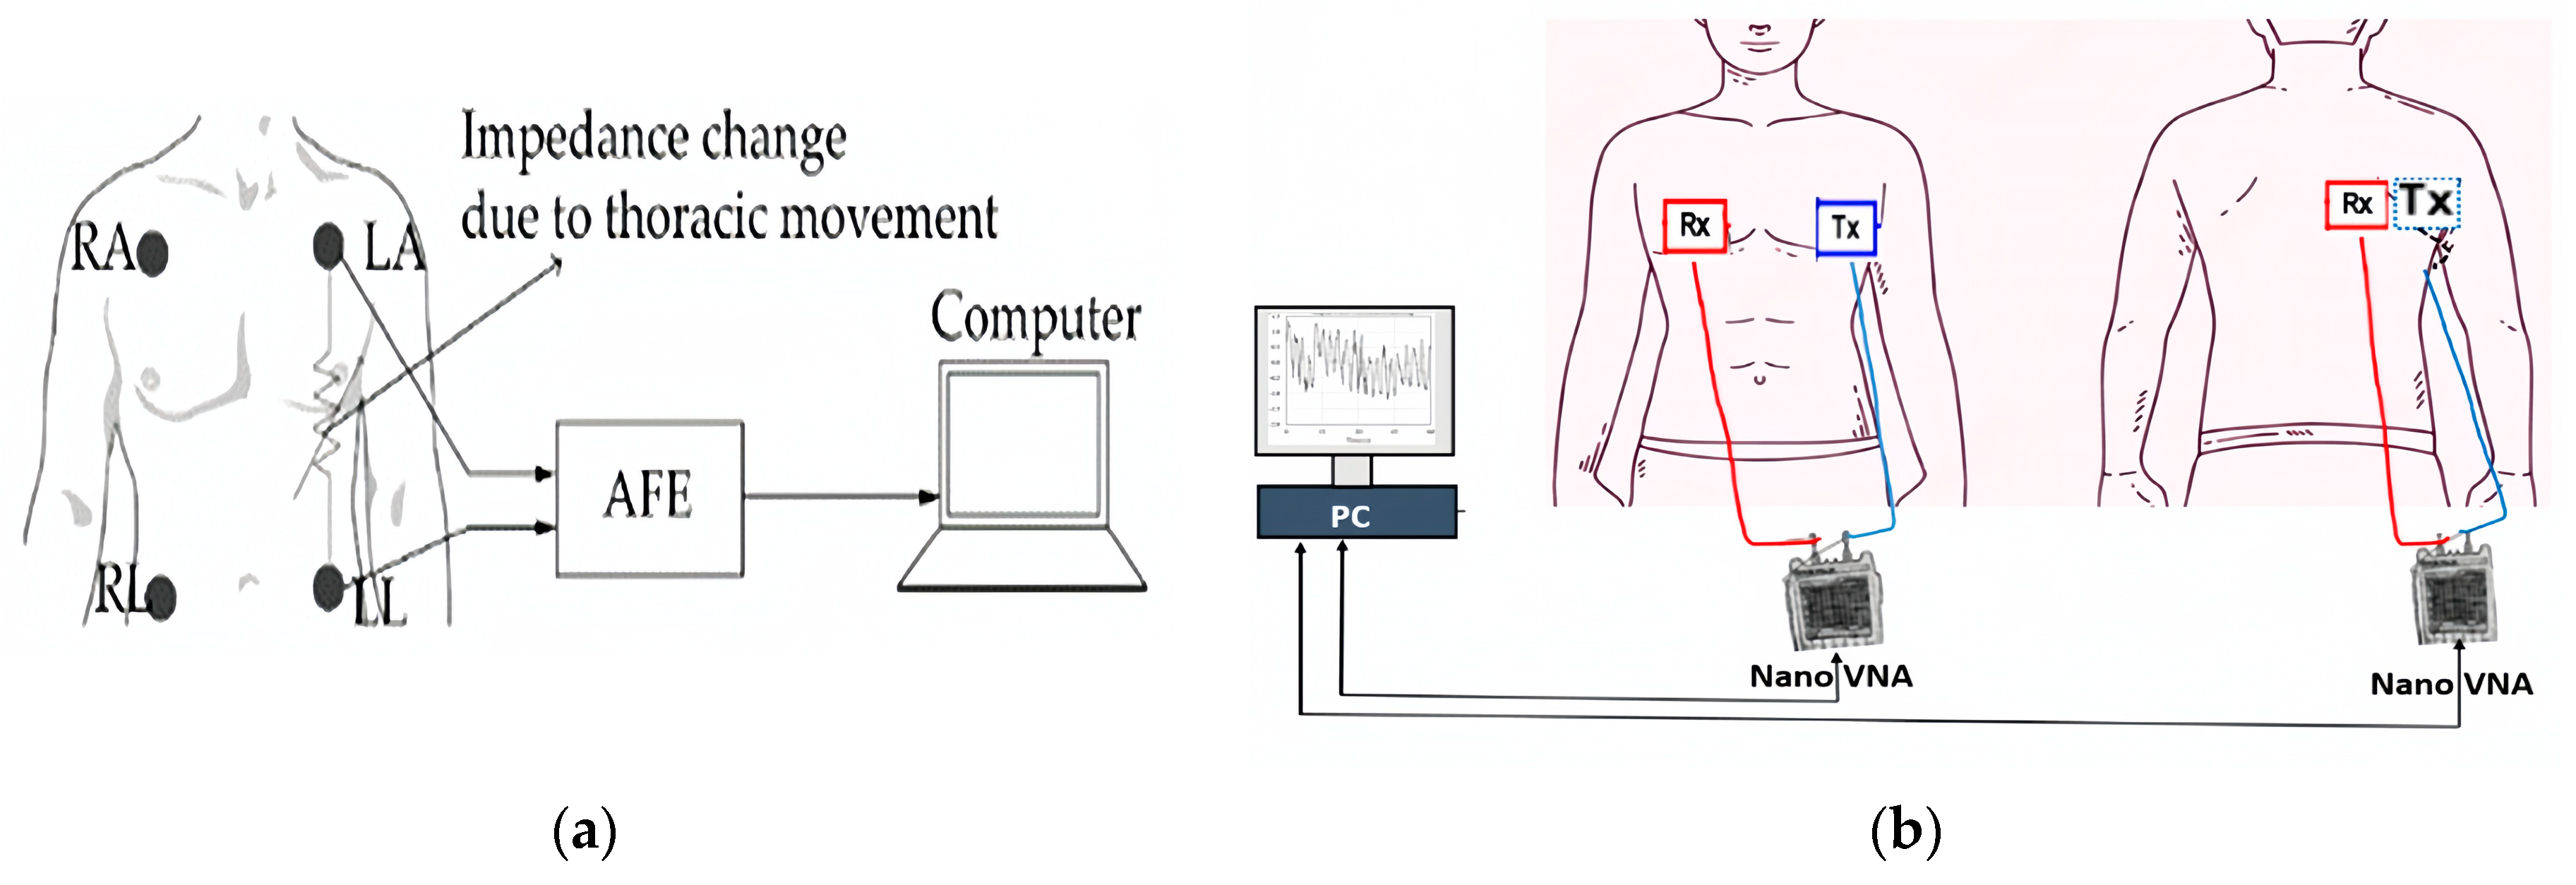
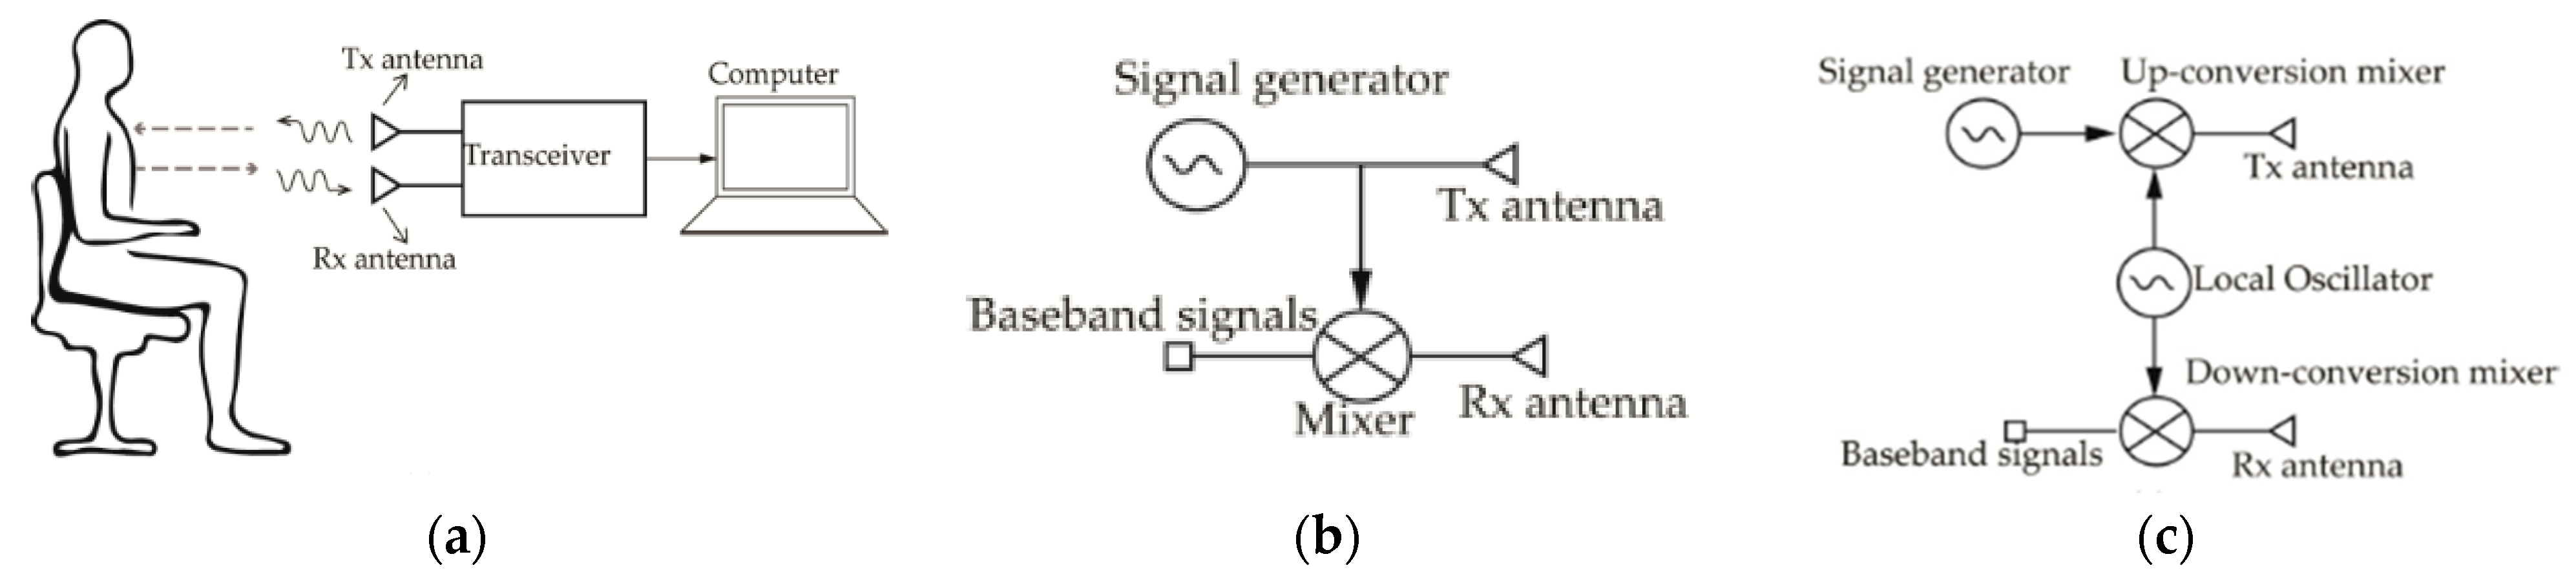

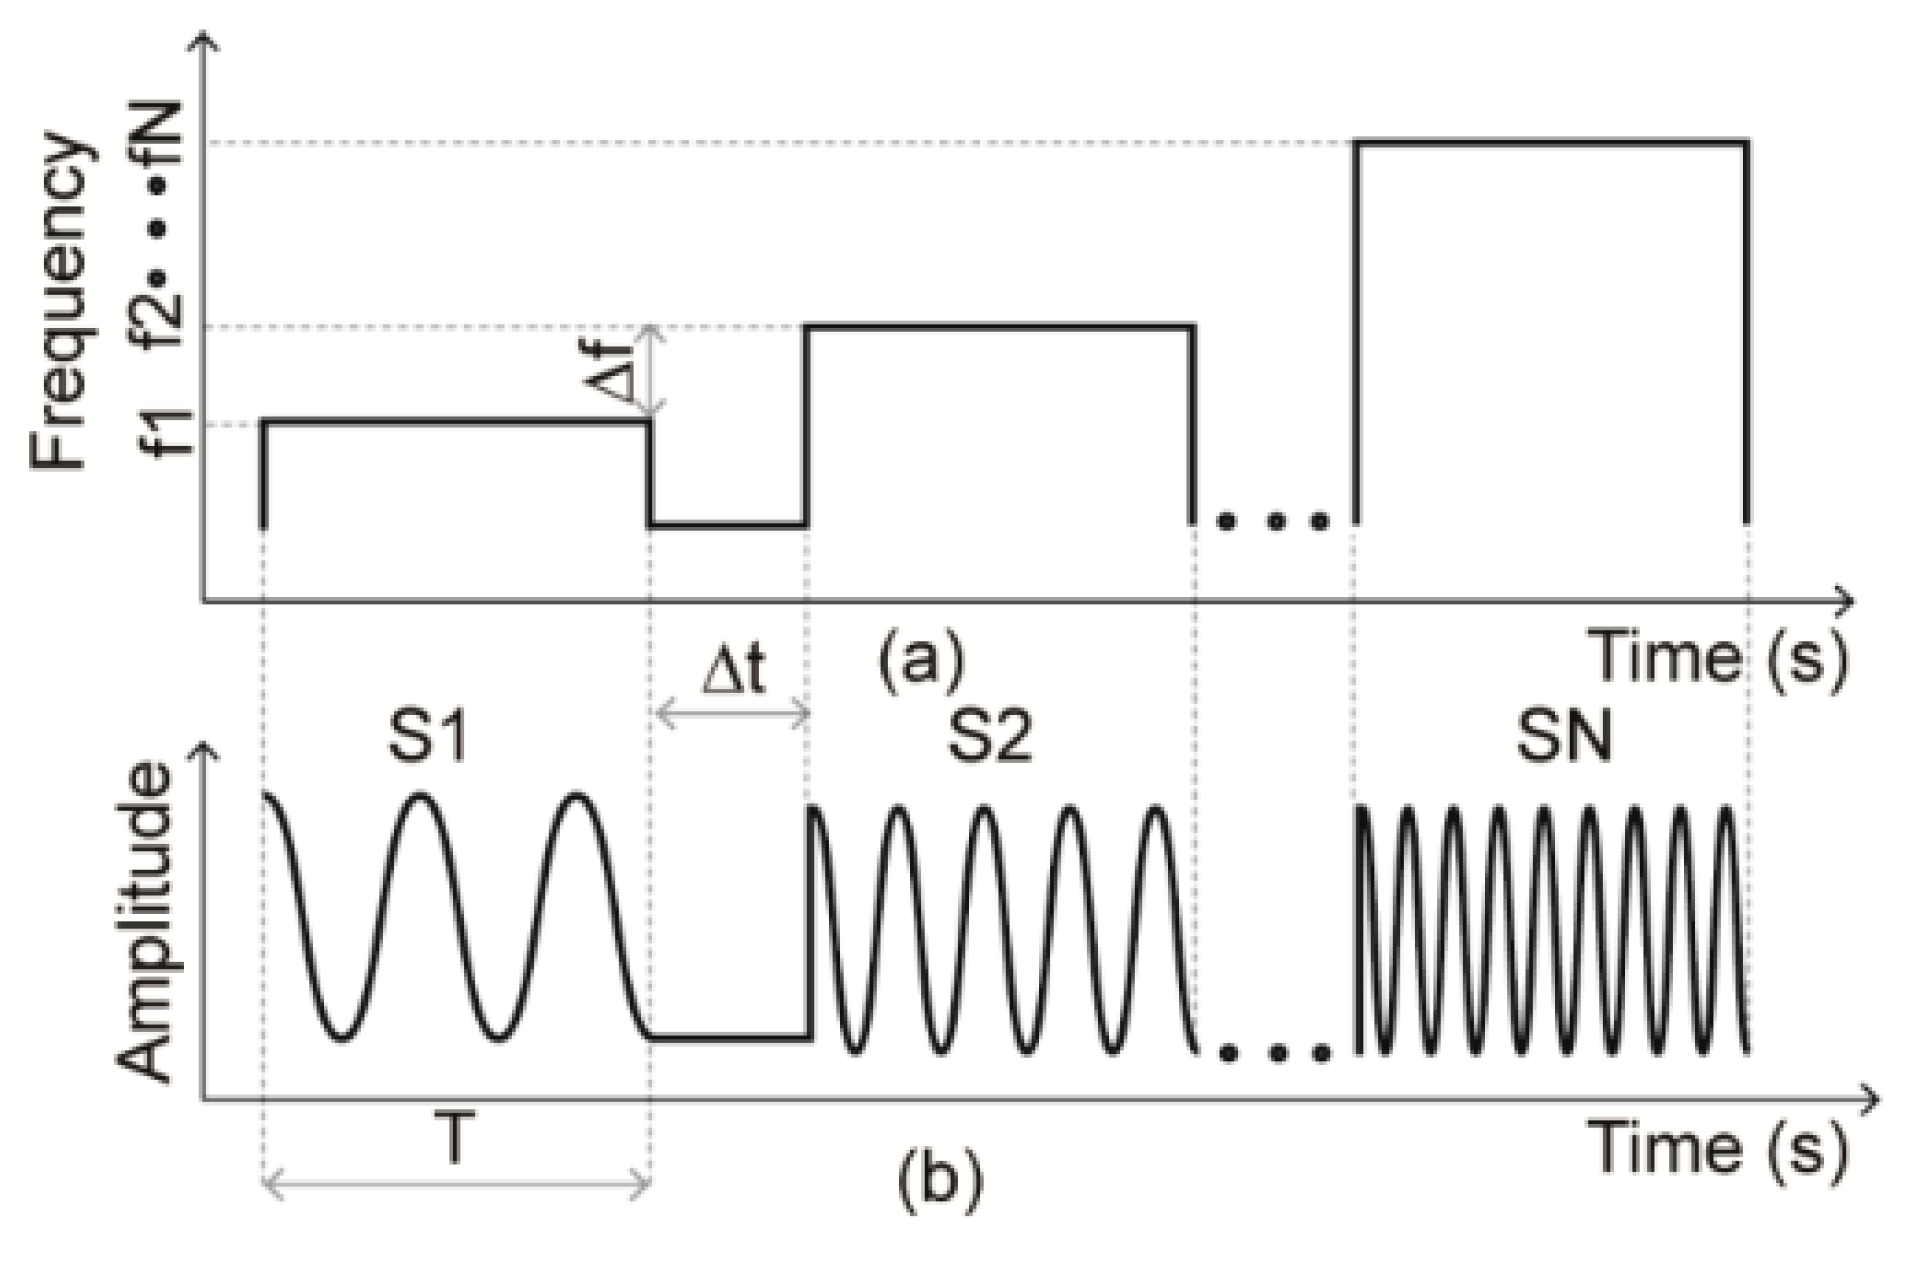
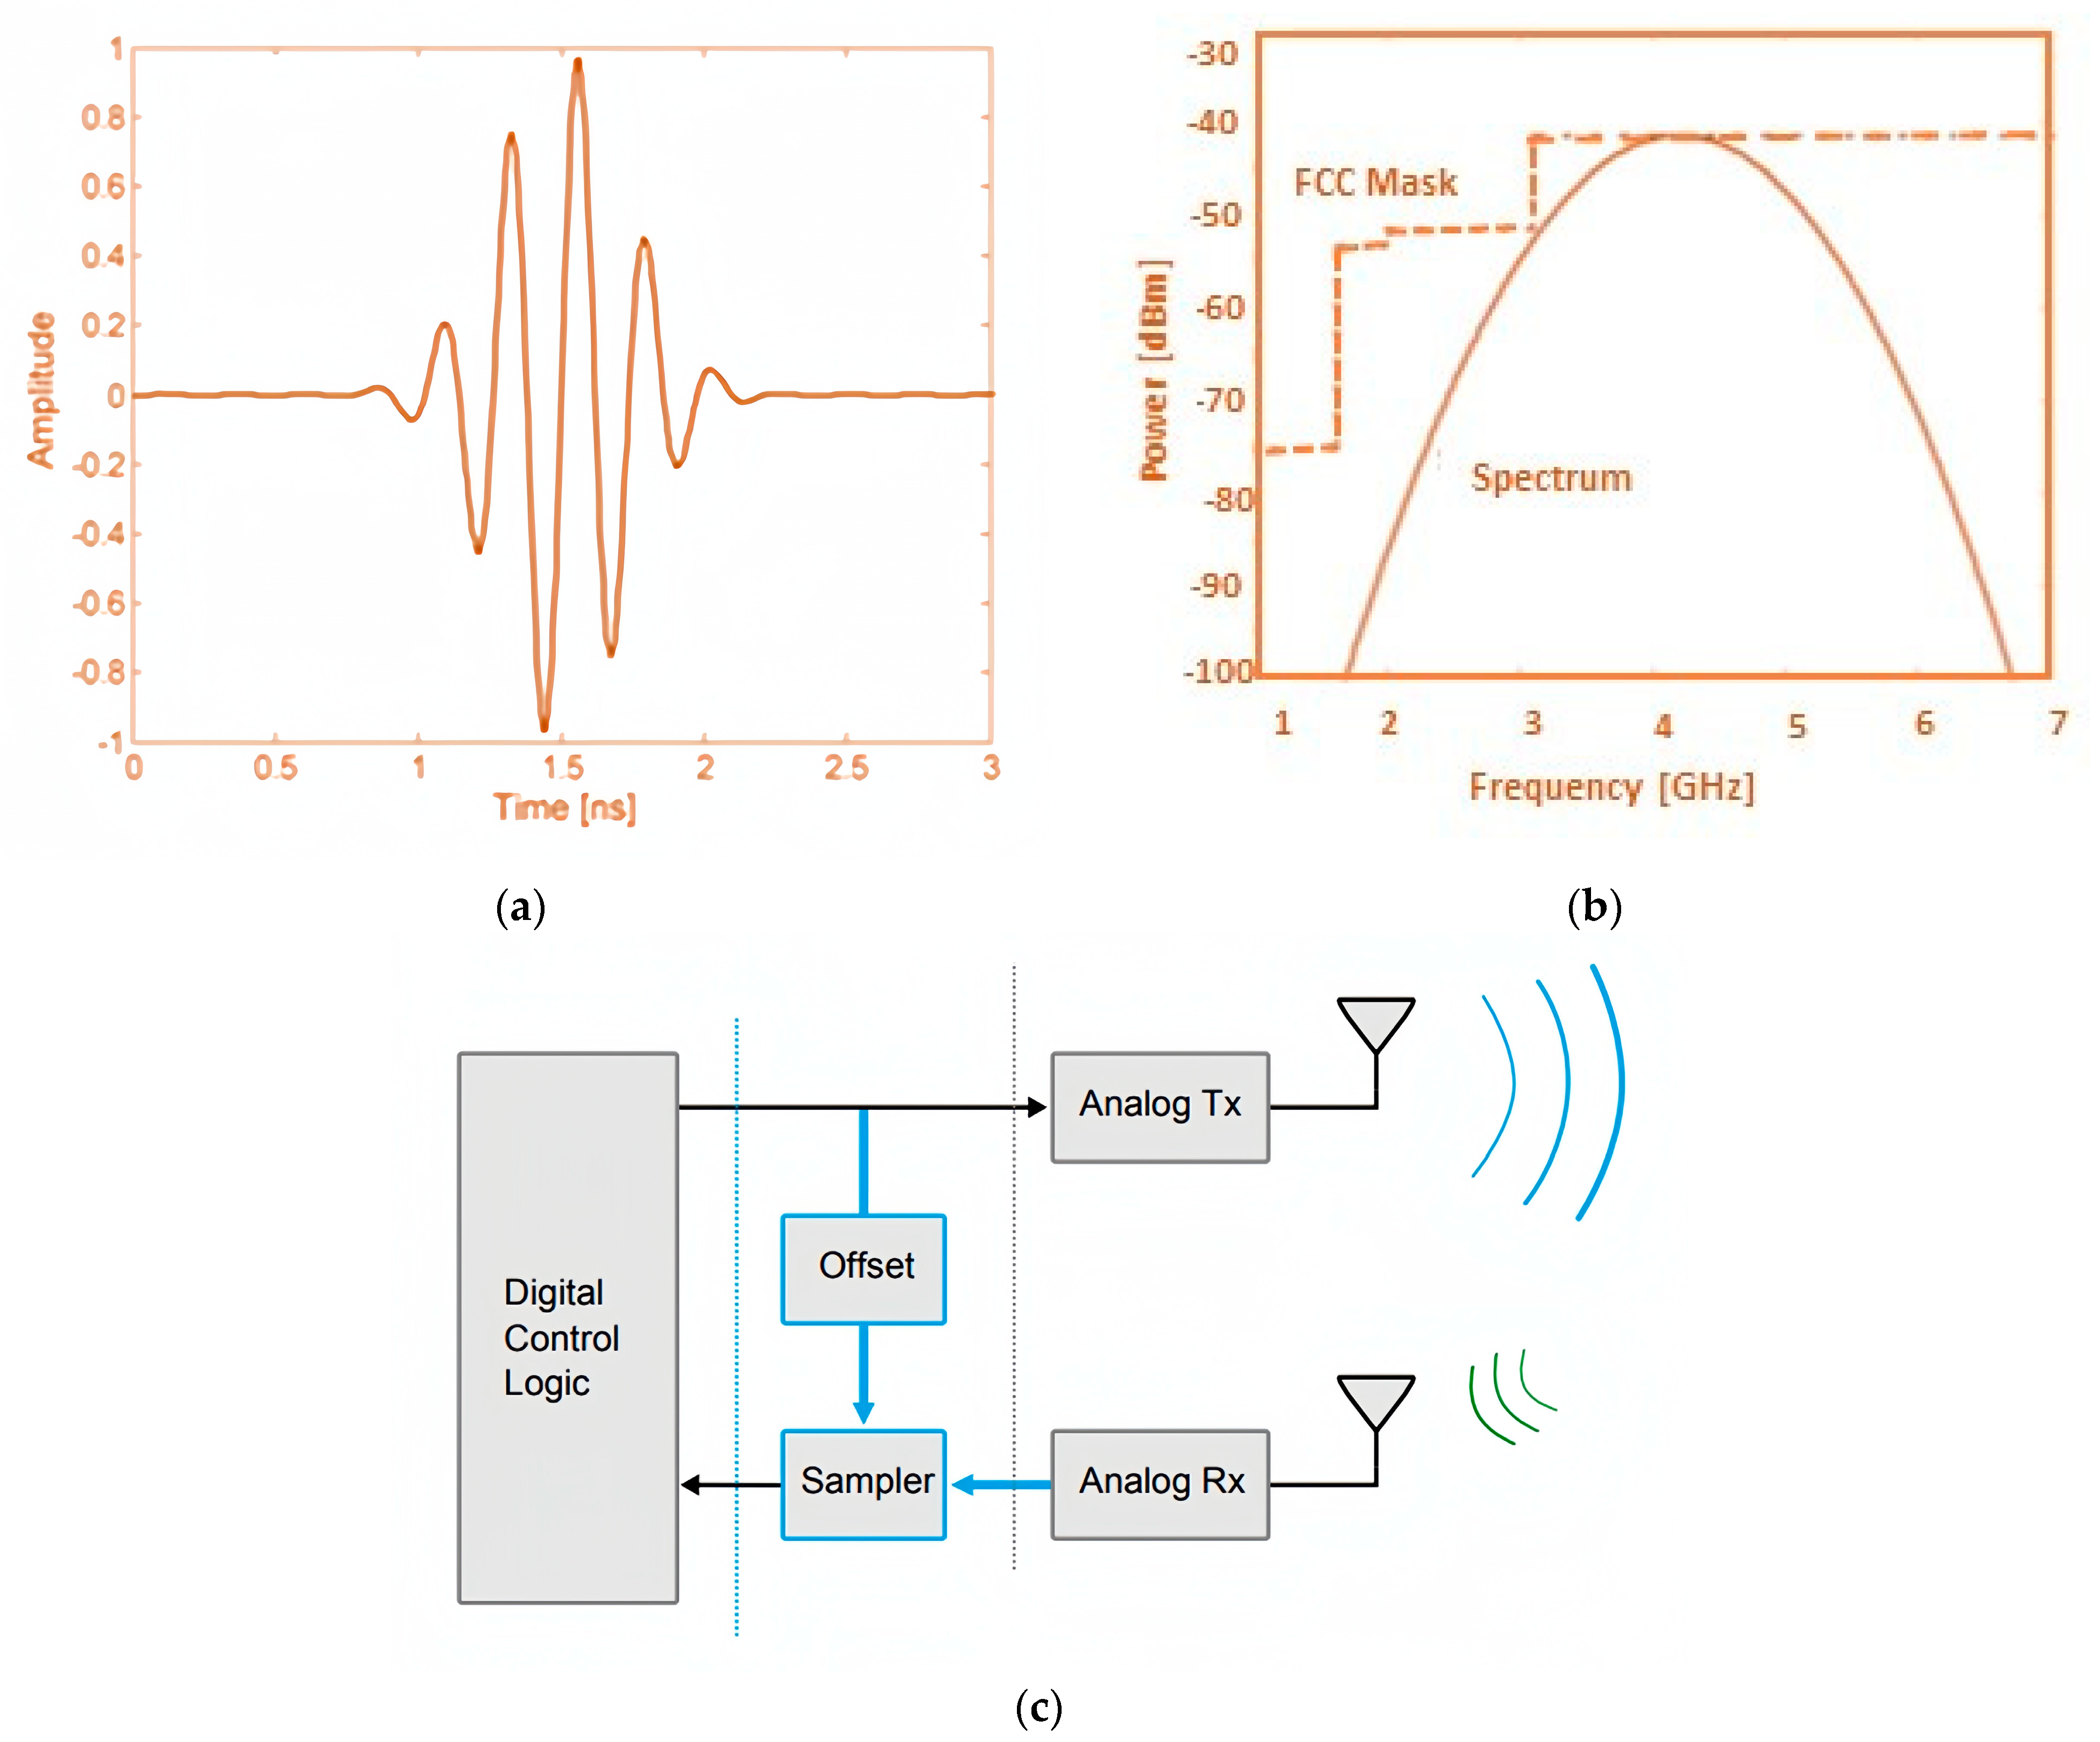
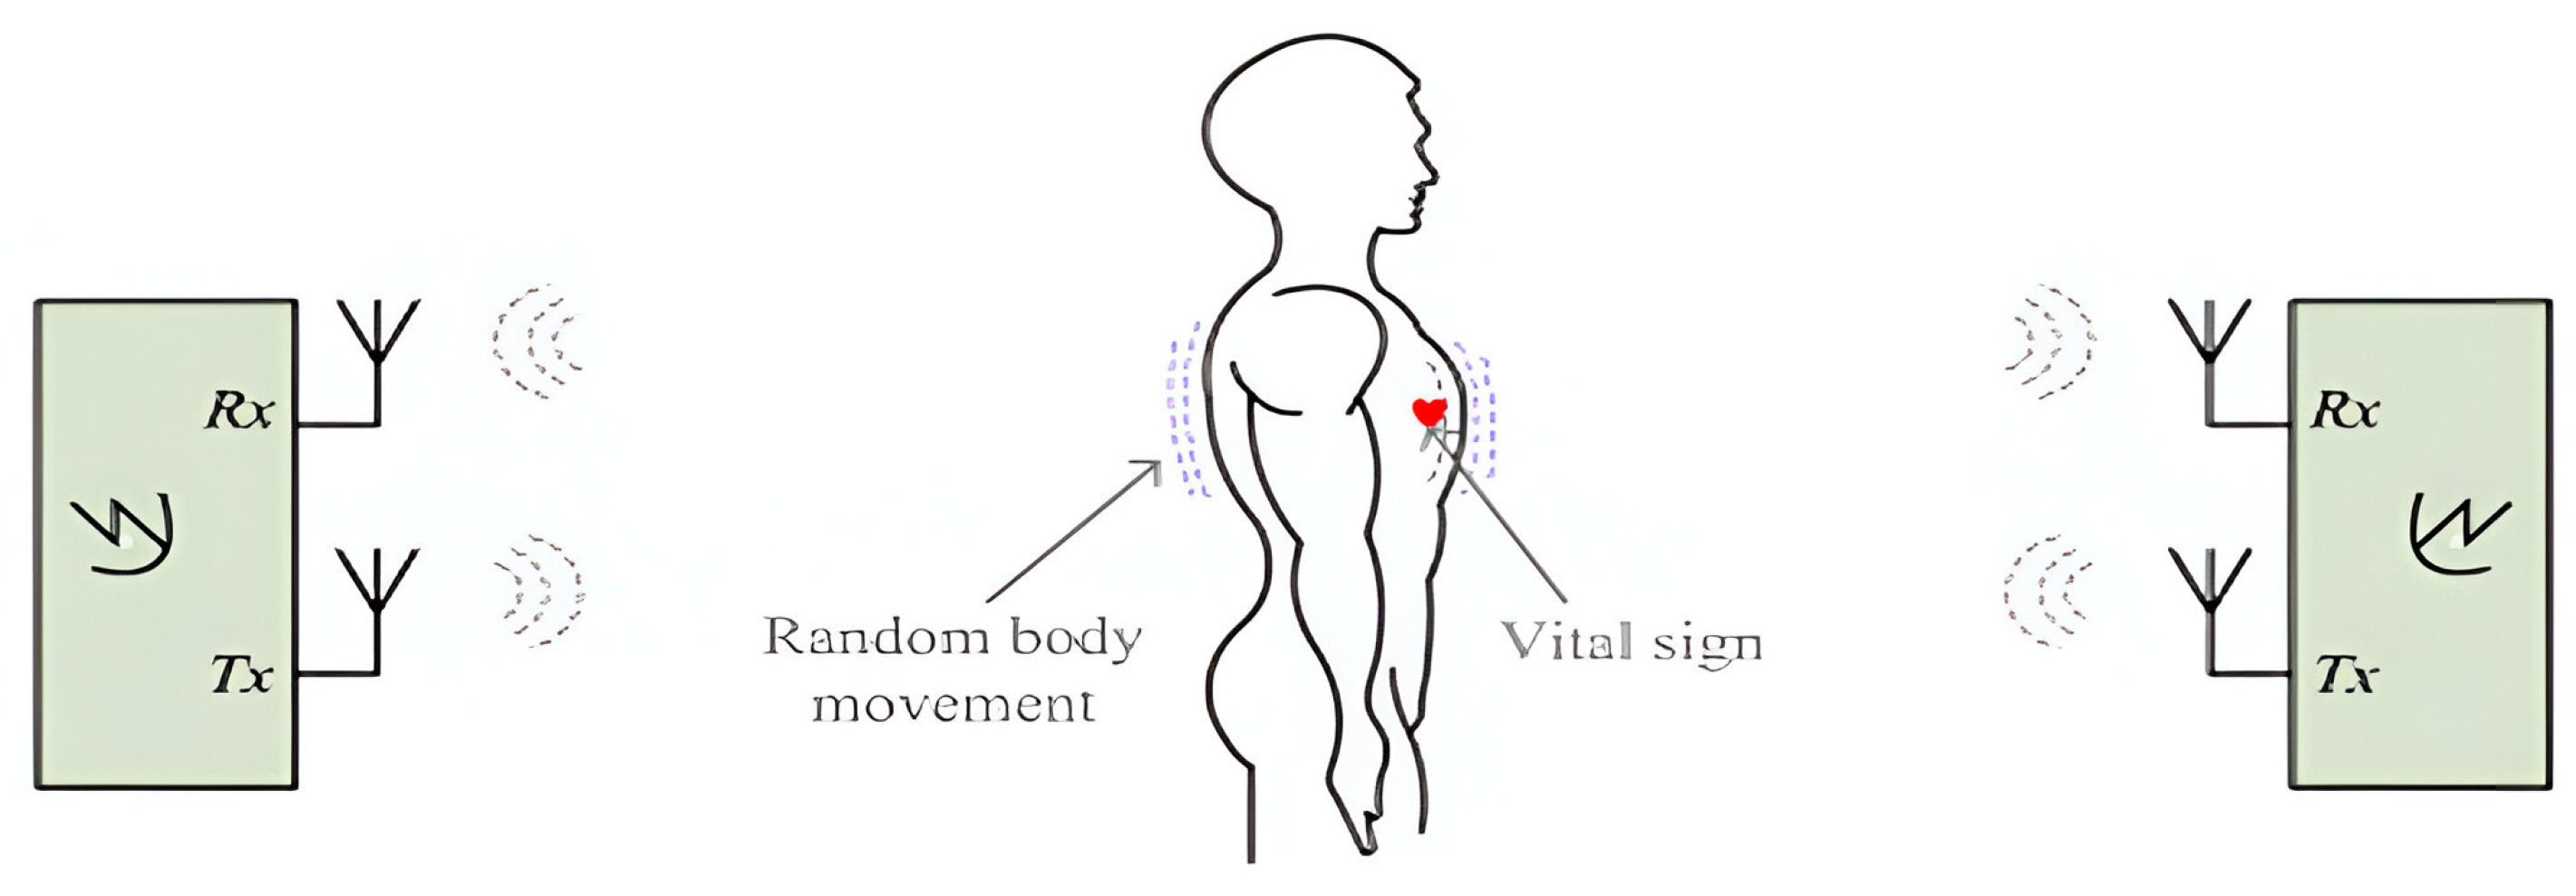
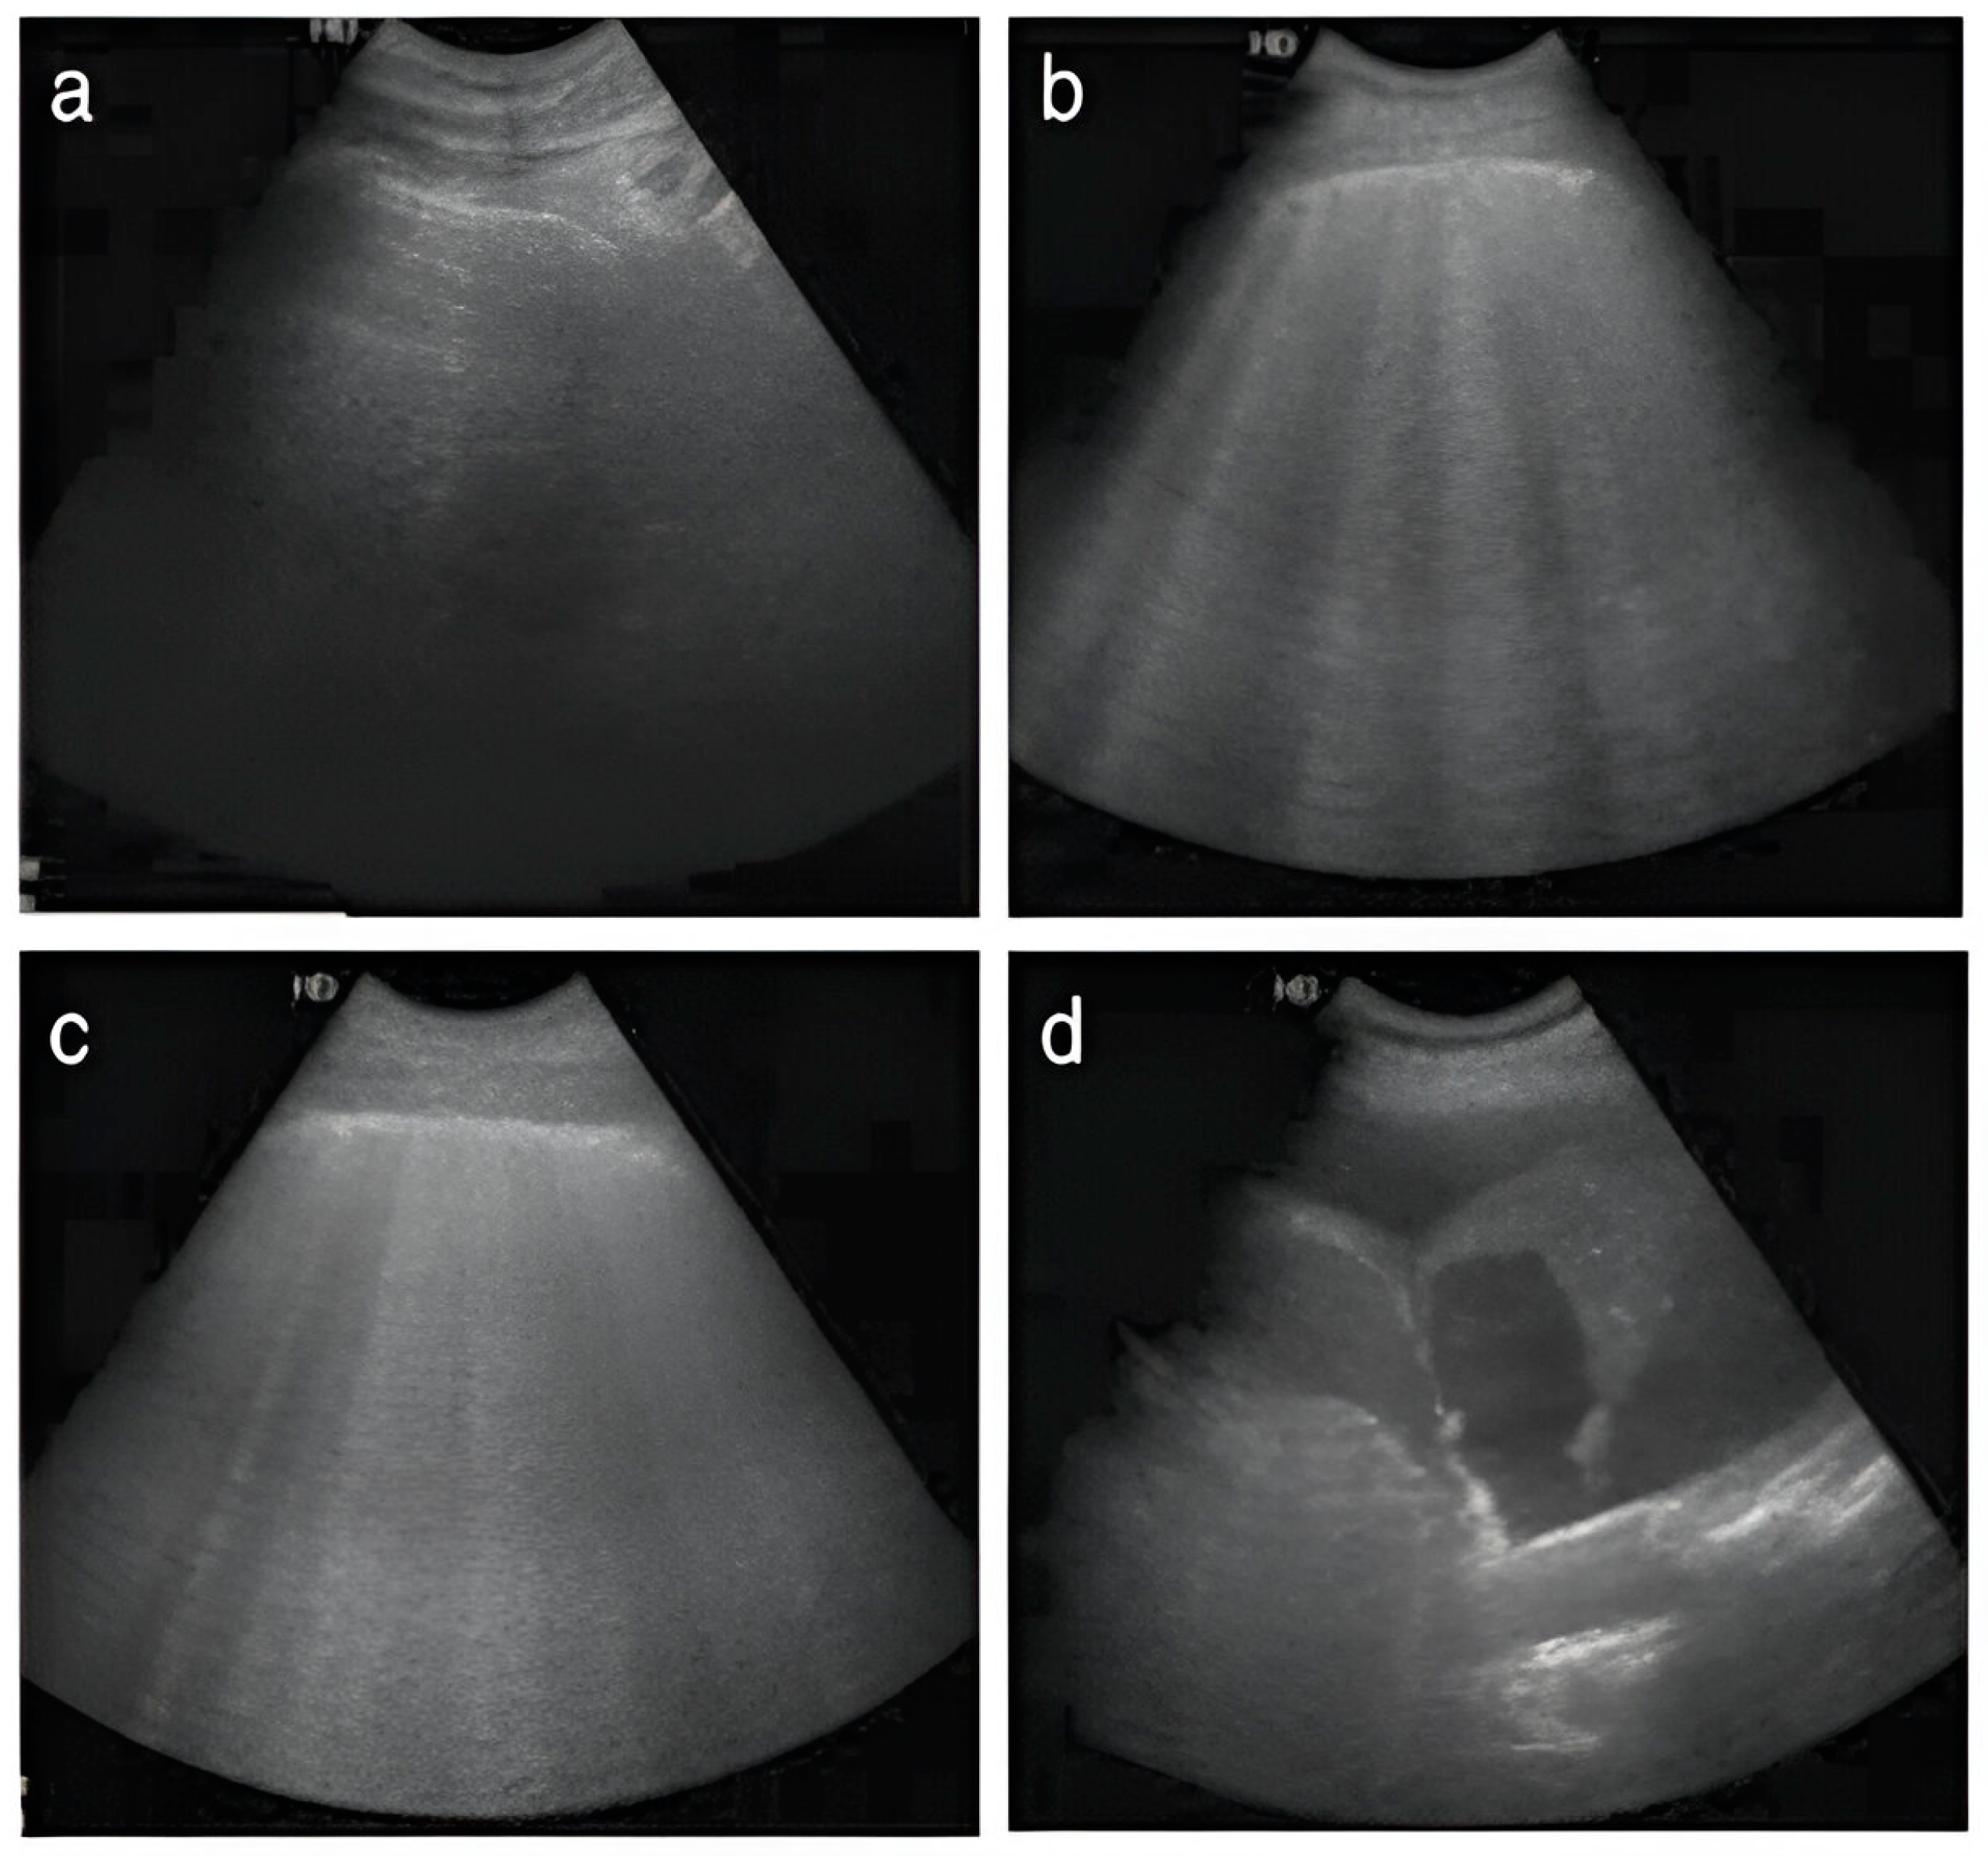
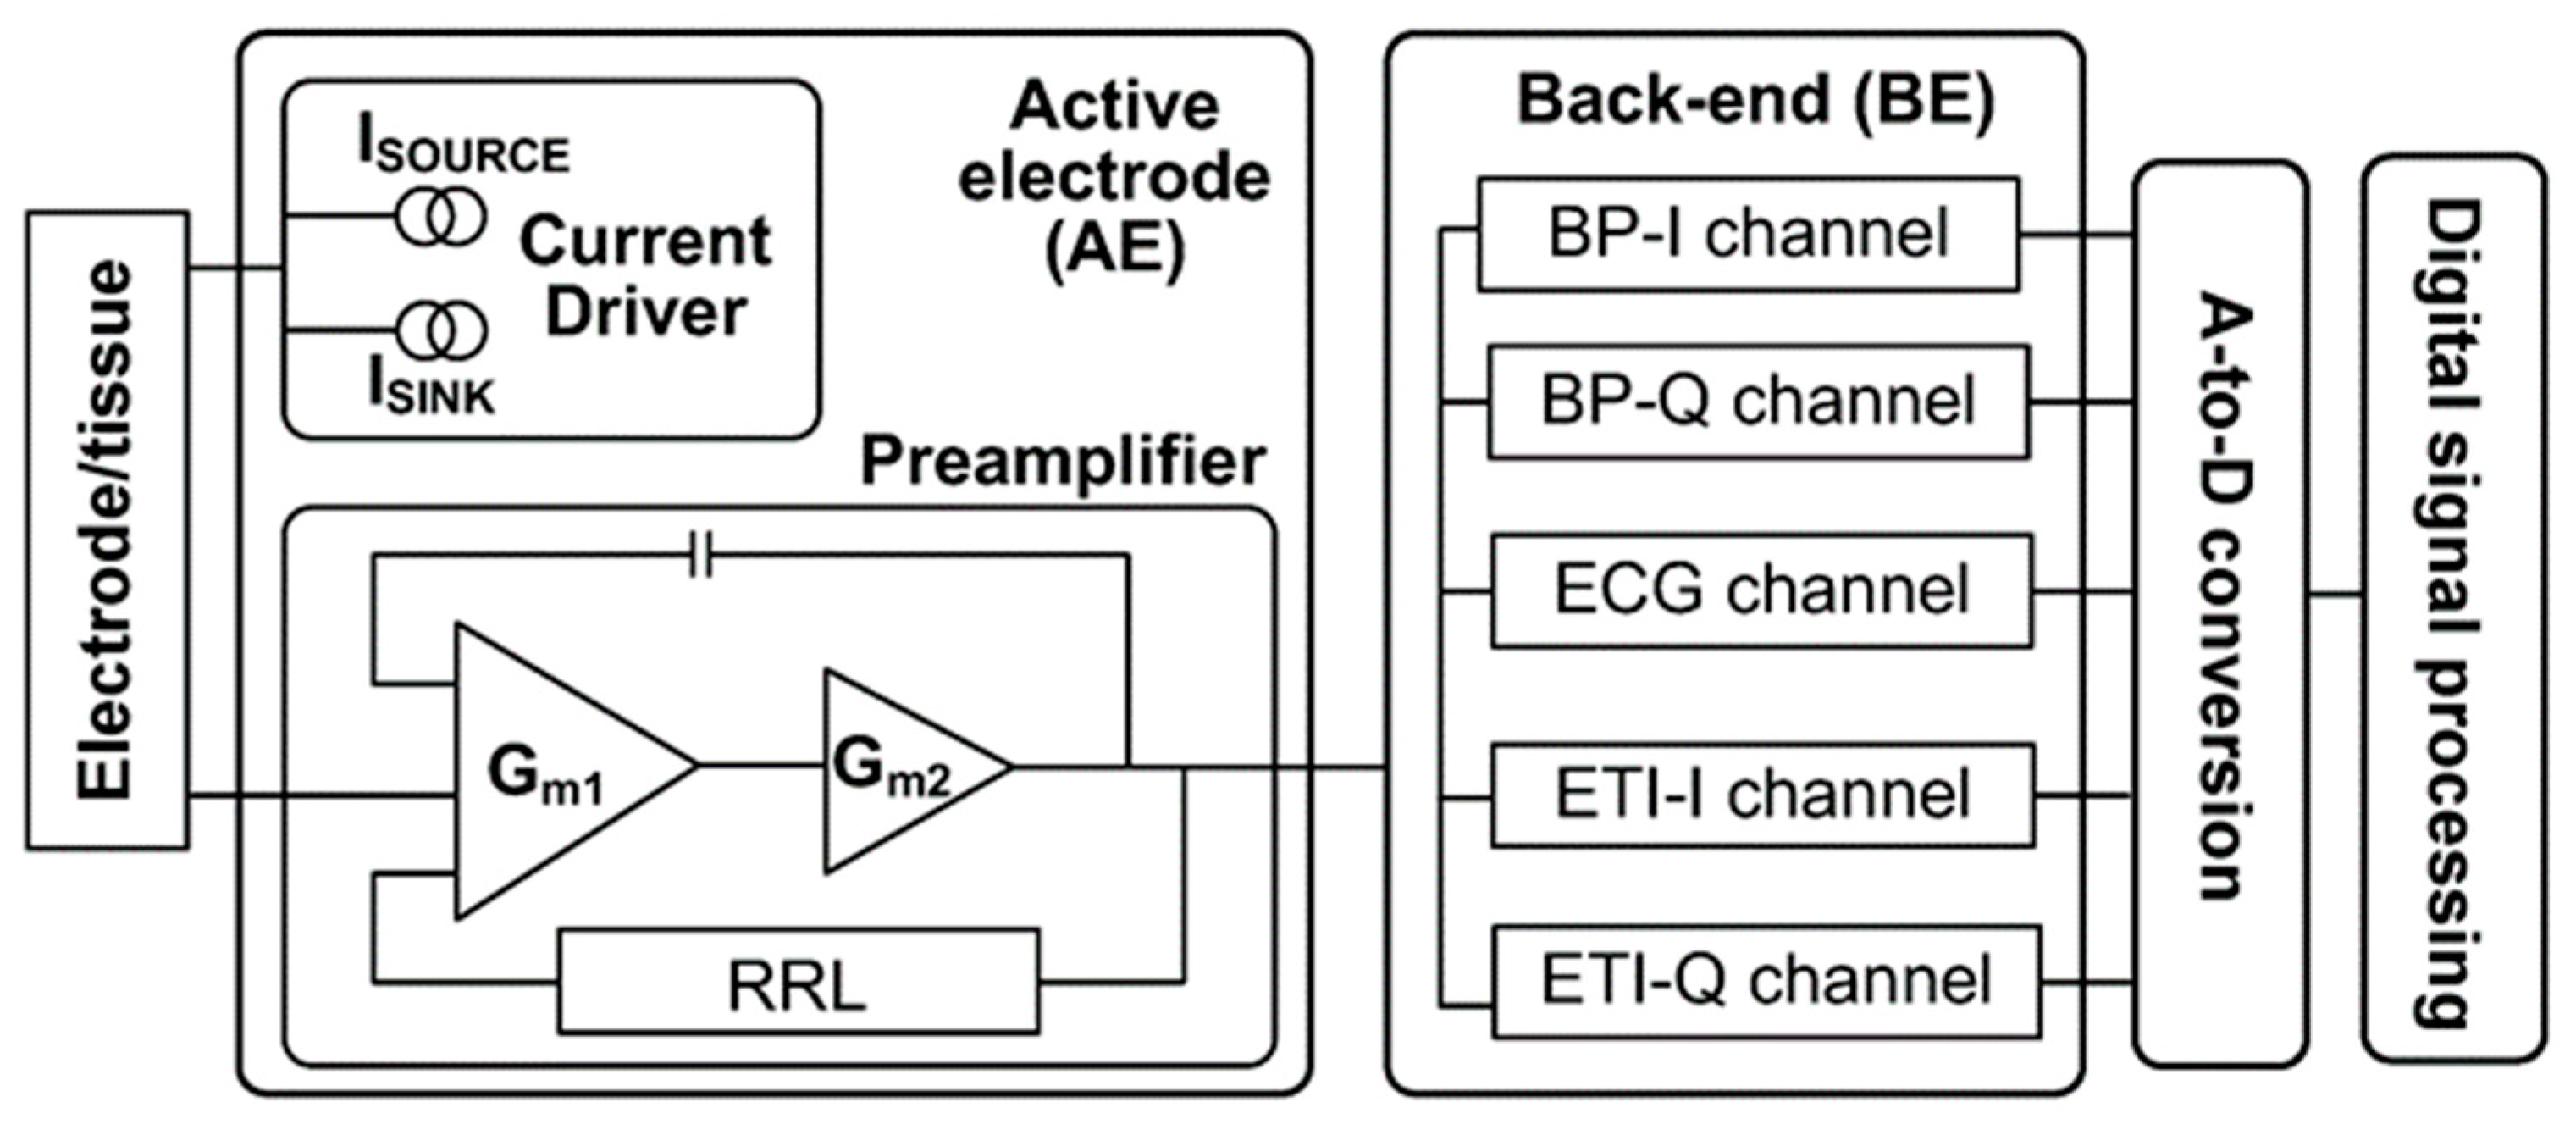
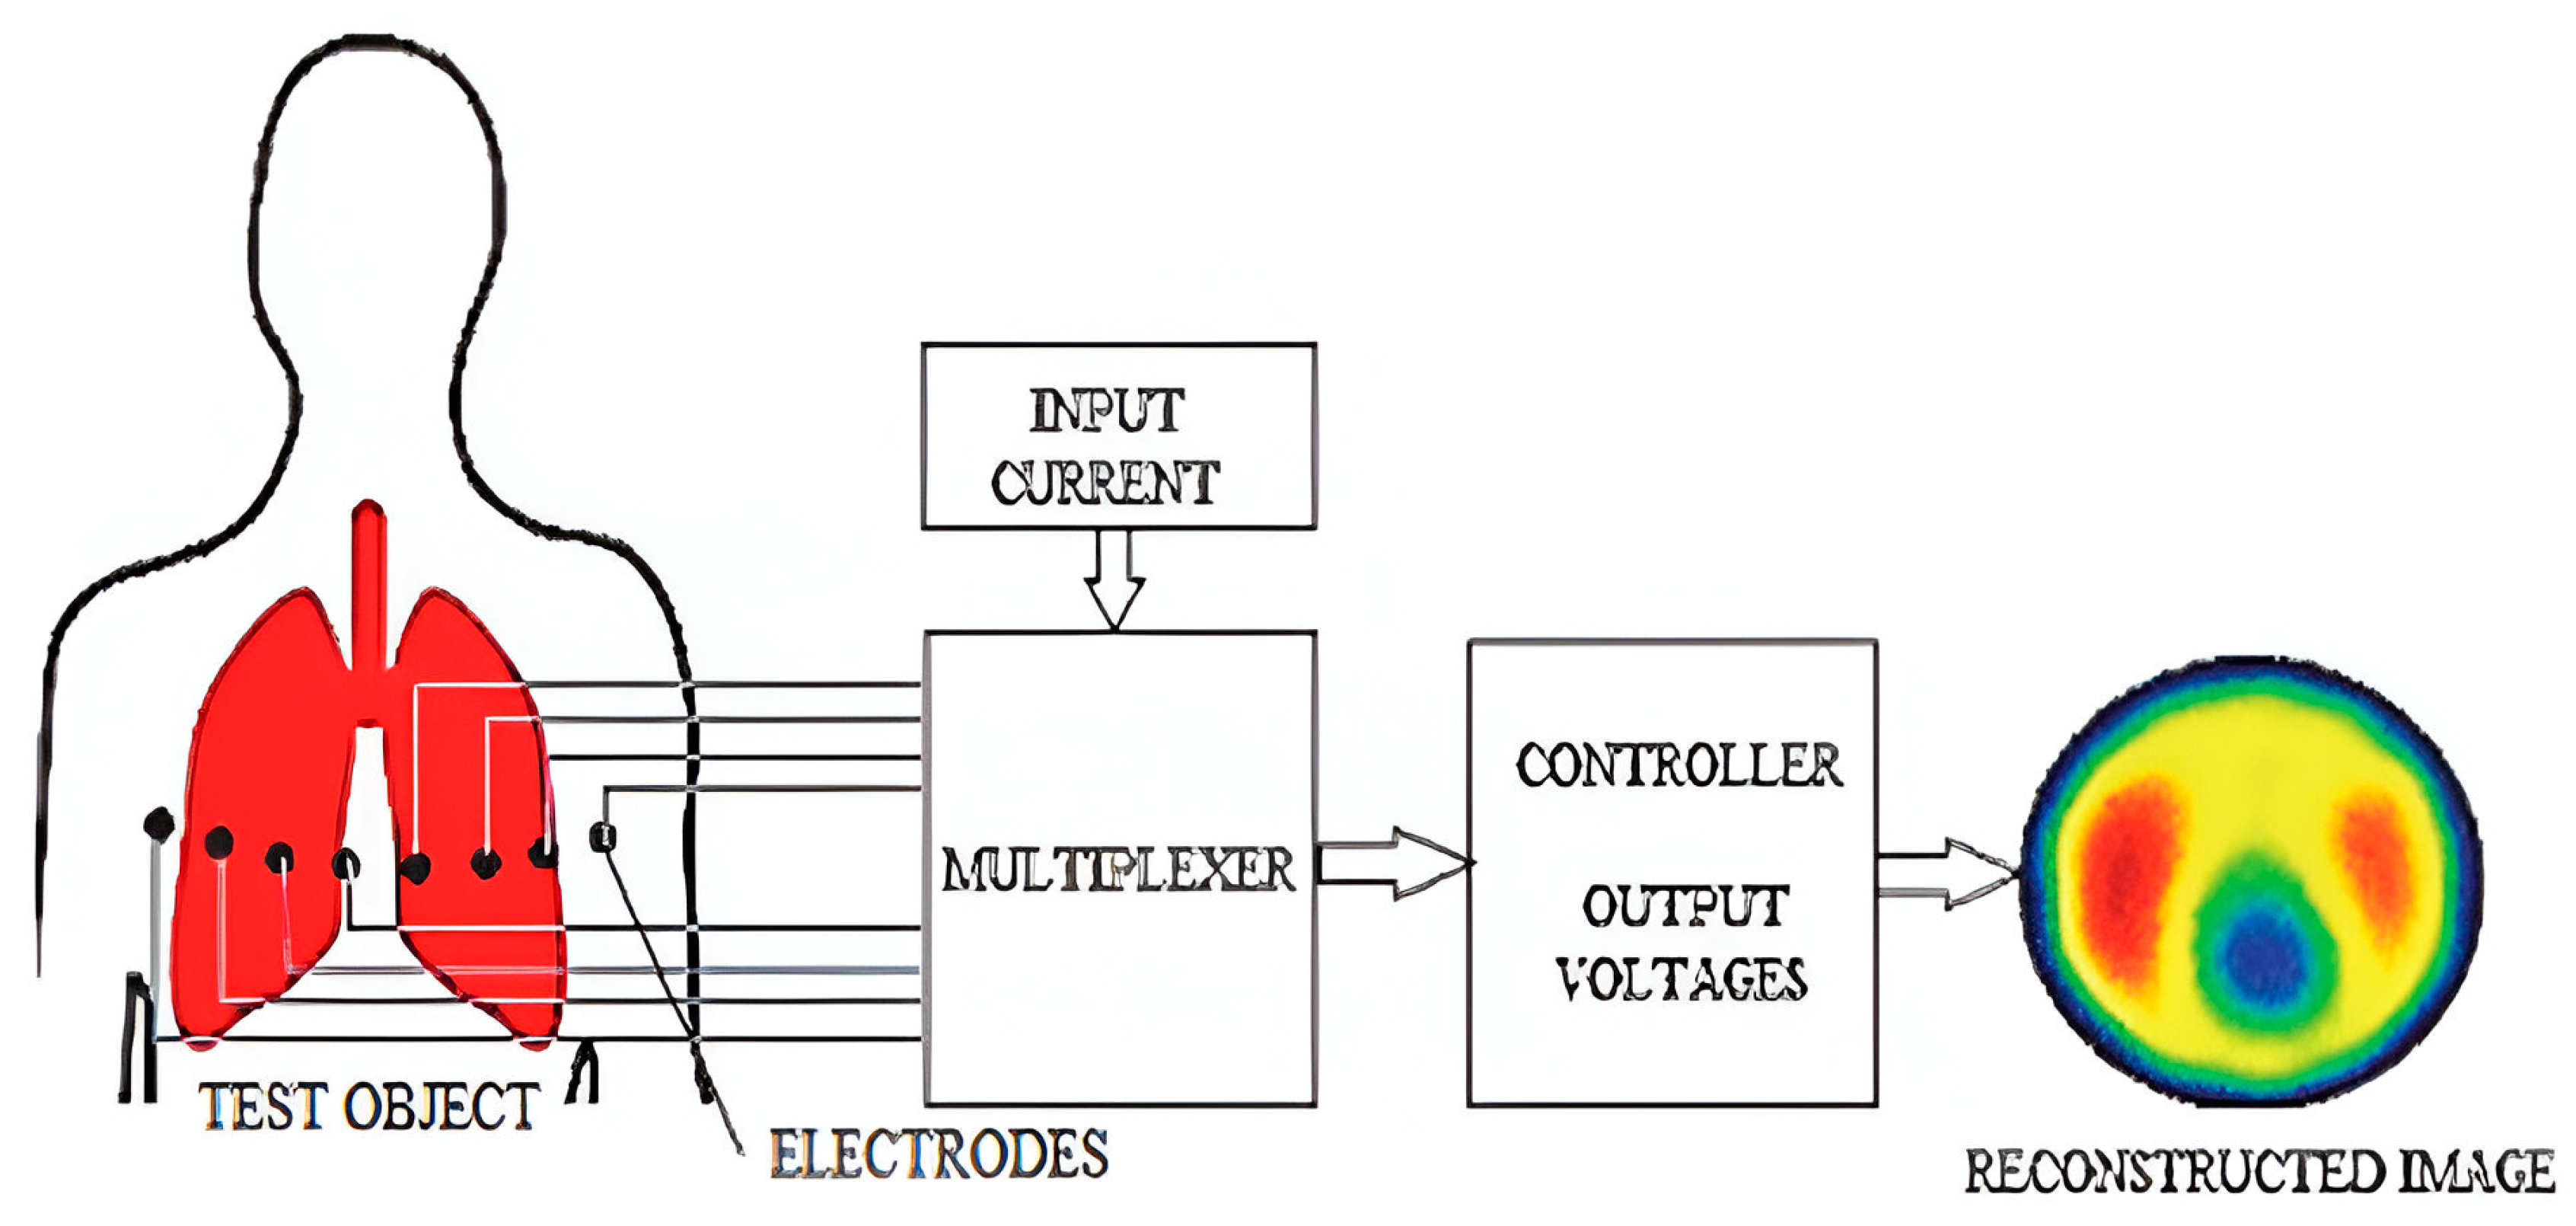

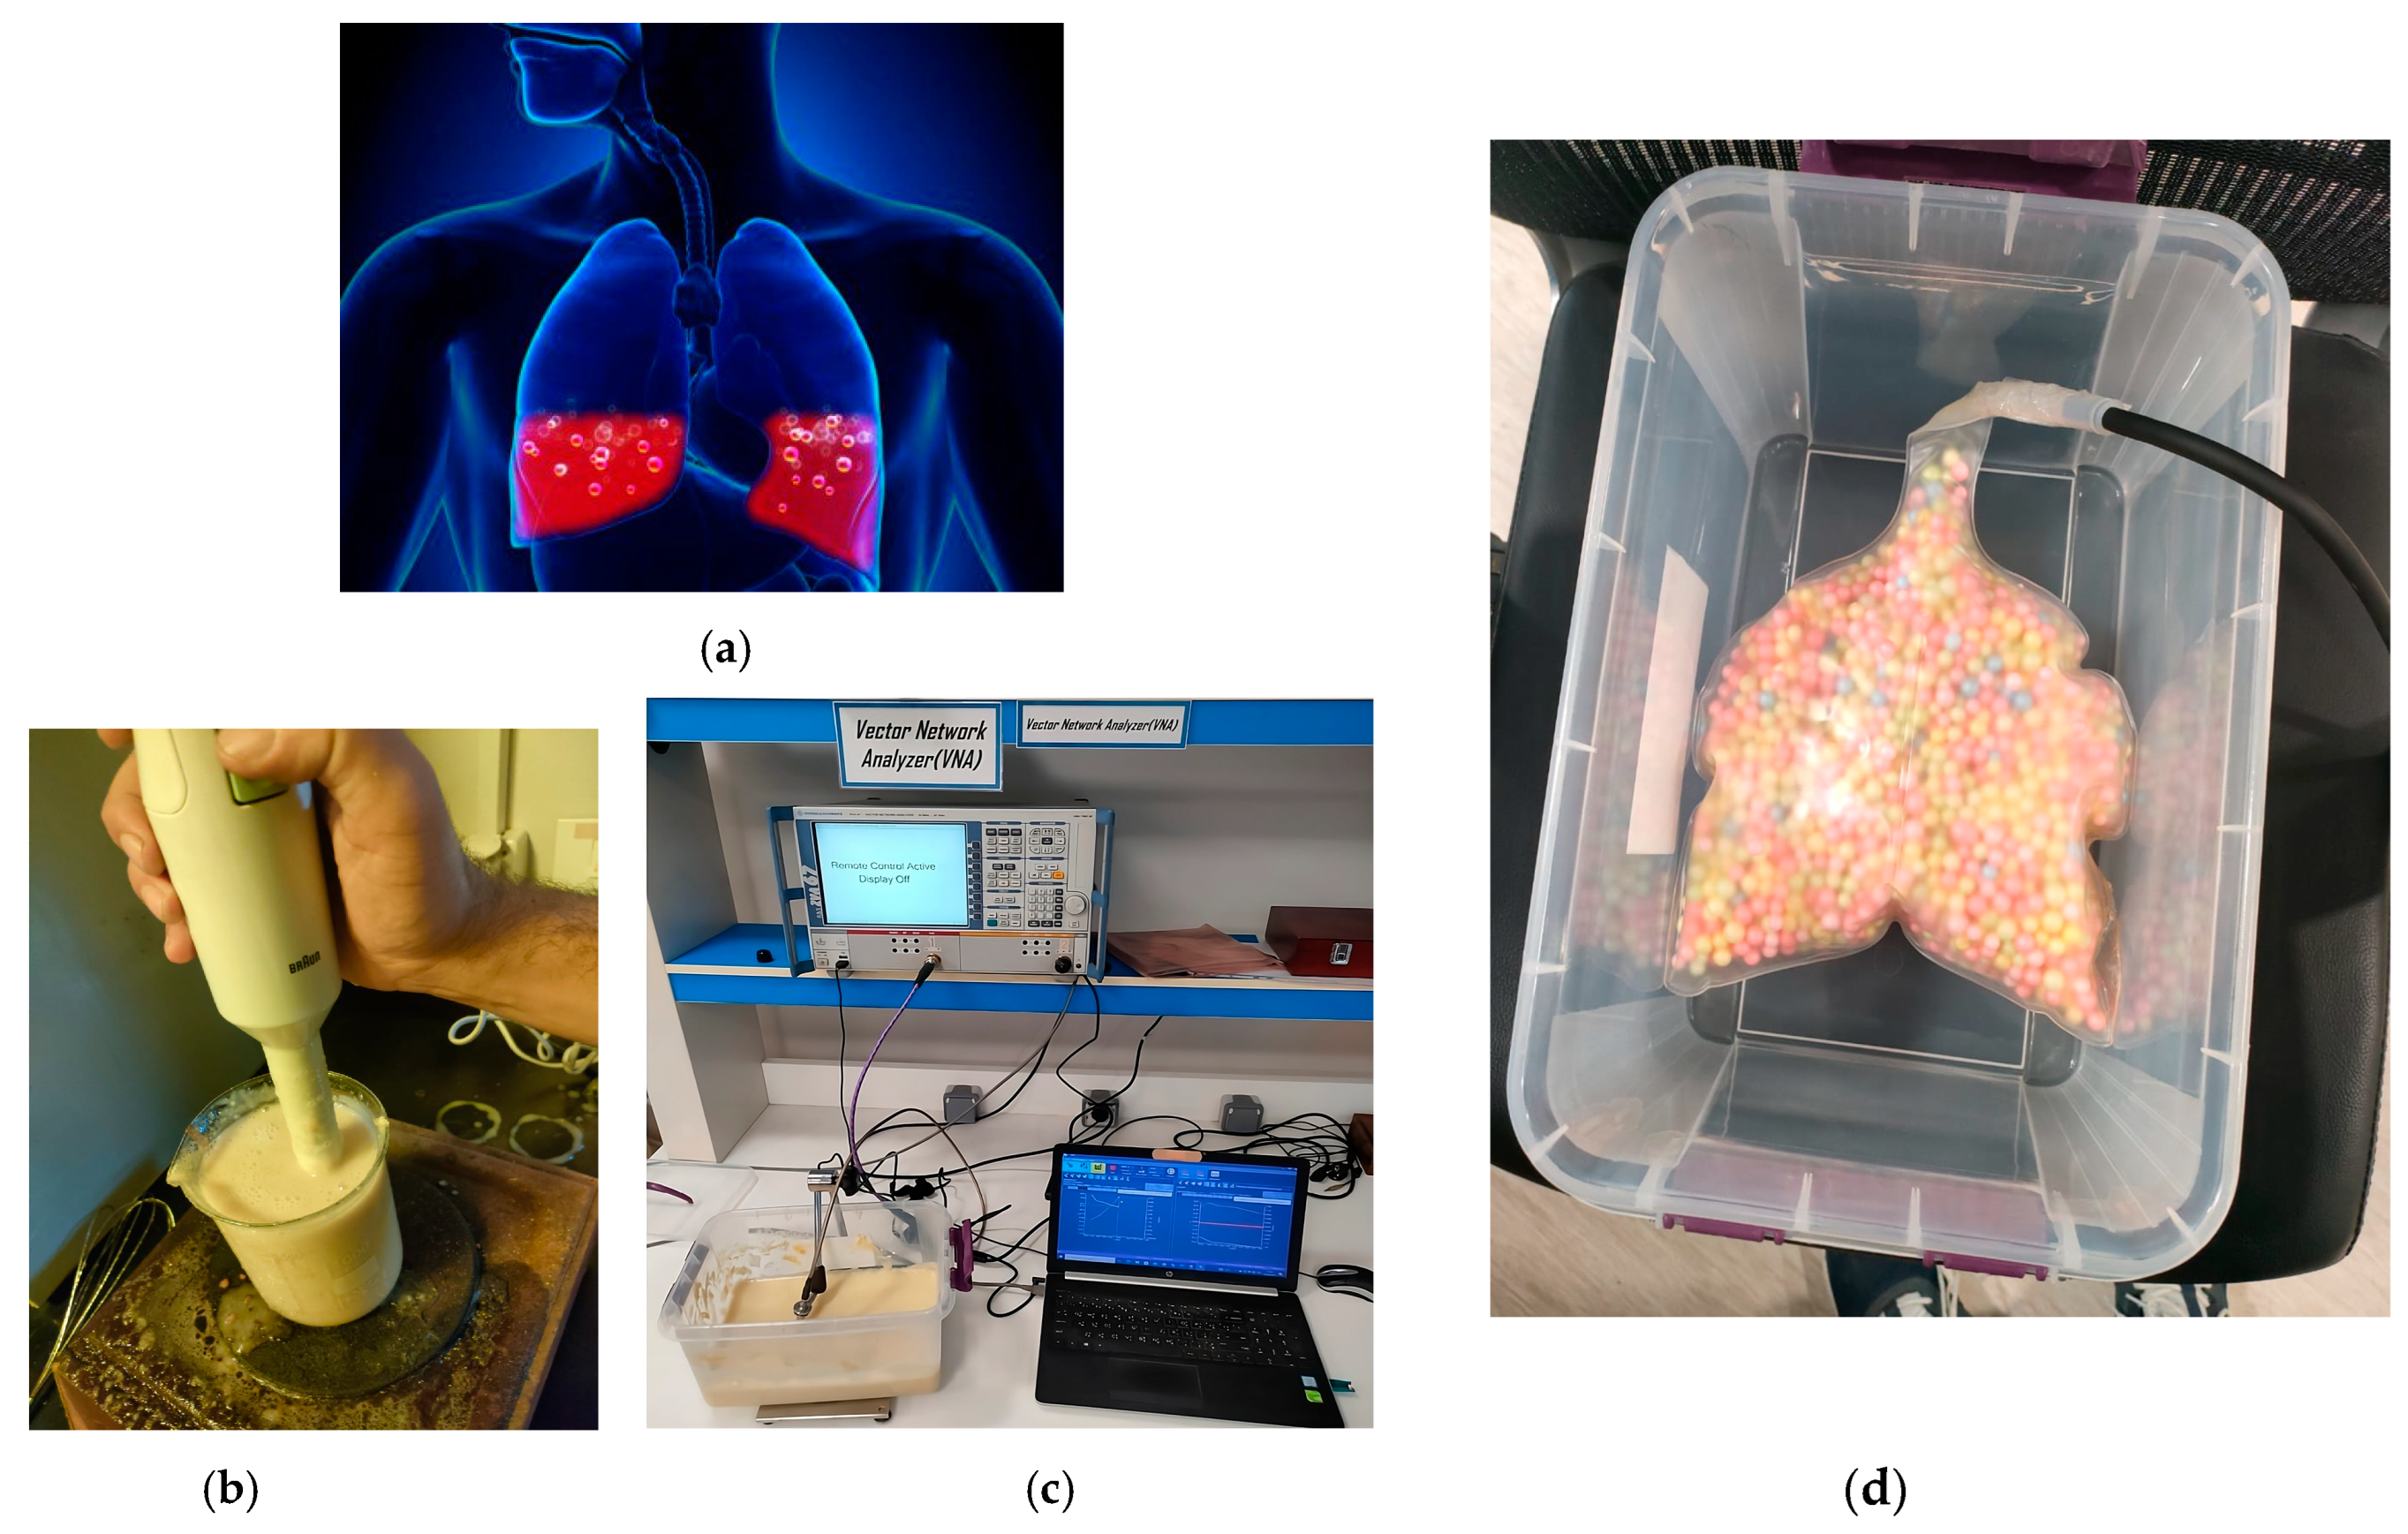
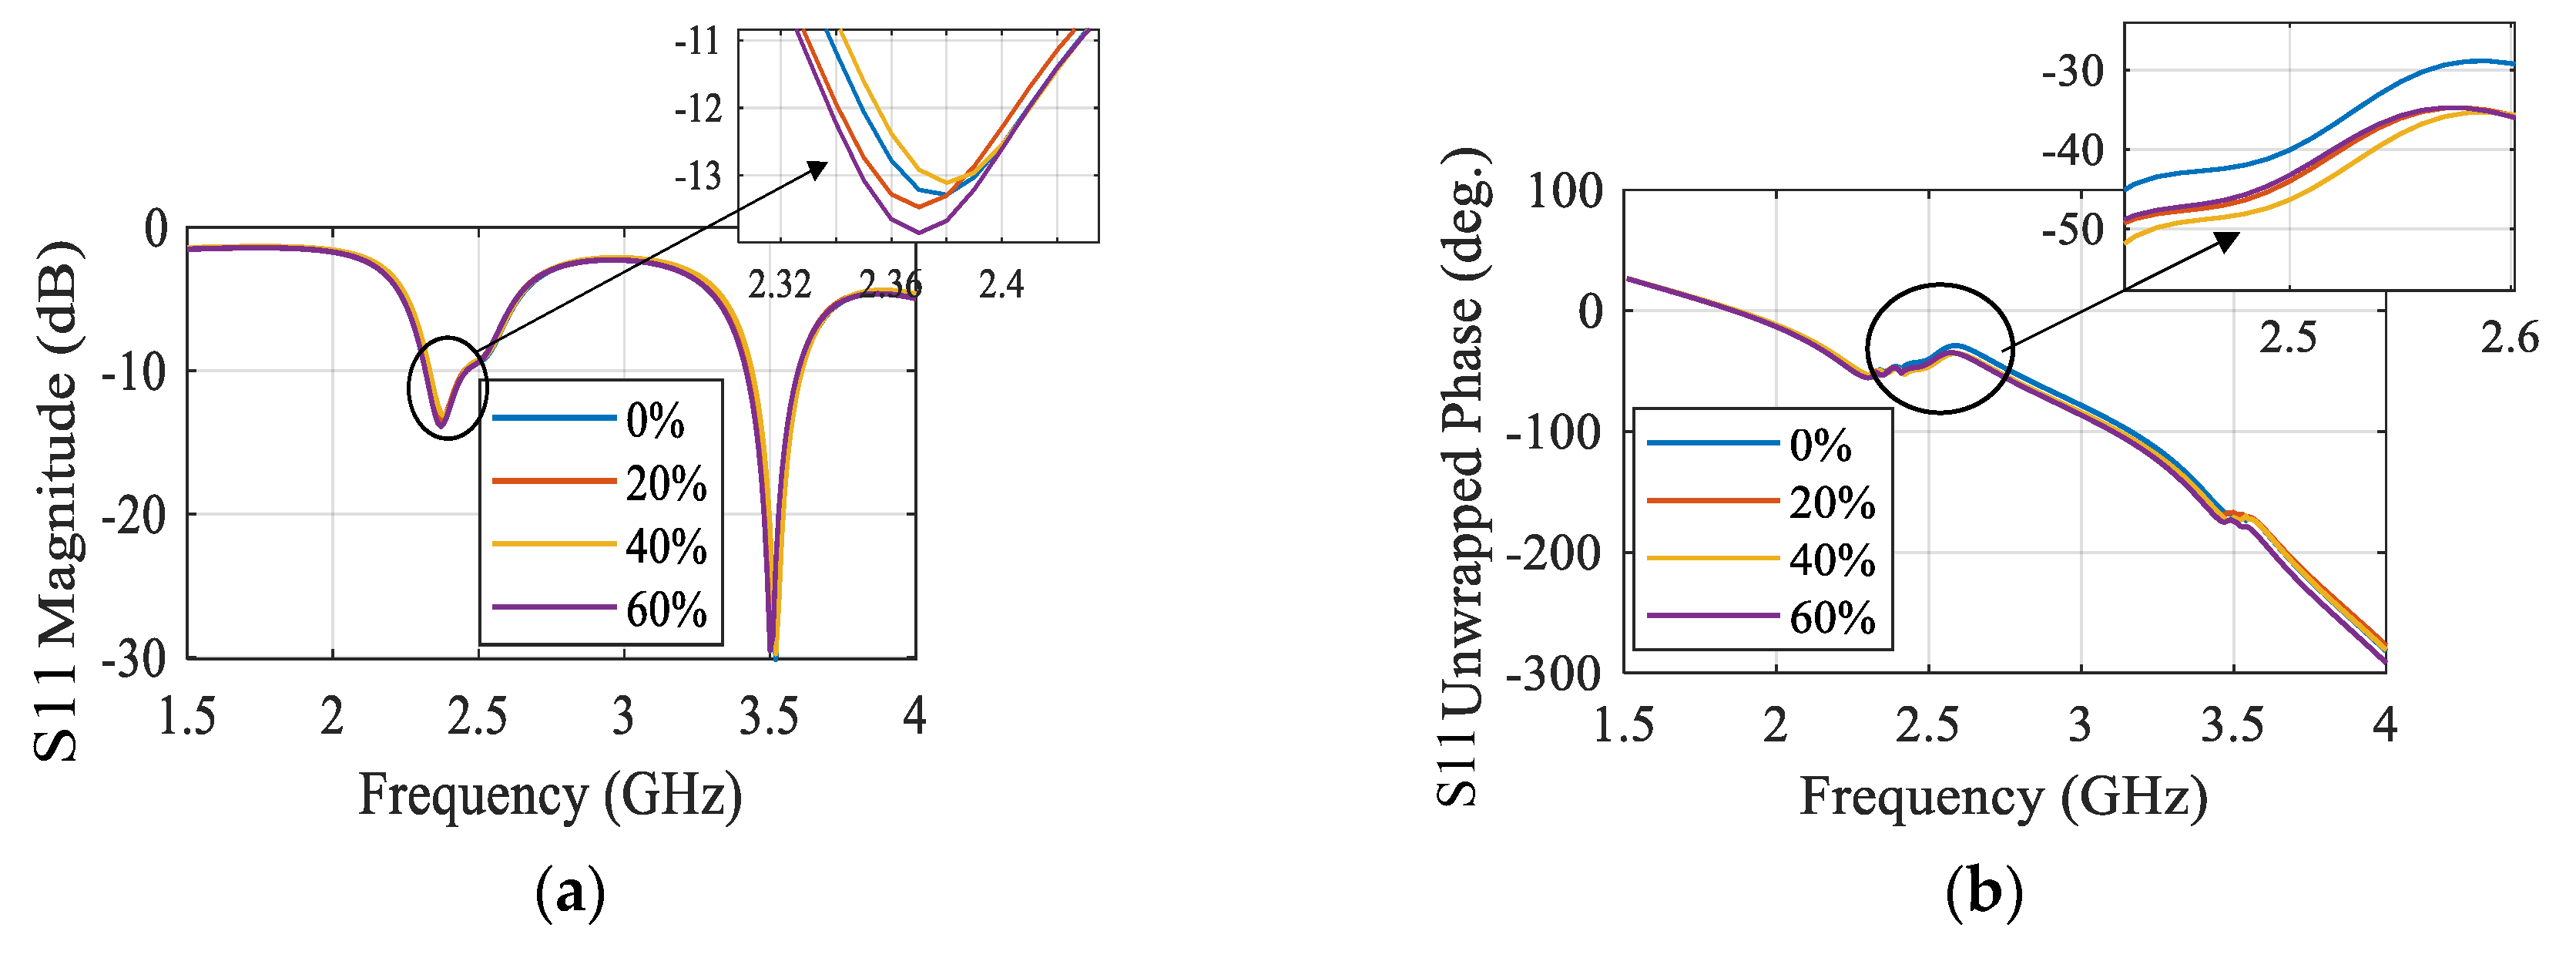
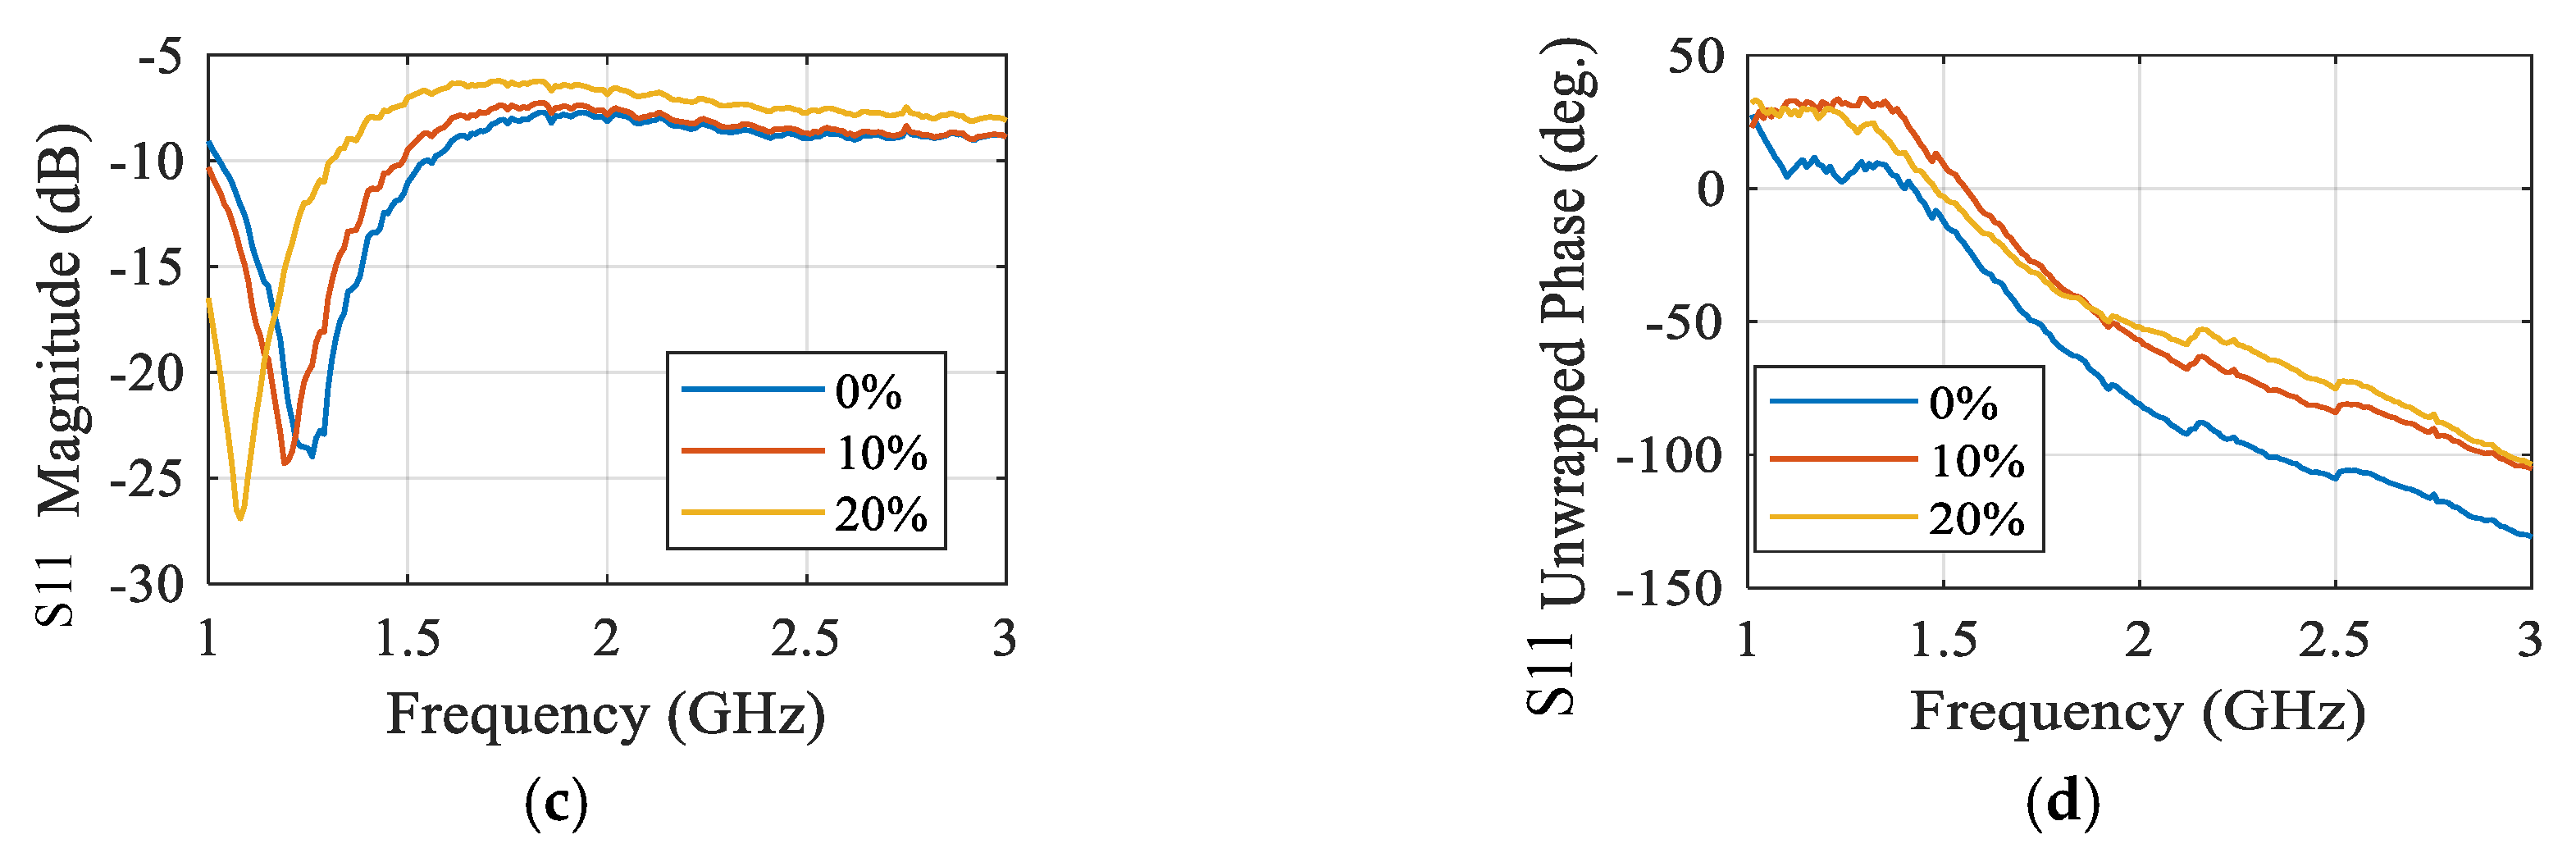
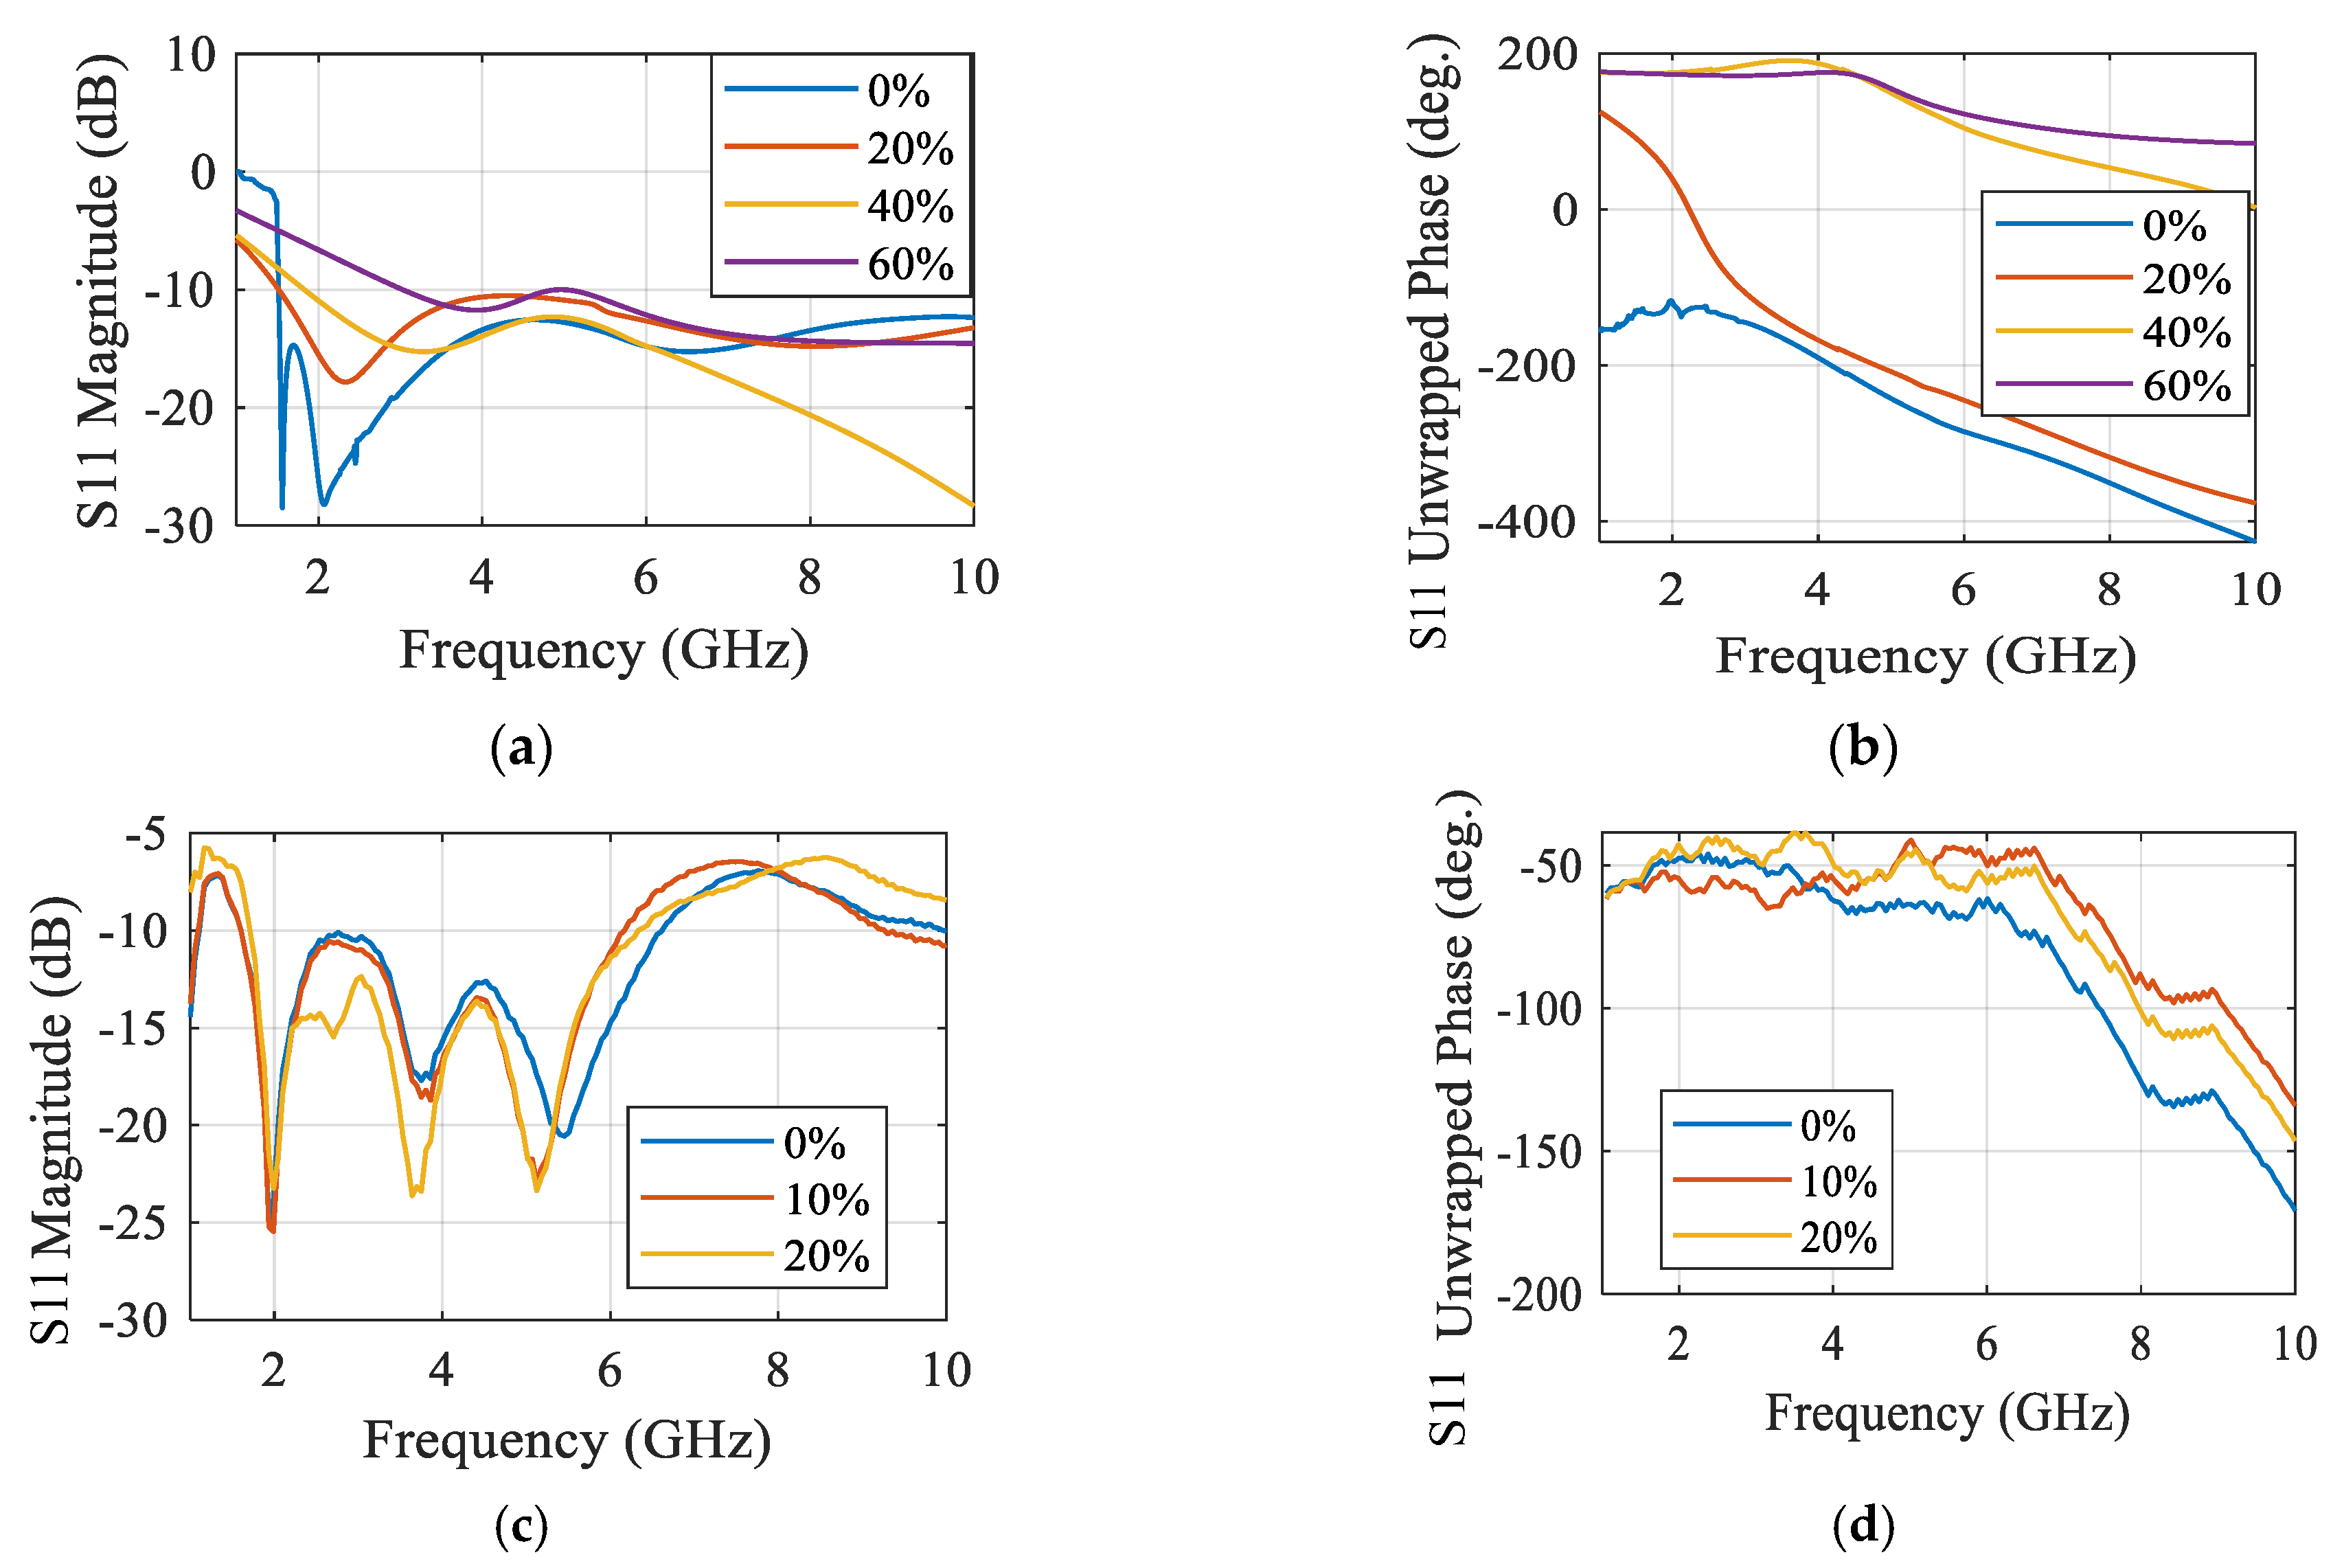
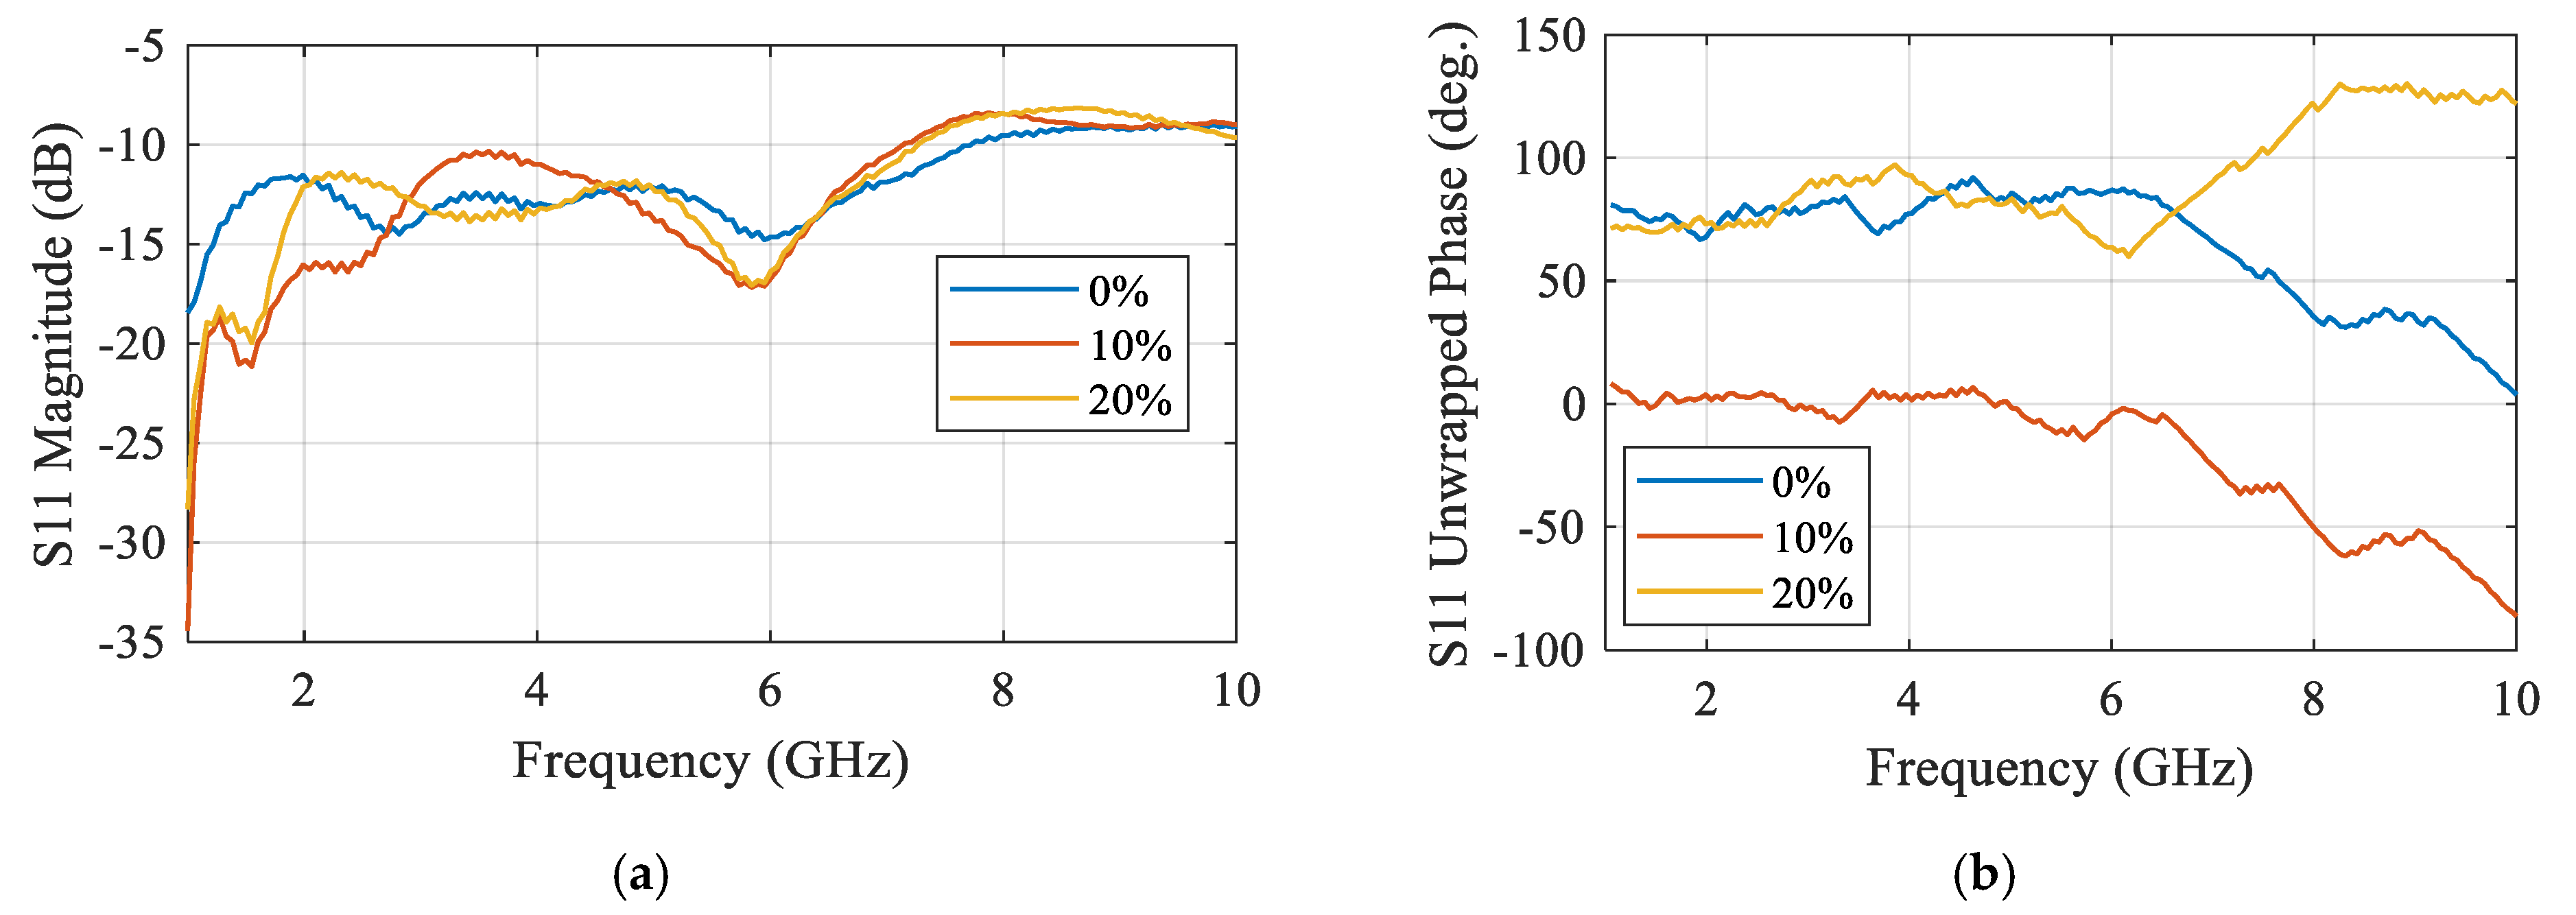
Disclaimer/Publisher’s Note: The statements, opinions and data contained in all publications are solely those of the individual author(s) and contributor(s) and not of MDPI and/or the editor(s). MDPI and/or the editor(s) disclaim responsibility for any injury to people or property resulting from any ideas, methods, instructions or products referred to in the content. |
© 2024 by the authors. Licensee MDPI, Basel, Switzerland. This article is an open access article distributed under the terms and conditions of the Creative Commons Attribution (CC BY) license (https://creativecommons.org/licenses/by/4.0/).