Article

Characterization and Proteomic Profiling of Hepatocyte-like Cells Derived from Human Wharton’s Jelly Mesenchymal Stromal Cells: De Novo Expression of Liver-Specific Enzymes

by
Melania Lo Iacono
1,*,†,
Simona Corrao
2,†,
Giusi Alberti
1,
Giandomenico Amico
3,4,
Francesca Timoneri
3,4,
Eleonora Russo
5,
Annamaria Cucina
6,
Sergio Indelicato
6,
Francesca Rappa
1,7,
Tiziana Corsello
8,
Salvatore Saieva
9,
Antonino Di Stefano
10,
Francesca Di Gaudio
6,
Pier Giulio Conaldi
3 and
Giampiero La Rocca
1,*
1
Department of Biomedicine, Neurosciences and Advanced Diagnostics (BiND), University of Palermo, 90127 Palermo, Italy
2
Department of Biological, Chemical and Pharmaceutical Sciences and Technologies (STEBICEF), University of Palermo, 90128 Palermo, Italy
3
Research Department, IRCCS ISMETT (Istituto Mediterraneo per i Trapianti e Terapie ad Alta Specializzazione), 90127 Palermo, Italy
4
Unit of Regenerative Medicine and Immunotherapy, Ri.MED Foundation, 90133 Palermo, Italy
5
Departmental Faculty of Medicine, Saint Camillus International University of Health Sciences, 00131 Rome, Italy
6
Department of Health Promotion, Mother and Child Care, Internal Medicine and Medical Specialties (PROMISE) University of Palermo, 90127 Palermo, Italy
7
The Institute of Translational Pharmacology, National Research Council of Italy (CNR), 90146 Palermo, Italy
8
Department of Pediatrics, Division of Clinical and Experimental Immunology and Infectious Diseases (CEIID), University of Texas Medical Branch, Galveston, TX 77550, USA
9
Department of Neurology, University of Texas Health Science Center at Houston, Houston, TX 77030, USA
10
Laboratory of Cardio-Respiratory Apparatus Cytoimmunopathology, “S. Maugeri” Foundation, IRCCS, Medical Center of Veruno, 281010 Novara, Italy
*
Authors to whom correspondence should be addressed.
These authors contributed equally to this work.
Biology 2025, 14(2), 124; https://doi.org/10.3390/biology14020124
Submission received: 12 December 2024 / Revised: 21 January 2025 / Accepted: 22 January 2025 / Published: 24 January 2025

Simple Summary

Liver transplantation is the only therapeutic option for patients affected by end-stage liver disease (ESLD), but its feasibility is restricted by the shortage of donated organs. Stem cell therapy could represent a valid treatment option for these conditions. In particular, the mesenchymal stromal cells derived from the human umbilical cord matrix (WJ-MSCs), thanks to their specific features, can be considered good candidates for liver tissue repair and regeneration. We found that the WJ-MSCs differentiate in hepatocyte-like cells (HLCs) using a differentiation protocol that resembles the in vivo liver morphogenesis. We also showed that HLCs acquired mature hepatic functions and maintained their intrinsic hypoimmunogenicity, a key feature to avoid rejection in the host. Moreover, thanks to proteomic analysis, we highlighted several hepatic proteins in HLCs, demonstrating that these cells could be valid candidates for the treatment of ESLD.

Abstract

End-stage liver disease (ESLD), affecting millions worldwide, represents a challenging issue for clinical research and global public health. Liver transplantation is the gold standard therapeutic approach but shows some drawbacks. Hepatocyte transplantation could be a reliable alternative for patient treatment. Mesenchymal stromal cells derived from Wharton’s jelly of the umbilical cord (WJ-MSCs) can differentiate into hepatocyte-like cells (HLCs) and show immunomodulatory functions. Due to the increasing demand for fully characterized cell therapy vehicles warranting both the safety and efficacy of treatments, in this work, we extensively characterized WJ-MSCs before and after the application of a hepatocyte-directed differentiation protocol. HLCs exhibited a morphology resembling that of hepatocytes, expressed early and late hepatic markers (α-fetoprotein, albumin, CK18, HNF4-α), and acquired hepatic functions (glycogen synthesis, xenobiotics detoxification), as also revealed by the shotgun proteomics approach. HLCs maintained the same pattern of immunomodulatory molecule expression and mesenchymal markers, other than displaying specific enzymes, suggesting these cells as promising candidates for cellular therapy of ESLD. Our work shed new light on the basic biology of HLCs, suggesting new therapeutic approaches to treat ESLD.

1. Introduction

Liver diseases represent a major human health problem affecting millions of people worldwide. To date, liver transplantation represents the only clinically effective treatment for end-stage liver disease (ESLD) [1], but, unfortunately, there are several disadvantages associated with this procedure: rejection of the transplanted organ, lack of usable organs, and high costs [2]. For these reasons, cell therapy is a viable strategy for the treatment of ESLD [3]. The availability of primary hepatocytes and, more recently, hepatocyte-like cells (HLCs) derived from various stem cells opens new avenues for cure. The two main functional effects commonly associated with stem cell therapy, repopulation and the bystander effect, are both desirable for the treatment of ESLD. These may be characterized by a failure of the organ’s self-repair mechanisms that are dampened by the underlying disease or lead to local depletion of stem cells. The success of cell therapy relies particularly on its ability to take over the functions of hepatocytes, as well as modulation of the local microenvironment, attenuation of inflammatory/remodeling processes, and immune cell activity (in the recent literature, these activities are generally referred to as “immunomodulatory activities”) [4].
A major challenge for cell therapies, especially in organ transplantation or tissue regeneration, is the ability of the transplanted cells to successfully integrate into the host tissue and survive there in the long term. In many cases, rejection by the immune system or implantation failure can undermine the therapeutic potential of the transplanted cells. MSCs have immunomodulatory properties that may favor the creation of a more tolerant immune environment. MSCs can suppress the activity of immune cells and reduce the production of inflammatory cytokines. For this reason, transplantation of MSCs may, on the one hand, help to improve the long-term survival of the transplanted cells, making it less likely that the recipient’s immune system will attack them. On the other hand, this means that patients may not need to rely on strong immunosuppressive drugs, which have significant long-term side effects.
Therefore, MSCs offer a double benefit in cell therapy: they promote effective tissue repair and regeneration and at the same time can reduce harmful dependence on immunosuppressive drugs, leading to better outcomes and fewer complications for patients [3,4].
Despite the success of primary hepatocyte transplantation, which is widely used for liver failure and liver metabolic disorders, there is still a discrepancy between the clinical need for hepatocytes and the scarcity of donor livers. Stem cells derived from various adult or perinatal tissues can differentiate into HLCs, acquiring mature hepatocyte functions, and can reverse the disease after transplantation [5,6,7].
In this context, MSCs are considered a very effective combination in the cell therapy of liver diseases thanks to their multipotency and immunomodulatory capacity, as reported in the literature [8,9]. MSCs can differentiate into hepatocytes under appropriately modulated conditions, in the presence of certain growth factors or microenvironments. Although their ability to directly regenerate the damaged liver is still the subject of active research, MSCs have been shown to enhance liver regeneration in various experimental models of liver disease. On the one hand, MSCs can contribute to the restoration of damaged liver tissue by stimulating the proliferation of native liver cells and promoting tissue repair through the secretion of growth factors such as VEGF (vascular endothelial growth factor) and HGF (hepatocyte growth factor). On the other hand, MSCs can differentiate into hepatocytes and contribute, albeit partially, to the restoration of selected liver functions [9].
The ability of MSCs to modulate the immune response is one of the main reasons rendering these cells promising for the treatment of chronic inflammatory liver diseases.
In conditions such as hepatitis or cirrhosis, chronic inflammation is a key factor leading to progressive liver damage. MSCs can inhibit the activation of immune cells (such as T lymphocytes and macrophages) and modulate the production of inflammatory cytokines. This may help reduce liver inflammation, a crucial factor in preventing additional damage. MSCs can induce an immunosuppressive environment through the secretion of molecules such as PGE2 (prostaglandin E2), IDO (indolamine 2,3-dioxygenase), and TGF-β (transforming growth factor beta), as well as expressing key membrane-bound molecules. These features may have a positive effect in reducing the abnormal immune response that can progressively damage the liver [10,11].
Another advantage of MSCs is their ability to prevent rejection in the case of liver transplantation. MSCs can reduce the activity of T lymphocytes that are responsible for transplant rejection, making liver transplantation safer and more durable in patients with end-stage liver failure [12,13]. Albeit further research is needed to fully understand the mechanisms at play and optimize therapeutic protocols, the use of MSCs represents a promising frontier in regenerative medicine for the liver.
There are a plethora of biological sources for MSCs, either adult, fetal, or perinatal tissues (such as umbilical cord and amniotic membrane) [14,15,16,17].
The umbilical cord (UC), one of the main sources of MSCs, is known to be composed of a specialized connective tissue called Wharton’s jelly (WJ) that surrounds the vessels involved in fetal circulation. WJ consists mainly of an amorphous substance rich in glycosaminoglycans, collagen fibers, and various cell types. In particular, the spindle-shaped WJ-MSCs are considered a promising cell type for tissue repair and regeneration [18].
The isolation of WJ-MSCs is technically simple, non-invasive, and ethically acceptable [19]. In culture, WJ-MSCs show excellent proliferation and differentiation properties [20]. It has been demonstrated that WJ-MSCs can differentiate into mature cells of all three embryonic layers under certain culture conditions [21,22] and are, therefore, desirable candidates for tissue repair and regeneration [23]. In addition, WJ-MSCs have been shown to be able to support hematopoietic stem cell proliferation in vitro [24] and to survive in in vitro models of diseases characterized by hypoxic conditions [25].
Importantly, WJ-MSCs have key immunological properties due to their physiological localization in placental tissue. They express both canonical (HLA-A-B-C) and non-canonical (HLA-E, F, and G) MHC class I antigens [26,27,28] and do not feature MHC class II molecules (HLA-DR, DP, and DQ). In addition, WJ-MSCs do not express costimulatory antigens involved in the activation of T and B cell responses, such as CD40/CD40L, CD80, CD86, and B7-DC [18]. However, the expression of some of these antigens is restricted to MSCs stimulated with INF-α or other stimulators [29,30,31,32]. Most of these molecules are a common feature of MSCs from other tissues [33,34].
We have previously shown that WJ MSCs do not express costimulatory molecules after differentiation [26]. This is probably linked to the non-immunogenic nature of these cells. It has been reported that the expression of B7-H1, a negative regulatory molecule, can suppress T cell proliferation. WJ-MSCs also suppress the differentiation and maturation of monocytes into dendritic cells in a contact-dependent manner and promote the induction of differentiation/maturation of regulatory T cells (Tregs), confirming the effective immunomodulatory functions of these MSCs [35].
Several reports indicate that WJ-MSCs can be successfully differentiated into HLCs that exhibit features of mature hepatocytes [36]. Bharti et al. have shown that HLCs derived from WJ-MSCs exhibit high hepatogenic potential as well as the ability to produce urea, indicating ammonia competence [37]. However, a comprehensive characterization of the differentiated cells is lacking.
Based on all these considerations, in this study, we performed a specific differentiation protocol of WJ-MSCs into HLCs, followed by their characterization using different techniques and functional assays to highlight the similarity related to liver function, hepatic expression profile, and immunogenic properties. Our proteomic approach discovered several novel molecules specifically expressed after the differentiation of HLCs as well as quantitative differences between the different conditions described for the first time in these cells derived from the differentiation of stromal cells from perinatal tissues.

2. Materials and Methods

2.1. Cellular Isolation Protocol of WJ-MSCs

The isolation of WJ-MSCs was performed following our previously published protocol [26,27]. 10 human umbilical cords were obtained after the mother’s consent according to the tenets of the Declaration of Helsinki and local ethical regulations (IRRB/58/13, ISMETT Institutional Research Review Board). Briefly, after full-term birth through normal vaginal or cesarean delivery, umbilical cords were aseptically stored in a cold saline-buffered solution, and cellular isolation was started within six hours of birth. The cords were washed in warm HBSS (h9394, Sigma-Aldrich, Steinheim, Germany) with antibiotics/antimycotics (A5955, Sigma-Aldrich, Germany, concentration of use is 20 mL/L), and then they were cut into small pieces (about 1.5 cm length) and sectioned longitudinally to exhibit the WJ under the umbilical epithelium. Multiple incisions, without vessel removal, were made within the cord tissue with a sterile scalpel to increase the area open to contact with the plastic surface of 6-well plates. The cord pieces were cultured in the presence of a standard medium composed of DMEM low glucose medium (D5523, Sigma- Aldrich, Steinheim, Germany), supplemented with 10% fetal bovine serum (FBS gold, PAA), 1x NEAA (M7145, non-essential amino acids, Sigma-Aldrich, Germany), 1x antibiotics/antimycotics (A5955, Sigma-Aldrich, Germany), and 2 mM L-glutamine (G7513, Sigma-Aldrich, Germany). This isolation protocol is based on the natural migratory ability of mesenchymal cells and, therefore, the use of potentially harmful enzymatic activities can be skipped. Cord pieces were kept in culture for 15 days with medium change every second day. The slow degradation of the matrix allowed growth factors and signaling molecules to exit from the cord with a continuous positive stimulation of the cultured cells. After 15 days of culture, cord pieces were removed, and the adherent cells were routinely cultured until reaching 80% confluence.

2.2. Cell Culturing and Passaging

WJ-MSCs, at 80% confluence, were detached from flasks using TrypLe Select (12563, Tryple Select Enzyme, no phenol red, Gibco, Waltham, MA, USA) and were cultured for up to 15 passages. For immunocytochemical analysis and PAS staining, cells were plated in 8-well chamber slides (BD Bioscience, Leuven, Belgium). For flow cytometry analysis, cells were cultured in 25 cm2 tissue culture flasks (Corning, Berlin, Germany). For proteomic analysis, the cells were cultured in 75 cm2 tissue culture flasks to obtain an 80% confluence (2 × 10⁶ cells). WJ-MSCs were cultured in 96-well plates for CYP3A4 activity assay and in 12-well plates for a Glucose-6-Phosphatase assay.

2.3. Flow Cytometry (FC) Analysis

WJ-MSCs (1 × 10⁵) were stained in the presence of PBS (Sigma-Aldrich, Darmstadt, Germany) with 0.5 % BSA (A2153, Sigma-Aldrich, Hoeilaart, Belgium) with several antibodies, and their isotype match control was used as a negative control. The intracellular staining was performed using a BD Cytofix/Cytoperm™ solution (554714, BD Biosciences, Erembodegem, Belgium). The primary antibodies and isotype controls used for the FC analyses are summarized in Table S1. Forward and side scatter gates were set to include all viable cells. Routinely, debris and doublets were excluded from the cell population data by applying forward and side scatter selection. The co-expression of two markers was analyzed by the gating of the population for the first marker and the subsequent analysis of the percentages of the second marker. FC data were acquired with a BD FACS Aria II instrument. Data obtained by flow cytometer were acquired with FACS Diva 6.1.2, while the analysis was performed with the FlowJoTM 10 version software.

2.4. Immunocytochemistry (ICC) Analysis

ICC analysis was performed as previously reported [27]. After culturing, cells grown in chamber slides were washed with PBS and fixed in methanol for 20 min at −20 °C. Air-dried slides were then stored at −20 °C until use. Cells were permeabilized with 0.1% Triton X-100 (1610407, Biorad, Hercules, CA, USA) in PBS (Sigma-Aldrich, Germany). After a subsequent rinse with PBS, slides were exposed to 0.3% hydrogen peroxide in PBS, blocked with 1% FBS in PBS, and incubated for 2 h with the primary antibody. The detection was performed using an avidin–biotin complex kit (LSAB2; Dako, Golstrup, Denmark). The 3-amino-9-ethylcarbazole (AEC chromogenic substrate solution; Dako, Golstrup, Denmark) was used as a developer. Nuclear counterstaining was obtained using hematoxylin (Dako, Golstrup, Denmark). Negative controls were used simultaneously by omitting the primary antibody step. The antibodies used in the present study, with indications of the working conditions, are listed in Table S2. CYP isoforms’ staining was analyzed and quantified for statistics using the open-source software Fiji (version 2.16), and the results were plotted and expressed as intensity based on the percentage (%) of the area showing a positive signal.

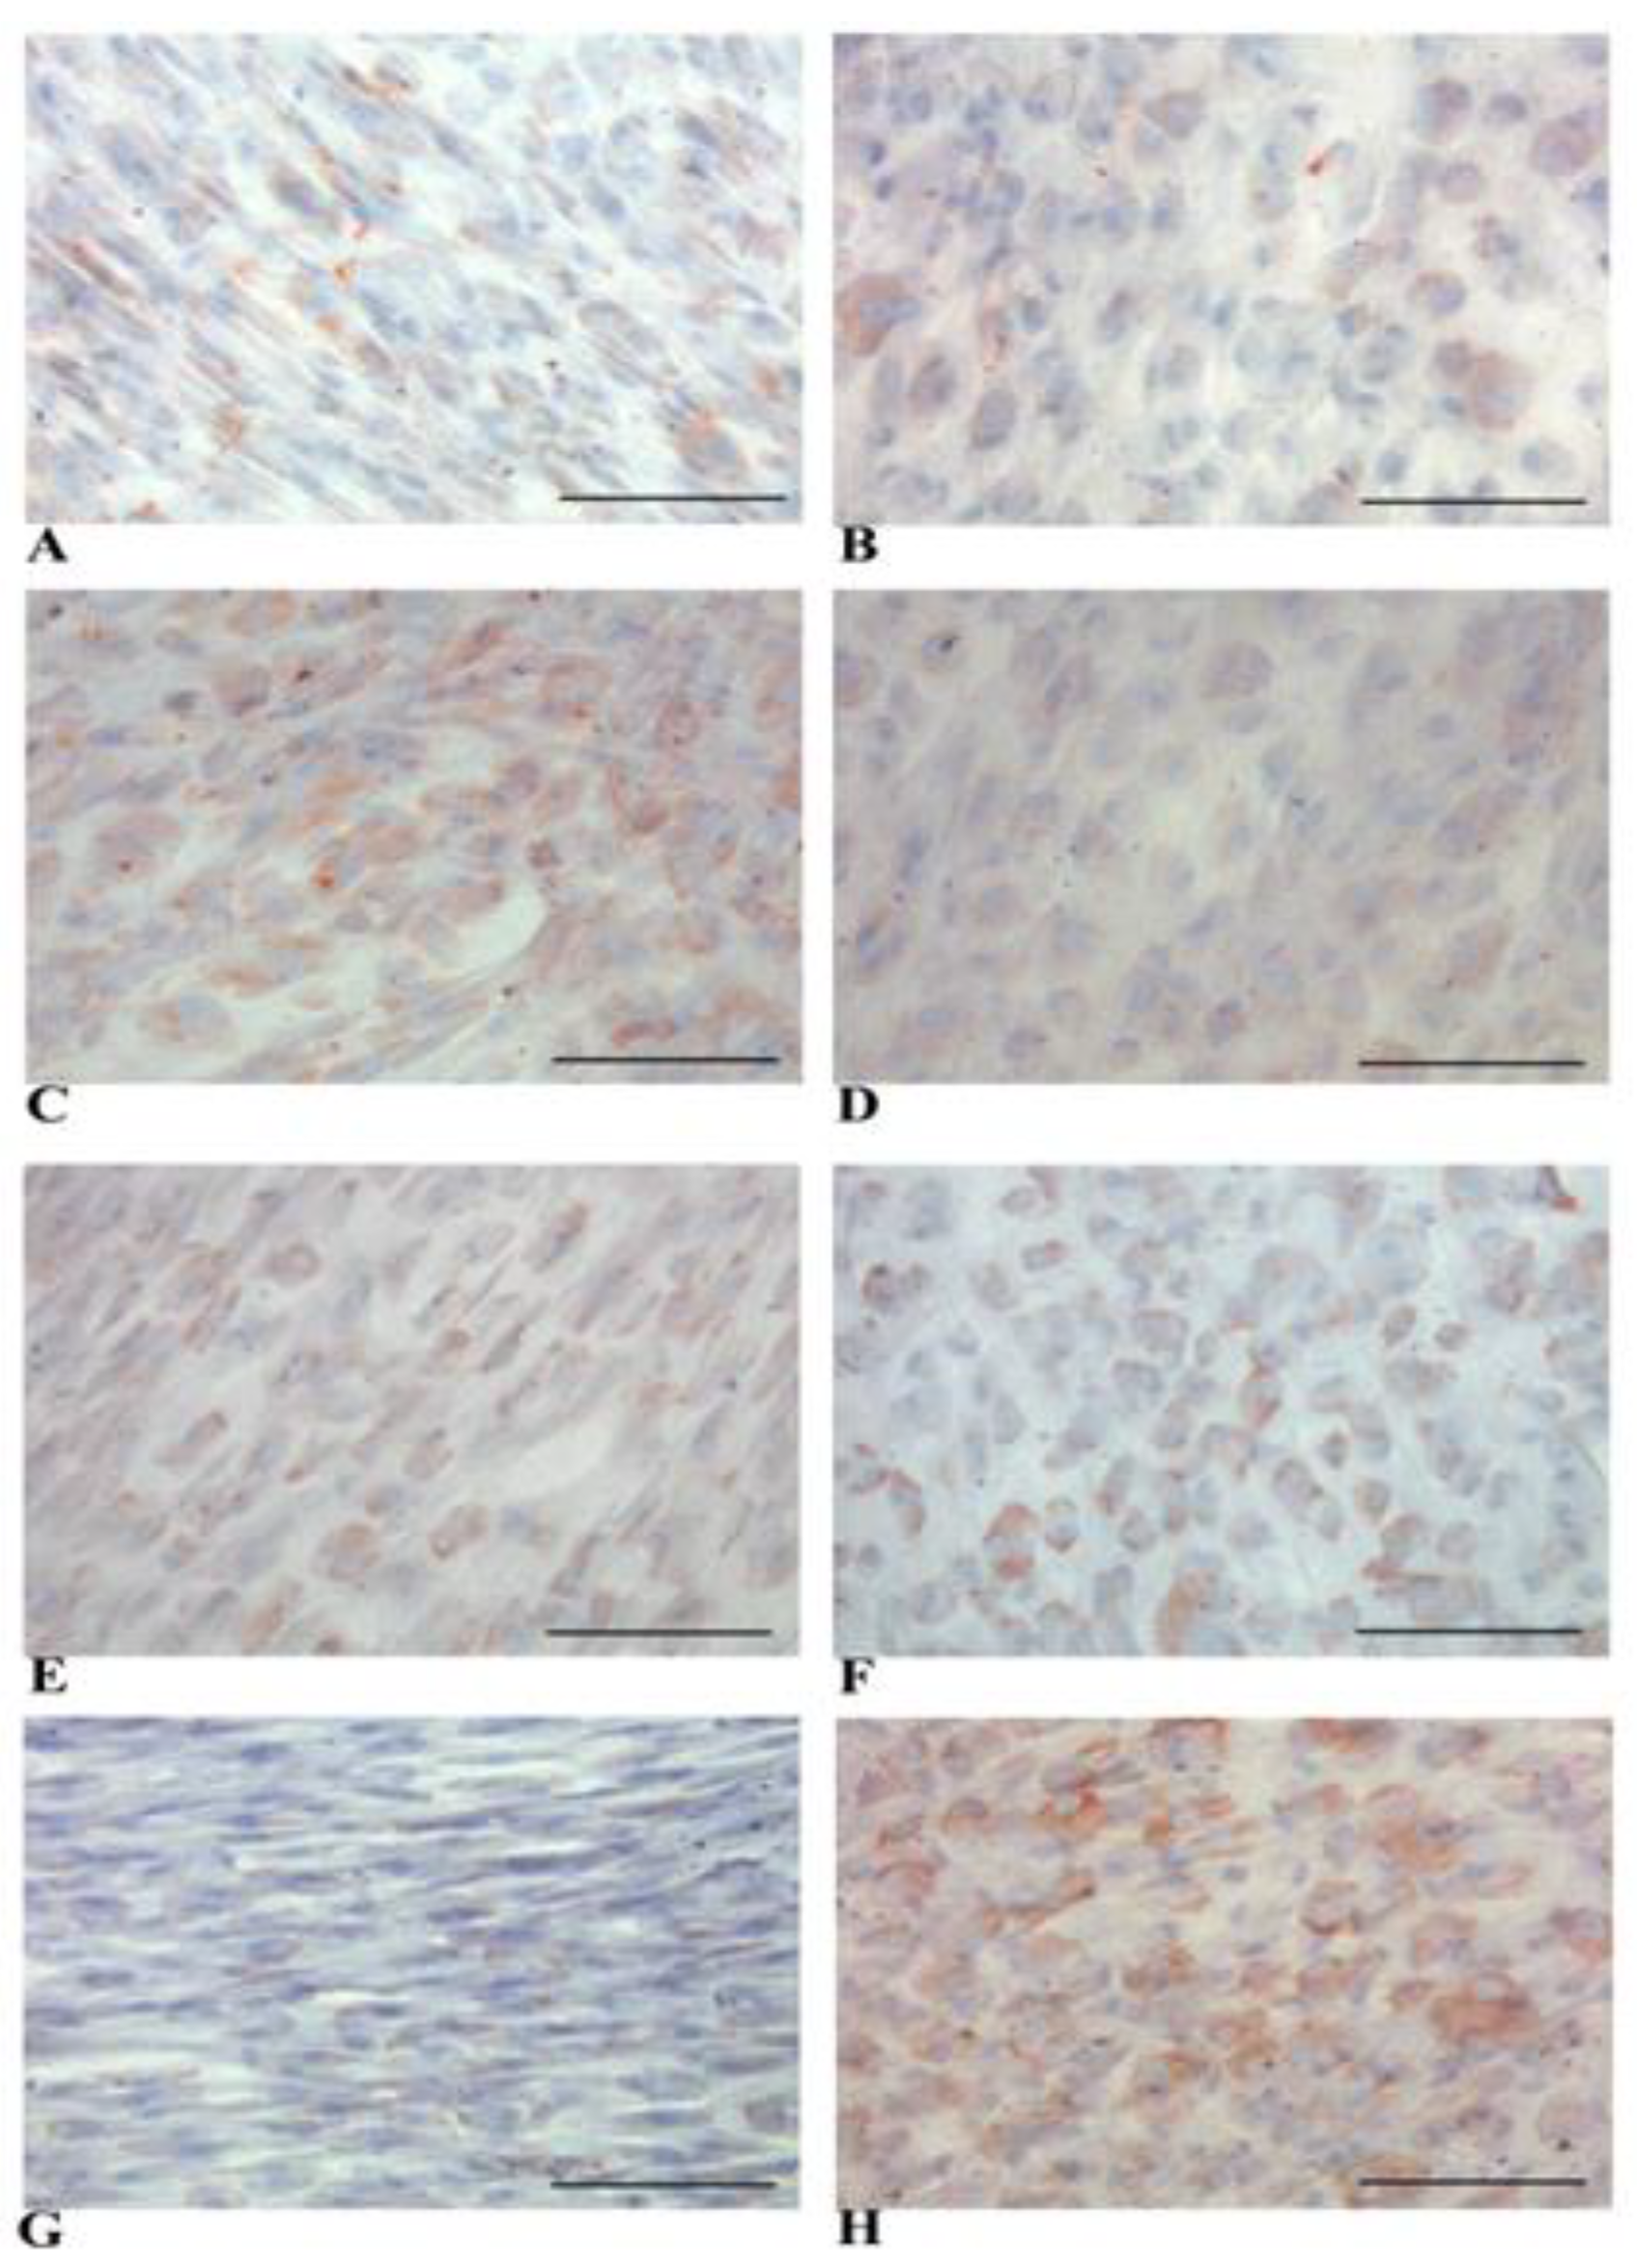
2.5. Immunohistochemistry (IHC) Analysis

Archival paraffin sections of the human liver with a thickness of 5 µm were used for IHC analysis. The staining was carried out using a streptavidin–peroxidase kit (LSAB2 system peroxidase; Dako, Golstrup, Denmark) following the manufacturer’s instructions. Briefly, after deparaffinization steps, the sections were exposed to 0.3% hydrogen peroxide solution for 10 min to inactivate endogenous peroxidases. A blocking solution (PBS with 3% BSA was used for 1 h at room temperature (RT). Specific primary antibodies used for this work (listed in Table S2) were applied for 1.5 h of incubation at RT. Sections without primary antibodies were used as negative controls and were run simultaneously. A 1X phosphate buffer saline (PBS) (Sigma-Aldrich, Germany) was used for the washing steps. Sections were then incubated with mouse/rabbit antibodies (universal secondary antibodies from the LSAB2 system kit) for 1 h. Subsequently, streptavidin–peroxidase was added, followed by 3-amino-9-ethylcarbazole (AEC) (Dako, Golstrup, Denmark) as a developer, and nuclei were counterstained using hematoxylin (Dako, Golstrup, Denmark).

2.6. Hepatocyte-Like Cells Differentiation Protocol

WJ-MSCs were used for differentiation experiments between the 5th and 7th passages. We developed a modified protocol based on existing reports about the usefulness of fibroblast growth factors (FGFs) and hepatocyte growth factor (HGF) as initial inducers of the hepatocyte-like phenotype [5,6,27]. For the first three weeks, the hepatic differentiation medium was composed of DMEM low glucose, 1% FBS (FBS Gold, PAA), 1x NEAA (M7145, Sigma-Aldrich, Germany), 1x antibiotics/antimycotics (A5955, Sigma-Aldrich, Germany), 2 mM L-glutamine (Sigma-Aldrich, Germany), 10 ng/mL of human FGF-4 (Miltenyi Biotech, Germany), 20 ng/mL of human HGF (Miltenyi Biotech, Germany), 1x Insulin-transferrin-selenite supplement (ITS, I3146, Sigma-Aldrich, Germany), and 0.1 µM dexamethasone (Sigma-Aldrich, Germany). Medium changes were performed each other day. After 3 weeks, the culture medium was further supplemented with 10 ng/mL of oncostatin M (OSM, Miltenyi Biotec, Bergisch Gladbach, Germany) for another week. For all the lines tested in differentiation experiments, the control WJ-MSCs were cultured in the standard medium as described above. Both the treated and control WJ-MSCs were analyzed at the end of the 3rd and 4th week of the hepatic differentiation process. Constant cell monitoring throughout the culture period was performed by phase-contrast microscopy. Treated cells were referred to as HLCs.

2.7. Glycogen Staining with Periodic Acid Schiff (PAS)

PAS staining was performed using a commercial kit (395B, Sigma-Aldrich, Germany) following the manufacturer’s instructions. Briefly, control WJ-MSCs and HLCs, grown into 8-well chamber slides, were fixed in formaldehyde/ethanol fixative solution for 1 min. After washing with tap water for 1 min, periodic acid was added for 15 min at room temperature. Following several washes with distilled water, Schiff’s reagent was added for 15 min at room temperature. Subsequently, another wash with running tap water was performed for 5 min to remove Schiff’s reagent, and the cells were stained with Gill’s hematoxylin for 90 s. Slides were then washed and air-dried, and pink-to-red glycogen deposits were observed at the light microscope.

2.8. Glucose-6-Phosphatase (G-6-Pase) Activity Assay

To detect G-6-Pase activity, we used a previously published protocol [38,39]. Briefly, both control and HLCs were incubated with a working solution composed of 2.4 mM lead nitrate and 2.08 mM glucose-6-phosphate in 0.1 M Tris-acetate buffer pre-warmed at 37 °C. After 20 min, the working solution was removed, and three washes were performed with distilled water. Then, 5% ammonium sulfide was added for 30 s to convert lead nitrate into lead sulfate, which is visible as brownish–black precipitates. Standard counterstaining was performed with hematoxylin prior to observing cells at the inverted microscope (DMIL, Leica, DMI 300 B, Wetzlar, Germany).

2.9. CYP450 3A4 Metabolic Activity Assay

The Kit P450-Glo™ CYP3A4 Assay (Luc-PFBE, Promega, Madison, WI, USA) was used to assess the induction and activity of CYP3A4 in HLCs following the manufacturer’s instructions. Briefly, cells were plated in 96-well plates and incubated for 48 h with 25 µM rifampicin (Sigma), which is a known inducer of the enzyme. In parallel experiments, cells were co-incubated with 10 µM ketoconazole (Sigma-Aldrich, Germany), which specifically inhibits CYP3A4 activity. Medium changes were performed daily. After washing with PBS, the cells were incubated with 50 µM of luciferin-PFBE, a luminogenic substrate, for 4 h in the dark. Subsequently, 50 µL of medium from each well was transferred to a 96-well opaque white luminometer plate, and 50 µL of luciferin detection reagent was added. After 20 min incubation at room temperature, samples were analyzed with a luminometer (Promega, Madison, WI, USA) using integration times of 0.5 s. To determine background luminescence, a luminogenic substrate was added to the complete medium without cells. Background subtraction was applied to all the samples, which led to an apparently “negative” luminescence value in NT-WJ-MSCs (reported in the relative figure).

2.10. Sample Preparation for Proteome Analyses

For the analysis of secreted proteins, the cells were detached with TrypLE Select (Gibco) at 37 °C for 3–5 min, washed with PBS, and lysed with NP-40-containing buffer (20 mM Tris/HCl pH 7.5, 1% Nonidet NP-40, 50 mM NaCl, 1x protease inhibitor). Desalting, buffer exchange, and protein concentration were carried out using 3K NMWL Amicon Ultra Centrifugal Filters 0.5 mL (Millipore, Darmstadt, Germany). Protein quantification was performed using DC Protein Assay (Biorad, Hercules, CA, USA).

2.11. In-Solution Digestion

The digestion step was performed by adding Trypsin/Lys-C Mix (Promega) to 50 μg of proteins at a 25:1 protein/protease ratio (w/w), following the manufacturer’s instructions. Peptides, obtained after the digestion, were concentrated and desalted with Pierce C18 Spin Columns (Thermo Scientific, Waltham, MA, USA). Then, the samples were lyophilized and suspended in an appropriate buffer (0.1% formic acid) for subsequent applications.

2.12. High-Performance Liquid Chromatography (HPLC) and Electrospray MS

Reversed-phase HPLC separation and online mass spectrometry detection (HPLC-MS/MS) were performed using an UltiMate 3000 System (Dionex, Sunnyvale, CA, USA) combined with Linear Trap Quadrupole (LTQ) Orbitrap XL™ Hybrid Ion Trap-Orbitrap Mass Spectrometer (Thermo Scientific, Milan, Italy) via an electrospray ionization (ESI) source. The chromatographic separation was carried out on a Hypersil Gold C18 column (15 cm × 2.1 mm, 1.9 μm). Sequential elution of peptides was accomplished using a flow rate of 50 μL min−1 and a linear gradient from 98% solution A (0.1% formic acid) to 98% solution B (80% acetonitrile, 0.08% formic acid) over 120 min. The gradient elution program was as follows: 2 min 98:2, 4 min 87:13; 95 min gradient from 87:13 to 50:50, 104 min 2:98, 109 min 2:98, 110 min 98:2, and 120 min 98:2 (A:B, v/v). The column temperature was set at 25 °C, and the sample tray temperature was maintained at 4 °C. For all experiments (n = 4 for each condition), a sample volume of 4 μL corresponding to 250 ng of peptides was loaded. For MS detection, the ESI source was operated in positive mode and run with Xcalibur version 2.0 (Thermo Fisher). High-purity nitrogen was used as the sheath and auxiliary gas, and high-purity helium was used as the collision gas. To limit the under-sampling effect, different orbital filling times (namely, 400 and 500 ms) were used.

2.13. Proteomic Data Analysis

The raw data were processed using Proteome Discoverer version 1.4 (Thermo Scien-tific, Waltham, MA, USA). MS/MS spectra were sequentially searched with Sequest HT and MS Amanda, both set against Homo sapiens and Bos taurus databases using the following parameters: full trypsin digestion with a maximum of two missed cleavages, fixed modification of carbamidomethylating of cysteine (+57.021 Da), variable modification of oxidation of methionine (+15.995 Da), and phosphorylation of tyrosine, serine, and threonine (+79.966 Da). Precursor mass tolerance was set at 10 ppm, and fragment ion tolerance was set at 0.8 Da. Peptide spectral matches were validated using the percolator software tool (http://percolator.ms/). Only proteins with ≥3 peptides matched were selected for subsequent data analyses.

2.14. In Silico Analysis

To confirm the identified proteins, in silico analyses were carried out. Notably, to avoid the detection of false positive molecules from FBS, we also compared the sequences of human candidate peptides against Bos taurus protein sequences using LALIGN (https://www.ebi.ac.uk/Tools/psa/lalign/) (accessed on 9 October 2024). The accession number of each identified protein was loaded into the gene ontology (GO) classification system (http://www.geneontology.org). The proteins were analyzed considering the different cellular components, molecular functions, and biological processes. However, the ‘molecular functions’ and ‘biological process’ were the only classifications used for generating pie charts and related statistics. Automatically, the PANTHER (Protein ANalysis THrough Evolutionary Relationships) GO classification system generated the pie charts with related statistics. General functions analysis was performed using the UniProt database (http://www.uniprot.org). The Human Protein Atlas (HPA) database (https://www.proteinatlas.org/humanproteome) (accessed on 9 October 2024) was used for mapping proteins in human organs, tissues, and cells based on omics technologies, including antibody-based imaging, mass spectrometry-based proteomics, transcriptomics, and systems biology.

2.15. Label-Free Quantification and Data Analysis

The raw data were analyzed by the software Maxquant version 2.4.2.0. The MS data were searched against the UniProt-reviewed database of Homo sapiens. A second UniProt-reviewed database of Bos taurus was added to identify potential contaminants from the cell medium. The common Repository of Adventitious Proteins (c-RAP) contaminant database was included in the database search. Proteins in common between Homo sapiens and Bos taurus were considered as contaminants and not further investigated. Proteins with at least three peptides were analyzed. A semi-quantitative analysis was performed by selecting the Fast label-free quantification (LFQ) option with a classic normalization. Only unique peptides were used for quantification. The LFQ of proteins required at least two ratio counts of unique peptides. “Advanced ratio estimation”, “stabilize large LFQ ratios”, “require MS/MS for comparisons”, and “advanced site intensities” were selected. The runs were automatically aligned. SM, Protein, and Site decoy fraction FDR were set at 0.05. The LFQ values were log2 transformed and statistically analyzed by using the Perseus software 2.0.10.0. A PCA test (p-value < 0.05) and two-sample t-student tests were performed to evaluate the differences between the 3rd and 4th week NT WJ-MSCs and the 3rd and 4th week HLCs. The results were plotted in a Volcano plot in which the x-axis presents the differences between (tr) and (nt) cells expressed as the log2(LFQ Intensity HLCs)/log2(LFQ Intensity NT WJ-MSCs), while the y-axis represents the significance derived from the −log10(p-values). With a FDR set at 0.05, only statistically significant upregulated and downregulated ones were considered. The proteins upregulated in HLCs were analyzed using the STRING database (https://string-db.org/, accessed on 9 October 2024) to define the protein-protein association networks.

2.16. Statistical Analyses

The obtained data were plotted using MS Excel software, and statistical analyses were performed on triplicate samples using GraphPad Prism 4 software (GraphPad Software, San Diego, CA, USA). The significance of differences between the experimental conditions was assessed by the Mann–Whitney test and one-way ANOVA analysis (Kruskal–Wallis test). Values were considered significant for p < 0.05.

3. Results

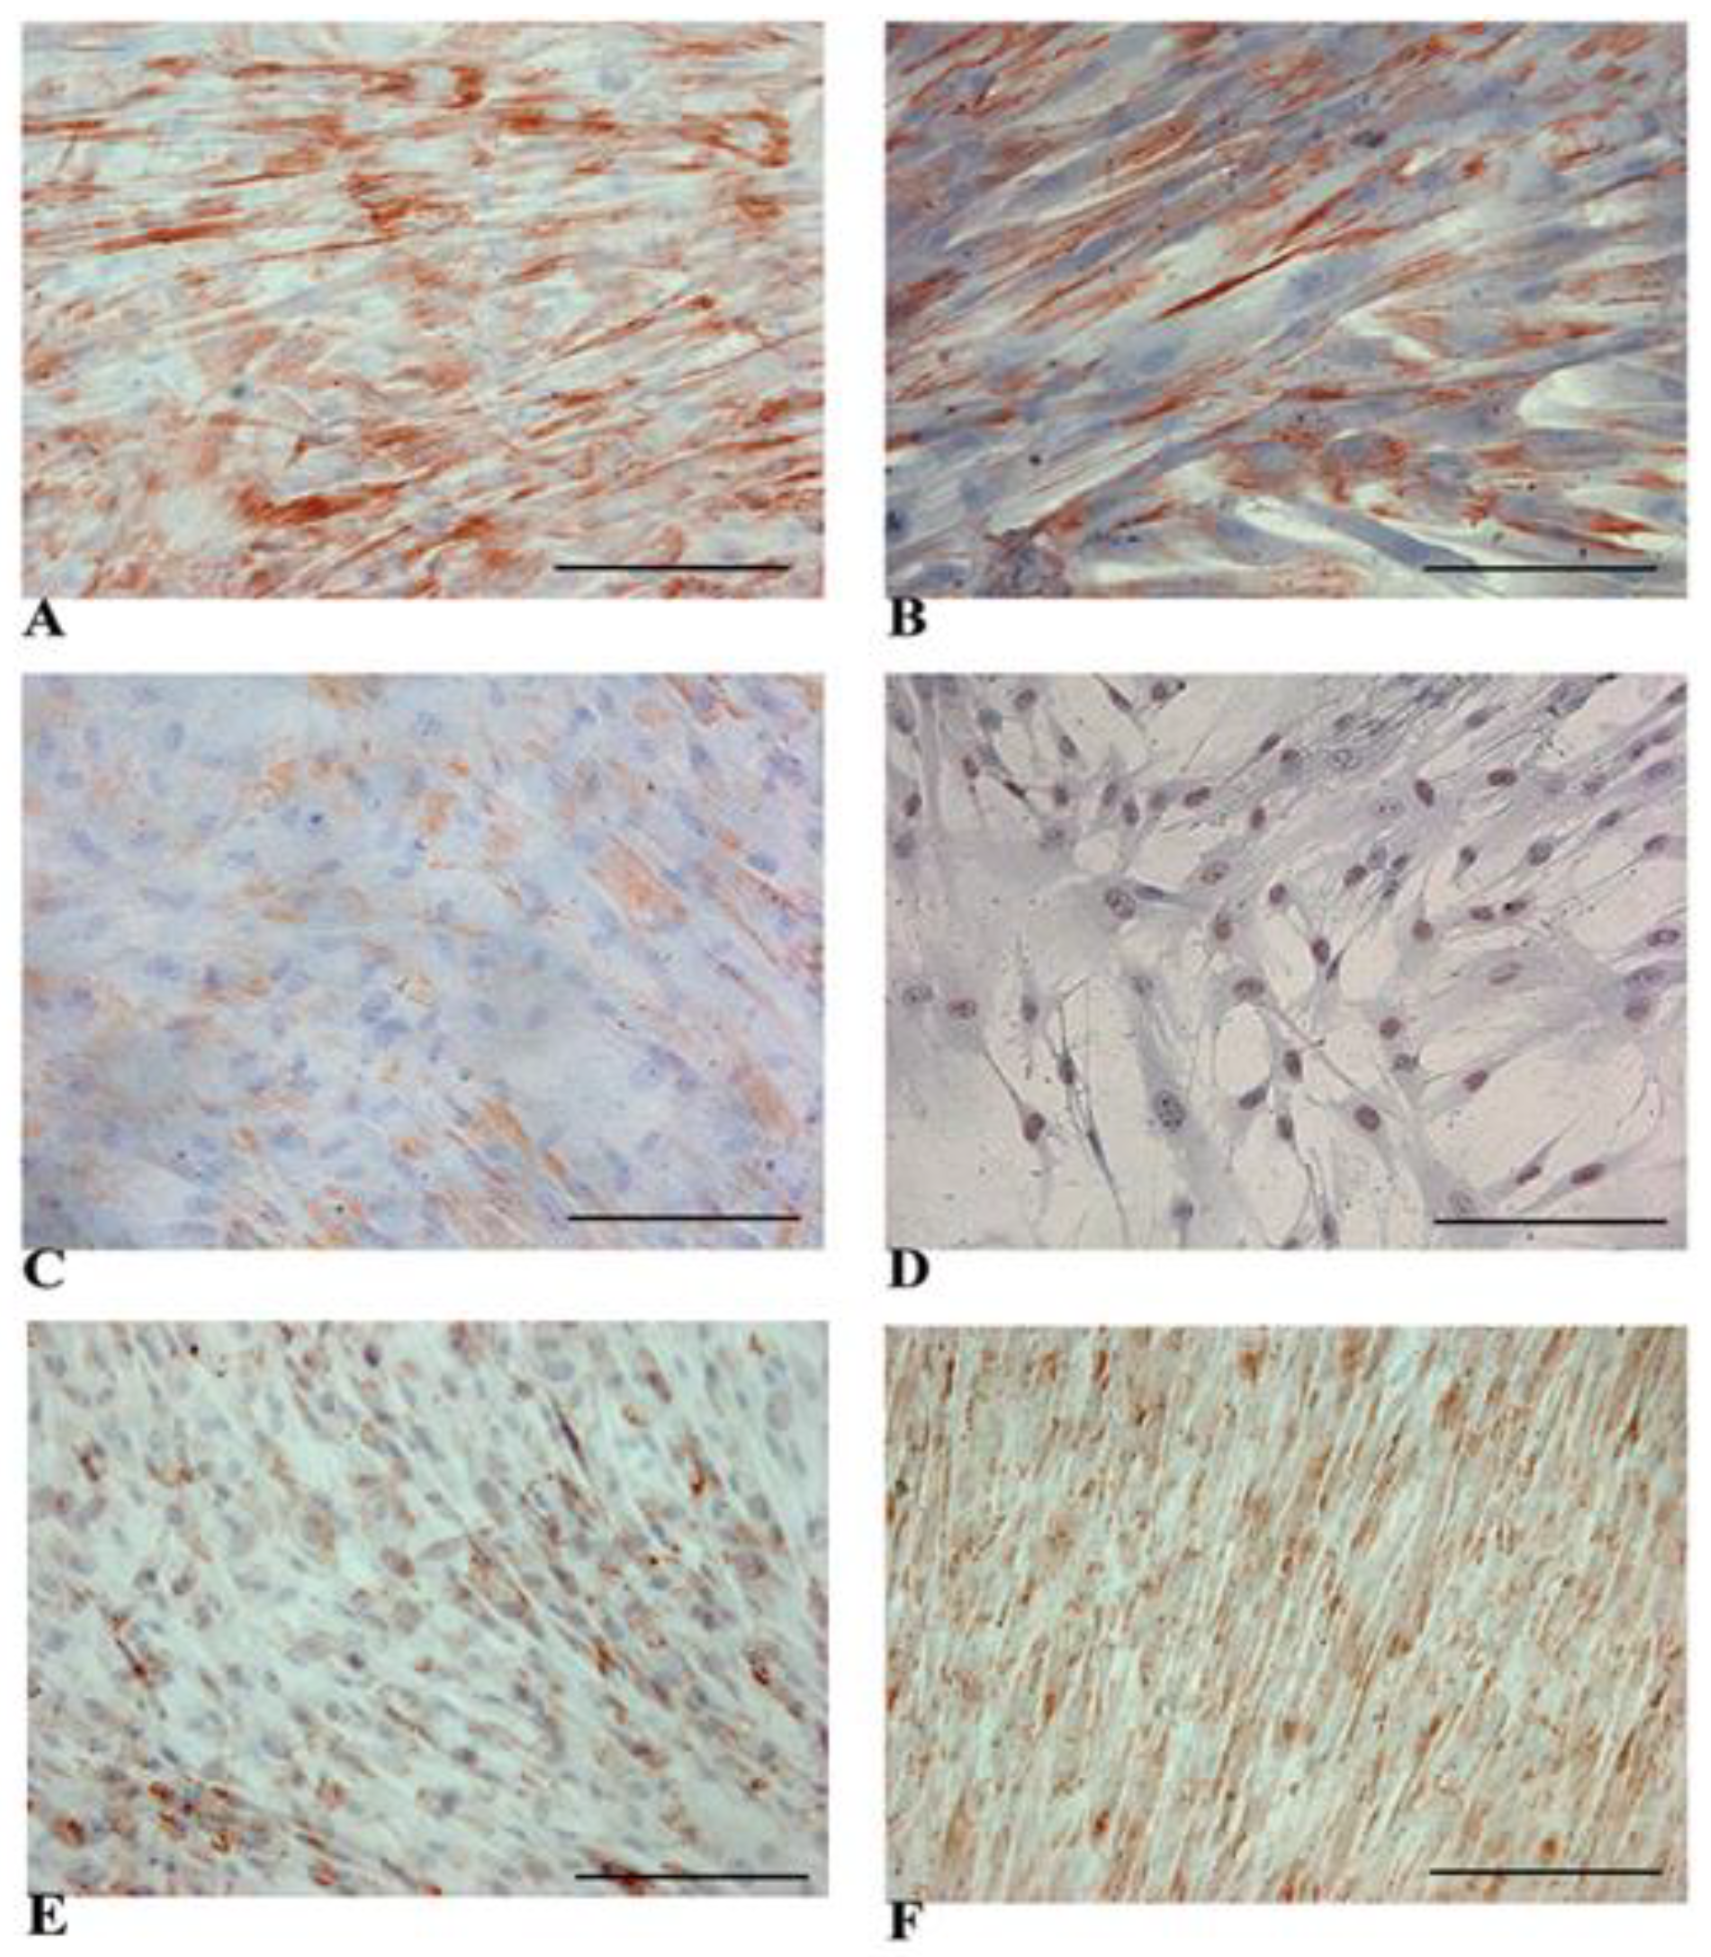
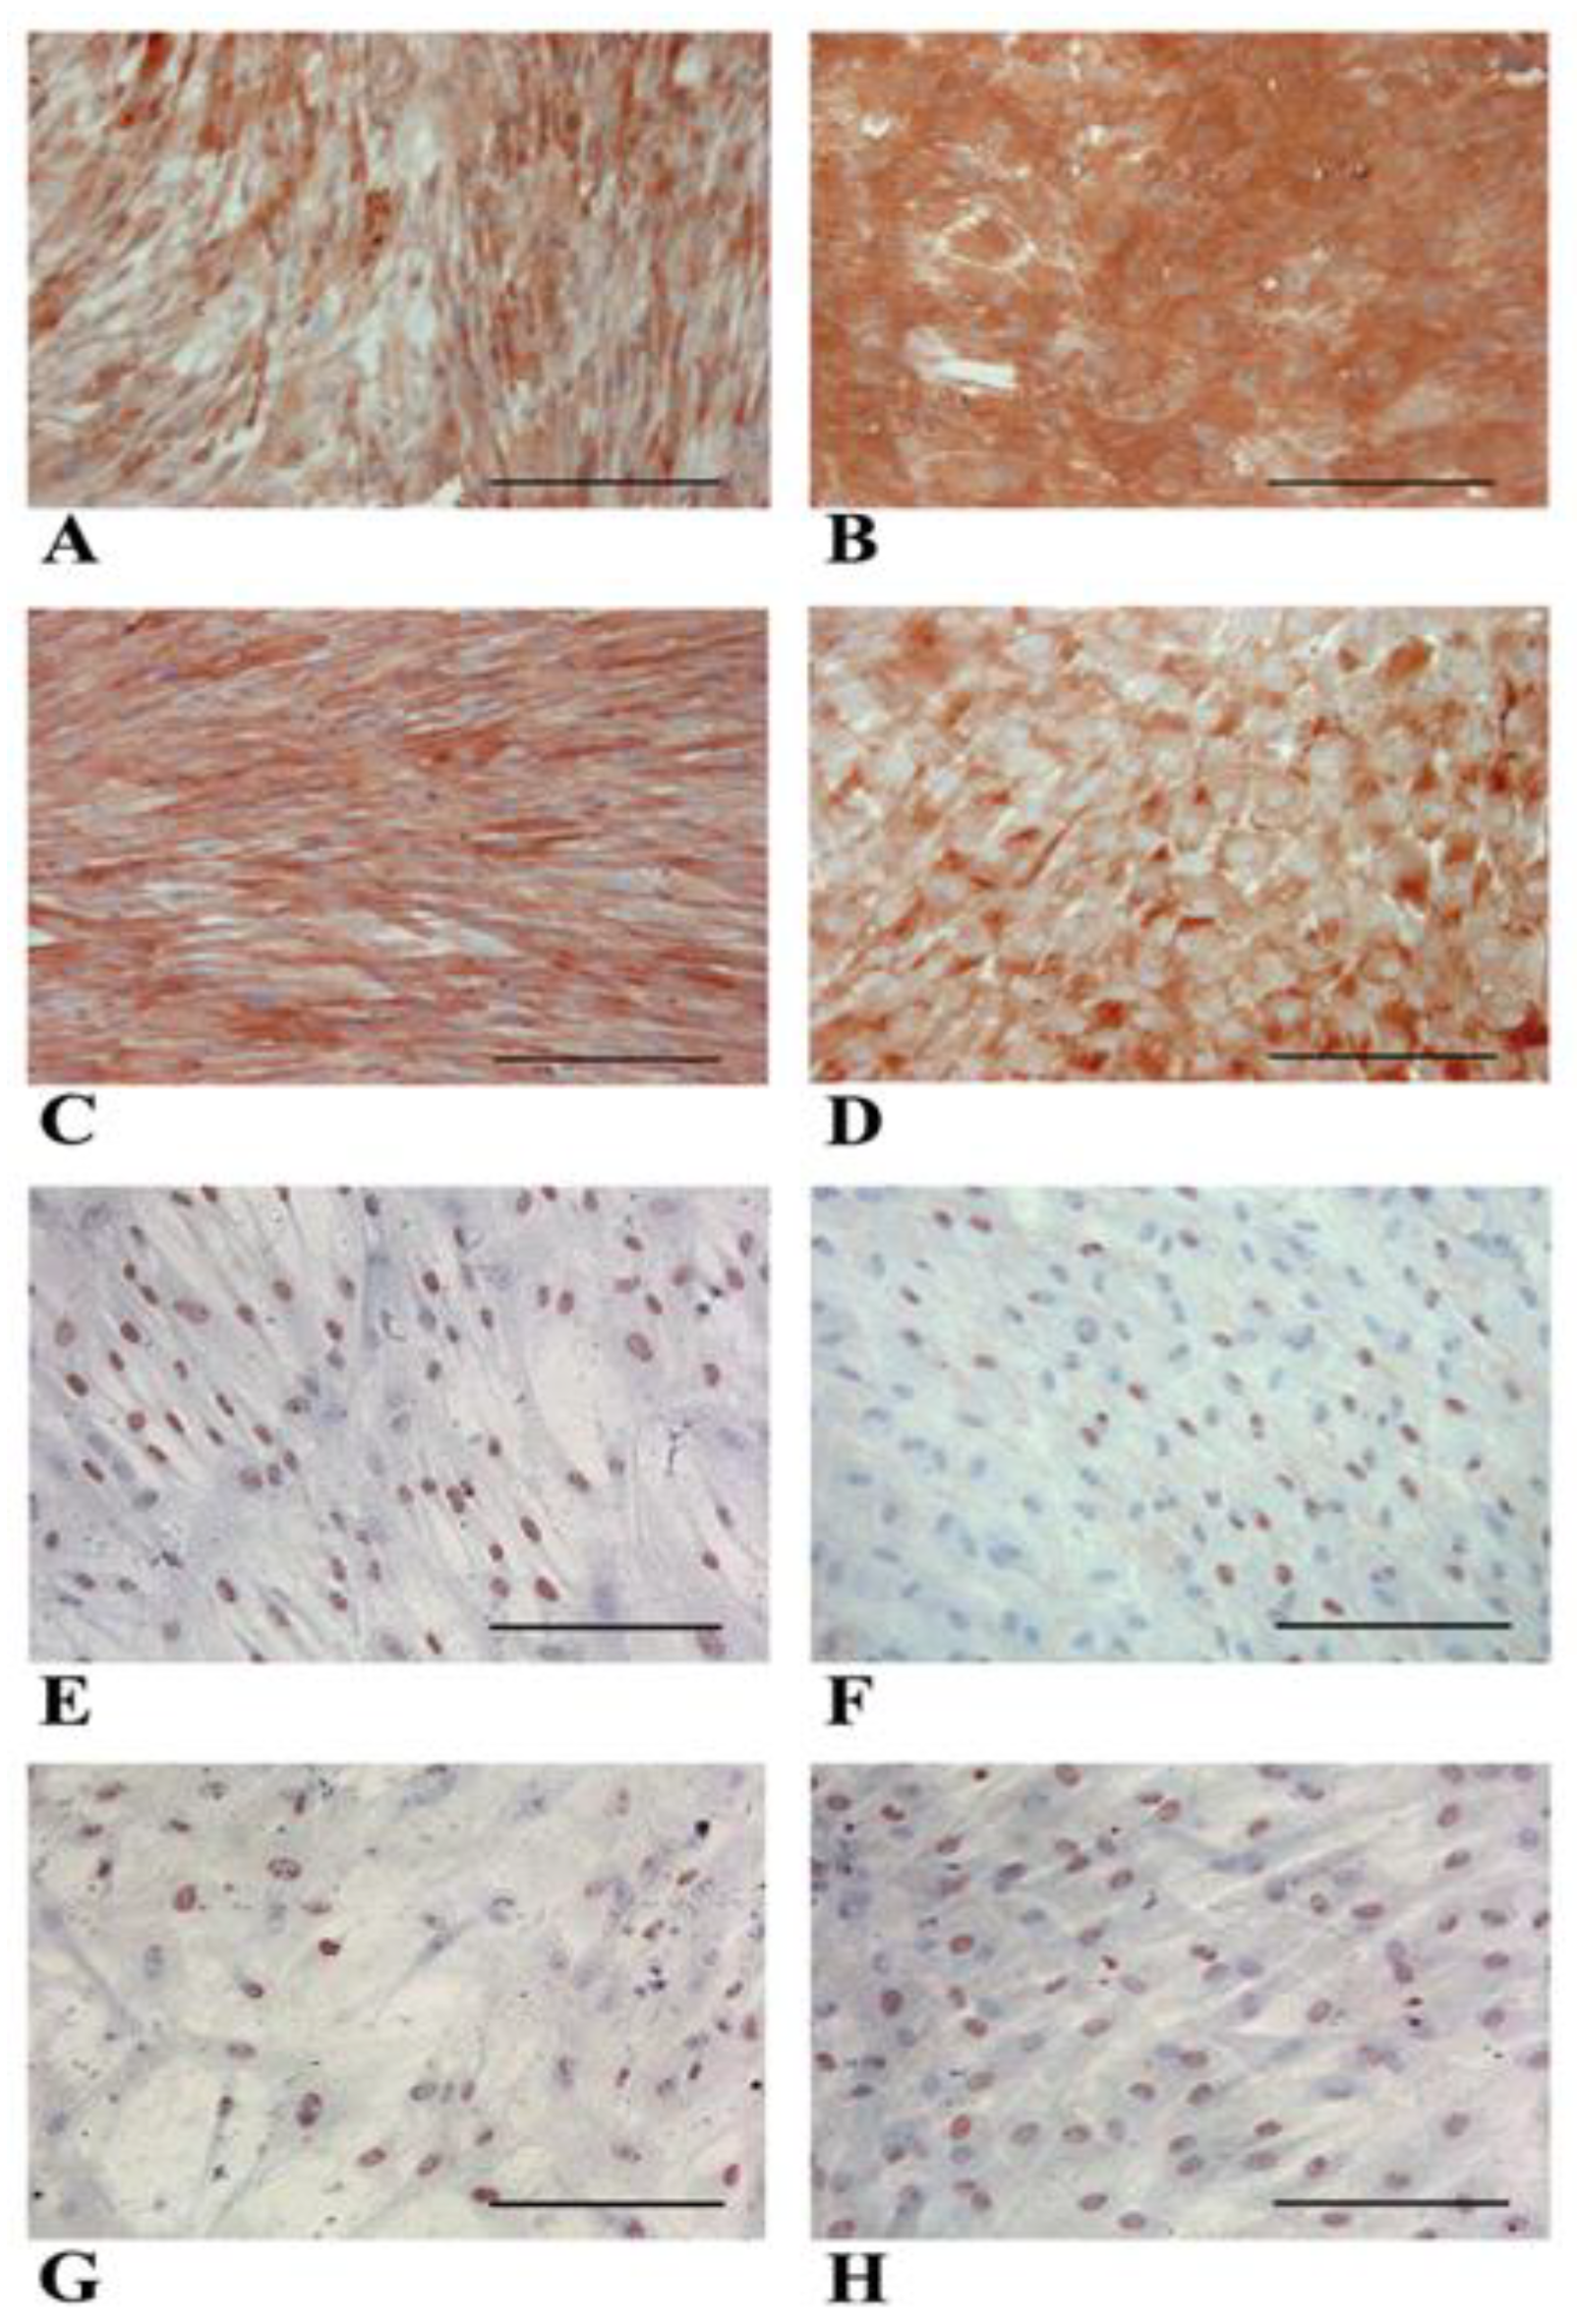
3.1. WJ-MSCs Show Mesenchymal Phenotype and Intrinsic Hepatogenic Potential

WJ-MSCs were cultured in standard medium on plastic surfaces and maintained a fibroblast-like morphology at low and high confluency. WJ-MSCs were routinely passaged and maintained in culture until the 15th passage.
We analyzed the expression of consensus mesenchymal stromal cell markers [40] as well as additional markers during cell culture. In naïve WJ-MSCs, we confirmed the expression of typical mesenchymal markers such as CD10, CD13, CD29, CD73, CD90, CD105, and CD117 by flow cytometry analysis. The presence of endothelial and hematopoietic markers (CD31 and CD34, CD45, respectively) was predominantly negative in these cells (Figure 1).
Confirming our previously published data [26], WJ-MSCs express, at the protein level, type I (major histocompatibility complex) MHC molecules, such as HLA-A, -B, and -C (class Ia HLA, human leukocyte antigen), but not HLA-DR, a type II MHC molecule (Figure 1). The standard multilineage differentiation potential of WJ-MSCs was demonstrated following our previously published protocols [26,27] (Figure S1).
As shown in Figure 2, naïve WJ-MSCs exhibited a clear cytoplasmic positivity for some liver-specific epithelial cytokeratins, namely CK-8 (A), CK-18 (B), and CK-19 (C). Figure 2D shows, for the first time, that WJ-MSCs expressed HNF-4α, a molecule directly involved in the induction of albumin and AFP expression [41].
It is known that up to seven forms of connexins, proteins involved in the formation of gap junctions at the cell surface, are expressed in different liver cells [42]. As shown in Figure 2E,F, we detected the expression of hepatocyte-specific connexins 32 and 43 in naïve WJ-MSCs with distinct membrane staining, suggesting that gap junctions normally found in the liver can be formed extensively between these cells [42,43]. The overall results emphasize the ability of WJ-MSCs to differentiate into hepatocyte-like cells (HLCs).

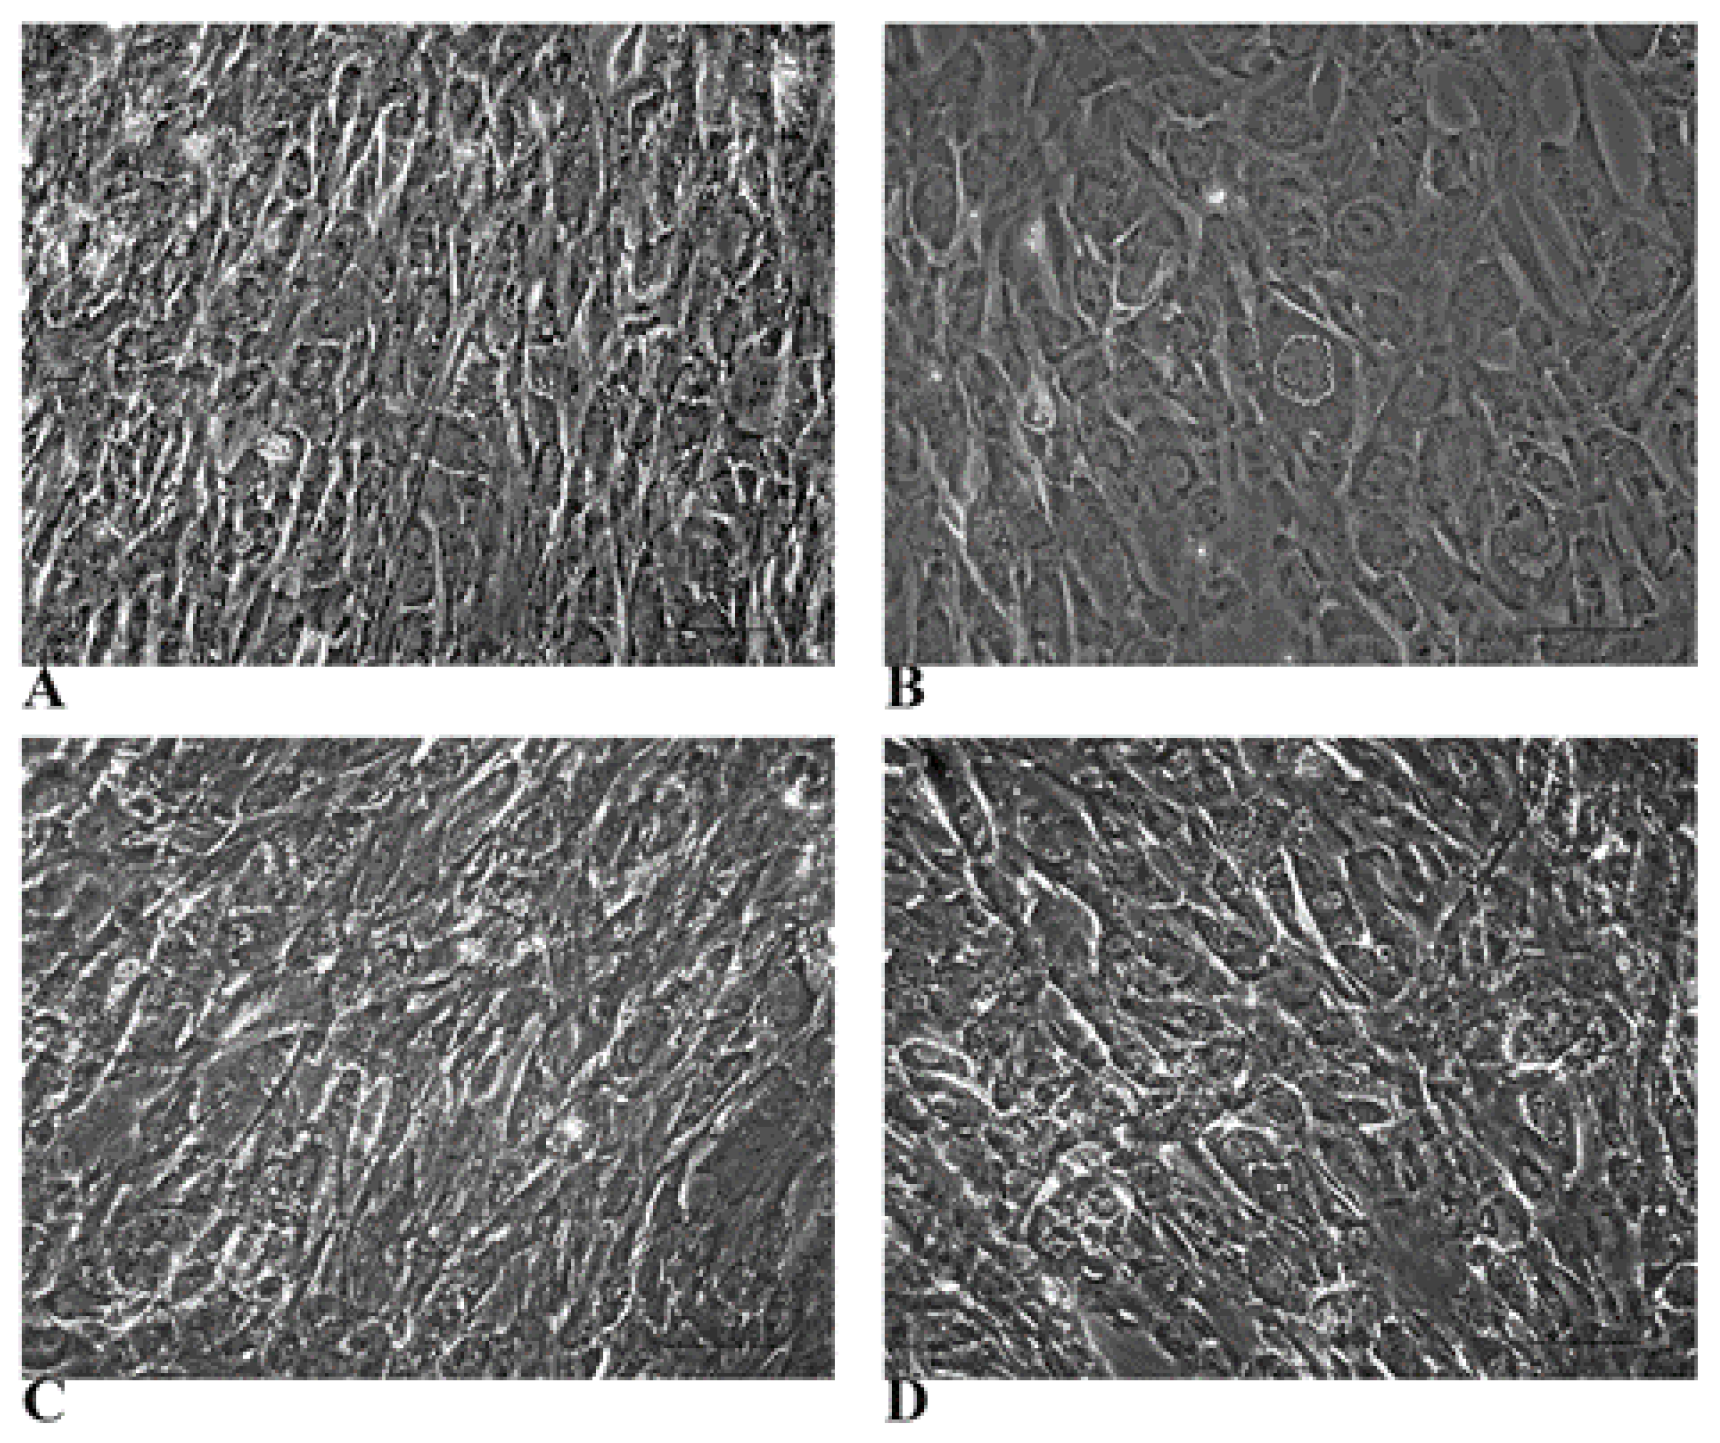
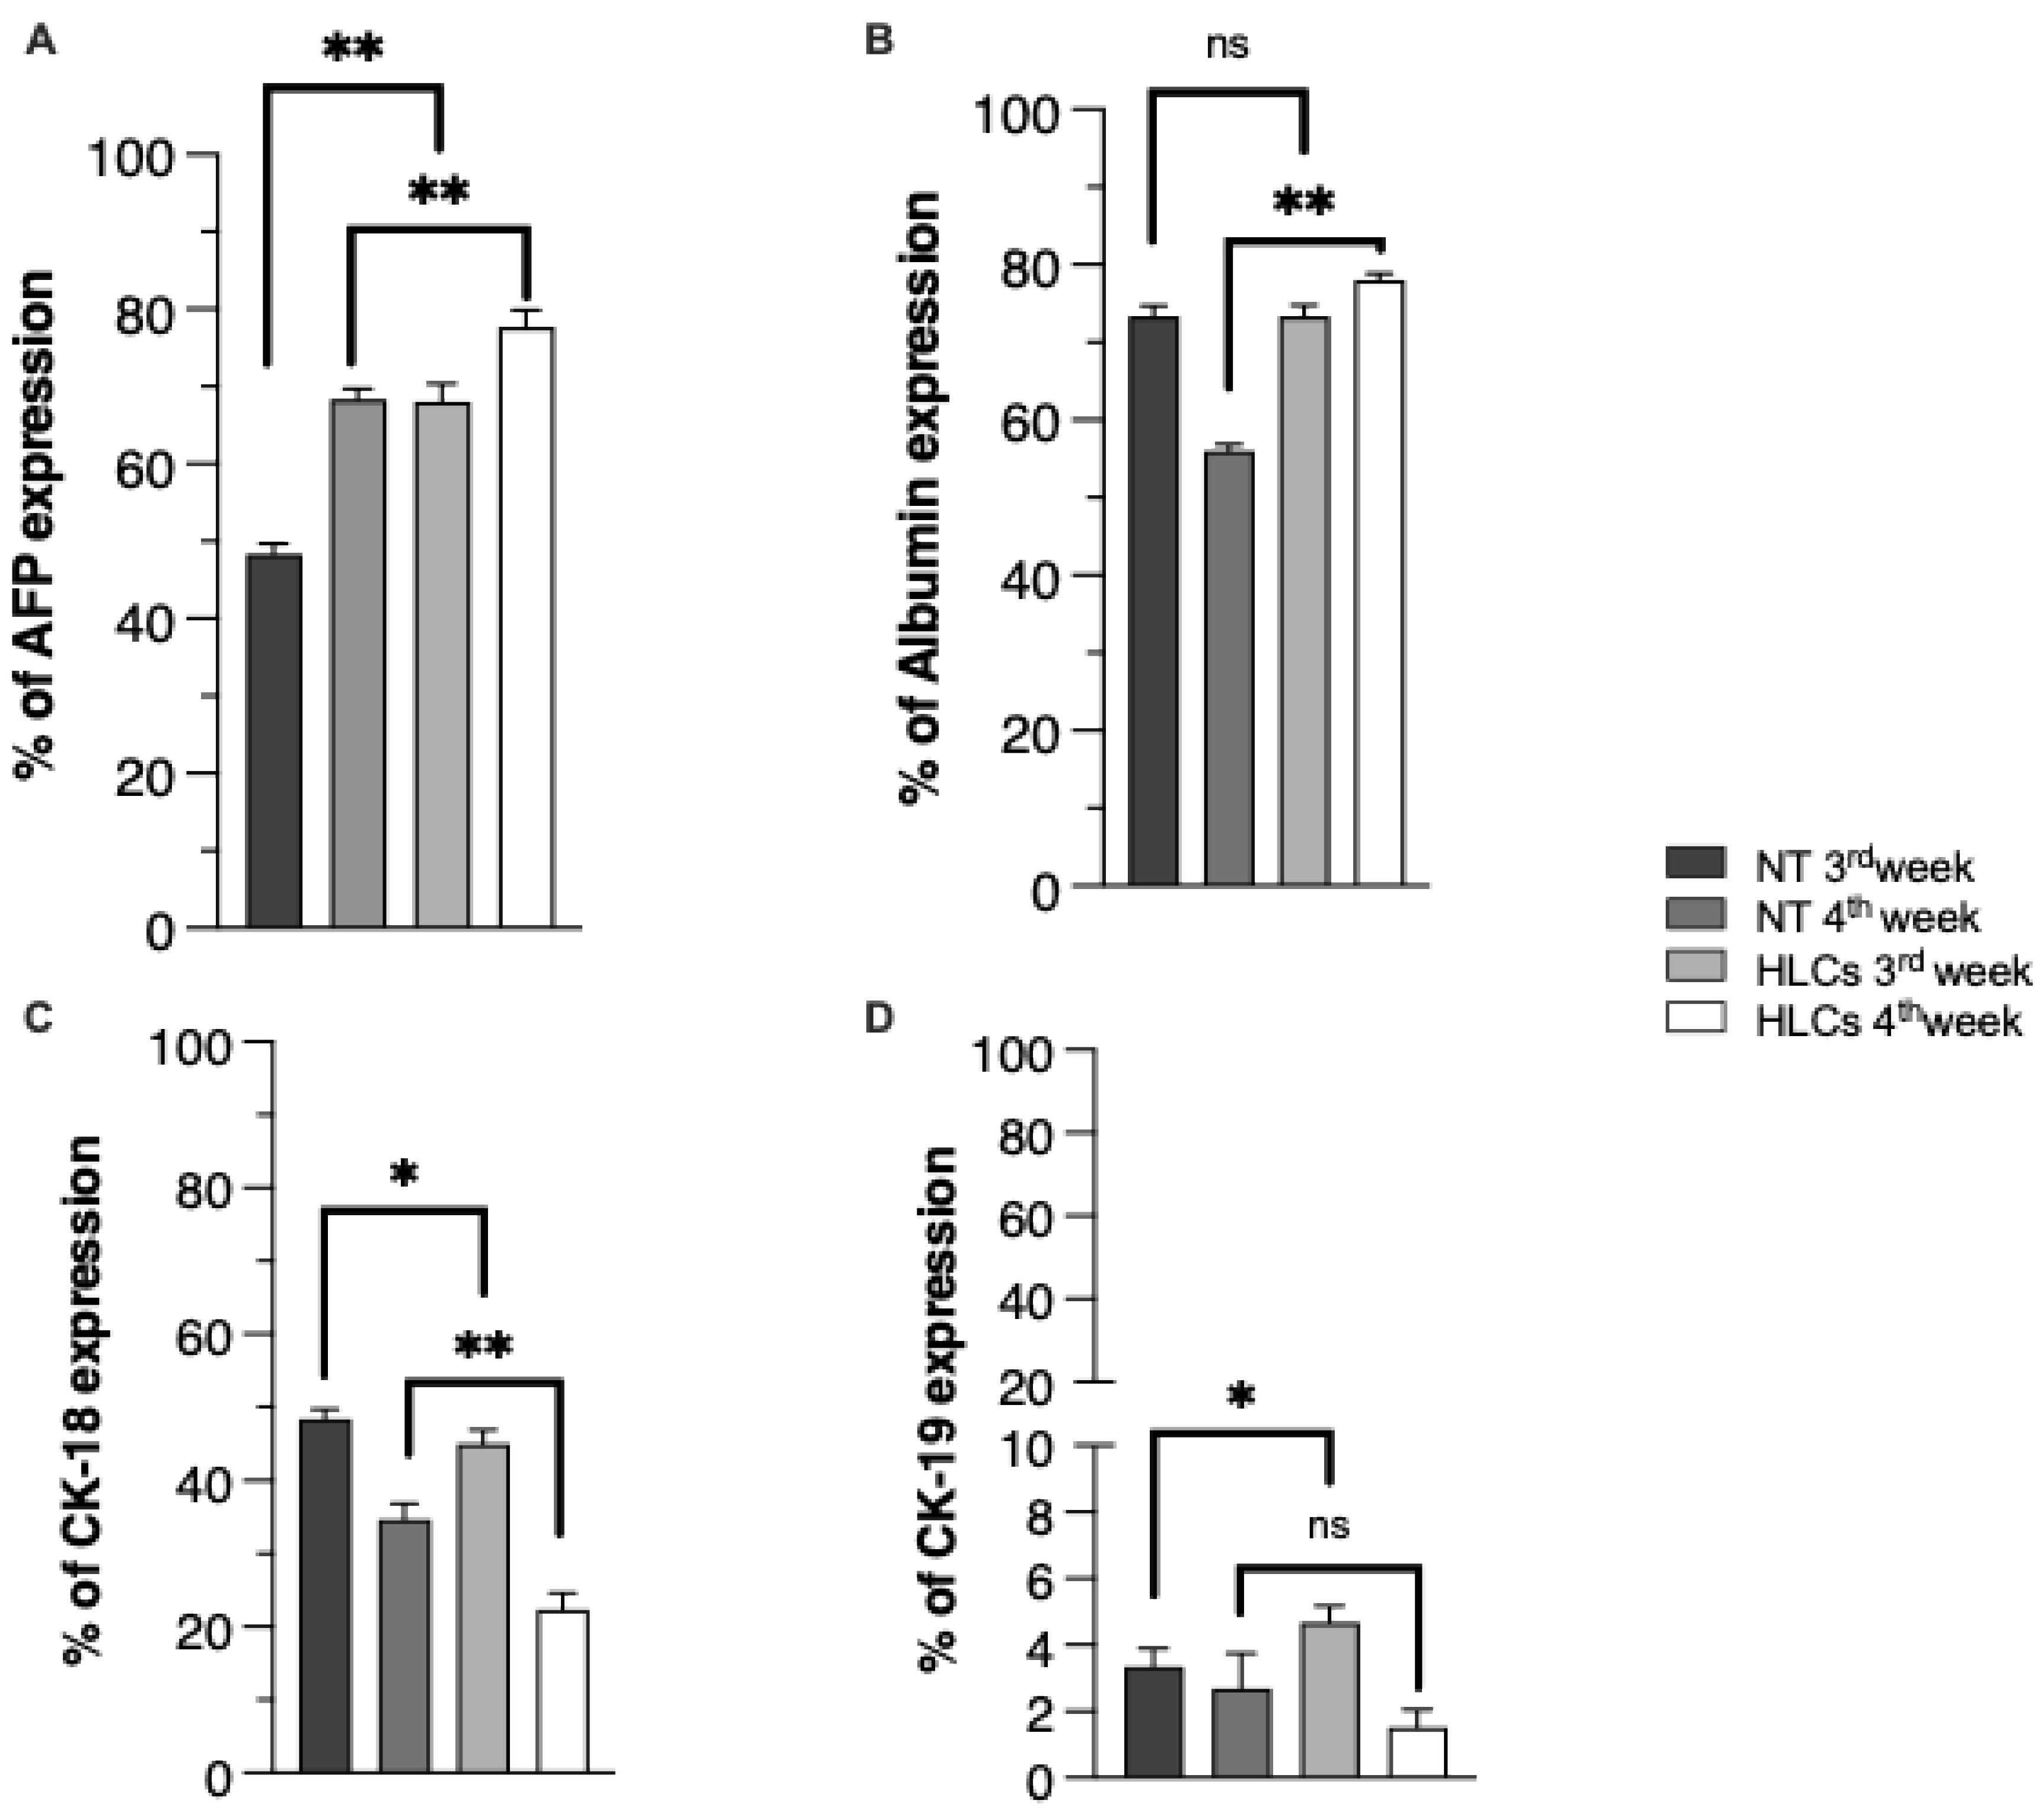
3.2. Evidence of Hepatic Phenotype Acquisition in WJ-MSCs After Hepatogenic Differentiation Protocol

Both HLCs and control WJ-MSCs (cultured in a standard medium; named from here as not treated NT WJ-MSCs) were analysed in the 3rd and 4th week of the differentiation process. Phase-contrast microscopy allowed us to determine a clear morphological switch in HLCs compared with NT WJ-MSCs (alongside the culturing process (Figure 3). HLCs showed a polygonal shape (resembling that of hepatocytes), while NT WJ-MSCs maintained their fibroblast-like morphology (Figure 3).
Importantly, in Figure 4, we showed that HLCs still maintained the phenotype of the parental WJ-MSCs, in line with the observations originally made by Campard and colleagues [44].
To further validate the hepatic-like phenotype acquisition by WJ-MSCs, we performed PAS staining. We observed that NT WJ-MSCs were negative to PAS staining, while HLCs showed an intense diffuse purple–magenta stain, strongly suggesting the presence of glycogen deposits (Figure 5).
While AFP expression may characterize early/fetal hepatocytes, albumin is expressed alongside maturation [39,41]. We showed that the expression levels of these proteins were maintained over the culturing and differentiation period (Figure 6A,B and Figure S2). Mature hepatocytes express CK-18, while they lack CK-19 [43]. Our results confirm this pattern in HLCs; as shown in Figure 6C and Figure S2, CK-18 was expressed in NT WJ-MSCs and HLCs at all time points, while CK-19 was expressed at lower levels with a tendency to decrease as a function of the differentiation in 4th week HLCs.
We showed that both NT WJ-MSCs and HLCs exhibited cytoplasmic positivity for CK-18 at the time points considered (Figure 7A–D). A similar pattern was observed for membrane staining of connexin 32 in NT WJ-MSCs and HLCs (Figure 7E–H). In all immunocytochemical analyses, we used an appropriate negative (Figure S3) and positive control (Figure S4). The human liver sections used as positive controls for the immunocytochemical analyses showed a similar expression pattern of liver proteins with respect to the HLCs (Figure S4).
Figure 8 shows albumin expression, which is strongly positive at the cytoplasmic level in both NT WJ-MSCs and HLCs (Figure 8A–D). HNF-4α expression is also maintained at the nuclear level in both NT cells and HLCs. Importantly, we observed that HNF-4α expression and nuclear localization in NT WJ-MSCs decreased with increasing culture time (Figure 8E,G). HLCs maintained the expression and nuclear localization of HNF4α at all time points considered (Figure 8F,H).
FN is a prominent product of WJ-MSCs and one of the few ECM molecules physiologically produced by hepatocytes in vivo. The morphology of FN extracellular deposits seems to be highly influenced by the applied differentiation protocol: Figure 9A–D shows a clear difference in the morphology of extracellular deposits of HLCs after both the 3rd and 4th week of differentiation steps compared to NT WJ-MSCs.
Conversely, the expression of collagen IV was very low in NT WJ-MSCs at the 3rd (E) and 4th (G) week of differentiation, and the same molecule was not detectable in HLCs at the same time points (Figure 9E–H).

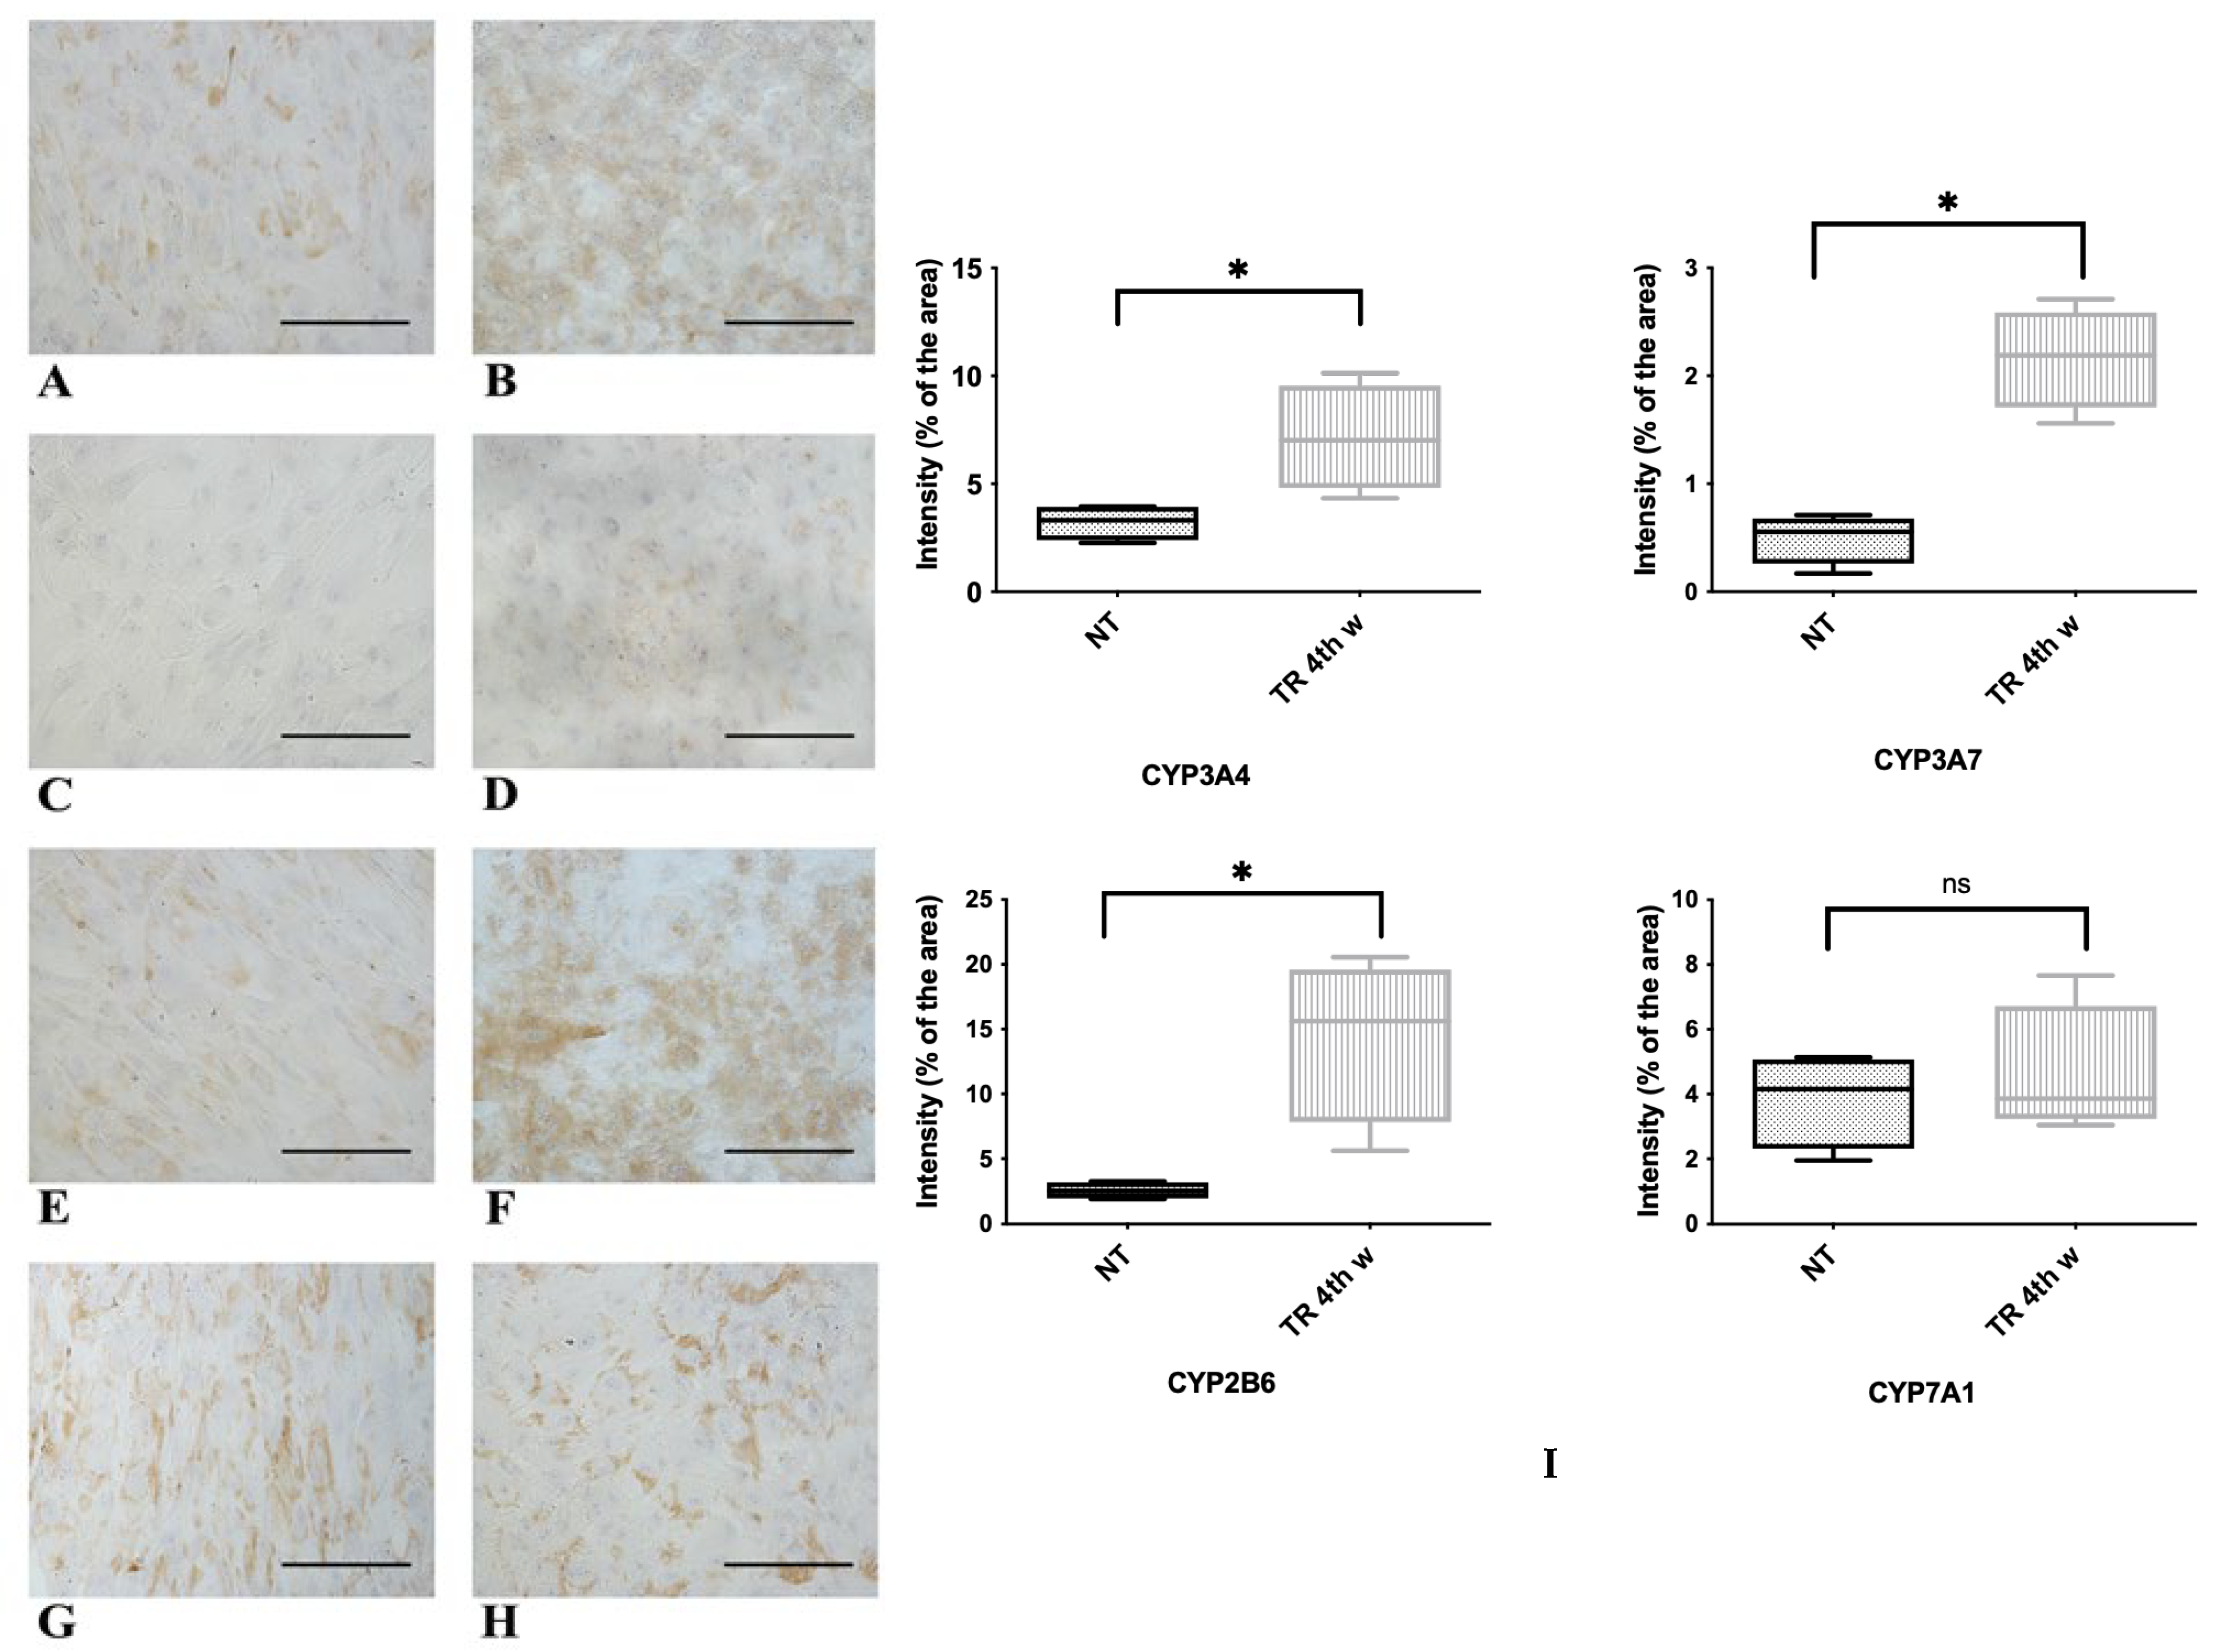
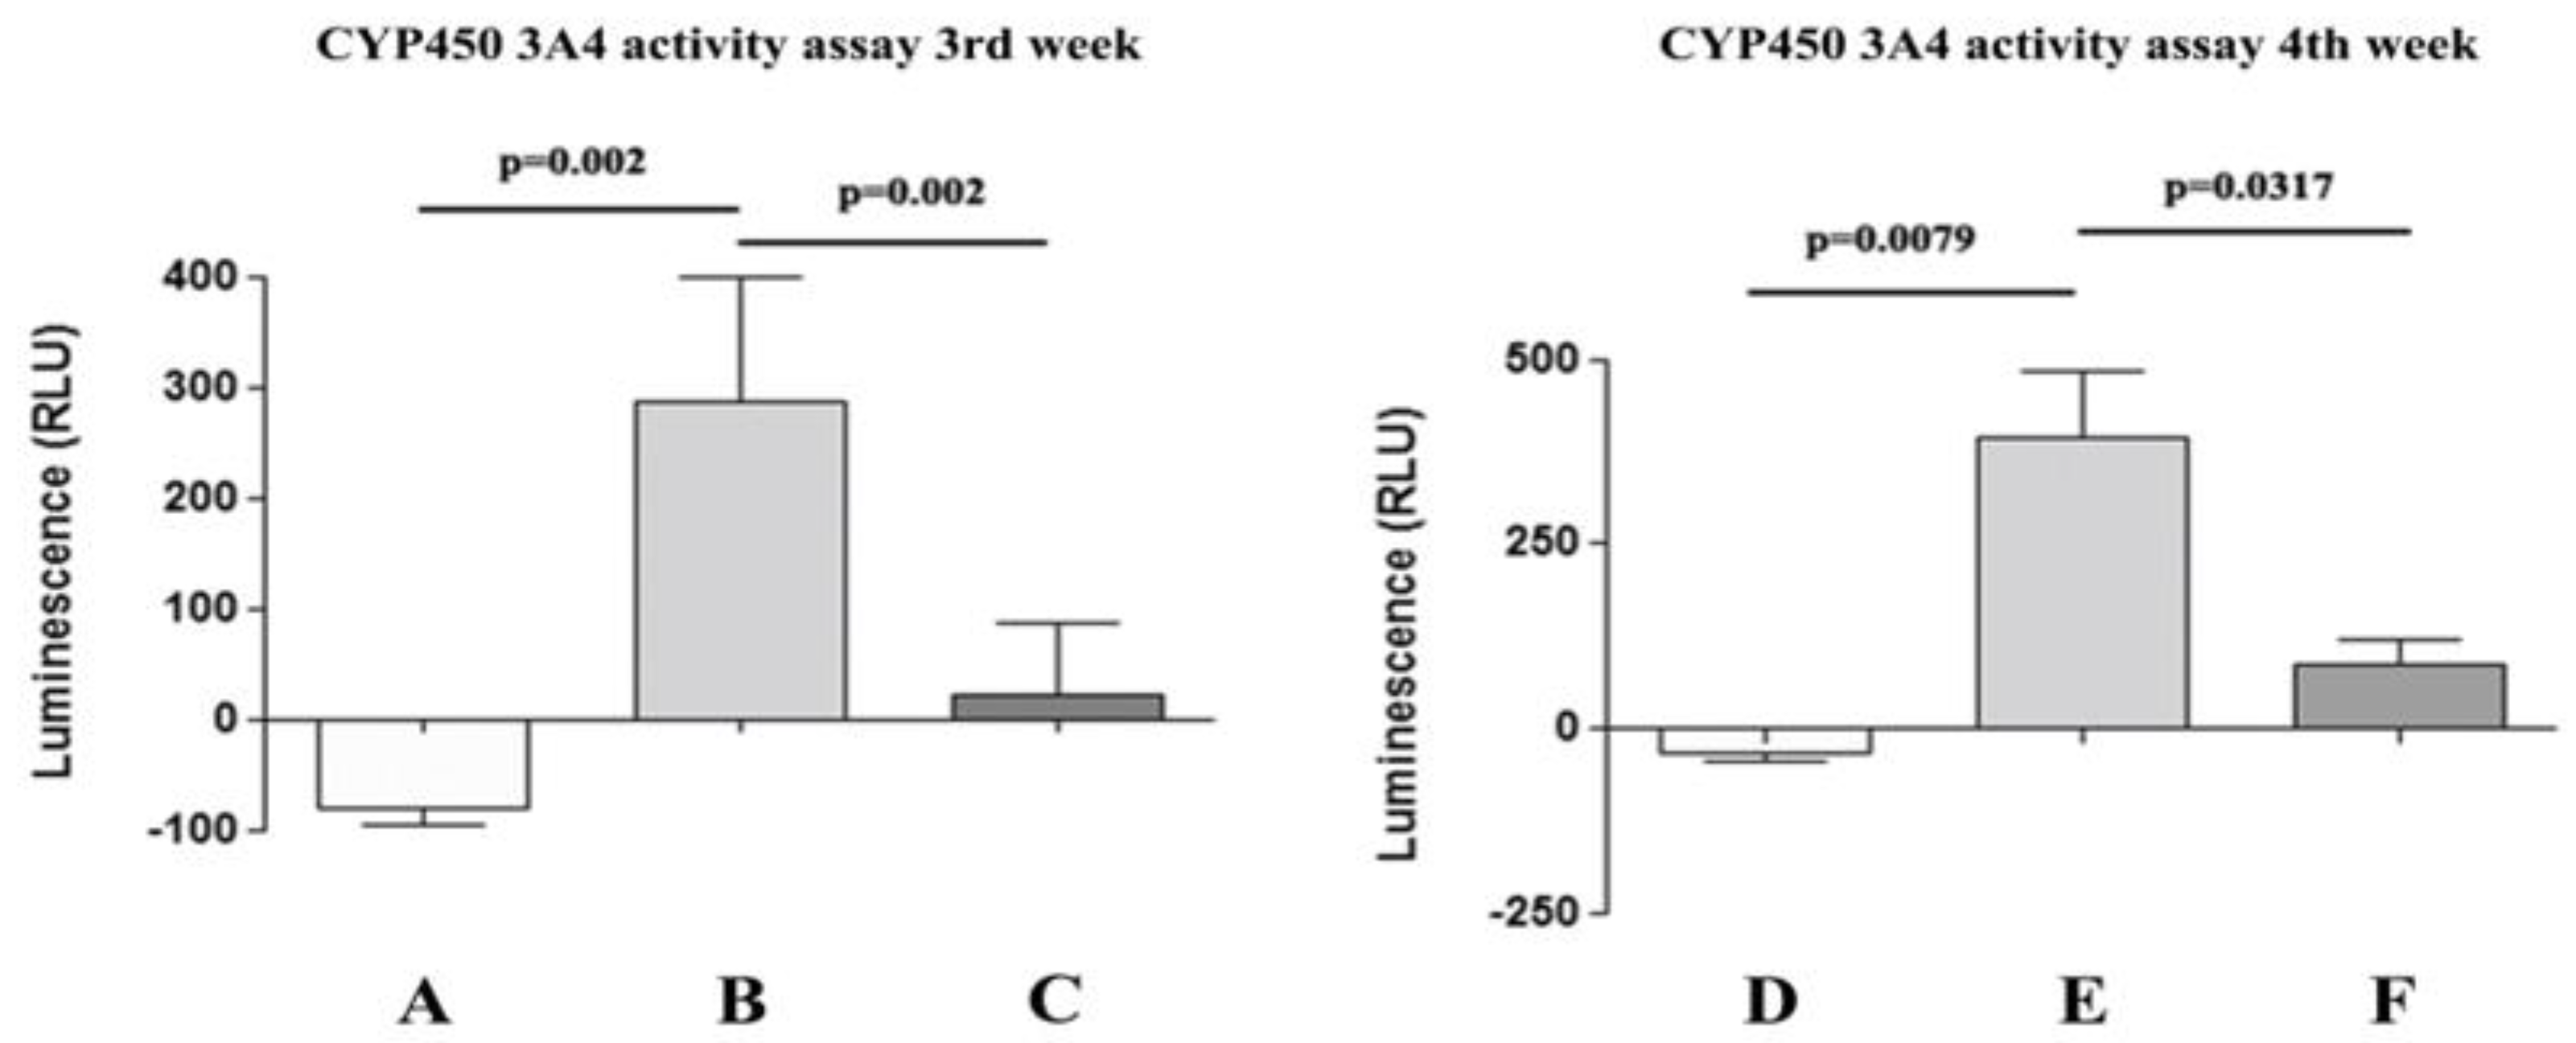
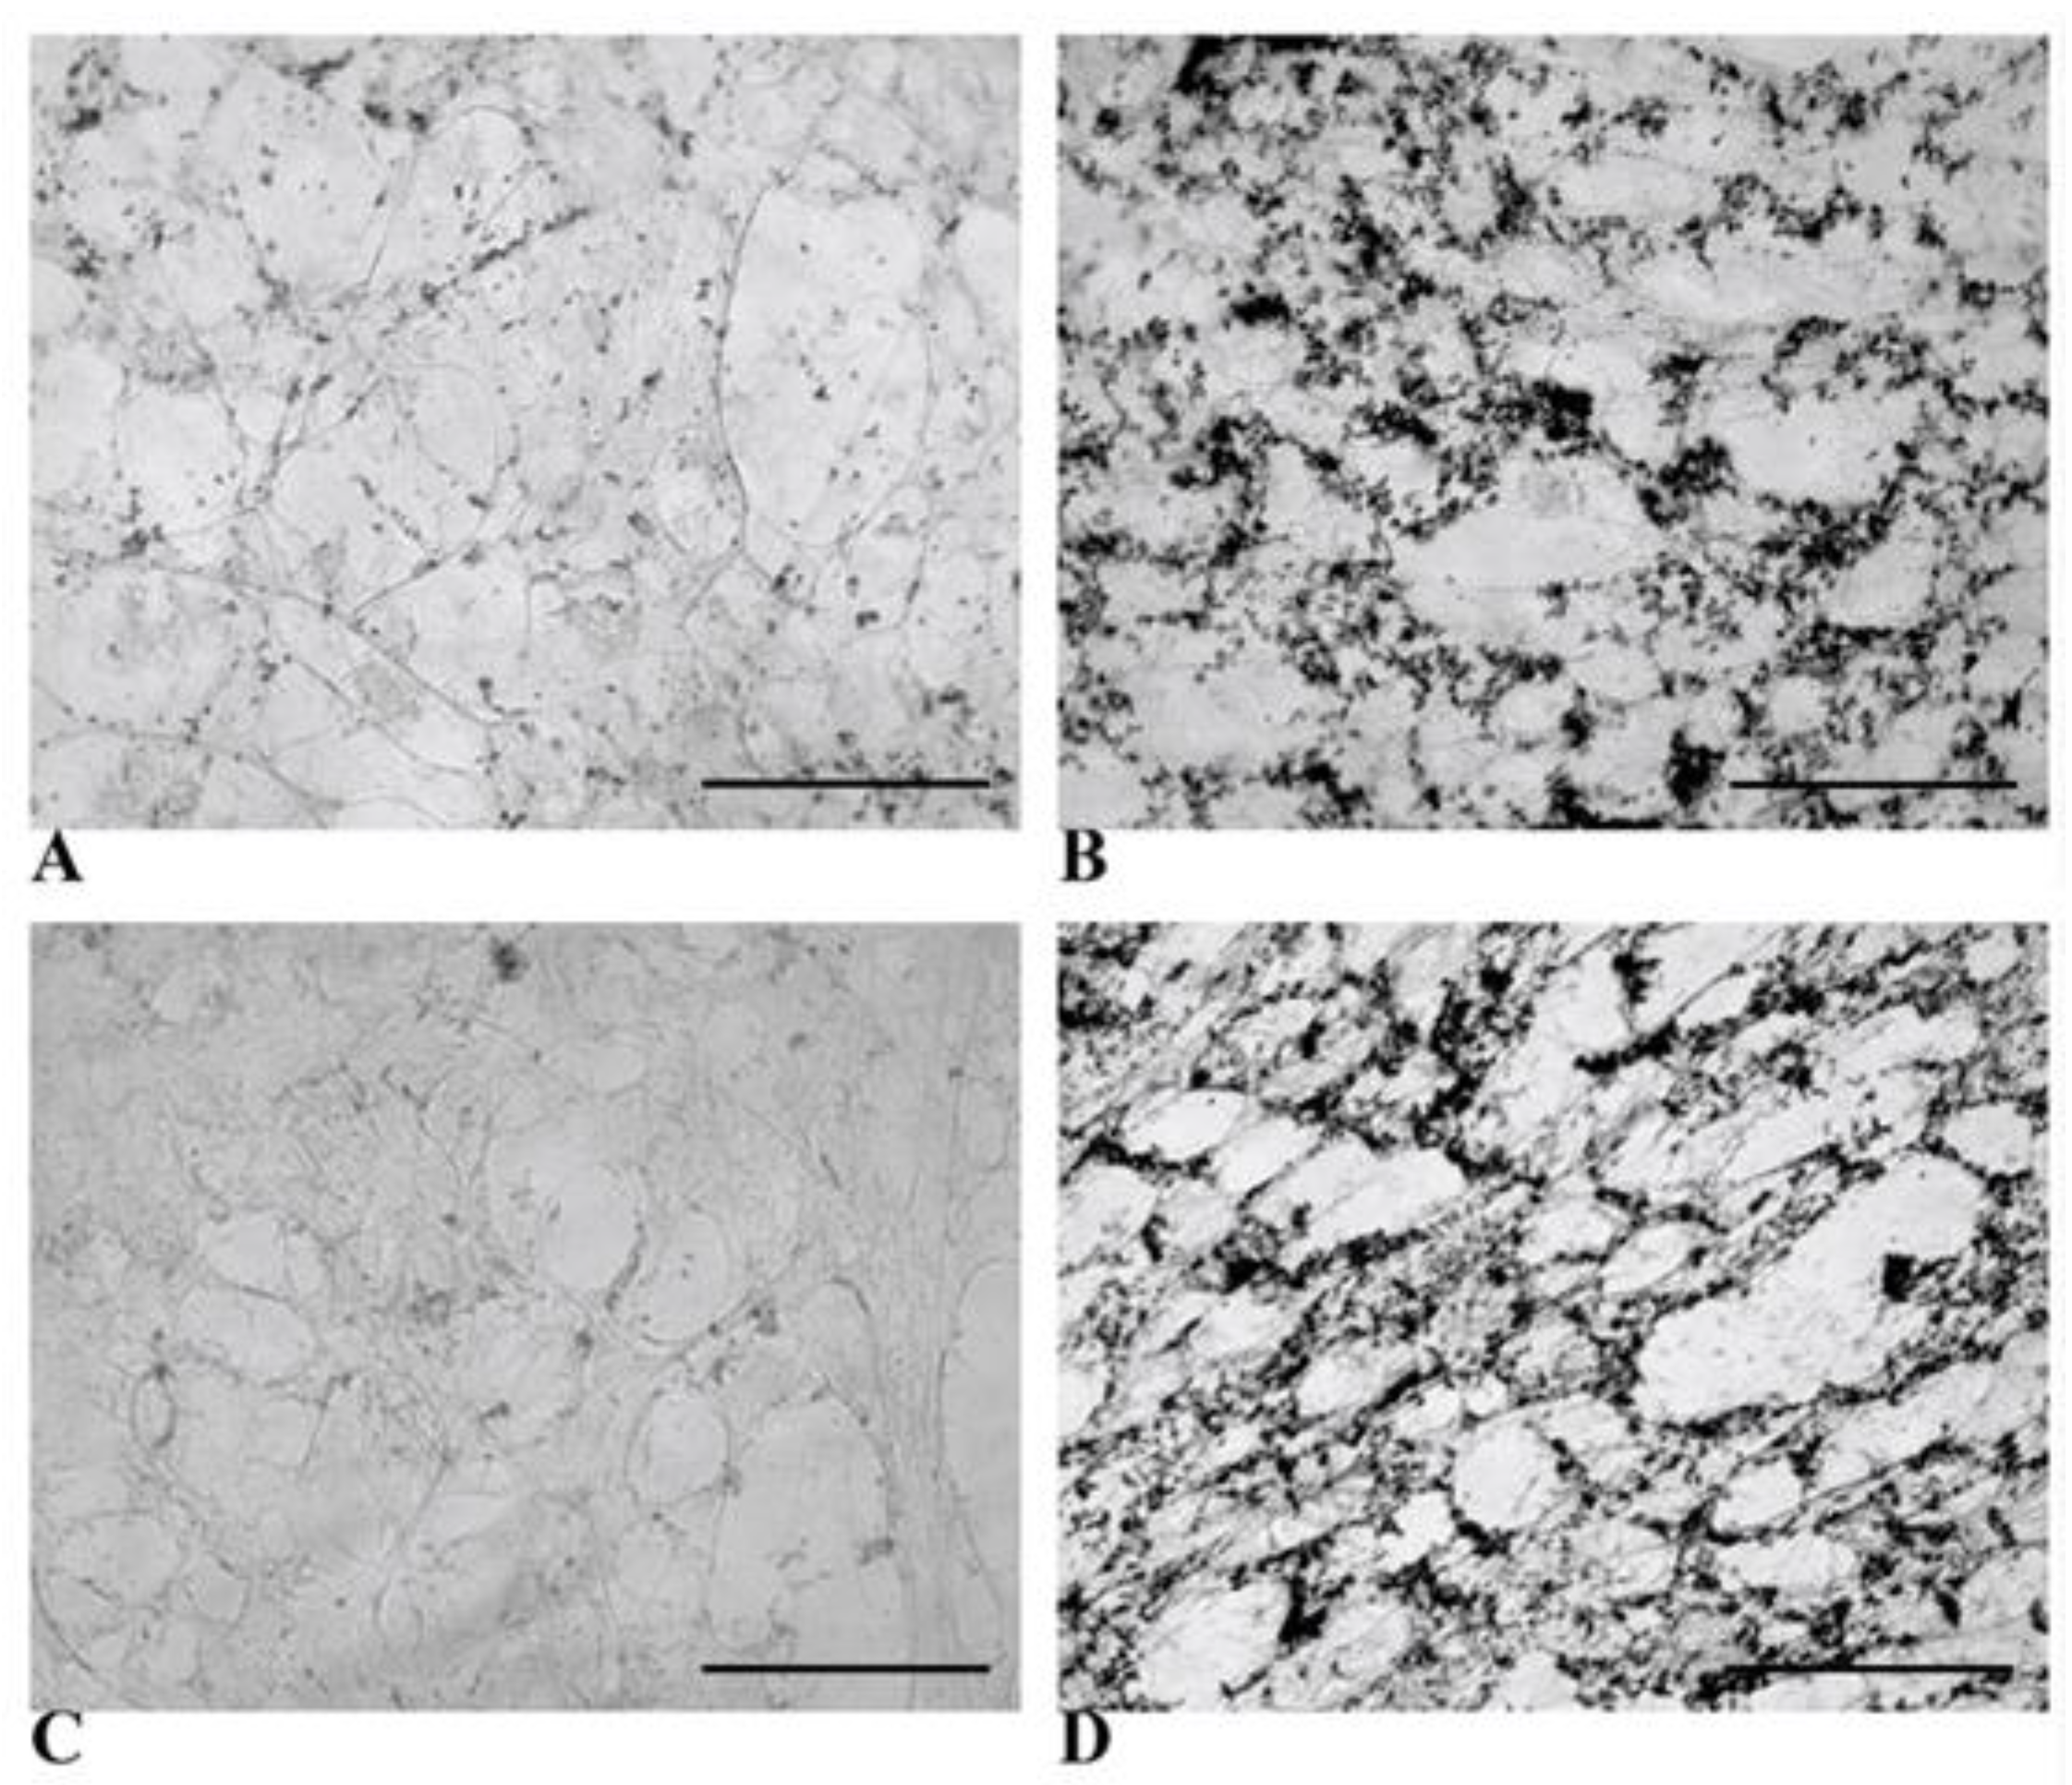
3.3. Functional Features Acquired by WJ-MSCs After Hepatic Differentiation

Hepatocytes carry out important detoxification reactions against xenobiotics through the activity of cytochrome oxidase enzymes known as CYP450 [45]. Since most cytochrome genes are inducible, we examined their expression in both NT WJ-MSCs and HLCs after rifampicin treatment. Figure 10 shows the expression of four CYP450 molecules (namely, CYP3A4, CYP2B6, CYP3A7, and CYP7A1) by ICC. Of the four molecules tested, three, namely, CYP3A4, CYP3A7, and CYP2B6, showed significantly increased positivity in HLCs (Figure 10B,D,F) compared to the controls (NT). In contrast, the expression of CYP7A1 was not significantly different between the two conditions.
The activity of CYP450 3A4 is widely recognized in the literature as a sign of precursor cells becoming mature hepatocytes, making it one of the most specific CYP450 hepatic isoforms [45]. In NT WJ-MSCs and HLCs, we examined CYP450 3A4 activity in response to a specific inducer (rifampicin), either with or without the addition of an inhibitor (ketoconazole). As shown in Figure 11, NT WJ-MSCs, despite incubation with rifampicin, showed negligible CYP450 3A4 activity levels at both the 3rd (A) and 4th (D) week. On the contrary, HLCs responded to rifampicin, showing a significantly higher CYP450 3A4 activity at all tested time points (Figure 11B,E). Moreover, the specificity of CYP450 3A4 activity was confirmed by a notable decrease in its activity when HLCs were co-incubated with the specific inhibitor ketoconazole (Figure 11C,F). Consistent results were observed at all time points tested. This assay clearly showed that rifampicin induces a significant upregulation of CYP450 3A4 in HLCs (but not in NT WJ-MSCs) and that ketoconazole effectively blocks this induction by specifically inhibiting CYP450 3A4 activity.
The function of glucose-6-phosphatase (G6Pase), which is one of the main enzymes responsible for glucose metabolism in the liver, was evaluated in both control cells and HLCs via another functional assay [37,38]. Figure 12 shows that HLCs exhibited significant brownish–black staining due to the presence of lead sulfide precipitates in both the 3rd and 4th weeks. On the contrary, NT WJ-MSCs appeared negative at both time points.

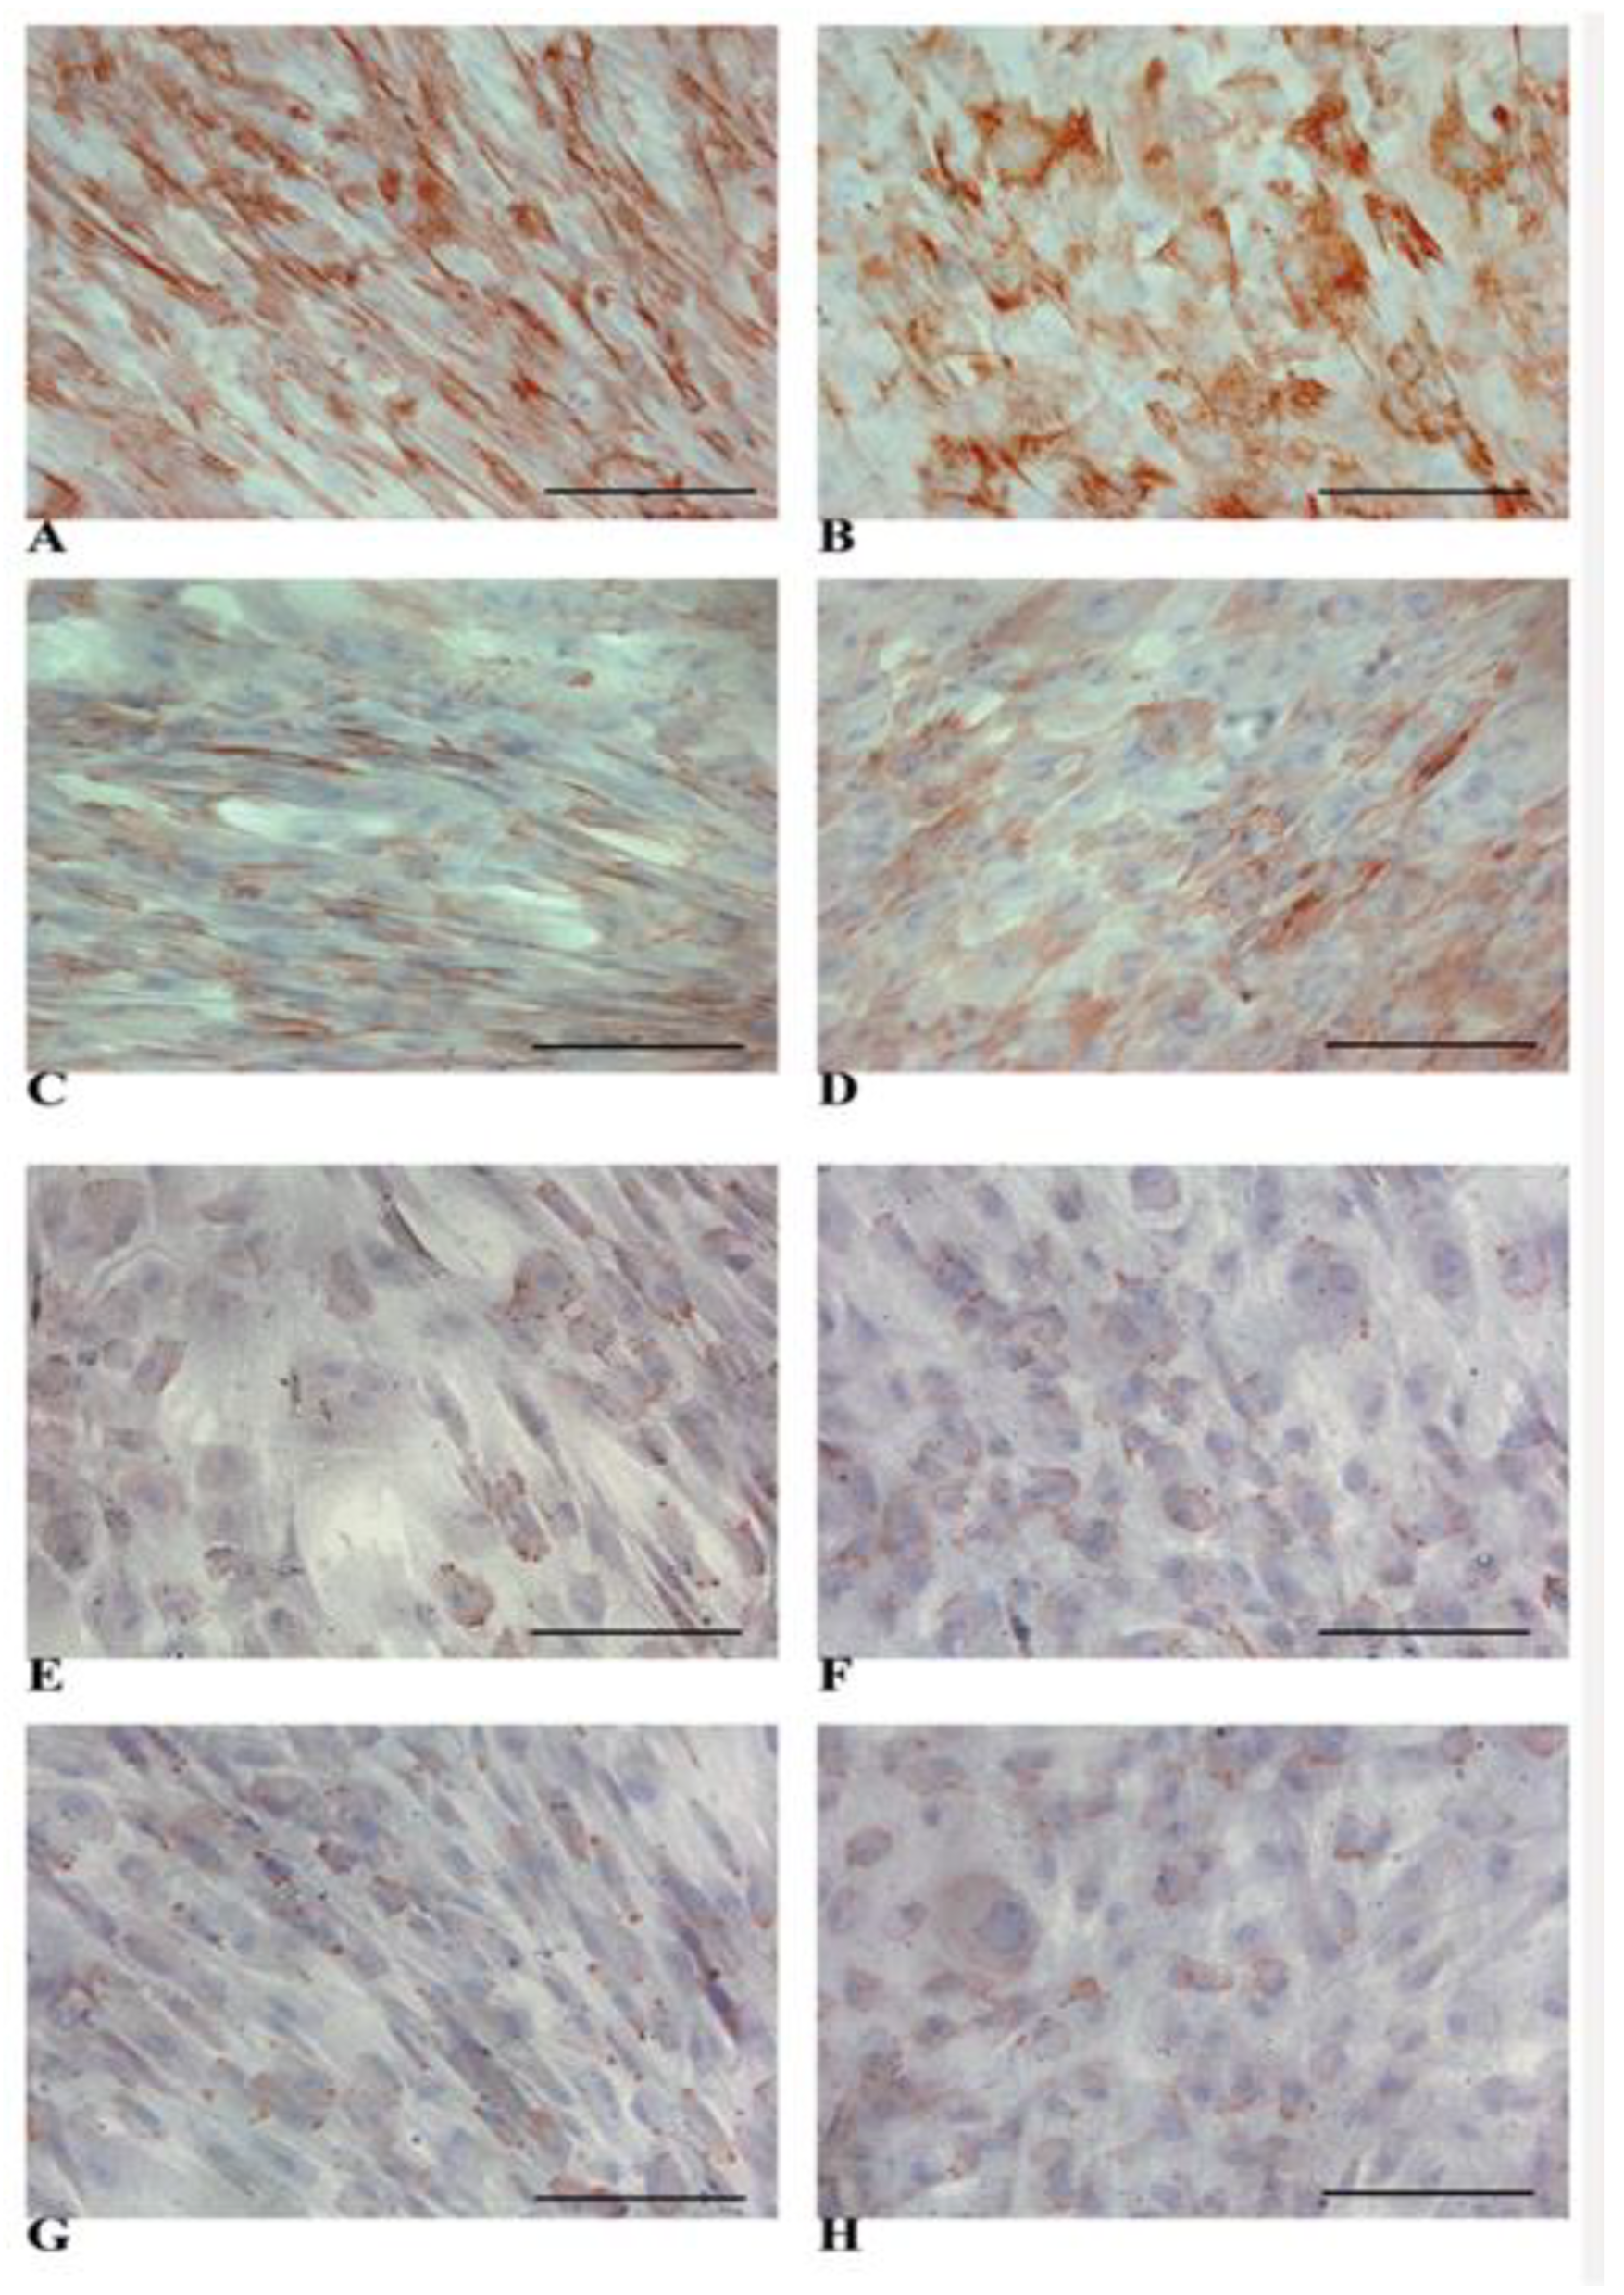
3.4. HLCs Maintain the Immunomodulatory Molecules Responsible for Immune Tolerance

We assessed whether HLCs retained the same pattern of immunomodulatory molecule expression previously observed in naïve cells. We had earlier demonstrated that MHC class I (HLA-ABC) expression is preserved after differentiation (Figure 5). Additionally, both NT WJ-MSCs and HLCs exhibit low levels of HLA-DR expression (Figure 5). For the first time, we also showed that both NT WJ-MSCs and HLCs express HLA-E (Figure 13A), a molecule involved in tolerance induction mechanisms in vivo. Representative immunocytochemical analyses of these three HLAs in both NT and HLC cells are shown in Figure S5. B7H3 (also known as CD276) is an immunomodulatory protein from the B7 family recognized for its co-inhibitory role both in vitro and in vivo. We found that both NT WJ-MSCs and HLCs express B7H3, with a slightly higher expression in the differentiated cells compared to the parental cells (Figure 13B).
Immunocytochemical analysis confirmed that B7-H3 expression was similar in both NT WJ-MSCs and HLCs at all time points (Figure 14A–D).
Another proposed mechanism for MSCs’ immune evasion is the secretion of indoleamine 2,3-dioxygenase (IDO-1), an immunomodulatory enzyme involved in tryptophan catabolism, which directly affects lymphocyte proliferation. As shown in Figure 14, we demonstrate for the first time that both NT WJ-MSCs and HLCs express IDO-1, suggesting that the trans-differentiated cells retain this key primitive feature while also acquiring the mature characteristics typical of HLCs (Figure 14E–H).

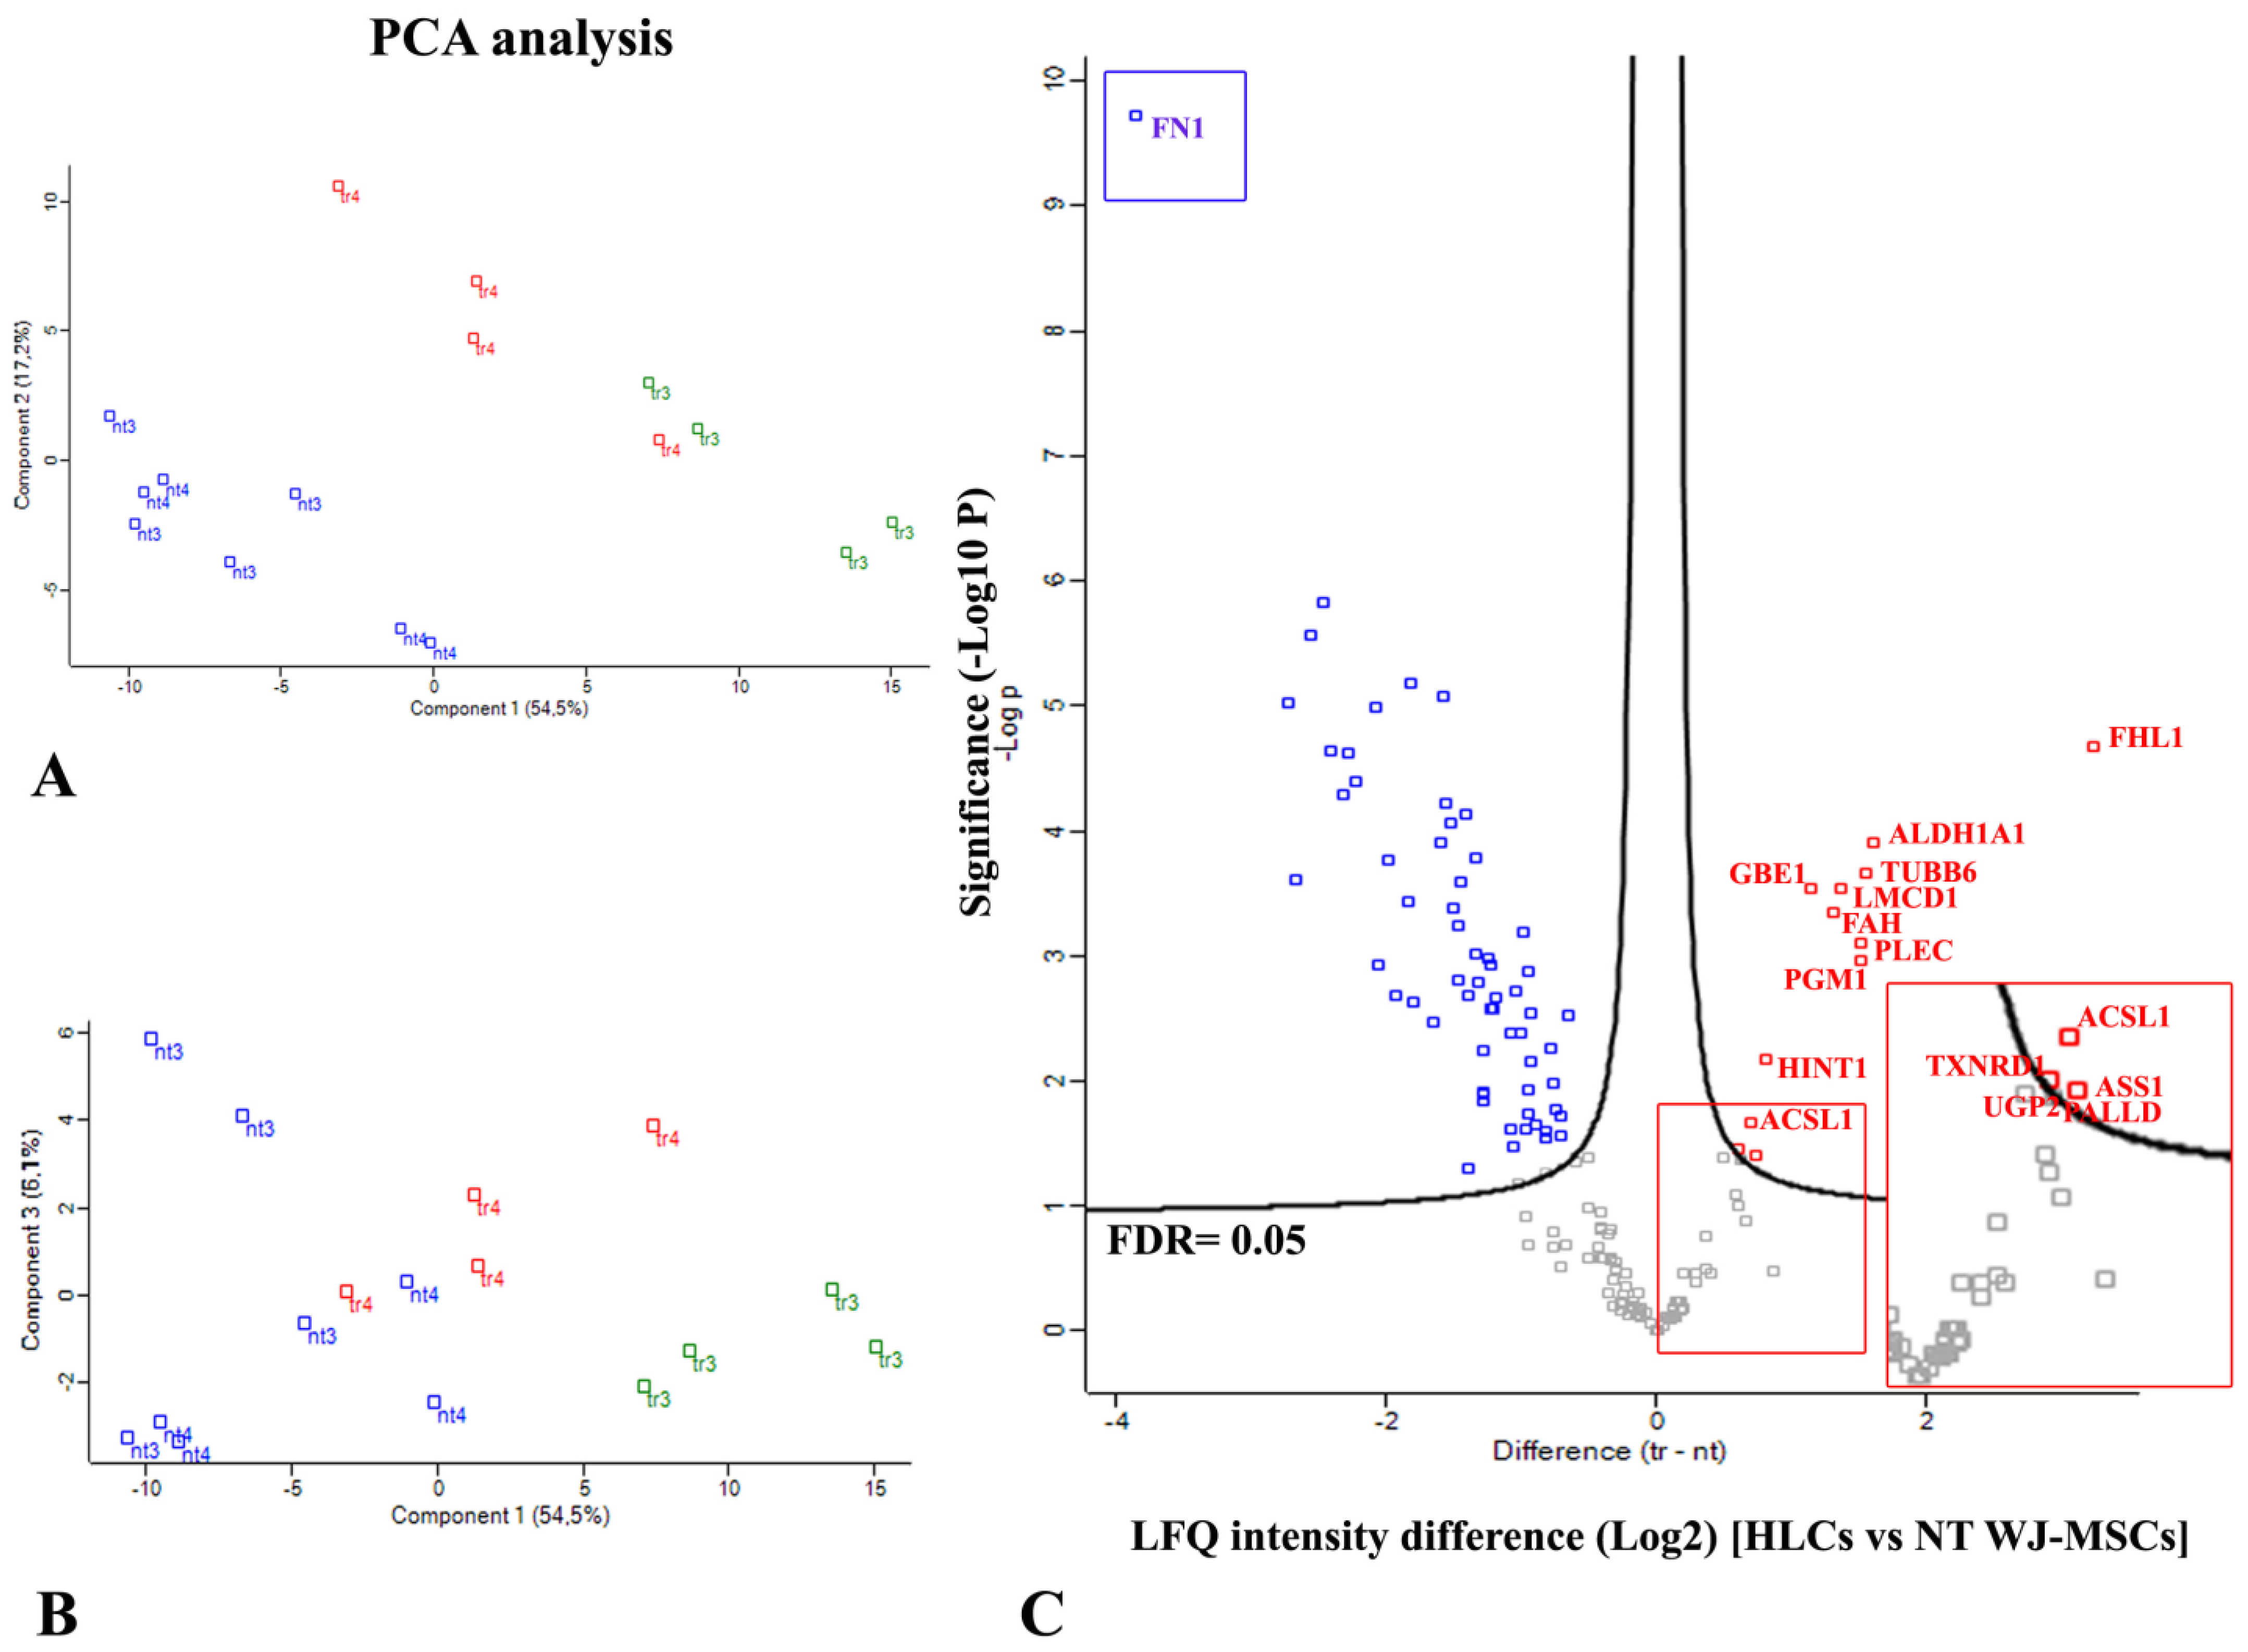
3.5. HPLC-MS/MS Proteome Analyses Identified Novel Intra- and Extracellular Hepatic Proteins in HLCs Derived from WJ-MSCs

The proteomic analysis enabled the identification of 3643 intracellular proteins. Figure 15 displays the global distribution of these proteins, categorized by molecular function (A) and biological processes (B). The two most prominent functional categories were “binding” and “catalytic activity”, each comprising over 30% of the identified proteins (Figure 15A). In terms of biological processes, most of the proteins were involved in cellular processes (30.4%) and metabolic processes (22.5%). A total of 161 intracellular proteins (listed in Table 1) were chosen among the overall data. We included confirmative MSCs-specific molecules, as well as proteins that are involved in hepatic function, described by means of the other techniques.
Interestingly, we found that WJ-MSCs can express proteins involved in several hepatocyte-specific processes: AOX1, CYP51A1, EPHX1, FMO3, GSTM1, GSTO1, GSTP1, NR1I3, and UGT1A4 [46,47,48,49,50,51,52,53].
We found other molecules involved in lipid metabolism, including cholesterol metabolisms: CYP11A1 (mitochondrial form of cholesterol side-chain cleavage enzyme) and CYP39A1 (24-hydroxycholesterol 7-alpha-hydroxylase) [54].
HLCs also expressed molecules such as ATP-binding cassette sub-family A member 1 (ABCA1), the main regulator of HDL and cholesterol export, expressed in the placenta, fetal and adult liver, and other fetal tissues [55,56]; the ATP-binding cassette sub-family A member 6 (ABCA6), highly expressed in the liver [57], and the product of ABCB4 (phosphatidylcholine translocator ABCB4), which is especially expressed on canalicular membrane of hepatocytes, protecting them from the detergent action exerted by bile salts [58].
Our HLCS expressed, at all time points of differentiation, ACADVL, which encodes for the mitochondrial form of the very long-chain specific acyl-CoA dehydrogenase enzyme, specific to the human liver [59], as well as cytosolic acetyl-CoA acetyltransferase (ACAT2), the exclusive cholesterol-esterifying enzyme in hepatocytes [60], and its mitochondrial form (ACAT1).
The HLCs also featured an enzyme involved in fatty acid metabolism and VLDL biosynthesis, the long-chain-fatty-acid-CoA ligase (ACSL), which was found in two isoforms encoded by ACSL1 and ACSL3, previously described in the liver [61].
We also identified the plasma liver-derived angiopoietin-like protein 3 (ANGPTL3), which plays a role in lipid and lipoprotein metabolism [62], along with the gene products of ECHDC2 and EHHADH, both involved in peroxisomal bile production [63].
The HPLC-MS/MS results also showed the expression of key players in the immune response (Table 1), such as the complement factors C1R, C2, C3, C5, and CFH, all of which are produced by the liver in vivo [64,65,66]; prothrombin (F2), which has a role in acute-phase response [67]; IDO-2, which can be involved in immune modulation exerted by IDO-1 on Tregs generation [68]; galectins 1 and 3 (LGALS1 and LGALS3), which play a role in cell suppression of allogeneic T-cell proliferation and liver regeneration after liver transplantation [69,70]; MFGE8, which encodes for a globular protein identified in breast milk (lactadherin) that induces Tregs proliferation and the release of anti-inflammatory IL-10 in newborn’s intestine [71]; PARK7, whose gene product is an anti-oxidant protein (DJ-1) that promotes Tregs proliferation and regulates hepatic progenitor cells [72]; PZP, a plasma protein, named pregnancy zone protein, that binds the placental protein-14 on T cell surface to inhibit T cell activation during late pregnancy [73].

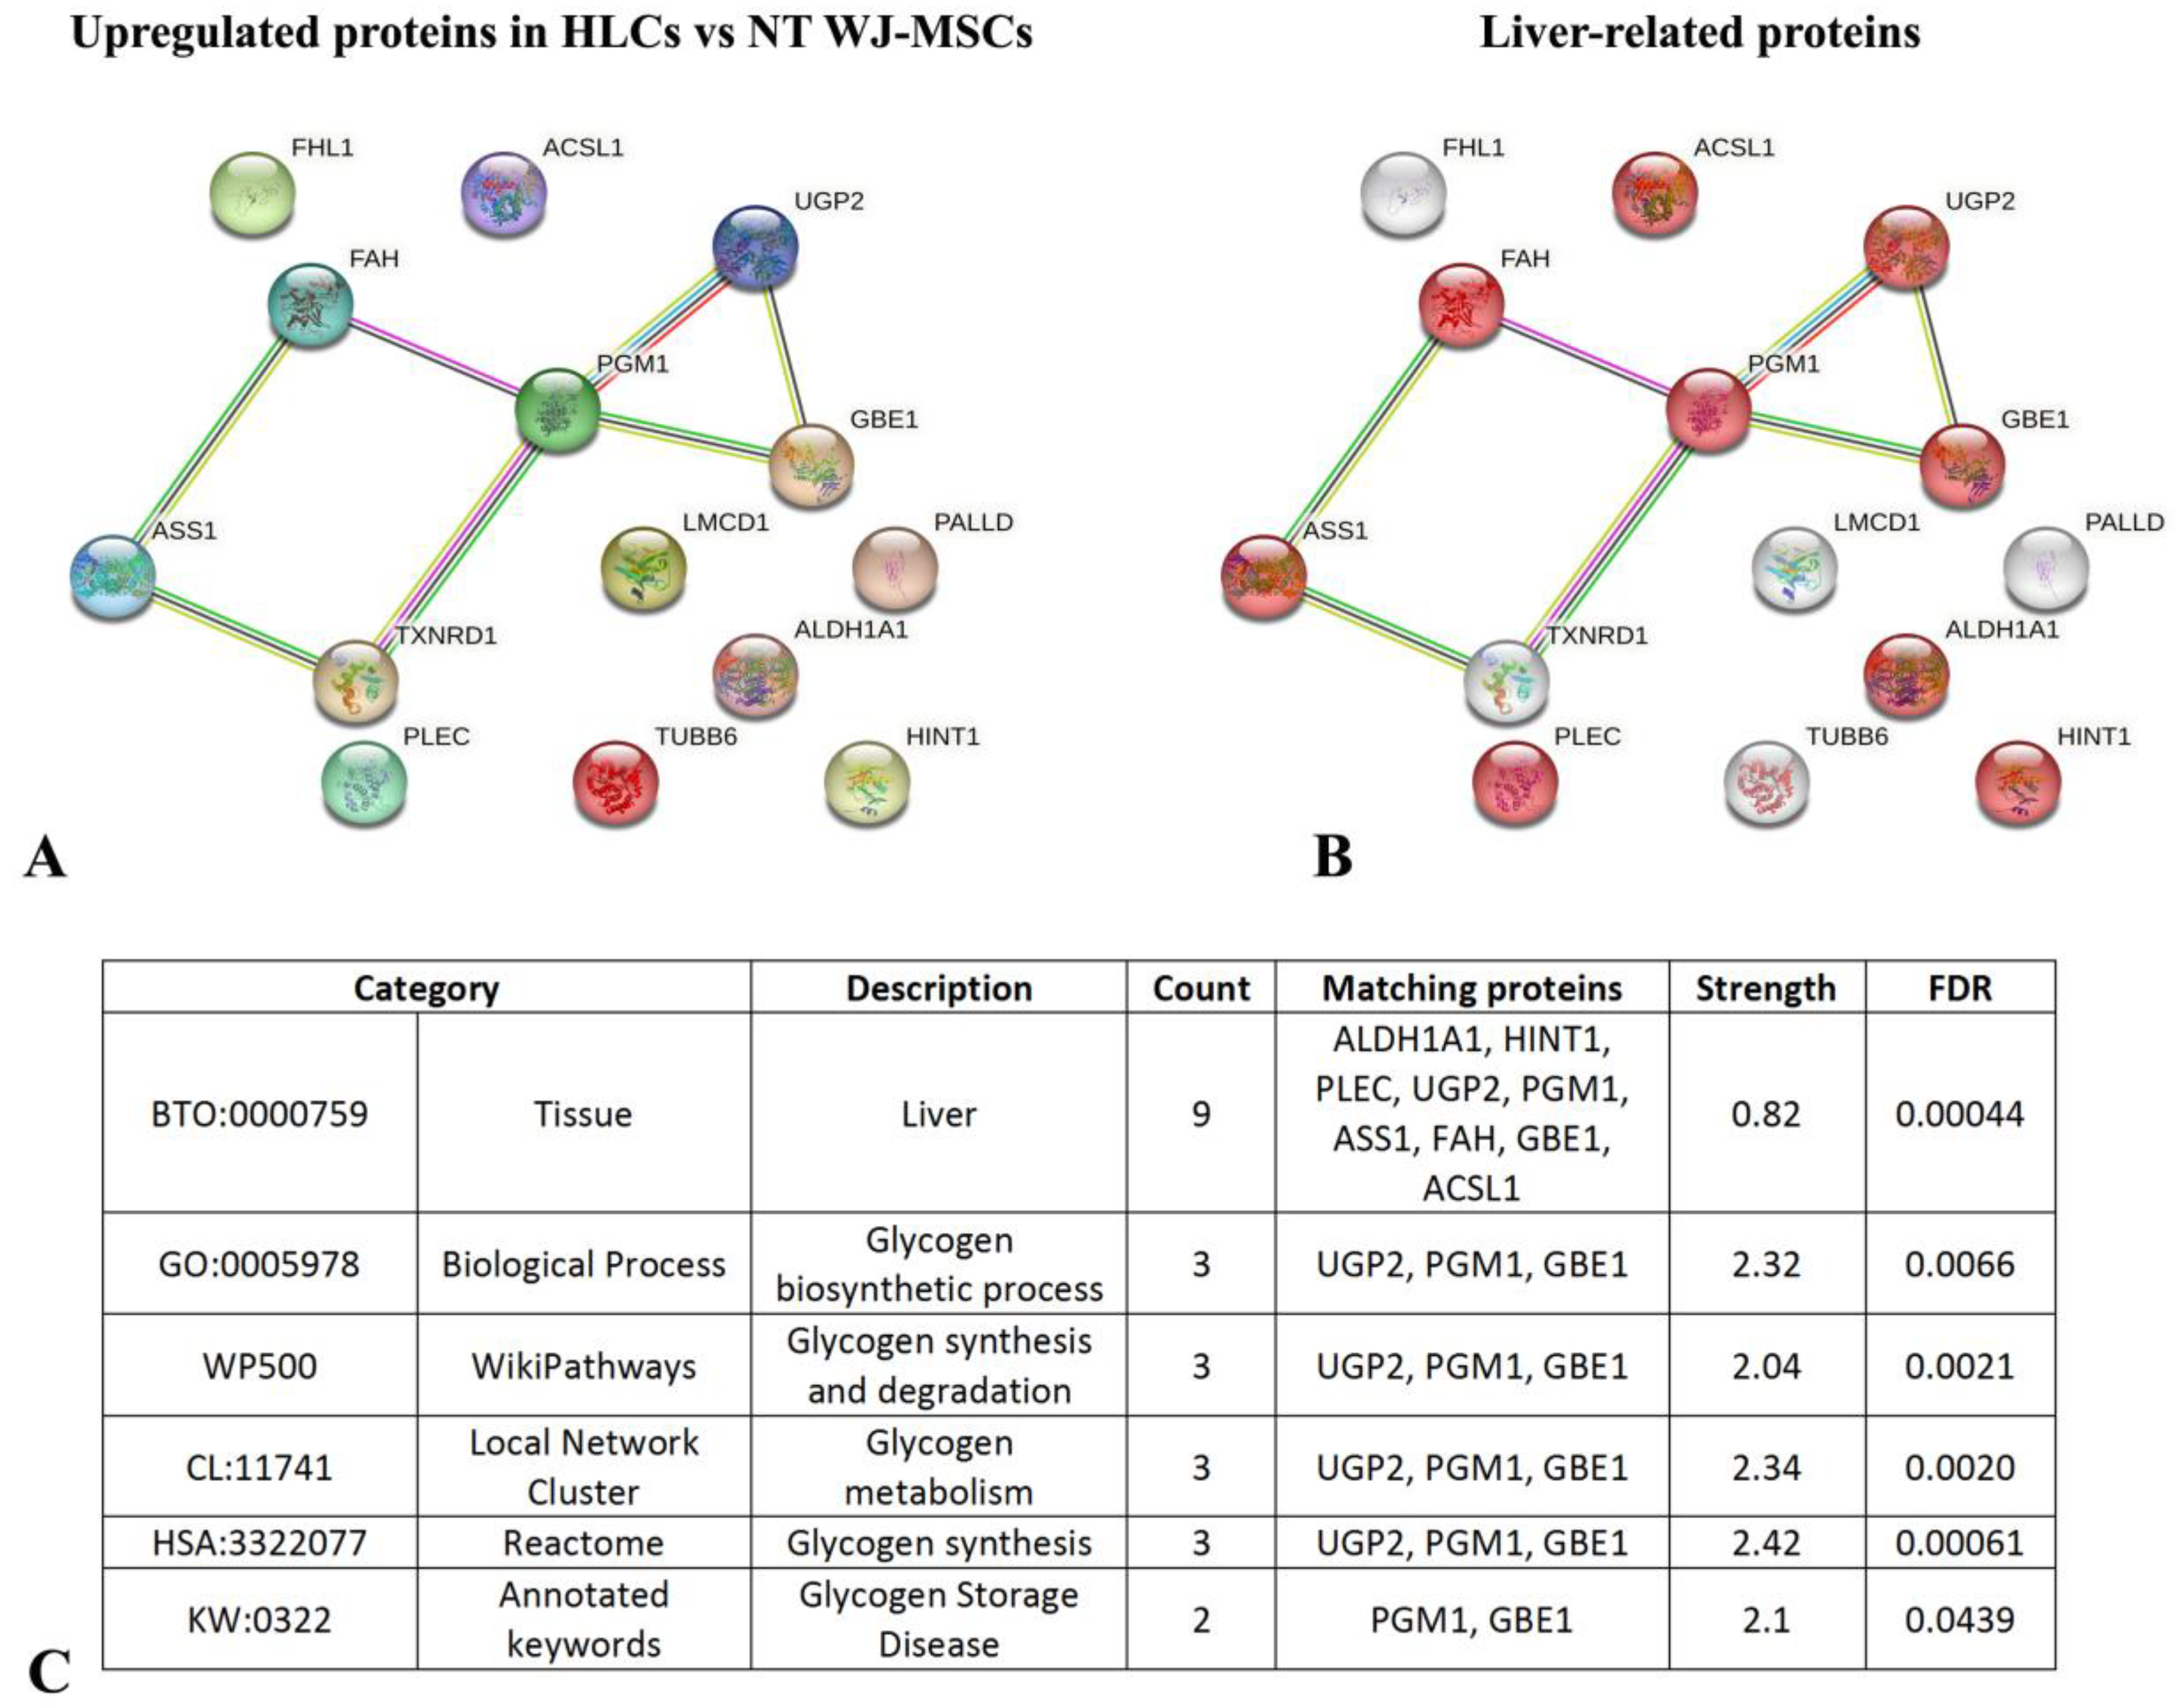
Quantitative Analysis of Proteins Differentially Expressed in HLCs Revealed an Increase in Liver-Enriched Enzymes with Respect to NT WJ-MSCs

Principal component analysis (PCA) revealed a clear distinction between the intracellular proteins differentially expressed by NT WJ-MSCs (nt) and HLCs (tr), independent of the differentiation week (Figure 16A). Notably, it was possible to discriminate between 3rd- and 4th-week HLCs by plotting the components 3 and 1, while the 3rd and 4th NT WJ-MSCs were not distinguishable (Figure 16B).
The Volcano plot shown in Figure 16C, generated using a t-test, highlights significant differences in the expression of intracellular proteins between NT WJ-MSCs and HLCs (see Table S3 for details).
14 proteins were found to be upregulated following the hepatic differentiation protocol, marked in bold red on the right side of the graph. These proteins include FHL1, ALDH1A1, TUBB6, PGM1, PLEC, LMCD1, FAH, GBE1, HINT1, ASS1, ACSL1, PALLD, TXNRD1, and UGP2, as listed in Table S3.
Additionally, no significant differences were observed between the 3rd and 4th week NT WJ-MSCs, while proteins with differential expression were identified in 4th week HLCs compared to those from the 3rd week.
Quantitative analysis revealed a significant increase in the expression of liver-enriched markers in HLCs, such as fumarylacetoacetase (FAH), 1,4-alpha-glucan-branching enzyme (GBE1), long-chain-fatty-acid-CoA ligase 1 (ACSL1), argininosuccinate synthase (ASS1), and UTP-glucose-1-phosphate uridylyltransferase (UGP2), all of which are strongly associated with liver tissue (Table S3). Notably, UGP2, as shown in Table S4, was also significantly more expressed in 4th week HLCs compared to 3rd week HLCs.
Other liver-enriched markers that are upregulated in 4th week HLCs compared to 3rd week HLCs include nicotinamide N-methyltransferase (NNMT), phosphoserine aminotransferase (PSAT1), 7-dehydrocholesterol reductase (DHCR7), and neutral alpha-glucosidase AB (GANAB) (Table S4).
After identifying the 14 most upregulated proteins in HLCs, we utilized the STRING database (https://string-db.org/, accessed on 15 October 2024) to define the known and predicted physical and functional protein–protein interaction networks most associated with liver tissue expression.
As shown in Figure 17A, six proteins were found to be interrelated, while nine proteins (Figure 17B) were linked to liver tissue (category BTO:0000759; FDR 0.00044, Table S5). These proteins include retinal dehydrogenase 1 (ALDH1A1), histidine triad nucleotide-binding protein 1 (HINT1), plectin (PLEC), UTP-glucose-1-phosphate uridylyltransferase (UGP2), phosphoglucomutase-1 (PGM1), argininosuccinate synthase (ASS1), fumarylacetoacetase (FAH), 1,4-alpha-glucan-branching enzyme (GBE1), and long-chain-fatty-acid-CoA ligase 1 (ACSL1) (highlighted in red in Figure 17B). Notably, UGP2, as shown in Table S4, is significantly more expressed in 4th week HLCs compared to 3rd week HLCs. Interestingly, three proteins (UGP2, PGM1, GBE1) were related to glycogen metabolism, both synthesis and degradation. Especially GBE1 is known to be related to glycogen storage disease type IV (Figure 17C). More information about the results from the STRING database is listed in Table S5.

4. Discussion

Overall, the data presented in this study further support the concept that functional HLCs can be derived from perinatal stromal cells. Stromal cells from perinatal tissues have been proposed to differentiate into HLCs and potentially correct liver diseases, either through a pre-differentiation step or as naïve cells [43,44]. A key feature of perinatal-derived cells is their immunomodulatory ability, which can be maintained even after differentiation, as suggested by previous reports from our group and others [26,74]. Despite the growing body of evidence supporting the use of perinatal cells for HLC derivation, comprehensive information on the overall characteristics and biology of these candidate cells for transplantation is still lacking.
To address this gap, our study focused on an extensive characterization of HLCs derived from WJ-MSCs, analyzing markers, functional activities, and the expression of immunomodulatory molecules. This work aims to broaden the therapeutic potential of these cells for various applications.
Our findings offer mechanistic insights into the results observed from WJ-MSCs transplantation in vivo. The key points from our study are as follows:
(i) WJ-MSCs can be differentiated into HLCs using the same factors involved in hepatocyte specification in vivo. These HLCs exhibit multiple hepatocyte differentiation markers and display several mature hepatocyte functions.
(ii) HLCs retain the expression of molecules that may contribute to their immune privilege even after differentiation.
The comprehensive characterization of HLCs derived from WJ-MSCs, which was further detailed by proteomic analyses, indicated that the differentiation protocol has successfully generated a cellular population showing many features of mature hepatocytes.
For the first time, we have also shown that HLCs acquire specific abilities to secrete components of their pericellular matrix. Although often overlooked, the balance between a “healthy” and “diseased” pericellular matrix is critical for hepatocyte function. Pathological conditions such as liver fibrosis and cirrhosis are characterized by significant changes in the extracellular matrix that affect hepatocyte physiology. We wanted to investigate whether the differentiation protocol affects the secretion of important extracellular matrix components such as fibronectin (FN) and type IV collagen. For the first time, we were able to show that HLCs alter the deposition of fibronectin (FN) in the extracellular space because of the differentiation process. We observed that FN in HLCs is predominantly deposited at the apical membrane of the cells, mimicking the “disrupted basement membrane” typically formed by hepatocytes towards the Disse space. In vivo, this membrane lacks the deposition of collagen IV, a protein that is not produced by hepatocytes. Our results highlighted that collagen IV is deposited at very low levels in naïve WJ-MSCs, and its presence further decreases in HLCs. These data suggest that transplanted HLCs could secrete different factors in loco, restoring the correct combination of components of the extracellular milieu as in healthy liver parenchyma.
Hepatocyte maturation is tightly regulated at the transcriptional level [38]. Therefore, we investigated the expression of a key factor from the FoxA protein family, known as hepatocyte nuclear factor 4 alpha (HNF-4α), which plays a critical role in liver development at both early and late stages. Our data, for the first time, demonstrated that naïve WJ-MSCs specifically express HNF-4α (Figure 2D), suggesting its involvement in the activation of genes such as AFP and albumin, which are early and late hepatocyte-specific markers, respectively. Both genes contain inducible elements in their promoter regions that respond to HNF-4α binding. This finding provides additional support for the use of differentiation protocols aimed at generating HLCs, further enhancing the data from previous studies [41].
Here, we also highlighted that HLCs, apart from featuring several “hepatocyte markers”, should be able to perform the critical physiological functions of hepatocytes such as glucose metabolism and xenobiotics detoxifications. HPLC-MS/MS allowed us to confirm the expression of proteins that were already characterized in this work with other techniques and highlighted several new markers, such as enzymes involved in xenobiotic detoxification, lipid, cholesterol, bile acids, and alcohol metabolisms, in the urea cycle, and in liver morphogenesis and/or regeneration. We identified the product of AOX1, a gene that encodes aldehyde oxidase, an enzyme responsible for the oxidation of aldehydes into carboxylic acids. This enzyme plays a role in drug metabolism and hepatic clearance, a feature previously shown to be maintained in cryopreserved hepatocytes [46]. CYP51A1 encodes lanosterol 14-alpha demethylase, which is involved in both xenobiotic metabolism and the biosynthesis of steroids, lipids, and vitamins. This enzyme contributes to the formation of cholesterol and bile acids in the human liver [47]. EPHX1 encodes epoxide hydrolase 1, an enzyme involved in xenobiotic metabolism and bile acid transport into hepatocytes [48].
FMO3 encodes dimethylaniline monooxygenase [N-oxide-forming] 3, an enzyme essential for oxidative drug metabolism, which is expressed in the post-natal liver [49]. GSTM1 encodes glutathione S-transferase class Mu 1, which, along with GSTP1 (glutathione S-transferase class Pi 1), participates in phase II metabolism of xenobiotics. These molecules were also observed in human embryonic stem cell (hESC)-derived HLCs in a study by Söderdahl and colleagues [50].
Furthermore, our experiments revealed that HLCs express glutathione S-transferase class Omega 1 (GSTO1), which is known to be present in human hepatocytes [51], but, to our knowledge, has not been reported in other HLCs. NR1I3, another key protein identified, is involved in xenobiotic metabolism and activates CYP450 enzymes in hepatocytes [52]. UGT1A4 encodes for the UDP-glucuronosyltransferase 1–4, an enzyme involved in the glucuronidation pathway that transforms small lipophilic molecules, many tertiary amines and drugs, into water-soluble excreted metabolites, and it is normally found in liver microsomes [53]. We also showed the presence of further liver-specific enzymes such as cytoplasmic and mitochondrial aspartate aminotransferase (GOT1 and GOT2), alanine aminotransferase (GPT1), ornithine aminotransferase (OAT), mitochondrial ornithine transporter 1 (SLC25A15), argininosuccinate synthase (ASS1), alcohol dehydrogenase class-3 (ADH5), and the mitochondrial aldehyde dehydrogenase (ALDH2). Their imbalance has also been related to liver diseases [75,76,77].
Based on gene ontology classification, it was possible to ascribe specific functions to the proteins found in our experiments. The quantitative analyses further provided elements supporting these results, also allowing us to characterize the increase in liver-enriched molecules over the weeks of differentiation. This could suggest that WJ-MSCs, following the hepatic differentiation protocol, are not intended to generate mature hepatocytes but may be considerably useful in supporting hepatic functions if transplanted in loco. For example, glycogen storage disease type IV (GSD IV, Andersen’s Disease) is a rare autosomal recessive disorder caused by either GBE deficiency (leading to the manifestation of progressive hepatic fibrosis characterized by hepatomegaly that rapidly progresses to liver cirrhosis and death at early age) or mutation of the same gene inducing a non-progressive hepatic form [78,79]. The statistically significant increase in GBE1 expression in HLCs derived from WJ-MSCs could lead to possible therapeutic use for treating these specific hepatic diseases.
Another potential clinical indication that may come from the present work lies in the activity levels of G6Pase detected in differentiated HLCs. G6Pase dysfunction due to inborn mutations causes glycogen storage disease type Ia (GSD-1a, Von Gierke’s disease). The primary symptom of GSDI in infancy is a low blood sugar level (hypoglycemia). Symptoms of GSDI usually begin from three to four months of age and include enlargement of the liver (hepatomegaly) and kidney (nephromegaly), and elevated levels of lactate, uric acid, and lipids [80,81,82]. The successful induction of G6Pase functional activity in HLCs, with respect to untreated control cells, could open new ways to the use of these cells for treating this genetic disorder currently managed by the evaluation of clinical, laboratory, and imaging data, together with a sole dietary intervention [81].
Our data reinforce the concept that the differentiated progeny of WJ-MSCs maintains the expression of immunomodulatory molecules, which may be beneficial for cellular therapy applications in ESLD. The presence of immunomodulatory activities, which may result in hypoimmunogenicity and tolerance induction, is a key feature of MSCs.
The maintenance of immunomodulatory molecule expression in perinatal-derived HLCs, which we demonstrate here for the first time, may be a crucial characteristic of their therapeutic potential. HLCs, with their immunomodulatory and anti-inflammatory properties, could alter the local microenvironment and stimulate the reactivation of resident progenitor cells, thereby promoting organ self-repair. This, combined with the functional capabilities of HLCs, underscores the potential of human umbilical cord (UC)-derived cells as a safe and versatile source for therapeutic applications. They may not only facilitate a bridging repopulation effect but also exert a paracrine bystander effect to reactivate local progenitor cells suppressed by the underlying disease. A notable example is given by the expression of IDO-2, which, although less studied than IDO-1, is produced by HLCs and has been implicated in immune regulation, particularly within the liver [68].
The plethora of novel markers of the hepatocyte mature phenotype, characterized in our experiments, are indicative of multiple functional competencies and represent a promising advance in the knowledge of the basic biology of these cells, envisioning new therapeutic approaches. Moreover, it may stimulate further research in other laboratories to fully understand the multiple features of HLCs derived from perinatal stromal cells. In this regard, the eventual integration of the proteomics data with transcriptomic ones, as well as the in vivo readout on an animal model, would be necessary developments of the present work and can hopefully stimulate further research on this topic. Moreover, in the future, it would be interesting to investigate the fate of transplanted cells after infusion in an in vivo model. Some reports suggest that these cells could be scavenged by local macrophages [83]. It is important, in in vivo applications, to determine if the potential immunomodulatory features of HLCs are maintained in a compromised microenvironment such as that featured in liver conditions such as cirrhosis and fibrosis. On a positive note, further reports demonstrate that MSCs, after transplantation in vivo, can recreate an immunosuppressive microenvironment, evading the immune response in the host [84,85]. Further in vivo assays would also be beneficial to test other potential key limitations of our approach in the differentiation of HLCs. One specific need of cell-based systems is the scalability of the expansion of stem cells to have the number of differentiated cells needed for therapeutic success. Our previous reports indicate that WJ-MSCs feature a stable phenotype alongside culture up to 15 passages and, therefore, may be particularly promising in this aspect [18]. One other limitation that may arise from the use of in vitro differentiated HLCs is the maintenance of the mature features after infusion in the patient. It must be noted that, often, the mixed result that can be observed in the literature may be linked to the incomplete characterization of the differentiated populations, relying on few markers. The present paper results show that the application of several parallel techniques improves this aspect and allows the characterizing of many potential indications for HLCs based on the selected features detected.
For any differentiation attempt aiming to generate the “perfect hepatocyte”, the only outcome obtainable is a failure. No in vitro differentiation can today mimic the in-organ differentiation that takes place in hepatocytes during liver development. However, this and the other works in the literature [86,87,88,89,90] show that the potential of exogenous stem cells may be to be differentiated to acquire specific liver functions, which allow them to be successful in treating especially monogenetic liver diseases by providing selected activities missing in the patients’ hepatocytes.

5. Conclusions

The use of high-throughput techniques, coupled with a detailed morphofunctional evaluation of the differentiated cells phenotype, allows us to determine the potential features of HLCs derived from WJ-MSCs, which show important characteristics potentially useful in liver repopulation strategies for specific diseases and, more generally, in regenerative medicine approaches for ESLD. Even if these data should be further confirmed with WJ-MSCs lots derived from a higher number of umbilical cords, our paper shed light on the important biological properties of WJ-MSCs and their differentiated counterparts. Demonstrating insights into the hepatocyte-related functions exerted by HLCs could be essential to move forward preclinical in vivo experiments and to project clinical trials for the treatment of ESLD.

Supplementary Materials

The following supporting information can be downloaded at https://www.mdpi.com/article/10.3390/biology14020124/s1: Figure S1: Tri-lineage differentiation ability by. NY WJ-MSCs-MSCs (A, C, E); (B) adipogenic differentiation (oil red O stain); (D) osteogenic differentiation (alizarin red S stain); (F) chondrogenic differentiation (alcian blue stain). Magnification: 10×, Bar: 50 µm (A–D), 5× (E, F), Bar: 100 µm. Figure S2: Expression of cytokeratins after hepatic differentiation. Representative flow cytometry analysis performed on NT WJ-MSCs and HLCs, at 3rd and 4th week of hepatic differentiation protocol: AFP (A), Albumin (B), CK-18 (C) and CK-19 (D). Figure S3: Panel of negative controls in immunocytochemical analyses by omitting the primary antibody: (A) NT 3rd week; (B) HLC 3rd week; (C) NT 4th week; (D) HLC 4th week. Magnification 20×, Bar: 100 µm. Figure S4: Representative panels of immunocytochemical detection of multiple hepatic tissue-specific markers in human liver tissue. Micrographs show the expression of Albumin (A), connexin 32 (B), CK-18 (C), CK-19 (D), CYP7 A1 (E), CYP2 B6 (F), CYP3 A4 (G), CYP3 A7 (H), and Fibronectin (I) at the cytoplasm level. HNF-4α showed a clear nuclear positivity (J). Magnification 20×. Scale bar: 100 µm. Figure S5: Immunocytochemical detection of HLAs in NT-WJ-MSCs and HLCs. HLA-ABC (A–D), HLA-DR (E–H), HLA-E (I–L). Magnification 20×, Bar: 100 µm. Table S1: List of antibodies used for flow cytometry analysis; Table S2: list of antibodies used for immunocytochemistry and immunohistochemistry analysis. Table S3: Proteins differentially expressed in NT WJ-MSCs and HLCs. The differences indicate log2(LFQ Intensity HLCs)/log2(LFQ Intensity NT WJ-MSCs); Table S4: Proteins differentially expressed in 3rd and 4th week HLCs. The differences indicate log2(LFQ Intensity HLCs 4th)/log2(LFQ Intensity HLCs 3rd); Table S5: STRING analysis of proteins which expression is significantly different between HLCs and NT-WJ-MSCs. * FDR = False Discovery Rate. This measure describes how significant the enrichment is. Shown are p-values corrected for multiple testing within each category using the Benjamini–Hochberg procedure.

Author Contributions

Writing—original paper preparation: M.L.I., S.C., E.R. and G.L.R.; investigation: M.L.I., S.C., G.A. (Giandomenico Amico), F.T., E.R., F.R., G.A. (Giusi Alberti), A.C., S.I., T.C., S.S. and G.L.R.; methodology: A.D.S., F.D.G., M.L.I. and G.L.R.; writing—review and editing: S.C., E.R., G.A (Giusi Alberti)., A.C., S.I., A.C., P.G.C. and G.L.R.; software: S.C., E.R., G.A. (Giandomenico Amico), A.C., S.I., A.C. and G.L.R.; data curation: T.C., F.R., A.D.S. and P.G.C.; visualization: M.L.I., S.C., G.A. (Giusi Alberti) and G.L.R.; supervision: F.D.G., G.L.R. and P.G.C. All authors have read and agreed to the published version of the manuscript.

Funding

This work was supported by the University of Palermo Grant (FFR 2021 and 2022) to Giampiero La Rocca. This work was supported by the PRIN 2017 program of the Italian Ministry of Research and University (MIUR), Grant Number: 2017RSAK7_003. Part of this work was performed using instruments provided by the IEMEST Euro-Mediterranean Institute of Science and Technology and funded by the Italian National Operational Program for Research and Competitiveness 2007–2013 grant (project code: PONa3_00210; European Regional Development Fund). The funders had no role in the study design, data collection, and analysis, decision to publish, or preparation of this article.

Institutional Review Board Statement

This study was conducted according to the guidelines of the Declaration of Helsinki and approved by the Institutional Review Board of ISMETT (IRRB/58/13, ISMETT Institutional Research Review Board).

Informed Consent Statement

All umbilical cords were obtained after the mother’s informed consent according to the tenets of the Declaration of Helsinki and local ethical regulations.

Data Availability Statement

The data used to generate this paper are available upon request to the corresponding author.

Conflicts of Interest

GLR is a member of the scientific board of Auxocell Laboratories, Inc. No competing financial interests exist for the other authors.

References

  1. European Association for the Study of the Liver. EASL Clinical Practice Guidelines: Liver transplantation. J. Hepatol. 2016, 64, 433–485. [Google Scholar] [CrossRef] [PubMed]
  2. Baganate, F.; Beal, E.W.; Tumin, D.; Azoulay, D.; Mumtaz, K.; Black, S.M.; Washburn, K.; Pawlik, T.M. Early mortality after liver transplantation: Defining the course and the cause. Surgery 2018, 164, 694–704. [Google Scholar] [CrossRef] [PubMed]
  3. Nicolas, C.T.; Wang, Y.; Nyberg, S.L. Cell therapy in chronic liver disease. Curr. Opin. Gastroenterol. 2016, 32, 189–194. [Google Scholar] [CrossRef] [PubMed]
  4. La Rocca, G.; Anzalone, R. Perinatal stem cells revisited: Directions and indications at the crossroads between tissue regeneration and repair. Curr. Stem Cell Res. Ther. 2013, 8, 2–5. [Google Scholar] [CrossRef] [PubMed]
  5. Anzalone, R.; Lo Iacono, M.; Corrao, S.; Corsello, T.; Farina, F.; La Rocca, G. Recent patents and advances in hepatocyte-like cells differentiation by perinatal stem cells. Rec. Pat. Regen. Med. 2013, 3, 227–236. [Google Scholar] [CrossRef]
  6. Afshari, A.; Shamdani, S.; Uzan, G.; Naserian, S.; Azarpira, N. Different approaches for transformation of mesenchymal stem cells into hepatocyte-like cells. Stem Cell Res. Ther. 2020, 11, 54. [Google Scholar] [CrossRef]
  7. Shahrbaf, M.A.; Nouri, M.; Zarrabi, M.; Gramignoli, R.; Vosough, M. Extraembryonic Mesenchymal Stromal/Stem Cells in Liver Diseases: A Critical Revision of Promising Advanced Therapy Medicinal Products. Cells 2022, 11, 1074. [Google Scholar] [CrossRef]
  8. Mallis, P.; Michalopoulos, E.; Chatzistamatiou, T.; Giokas, C.S. Interplay between mesenchymal stromal cells and immune system: Clinical applications in immune-related diseases. Explor. Immunol. 2021, 1, 112–139. [Google Scholar] [CrossRef]
  9. Zhao, L.; Chen, S.; Shi, X.; Cao, H.; Li, L. A pooled analysis of mesenchymal stem cell-based therapy for liver disease. Stem Cell Res. Ther. 2018, 9, 72. [Google Scholar] [CrossRef]
  10. Jing, Y.T.; Vijesh, V.; Yu, H.L.; Padma, M.; James, C.; Ursula, M. Immunogenicity and Immunomodulatory Properties of Hepatocyte-like Cells Derived from Human Amniotic Epithelial Cells. Curr. Stem Cell Res. Ther. 2013, 8, 91–99. [Google Scholar]
  11. Li, Y.; Wu, Q.; Wang, Y.; Li, L.; Chen, F.; Shi, Y.; Bu, H.; Bao, J. Immunogenicity of hepatic differentiated human umbilical cord mesenchymal stem cells promoted by porcine decellularized liver scaffolds. Xenotransplantation 2017, 24, e12287. [Google Scholar] [CrossRef] [PubMed]
  12. Yamana, H.; Inagaki, A.; Imura, T.; Nakamura, Y.; Nishimaki, H.; Katano, T.; Ohashi, K.; Miyagi, S.; Kamei, T.; Unno, M.; et al. Cotransplantation With Adipose Tissue-derived Stem Cells Improves Engraftment of Transplanted Hepatocytes. Transplantation 2022, 106, 1963–1973. [Google Scholar] [CrossRef] [PubMed]
  13. Kong, D.; Xu, H.; Chen, M.; Yu, Y.; Qian, Y.; Qin, T.; Tong, Y.; Xia, Q.; Hang, H. Co-encapsulation of HNF4α overexpressing UMSCs and human primary hepatocytes ameliorates mouse acute liver failure. Stem Cell Res. Ther. 2020, 11, 449. [Google Scholar] [CrossRef]
  14. Soncini, M.; Vertua, E.; Gibelli, L.; Zorzi, F.; Denegri, M.; Albertini, A.; Wengler, G.S.; Parolini, O. Isolation and characterization of mesenchymal cells from human fetal membranes. J. Tissue Eng. Regen. Med. 2007, 1, 296–305. [Google Scholar] [CrossRef]
  15. Zagoura, D.S.; Roubelakis, M.G.; Bitsika, V.; Trohatou, O.; Pappa, K.I.; Kapelouzou, A.; Antsaklis, A.; Anagnou, N.P. Therapeutic potential of a distinct population of human amniotic fluid mesenchymal stem cells and their secreted molecules in mice with acute hepatic failure. Gut 2012, 61, 894–906. [Google Scholar] [CrossRef]
  16. Jin, H.J.; Bae, Y.K.; Kim, M.; Kwon, S.J.; Jeon, H.B.; Choi, S.J.; Kim, S.W.; Yang, Y.S.; Oh, W.; Chang, J.W. Comparative analysis of human mesenchymal stem cells from bone marrow, adipose tissue, and umbilical cord blood as sources of cell therapy. Int. J. Mol. Sci. 2013, 14, 17986–18001. [Google Scholar] [CrossRef]
  17. Salehinejad, P.; Moshrefi, M.; Eslaminejad, T. An Overview on Mesenchymal Stem Cells Derived from Extraembryonic Tissues: Supplement Sources and Isolation Methods. Stem Cells Cloning 2020, 13, 57–65. [Google Scholar] [CrossRef]
  18. Corsello, T.; Amico, G.; Corrao, S.; Anzalone, R.; Timoneri, F.; Lo Iacono, M.; Russo, E.; Spatola, G.F.; Uzzo, M.L.; Giuffrè, M.; et al. Whaton’s jelly mesenchymal stromal cells from human umbilical cord: A close-up on immunomodulatory molecules featured in situ and in vitro. Stem Cell Rev. Rep. 2019, 15, 900–918. [Google Scholar] [CrossRef]
  19. Mahmoud, R.; Bassiouny, M.; Badawy, A.; Darwish, A.; Yahia, S.; El-Tantawy, N. Maternal and neonatal factors’ effects on wharton’s jelly mesenchymal stem cell yield. Sci. Rep. 2024, 14, 24376. [Google Scholar] [CrossRef]
  20. Can, A.; Karahuseyinoglu, S. Concise review: Human umbilical cord stroma with regard to the source of fetus-derived stem cells. Stem Cells 2007, 25, 2886–2895. [Google Scholar] [CrossRef]
  21. Anzalone, R.; Lo Iacono, M.; Loria, T.; Di Stefano, A.; Giannuzzi, P.; Farina, F.; La Rocca, G. Wharton’s jelly mesenchymal stem cells as candidates for beta cells regeneration: Extending the differentiative and immunomodulatory benefits of adult mesenchymal stem cells for the treatment of type 1 diabetes. Stem Cell Rev. 2011, 7, 342–363. [Google Scholar] [CrossRef] [PubMed]
  22. La Rocca, G. Editorial—Connecting the Dots: The Promises of Wharton’s Jelly Mesenchymal Stem Cells for Tissue Repair and Regeneration. Open Tissue Eng. Regen. Med. J. 2011, 4, 3–5. [Google Scholar] [CrossRef]
  23. Ertl, J.; Pichlsberger, M.; Tuca, A.C.; Wurzer, P.; Fuchs, J.; Geyer, S.H.; Maurer-Gesek, B.; Weninger, W.J.; Pfeiffer, D.; Bubalo, V.; et al. Comparative study of regenerative effects of mesenchymal stem cells derived from placental amnion, chorion and umbilical cord on dermal wounds. Placenta 2018, 65, 37–46. [Google Scholar] [CrossRef]
  24. Lo Iacono, M.; Anzalone, R.; La Rocca, G.; Baiamonte, E.; Maggio, A.; Acuto, S. Wharton’s Jelly Mesenchymal Stromal Cells as a Feeder Layer for the Ex Vivo Expansion of Hematopoietic Stem and Progenitor Cells: A Review. Stem Cell Rev. 2017, 13, 35–49. [Google Scholar] [CrossRef]
  25. Lo Iacono, M.; Russo, E.; Anzalone, R.; Baiamonte, E.; Alberti, G.; Gerbino, A.; Maggio, A.; La Rocca, G.; Acuto, S. Wharton’s Jelly Mesenchymal Stromal Cells Support the Expansion of Cord Blood-derived CD34(+) Cells Mimicking a Hematopoietic Niche in a Direct Cell-cell Contact Culture System. Cell Transplant. 2018, 27, 117–129. [Google Scholar] [CrossRef]
  26. La Rocca, G.; Lo Iacono, M.; Corsello, T.; Corrao, S.; Farina, F.; Anzalone, R. Human Wharton’s jelly mesenchymal stem cells maintain the expression of key immunomodulatory molecules when subjected to osteogenic, adipogenic and chondrogenic differentiation in vitro: New perspectives for cellular therapy. Curr. Stem Cell Res. Ther. 2013, 8, 100–113. [Google Scholar] [CrossRef]
  27. La Rocca, G.; Anzalone, R.; Corrao, S.; Magno, F.; Loria, T.; Lo Iacono, M.; Di Stefano, A.; Giannuzzi, P.; Marasa, L.; Cappello, F.; et al. Isolation and characterization of Oct-4+/HLA-G+ mesenchymal stem cells from human umbilical cord matrix: Differentiation potential and detection of new markers. Histochem. Cell Biol. 2009, 131, 267–282. [Google Scholar] [CrossRef]
  28. Weiss, M.L.; Anderson, C.; Medicetty, S.; Seshareddy, K.B.; Weiss, R.J.; VanderWerff, I.; Troyer, D.; McIntosh, K.R. Immune properties of human umbilical cord Wharton’s jelly-derived cells. Stem Cells 2008, 26, 2865–2874. [Google Scholar] [CrossRef]
  29. Silini, A.R.; Di Pietro, R.; Lang-Olip, I.; Alviano, F.; Banerjee, A.; Basile, M.; Borutinskaite, V.; Eissner, G.; Gellhaus, A.; Giebel, B.; et al. Where Do We Stand? A Roadmap of the Human Placenta and Consensus for Tissue and Cell Nomenclature. Front. Bioeng. Biotechnol. 2020, 8, 610544. [Google Scholar] [CrossRef]
  30. van Megen, K.M.; van’t Wout, E.T.; Lages Motta, J.; Dekker, B.; Nikolic, T.; Roep, B.O. Activated Mesenchymal Stromal Cells Process and Present Antigens Regulating Adaptive Immunity. Front. Immunol. 2019, 10, 694. [Google Scholar] [CrossRef]
  31. Le Blanc, K.; Tammik, C.; Rosendahl, K.; Zetterberg, E.; Ringdén, O. HLA expression and immunologic properties of differentiated and undifferentiated mesenchymal stem cells. Exp. Hematol. 2003, 31, 890–896. [Google Scholar] [CrossRef] [PubMed]
  32. Kwak, J.; Choi, W.; Bae, Y.; Kim, M.; Choi, S.; Oh, W.; Jin, H. HLA-A2 Promotes the Therapeutic Effect of Umbilical Cord Blood-Derived Mesenchymal Stem Cells in Hyperoxic Lung Injury. Bioengineering 2022, 9, 177. [Google Scholar] [CrossRef] [PubMed]
  33. Anzalone, R.; Corrao, S.; Lo Iacono, M.; Loria, T.; Corsello, T.; Cappello, F.; Di Stefano, A.; Giannuzzi, P.; Zummo, G.; Farina, F.; et al. Isolation and characterization of CD276+/HLA-E+ human subendocardial mesenchymal stem cells from chronic heart failure patients: Analysis of differentiative potential and immunomodulatory markers expression. Stem Cells Dev. 2013, 22, 1–17. [Google Scholar] [CrossRef]
  34. Vigdorovich, V.; Ramagopal, U.A.; Lazar-Molnar, E.; Sylvestre, E.; Lee, J.S.; Hofmeyer, K.A.; Zang, X.; Nathenson, S.G.; Almo, S.C. Structure and T cell inhibition properties of B7 family member, B7-H3. Structure 2013, 21, 707–717. [Google Scholar] [CrossRef]
  35. Tipnis, S.; Viswanathan, C.; Majumdar, A.S. Immunosuppressive properties of human umbilical cord-derived mesenchymal stem cells: Role of B7-H1 and IDO. Immunol. Cell Biol. 2010, 88, 795–806. [Google Scholar] [CrossRef]
  36. Anzalone, R.; Lo Iacono, M.; Corrao, S.; Magno, F.; Loria, T.; Cappello, F.; Zummo, G.; Farina, F.; La Rocca, G. New emerging potentials for human Wharton’s jelly mesenchymal stem cells: Immunological features and hepatocyte-like differentiative capacity. Stem Cells Dev. 2010, 19, 423–438. [Google Scholar] [CrossRef]
  37. Bharti, D.; Shivakumar, S.B.; Park, J.K.; Ullah, I.; Subbarao, R.B.; Park, J.S.; Lee, S.L.; Park, B.W.; Rho, G.J. Comparative analysis of human Wharton’s jelly mesenchymal stem cells derived from different parts of the same umbilical cord. Cell Tissue Res. 2018, 372, 51–65. [Google Scholar] [CrossRef]
  38. Sokal, E.M.; Trivedi, P.; Cheeseman, P.; Portmann, B.; Mowat, A.P. The application of quantitative cytochemistry to study the acinar distribution of enzymatic activities in human liver biopsy sections. J. Hepatol. 1989, 9, 42–48. [Google Scholar] [CrossRef]
  39. Khuu, D.N.; Scheers, I.; Ehnert, S.; Jazouli, N.; Nyabi, O.; Buc-Calderon, P.; Meulemans, A.; Nussler, A.; Sokal, E.; Najimi, M. In vitro differentiated adult human liver progenitor cells display mature hepatic metabolic functions: A potential tool for in vitro pharmacotoxicological testing. Cell Transplant. 2011, 20, 287–302. [Google Scholar] [CrossRef]
  40. Dominici, M.; Le Blanc, K.; Mueller, I.; Slaper-Cortenbach, I.; Marini, F.; Krause, D.; Deans, R.; Keating, A.; Prockop, D.; Horwitz, E. Minimal criteria for defining multipotent mesenchymal stromal cells. The International Society for Cellular Therapy position statement. Cytotherapy 2006, 8, 315–317. [Google Scholar] [CrossRef]
  41. Buyl, K.; De Kock, J.; Najar, M.; Lagneaux, L.; Branson, S.; Rogiers, V.; Vanhaecke, T. Characterization of hepatic markers in human Wharton’s Jelly-derived mesenchymal stem cells. Toxicol. In Vitro 2014, 28, 113–119. [Google Scholar] [CrossRef] [PubMed]
  42. Willebrords, J.; Crespo Yanguas, S.; Maes, M.; Decrock, E.; Wang, N.; Leybaert, L.; da Silva, T.C.; Veloso Alves Pereira, I.; Jaeschke, H.; Cogliati, B.; et al. Structure, Regulation and Function of Gap Junctions in Liver. Cell Commun. Adhes. 2015, 22, 29–37. [Google Scholar] [CrossRef] [PubMed]
  43. Michalik, M.; Gladys, A.; Czekaj, P. Differentiation of Cells Isolated from Afterbirth Tissues into Hepatocyte-Like Cells and Their Potential Clinical Application in Liver Regeneration. Stem Cell Rev. Rep. 2021, 17, 581–603. [Google Scholar] [CrossRef] [PubMed]
  44. Campard, D.; Lysy, P.A.; Najimi, M.; Sokal, E.M. Native umbilical cord matrix stem cells express hepatic markers and differentiate into hepatocyte-like cells. Gastroenterology 2008, 134, 833–848. [Google Scholar] [CrossRef]
  45. Guengerich, F.P. Intersection of the Roles of Cytochrome P450 Enzymes with Xenobiotic and Endogenous Substrates: Relevance to Toxicity and Drug Interactions. Chem. Res. Toxicol. 2017, 30, 2–12. [Google Scholar] [CrossRef]
  46. Hutzler, J.M.; Yang, Y.S.; Albaugh, D.; Fullenwider, C.L.; Schmenk, J.; Fisher, M.B. Characterization of aldehyde oxidase enzyme activity in cryopreserved human hepatocytes. Drug Metab. Dispos. 2012, 40, 267–275. [Google Scholar] [CrossRef]
  47. Lewinska, M.; Zmrzljak, U.P.; Rozman, D. Low nucleotide variability of CYP51A1 in humans: Meta-analysis of cholesterol and bile acid synthesis and xenobiotic metabolism pathways. Acta Chim. Slov. 2013, 60, 875–883. [Google Scholar]
  48. Decker, M.; Arand, M.; Cronin, A. Mammalian epoxide hydrolases in xenobiotic metabolism and signalling. Arch. Toxicol. 2009, 83, 297–318. [Google Scholar] [CrossRef]
  49. Koukouritaki, S.B.; Simpson, P.; Yeung, C.K.; Rettie, A.E.; Hines, R.N. Human hepatic flavin-containing monooxygenases 1 (FMO1) and 3 (FMO3) developmental expression. Pediatr. Res. 2002, 51, 236–243. [Google Scholar] [CrossRef]
  50. Soderdahl, T.; Kuppers-Munther, B.; Heins, N.; Edsbagge, J.; Bjorquist, P.; Cotgreave, I.; Jernstrom, B. Glutathione transferases in hepatocyte-like cells derived from human embryonic stem cells. Toxicol. In Vitro 2007, 21, 929–937. [Google Scholar] [CrossRef]
  51. Yin, Z.L.; Dahlstrom, J.E.; Le Couteur, D.G.; Board, P.G. Immunohistochemistry of omega class glutathione S-transferase in human tissues. J. Histochem. Cytochem. 2001, 49, 983–987. [Google Scholar] [CrossRef] [PubMed]
  52. Zelko, I.; Negishi, M. Phenobarbital-elicited activation of nuclear receptor CAR in induction of cytochrome P450 genes. Biochem. Biophys. Res. Commun. 2000, 277, 1–6. [Google Scholar] [CrossRef] [PubMed]
  53. Lu, D.; Xie, Q.; Wu, B. N-glucuronidation catalyzed by UGT1A4 and UGT2B10 in human liver microsomes: Assay optimization and substrate identification. J. Pharm. Biomed. Anal. 2017, 145, 692–703. [Google Scholar] [CrossRef]
  54. O’Shaughnessy, P.J.; Monteiro, A.; Bhattacharya, S.; Fraser, M.J.; Fowler, P.A. Steroidogenic enzyme expression in the human fetal liver and potential role in the endocrinology of pregnancy. Mol. Hum. Reprod. 2013, 19, 177–187. [Google Scholar] [CrossRef]
  55. Langmann, T.; Klucken, J.; Reil, M.; Liebisch, G.; Luciani, M.F.; Chimini, G.; Kaminski, W.E.; Schmitz, G. Molecular cloning of the human ATP-binding cassette transporter 1 (hABC1): Evidence for sterol-dependent regulation in macrophages. Biochem. Biophys. Res. Commun. 1999, 257, 29–33. [Google Scholar] [CrossRef]
  56. Bhattacharjee, J.; Ietta, F.; Giacomello, E.; Bechi, N.; Romagnoli, R.; Fava, A.; Paulesu, L. Expression and localization of ATP binding cassette transporter A1 (ABCA1) in first trimester and term human placenta. Placenta 2010, 31, 423–430. [Google Scholar] [CrossRef]
  57. Kaminski, W.E.; Wenzel, J.J.; Piehler, A.; Langmann, T.; Schmitz, G. ABCA6, a novel a subclass ABC transporter. Biochem. Biophys. Res. Commun. 2001, 285, 1295–1301. [Google Scholar] [CrossRef]
  58. Zhao, Y.; Ishigami, M.; Nagao, K.; Hanada, K.; Kono, N.; Arai, H.; Matsuo, M.; Kioka, N.; Ueda, K. ABCB4 exports phosphatidylcholine in a sphingomyelin-dependent manner. J. Lipid Res. 2015, 56, 644–652. [Google Scholar] [CrossRef]
  59. Aoyama, T.; Souri, M.; Ushikubo, S.; Kamijo, T.; Yamaguchi, S.; Kelley, R.I.; Rhead, W.J.; Uetake, K.; Tanaka, K.; Hashimoto, T. Purification of human very-long-chain acyl-coenzyme A dehydrogenase and characterization of its deficiency in seven patients. J. Clin. Investig. 1995, 95, 2465–2473. [Google Scholar] [CrossRef]
  60. Parini, P.; Davis, M.; Lada, A.T.; Erickson, S.K.; Wright, T.L.; Gustafsson, U.; Sahlin, S.; Einarsson, C.; Eriksson, M.; Angelin, B.; et al. ACAT2 is localized to hepatocytes and is the major cholesterol-esterifying enzyme in human liver. Circulation 2004, 110, 2017–2023. [Google Scholar] [CrossRef]
  61. Singh, A.B.; Kan, C.F.; Dong, B.; Liu, J. SREBP2 Activation Induces Hepatic Long-chain Acyl-CoA Synthetase 1 (ACSL1) Expression in Vivo and in Vitro through a Sterol Regulatory Element (SRE) Motif of the ACSL1 C-promoter. J. Biol. Chem. 2016, 291, 5373–5384. [Google Scholar] [CrossRef] [PubMed]
  62. Hess, A.L.; Carayol, J.; Blaedel, T.; Hager, J.; Di Cara, A.; Astrup, A.; Saris, W.H.M.; Larsen, L.H.; Valsesia, A. Analysis of circulating angiopoietin-like protein 3 and genetic variants in lipid metabolism and liver health: The DiOGenes study. Genes. Nutr. 2018, 13, 7. [Google Scholar] [CrossRef] [PubMed]
  63. Houten, S.M.; Denis, S.; Argmann, C.A.; Jia, Y.; Ferdinandusse, S.; Reddy, J.K.; Wanders, R.J. Peroxisomal L-bifunctional enzyme (Ehhadh) is essential for the production of medium-chain dicarboxylic acids. J. Lipid Res. 2012, 53, 1296–1303. [Google Scholar] [CrossRef]
  64. Qin, X.; Gao, B. The complement system in liver diseases. Cell Mol. Immunol. 2006, 3, 333–340. [Google Scholar]
  65. Luo, W.; Vik, D.P. Regulation of complement factor H in a human liver cell line by interferon-gamma. Scand. J. Immunol. 1999, 49, 487–494. [Google Scholar] [CrossRef]
  66. Lung, T.; Sakem, B.; Risch, L.; Wurzner, R.; Colucci, G.; Cerny, A.; Nydegger, U. The complement system in liver diseases: Evidence-based approach and therapeutic options. J. Transl. Autoimmun. 2019, 2, 100017. [Google Scholar] [CrossRef]
  67. Agarwal, B.; Wright, G.; Gatt, A.; Riddell, A.; Vemala, V.; Mallett, S.; Chowdary, P.; Davenport, A.; Jalan, R.; Burroughs, A. Evaluation of coagulation abnormalities in acute liver failure. J. Hepatol. 2012, 57, 780–786. [Google Scholar] [CrossRef]
  68. Prendergast, G.C.; Metz, R.; Muller, A.J.; Merlo, L.M.; Mandik-Nayak, L. IDO2 in Immunomodulation and Autoimmune Disease. Front. Immunol. 2014, 5, 585. [Google Scholar] [CrossRef]
  69. Potikha, T.; Ella, E.; Cerliani, J.P.; Mizrahi, L.; Pappo, O.; Rabinovich, G.A.; Galun, E.; Goldenberg, D.S. Galectin-1 is essential for efficient liver regeneration following hepatectomy. Oncotarget 2016, 7, 31738–31754. [Google Scholar] [CrossRef]
  70. Sioud, M.; Mobergslien, A.; Boudabous, A.; Floisand, Y. Evidence for the involvement of galectin-3 in mesenchymal stem cell suppression of allogeneic T-cell proliferation. Scand. J. Immunol. 2010, 71, 267–274. [Google Scholar] [CrossRef]
  71. Zhou, Y.J.; Gao, J.; Yang, H.M.; Yuan, X.L.; Chen, T.X.; He, Z.J. The role of the lactadherin in promoting intestinal DCs development in vivo and vitro. Clin. Dev. Immunol. 2010, 2010, 357541. [Google Scholar] [CrossRef] [PubMed]
  72. Singh, Y.; Chen, H.; Zhou, Y.; Foller, M.; Mak, T.W.; Salker, M.S.; Lang, F. Differential effect of DJ-1/PARK7 on development of natural and induced regulatory T cells. Sci. Rep. 2015, 5, 17723. [Google Scholar] [CrossRef] [PubMed]
  73. Skornicka, E.L.; Kiyatkina, N.; Weber, M.C.; Tykocinski, M.L.; Koo, P.H. Pregnancy zone protein is a carrier and modulator of placental protein-14 in T-cell growth and cytokine production. Cell Immunol. 2004, 232, 144–156. [Google Scholar] [CrossRef] [PubMed]
  74. Daveau, M.; Jean, L.; Soury, E.; Olivier, E.; Masson, S.; Lyoumi, S.; Chan, P.; Hiron, M.; Lebreton, J.P.; Husson, A.; et al. Hepatic and extra-hepatic transcription of inter-alpha-inhibitor family genes under normal or acute inflammatory conditions in rat. Arch. Biochem. Biophys. 1998, 350, 315–323. [Google Scholar] [CrossRef]
  75. Ventura, G.; De Bandt, J.P.; Segaud, F.; Perret, C.; Robic, D.; Levillain, O.; Le Plenier, S.; Godard, C.; Cynober, L.; Moinard, C. Overexpression of ornithine aminotransferase: Consequences on amino acid homeostasis. Br. J. Nutr. 2009, 101, 843–851. [Google Scholar] [CrossRef]
  76. Madiraju, A.K.; Alves, T.; Zhao, X.; Cline, G.W.; Zhang, D.; Bhanot, S.; Samuel, V.T.; Kibbey, R.G.; Shulman, G.I. Argininosuccinate synthetase regulates hepatic AMPK linking protein catabolism and ureagenesis to hepatic lipid metabolism. Proc. Natl. Acad. Sci. USA 2016, 113, E3423–E3430. [Google Scholar] [CrossRef]
  77. Crabb, D.W.; Matsumoto, M.; Chang, D.; You, M. Overview of the role of alcohol dehydrogenase and aldehyde dehydrogenase and their variants in the genesis of alcohol-related pathology. Proc. Nutr. Soc. 2004, 63, 49–63. [Google Scholar] [CrossRef]
  78. Liu, M.; Sun, L.Y. Liver Transplantation for Glycogen Storage Disease Type IV. Front. Pediatr. 2021, 19, 633822. [Google Scholar] [CrossRef]
  79. Ichimoto, K.; Fujisawa, T.; Shimura, M.; Fushimi, T.; Tajika, M.; Matsunaga, A.; Ogawa-Tominaga, M.; Akiyama, N.; Naruke, Y.; Horie, H.; et al. Two cases of a non-progressive hepatic form of glycogen storage disease type IV with atypical liver pathology. Mol. Genet. Metab. Rep. 2020, 24, 100601. [Google Scholar] [CrossRef]
  80. Chou, J.Y.; Jun, H.S.; Mansfield, B.C. Type I glycogen storage diseases: Disorders of the glucose-6-phosphatase/glucose-6-phosphate transporter complexes. J. Inherit. Metab. Dis. 2015, 38, 511–519. [Google Scholar] [CrossRef]
  81. Rake, J.P.; Visser, G.; Labrune, P.; Leonard, J.V.; Ullrich, K.; Smit, G.P.A. Glycogen storage disease type I: Diagnosis, management, clinical course and outcome. Results of the European Study on Glycogen Storage Disease Type I (ESGSD I). Euro J. Pediatr. 2002, 161 (Suppl. 1), S20–S34. [Google Scholar] [CrossRef]
  82. Koch, R.L.; Soler-Alfonso, C.; Kiely, B.T.; Asai, A.; Smith, A.L.; Bali, D.S.; Kang, P.B.; Landstrom, A.P.; Akman, H.O.; Burrow, T.A.; et al. Burrow Diagnosis and management of glycogen storage disease type IV, including adult polyglucosan body disease: A clinical practice resource. Mol. Genet. Metab. 2023, 38, 107525. [Google Scholar] [CrossRef]
  83. Arutyunyan, I.; Elchaninov, A.; Fatkhudinov, T.; Makarov, A.; Kananykhina, E.; Usman, N.; Bolshakova, G.; Glinkina, V.; Goldshtein, D.; Sukhikh, G. Elimination of allogeneic multipotent stromal cells by host macrophages in different models of regeneration. Int. J. Clin. Exp. Pathol. 2015, 8, 4469–4480. [Google Scholar]
  84. Shi, Y.; Hu, G.; Su, J.; Li, W.; Chen, Q.; Shou, P.; Xu, C.; Chen, X.; Huang, Y.; Zhu, Z.; et al. Mesenchymal stem cells: A new strategy for immunosuppression and tissue repair. Cell Res. 2010, 20, 510–518. [Google Scholar] [CrossRef]
  85. Wen, F.; Yang, G.; Yu, S.; Liu, H.; Liao, N.; Liu, Z. Mesenchymal stem cell therapy for liver transplantation: Clinical progress and immunomodulatory properties. Stem Cell Res. Ther. 2024, 15, 320. [Google Scholar] [CrossRef]
  86. Zhao, Q.; Ren, H.; Li, X.; Chen, Z.; Zhang, X.; Gong, W.; Liu, Y.; Pang, T.; Han, Z.C. Differentiation of human umbilical cord mesenchymal stromal cells into low immunogenic hepatocyte-like cells. Cytotherapy 2009, 414–426. [Google Scholar] [CrossRef]
  87. Zhang, Y.N.; Lie, P.C.; Wei, X. Differentiation of mesenchymal stromal cells derived from umbilical cord Wharton’s jelly into hepatocyte-like cells. Cytotherapy 2009, 11, 548–558. [Google Scholar] [CrossRef]
  88. Zhang, Z.; Lin, H.; Shi, M.; Xu, R.; Fu, J.; Lv, J.; Chen, L.; Lv, S.; Li, Y.; Yu, S.; et al. Human umbilical cord mesenchymal stem cells improve liver function and ascites in decompensated liver cirrhosis patients. J. Gastroenterol. Hepatol. 2012, 27 (Suppl. 2), 112–120. [Google Scholar] [CrossRef]
  89. Shi, M.; Zhang, Z.; Xu, R.; Lin, H.; Fu, J.; Zou, Z.; Zhang, A.; Shi, J.; Chen, L.; Lv, S.; et al. Human mesenchymal stem cell transfusion is safe and improves liver function in acute-on-chronic liver failure patients. Stem Cells Transl. Med. 2012, 1, 725–731. [Google Scholar] [CrossRef]
  90. Yan, Y.; Xu, W.; Qian, H.; Si, Y.; Zhu, W.; Cao, H.; Zhou, H.; Mao, F. Mesenchymal stem cells from human umbilical cords ameliorate mouse hepatic injury in vivo. Liver Int. 2009, 29, 356–365. [Google Scholar] [CrossRef]
Figure 1. (A) Representative gate strategy for FC analysis; (B) representative FC analysis of several mesenchymal and hematopoietic/endothelial marker expressions in WJ-MSCS. The gray peaks represent the isotype control, while the red peaks reveal the percentage of specific marker expression.
Biology 14 00124 g001
Figure 2. Representative panels of immunocytochemical detection of multiple hepatic tissue-specific markers in naïve WJ-MSCs. Micrographs show the expression of CK-8 (A), CK-18 (B), and CK-19 (C) at the cytoplasm level. HNF-4α showed a clear nuclear positivity (D). The expression of connexin 32 (E) and connexin 43 (F) showed a typical membrane staining. Magnification 20×. Scale bar: 100 µm.
Biology 14 00124 g002
Figure 3. Microscopic demonstration of the morphological changes induced by differentiation and glycogen deposition. Phase-contrast micrograph panels show morphological changes between NT WJ-MSCs (A,C) and HLCs (B,D) at different time points of hepatic differentiation. (A,B): 3rd week; (C,D): 4th week. Magnification 20×. Scale bar: 100 µm.
Biology 14 00124 g003
Figure 4. Flow cytometry analysis of the expression of canonical MSC markers and hematopoietic/endothelial markers after 3 and 4 weeks of hepatic differentiation in NT WJ-MSCs and HLCs. Data are represented as the percentage of marker expression. Data are the mean of three independent experiments. Comparisons among groups were made using the Kruskal–Wallis test. Statistical analysis among groups is non-significant.
Biology 14 00124 g004
Figure 5. Micrographs panel shows PAS staining on naïve NT WJ-MSCs (A,C,E,G) and HLCs (B,D,F,H) at 3rd and 4th week after differentiation. (A,B,E,F): 3rd week; (C,D,G,H): 4th week. Magnification: (AD): 20×; (EH): 40×; Scale bar: (AD): 100 µm; (EH): 50 µm.
Biology 14 00124 g005
Figure 6. Hepatocyte differentiation effects on the expression of hepatocyte markers. Flow cytometry analysis was performed on NT WJ-MSCs and HLCs at 3rd and 4th week of hepatic differentiation protocol: AFP (A), Albumin (B), CK-18 (C), and CK-19 (D). Data are represented in percentage of marker expression. Data are mean of three independent experiments. Comparison among groups were made using Mann–Whitney test; ns, not significant; * p ≤ 0.05; **p ≤ 0.01.
Biology 14 00124 g006
Figure 7. Representative micrographs panel of immunocytochemical detection of markers on NT WJ-MSCs (A,C) cells and HLCs (B,D) at all the time points. CK-18 expression is visible in NT WJ-MSCs (A,C) and HLCs (B,D), in the 3rd and 4th week of hepatic differentiation. Connexin 32 expression was detectable in NT WJ-MSCs (E,G) and HLCs (F,H). (A,B) and (E,F): 3rd week; (C,D) and (G,H): 4th week. Magnification 20×. Scale bar: 100 µm.
Biology 14 00124 g007
Figure 8. Representative micrographs panel of immunocytochemical detection of albumin in NT WJ-MSCs (A,C) and HLCs (B,D), and HNF-4α expression in NT WJ-MSCs (E,G) and HLCs (F,H) at 3rd and 4th week of differentiation. (A,B): 3rd week; (C,D): 4th week. In NT WJ-MSCs (E,G). Magnification 20×. Scale bar: 100 µm.
Biology 14 00124 g008
Figure 9. Representative micrographs panel of immunocytochemical detection of fibronectin and collagen IV expression in NT WJ-MSCs and HLCs, at 3rd and 4th week of differentiation. After both third (B) and fourth (D) week of differentiation, HLCs showed a localization of FN deposits that was markedly altered, being deposited over the surface of HLCs. (A,B): 3rd week; (C,D): 4th week. A very low expression of collagen IV was detectable in NT WJ-MSCs at both 3rd (E) and 4th (G) week; HLCs did not express collagen IV at any time point (F,H). Magnification 20×. Scale bar: 100 µm.
Biology 14 00124 g009
Figure 10. Representative micrographs panel of immunocytochemical detection of different molecules belonging to CYP450s in NT WJ-MSCs (AG) and HLCs (here named as TR, (BH)), at 4th week of differentiation after rifampicin incubation. The quantifications and statistics are depicted in graph (I) with * indicating p < 0.05. The statistical analysis was performed by the Mann–Whitney test. CYP3A4 (A,B), CYP3A7 (C,D) CYP2B6 (E,F) were strongly and significantly (I) increased in HLCs compared to controls. CYP7A1 was expressed in both NT WJ-MSCs (G) and HLCs (H) without a significant difference. Magnification 20×. Scale bar: 100 µm.
Biology 14 00124 g010
Figure 11. Evaluation of CYP3A4 metabolic activity in NT WJ-MSCs and HLCs at 3rd and 4th week of differentiation. NT WJ-MSCs (A,D) and HLCs (B,E) in the presence of rifampicin, an inducer of CYP3A4 activity, despite the being challenged with rifampicin, did not show inducible CYP3A4 activity. HLCs in the presence of ketoconazole, an inhibitor of CYP3A4 activity (C,F). Statistical analysis was performed by the Mann–Whitney test. (AC) are data at the 3rd week of differentiation; (DF) are data at the 4th week of hepatic differentiation.
Biology 14 00124 g011
Figure 12. Microscopic demonstration of glucose-6-phosphatase activity in NT WJ-MSCs and HLCs at all considered time points. NT WJ-MSCs (A,C) and HLCs (B,D) at 3rd and 4th week of hepatic differentiation; (A,B): 3rd week; (C,D): 4th week. Magnification 20×. Scale bar: 100 µm.
Biology 14 00124 g012
Figure 13. Flow cytometry analysis of immunomodulatory molecules expression levels by NT WJ-MSCs and HLCs at 3rd and 4th week of hepatic differentiation. HLA-E, a non-canonical class I MHC molecule, was expressed in both NT WJ-MSCs and HLCs ((A), left panel); also, for CD276 ((B), right panel), there was a similar expression with respect to NT cells at each time point. Comparisons among groups were made using Mann–Whitney test. ns, not significant; * p ≤ 0.05; ** p ≤ 0.01.
Biology 14 00124 g013
Figure 14. Representative micrographs panel of immunocytochemical detection of B7-H3 (CD276) and IDO-1 in NT WJ-MSCs and HLCs at 3rd and 4th week of hepatic differentiation. CD276 expression in NT WJ-MSCs (A,C) and HLCs (B,D), at any time point. IDO-1 expression in NT WJ-MSCs (E,G) and HLCs (F,H) at all time points. (A,B) and (E,F): 3rd week; (C,D) and (G,H): 4th weeks. Magnification 20×. Scale bar: 100 µm.
Biology 14 00124 g014
Figure 15. Graphical representation of gene ontology annotations (expressed in percentage of distribution) describing molecular functions (A) and biological processes (B) of intracellular proteins detected on NT WJ-MSCs and HLCs by HPLC-MS/MS. The pie charts, with related statistics, were automatically, generated by the PANTHER (Protein ANalysis THrough Evolutionary Relationships) GO classification system.
Biology 14 00124 g015
Figure 16. Quantification of differentially expressed proteins using computational analysis of proteomic data. (A) Principal component analysis (PCA) between 3rd and 4th week NT WJ-MSCs (blue) and 3rd (green) and 4th (red) week HLCs (tr). (B) Graph of PCA considering components 3 and 1 to discriminate 3rd and 4th HLCs; (C) Volcano plot showing the significant proteins differentially expressed comparing the differences between HLCs (named as tr) and NT WJ-MSCs (named as nt). The upregulated proteins are shown in red, while downregulated ones are in blue. The 14 upregulated proteins after the differentiation protocol are mentioned in bold red. The insert was used to show some proteins in detail. Fibronectin (FN1, in bold blue) was highly downregulated. X-axis: differences in the intensity of label-free quantification (LFQ) are reported. Y-axis: significance derived from the −log10(p-values) of protein ratio between HLCs (tr) and NT WJ-MSCs (nt). FDR = 0.05.
Biology 14 00124 g016
Figure 17. (A) STRING interactions of the most upregulated proteins in HLCs after differentiation; (B) nine proteins (in red) resulted enriched in liver tissue; (C) STRING analysis revealed the proteins strictly connected with some hepatic functions, such as glycogen metabolism.
Biology 14 00124 g017
Table 1. Identification of intracellular proteins based on HPLC-MS/MS-derived sequences from NT WJ-MSCs and HLCs. The proteins were classified based on gene ontology annotations and literature references. (*) proteins described for the first time in HLCs derived from WJ-MSCs but already described in HLCs derived from other stem cells. (**) proteins described for the first time in HLCs derived from WJ-MSCs and never described in HLCs derived from other stem cells. (§) proteins expressed by hepatic progenitor cells.
Biological ProcessNameAccession
Number
Gene 3rd Week
NT WJ-MSCs
3rd Week HLCs4th Week NT WJ-MSCs4th Week HLCs
Xenobiotic and drug metabolism processAflatoxin B1 aldehyde reductase member 2 (Fragment)H3BLU7AKR7A2++
Aldehyde oxidase (**)Q06278AOX1+
Cytochrome P450 1B1Q16678CYP1B1+
Cytochrome P450 2A13Q16696CYP2A13+
Cytochrome P450 2S1Q96SQ9CYP2S1++
Dimethylaniline monooxygenase [N-oxide-forming] 3 (**)P31513FMO3+
Epoxide hydrolase 1 (*)P07099EPHX1++++
Glutathione S-transferase Mu 1 (**)P09488GSTM1+
Glutathione S-transferase omega-1 (**)P78417GSTO1++++
Glutathione S-transferase P (**)P09211GSTP1++++
Lanosterol 14-alpha demethylase (**)Q16850CYP51A1++
Nuclear receptor subfamily 1 group I member 3 (**)E9PCF2NR1I3+
UDP-glucuronosyltransferase 1–4 (**)P22310UGT1A4-+
Lipid metabolic processAcetyl-CoA acetyltransferase, cytosolic (**)Q9BWD1ACAT2++
Acetyl-CoA acetyltransferase, mitochondrialP24752ACAT1++
Acyl-coenzyme A thioesterase 2, mitochondrialP49753ACOT2++
Angiopoietin-related protein 3 (**)Q9Y5C1ANGPTL3+
ATP-binding cassette sub-family A member 1 (**) (§)O95477ABCA1+
Carboxylesterase 3Q6UWW8CES3+
Enoyl-CoA hydratase domain-containing protein 2, mitochondrial (Fragment) (**)F5GWU3ECHDC2+
Erlin-1 (**)O75477ERLIN1+
Fatty acid synthaseP49327FASN+
Heme oxygenase 2 (**)P30519HMOX2+
Hydroxyacyl-coenzyme A dehydrogenase, mitochondrialQ16836HADH+
Long-chain-fatty-acid--CoA ligase 1 (**)E7EPM6ACSL1++
Long-chain-fatty-acid--CoA ligase 3 (**)O95573ACSL3++
Mevalonate kinase (**)F5H8H2MVK+
Peroxisomal bifunctional enzyme (**)Q08426EHHADH+
Phosphatidylcholine translocator ABCB4P21439ABCB4+
Very long-chain specific acyl-CoA dehydrogenase, mitochondrial (**)P49748ACADVL+++
Very-long-chain (3R)-3-hydroxyacyl-CoA dehydratase 3 (**)Q9P035HACD3++
Very long-chain acyl-CoA synthetaseO14975SLC27A2+
Cholesterol, bile and carnitine metabolic process4-trimethylaminobutyraldehyde dehydrogenase (**)P49189ALDH9A1++
7-dehydrocholesterol reductase (**)Q9UBM7DHCR7++++
Delta (24)-sterol reductase (**)Q15392DHCR24++
24-hydroxycholesterol 7-alpha-hydroxylase (**)Q9NYL5CYP39A1+
Cholesterol side-chain cleavage enzyme, mitochondrial P05108CYP11A1+
Bile acid receptor (**)Q96RI1NR1H4+
Epididymal secretory protein E1 (**)G3V3E8NPC2++++
Leptin receptorP48357LEPR+
Glucose metabolic process1,4-alpha-glucan-branching enzyme (**)Q04446GBE1++++
Alpha-enolaseP06733ENO1++++
Alpha-N-acetylglucosaminidaseP54802NAGLU+++
ATP-dependent 6-phosphofructokinase, liver type (**)P17858PFKL++++
Glycogen debranching enzyme (**)P35573AGL+++
Glycogen phosphorylase, liver form (**)P06737PYGL+
Glycogen [starch] synthase, muscleP13807GYS1++
Insulin receptor substrate 2 (**)Q9Y4H2IRS2+
L-lactate dehydrogenase A chainP00338LDHA++++
Phosphoenolpyruvate carboxykinase [GTP], mitochondrial (**)Q16822PCK2++
Phosphoglucomutase-1 (**)P36871PGM1++++
Thioredoxin, mitochondrialQ99757TXN2+
Insulin-like growth factor-binding protein 4P22692IGFBP4+
Non-POU domain-containing octamer−binding proteinQ15233NONO+
Protein deglycase DJ-1Q99497PARK7++++
ProthrombinP00734F2+++
Amino acid metabolic processAmine oxidase [flavin-containing] AP21397MAOA++
Aminopeptidase N (CD13)P15144ANPEP++++
Alanine aminotransferase 1 (**)P24298GPT+
Aspartate aminotransferase, cytoplasmic (**)P17174GOT1++
Aspartate aminotransferase, mitochondrial (**)P00505GOT2++++
Carnosine N-methyltransferaseQ8N4J0CARNMT1+
Cathepsin DP07339CTSD+
Neprilysin (CD10)P08473MME++++
Phosphoserine aminotransferaseQ9Y617PSAT1++++
Putative aspartate aminotransferase, cytoplasmic 2Q8NHS2GOT1L1+
Urea cycleArgininosuccinate synthase (**) (§)P00966ASS1++++
Mitochondrial ornithine transporter 1 (**)Q9Y619SLC25A15+
Ornithine aminotransferase, mitochondrial (**)P04181OAT++++
Alcohol metabolic processAlcohol dehydrogenase class-3 (**)P11766ADH5++++
Aldehyde dehydrogenase, mitochondrial (**)P05091ALDH2+
BindingAlbuminP02768ALB++++
Apolipoprotein L5Q9BWW9APOL5+
ATP-binding cassette sub-family A member 6 (**) Q8N139ABCA6+
CREB-binding proteinQ92793CREBBP+
Cytochrome b-c1 complex subunit 1, mitochondrialP31930UQCRC1+++
Cytochrome c1, heme protein, mitochondrial (**)P08574CYC1+
Cytochrome c oxidase subunit 2P00403MT-CO2++
Cytochrome c oxidase subunit 4 isoform 1, mitochondrialP13073COX4I1+++
Cytochrome c oxidase subunit 5A, mitochondrialP20674COX5A++++
Exportin-TO43592XPOT+
Filamin-binding LIM protein 1Q8WUP2FBLIM1+++
Hemoglobin subunit gamma-2 (**)E9PBW4HBG2+
Immediate early response 3-interacting protein 1Q9Y5U9IER3IP1+
Insulin-like growth factor-binding protein 7 (**)Q16270IGFBP7++++
Metallothionein-2 (**)P02795MT2A+
Multidrug resistance-associated protein 5O15440ABCC5+
Poly(rC)-binding protein 1Q15365PCBP1++++
Putative cytochrome b-c1 complex subunit Rieske-like protein 1P0C7P4UQCRFS1P1+
TransferrinP02786TFRC++
Cellular and apoptotic process5′-nucleotidase (CD73)P21589NT5E++++
Adipocyte plasma membrane-associated proteinQ9HDC9APMAP+
Carnosine N-methyltransferaseQ8N4J0CARNMT1+
Cytochrome P450 1B1Q16678CYP1B1+
Death-inducer obliterator 1 (**)Q9BTC0DIDO1+
Eukaryotic translation initiation factor 3 subunit FO00303EIF3F++
Gelsolin (**)P06396GSN+++
Inter-alpha-trypsin inhibitor heavy chain H4 (**)Q14624ITIH4+
mRNA-capping enzymeO60942RNGTT+
multiple epidermal growth factor-like domains protein 8Q7Z7M0MEGF8++++
PH domain leucine-rich repeat-containing protein phosphatase 1O60346PHLPP1+
Protein-glutamine gamma-glutamyltransferase 2P21980TGM2++++
Retinoid-inducible serine carboxypeptidaseQ9HB40SCPEP1+++
Retinol dehydrogenase 11Q8TC12RDH11++
Proliferation/differentiation and liver developmentDapper homolog 2Q5SW24DACT2+
Fascin (**)Q16658FSCN1++++
Fibroblast growth factor receptor 2D2CGD1FGFR2+
Growth/differentiation factor 8O14793MSTN+
H2.0-like homeobox protein (**)Q14774HLX+
Hepatocyte growth factor receptor (**) (§)P08581MET+
Hepatocyte nuclear factor 1-alphaU3KQS6HNF1A+
Hepatocyte nuclear factor 6Q9UBC0ONECUT1++
Latent-transforming growth factor beta-binding protein 3 (**) (§)Q9NS15LTBP3++
Prospero homeobox protein 1 (**) (§)Q92786PROX1+
Transcription factor SOX-4 (**)Q06945SOX4+
TransgelinQ01995TAGLN++++
Immune system processBeta-2-microglobulinP61769B2M+++
Complement C1r subcomponentB4DPQ0C1R+
Complement C2 (Fragment)H0Y868C2+
Complement C3 (Fragment)M0R0Q9C3+
Complement C5P01031C5+
Complement factor HP08603CFH+
FibronectinP02751FN1++++
Galectin-1P09382LGALS1++++
Galectin-3P17931LGALS3+++
Guanylate-binding protein 1P32455GBP1++
HLA class I histocompatibility antigen, A-29 alpha chainP30512HLA-A+
HLA class I histocompatibility antigen, A-68 alpha chainP01891HLA-A++
Indoleamine 2,3-dioxygenase 2Q6ZQW0IDO2+
Indoleamine-pyrrole 2,3-dioxygenaseP14902IDO1+
Kallikrein-2 (Fragment)A0A075B7A6KLK2+
Non-POU domain-containing octamer-binding proteinQ15233NONO+
Protein deglycase DJ-1Q99497PARK7++++
ProthrombinP00734F2+++
Other functionsActin, cytoplasmic 1P60709ACTB+++
Adenylate cyclase type 4Q8NFM4ADCY4++
Adenylyl cyclase-associated protein 1Q01518CAP1++++
Amyloid-like protein 2Q06481APLP2+
CalretininP22676CALB2+
CalumeninO43852CALU++++
CD44 antigenH0YDX6CD44++++
Cytokeratin 18P05783KRT18++++
Cytokeratin 19P08727KRT19+++
Cytokeratin 8P05787KRT8++++
DesminP17661DES++
Fibrillin-1P35555FBN1++
Filamin-binding LIM protein 1Q8WUP2FBLIM1+++
Growth arrest-specific protein 2O43903GAS2+
Growth factor receptor-bound protein 7Q14451GRB7+
Heat shock-related 70 kDa protein 2P54652HSPA2++
Integrin beta-1 (CD29)P05556ITGB1++++
KalirinO60229KALRN+
LactadherinQ08431MFGE8++++
Laminin subunit alpha-1P25391LAMA1+
Lipoma-preferred partnerQ93052LPP++
Plastin-3P13797PLS3++++
Platelet-derived growth factor receptor betaP09619PDGFRB++
PlectinQ15149PLEC++++
PMS1 protein homolog 1P54277PMS1+
Pregnancy zone proteinP20742PZP+
Procollagen-lysine,2-oxoglutarate 5-dioxygenase 1Q02809PLOD1++++
Septin-9Q9UHD8SEPT9++
SparcP09486SPARC++++
T-complex protein 1 subunit gammaP49368CCT3+++
Tenascin-RQ92752TNR+
Thy-1 membrane glycoprotein (CD90)P04216THY1++++
UDP-glucose:glycoprotein glucosyltransferase 1Q9NYU2UGGT1+++
Disclaimer/Publisher’s Note: The statements, opinions and data contained in all publications are solely those of the individual author(s) and contributor(s) and not of MDPI and/or the editor(s). MDPI and/or the editor(s) disclaim responsibility for any injury to people or property resulting from any ideas, methods, instructions or products referred to in the content.

