3.1. Preparation of Flavored Yogurt Samples
Commercial fat-free stirred yogurts (Brassé 0% Auchan, Croix, France) were supplemented with sucrose (7% w/w, Daddy, CristalCo, Paris, France), three types of fruit preparations (15% w/w, Frulact, Gemunde, Portugal) and pear aroma (0.3% w/w, Robertet, Grasse, France). Fruit preparations contained 60% w/w of fruits, 15% w/w of sucrose, and differed by the size and hardness of the fruit pieces (
Table 1). To obtain pear pieces with different hardnesses, two pear varieties (Rocha and Williams) were used. The three different yogurts obtained were designated P_Standard, P_Size and P_Hardness. The pear aroma formula was composed of hexyl acetate (0.69% w/w), isoamyl acetate (0.17% w/w), octyl acetate (0.06% w/w), ethyl acetate (0.035% w/w), γ-decalactone (0.03% w/w),
cis-3-hexenyl acetate (0.03% w/w), geranyl butyrate (0.03% w/w) and pear ester (0.02% w/w) prepared in propylene glycol.
The yogurt base, sucrose, fruit preparation and aroma were successively weighed and mixed together using a food processor (Kenwood, Redmond, WA, USA) equipped with a K-type blade under controlled conditions (minimum power for 30 sec). Yogurt preparation was performed before each sensory or in vivo analysis session. The flavoring step was performed between four and six days before consumption to allow aroma stabilization within products. Products were stored at 4 °C. Panelists consumed all yogurts 16–20 days before their expiration date so that they would be in a stable phase of pH and viscosity.
3.2. Physico-Chemical Analysis
The hardness of pear pieces in fruit preparations was measured by a puncture test performed at the GMPA laboratory with a TA-XT2 texture analyzer (Stable Micro Systems Ltd., Godalming, UK) fitted with a hemispheric probe of 1 mm in diameter, forced into the fruit with a 2-mm penetration depth. Ten repetitions per type of fruit piece were performed.
The rheological properties and pH of yogurts were measured at each sensory session. The viscoelastic properties of yogurts were measured by an oscillatory test performed with a MCR301 rheometer (Anton Paar GmbH, Graz, Austria), with vane geometry (ST 10-6V-8.8/88, Anton Paar, 4 blades, 10 mm diameter). Measurements from all samples were within the range of linear visco-elasticity. The oscillation frequency sweep test was set at 4 °C with a frequency varying from 10 to 0.1 Hz and a constant deformation of 1%. The measurements were conducted in triplicate. Data obtained were the storage and loss modulus (G' and G'', respectively). These parameters were selected at an angular frequency of 1.58 rad/s to study the results. The pH was measured at 4°C with a pH-metric probe (Mettler Toledo, Viroflay, France).
Real-time nose-space analysis was performed using a High Sensitive Proton Transfer Reaction Mass Spectrometer (PTR-MS) (Ionicon Analytik, Innsbruck, Austria). The PTR-MS instrument drift tube was thermally controlled (60 °C) and operated with voltage and pressure set at 600.1 (±0.4) V and 1.9 (±0.06) mbar, respectively. The E/N value was 153 ± 6 Td and the inlet flow rate was 80.0 mL/min.
For the
in vitro studies, headspaces above either the water solution with a single aroma compound (molecule concentrations between 100 and 400 mg/kg, 25 g in 0.25-L flasks, Schott AG, Mainz, Germany) or the yogurts (25 g in 0.25-L flasks, Schott), with and without fruit preparation and aroma, were analyzed after an equilibrium period of 24 hours. Measurements were performed in triplicate, at 10 °C, in scan mode from
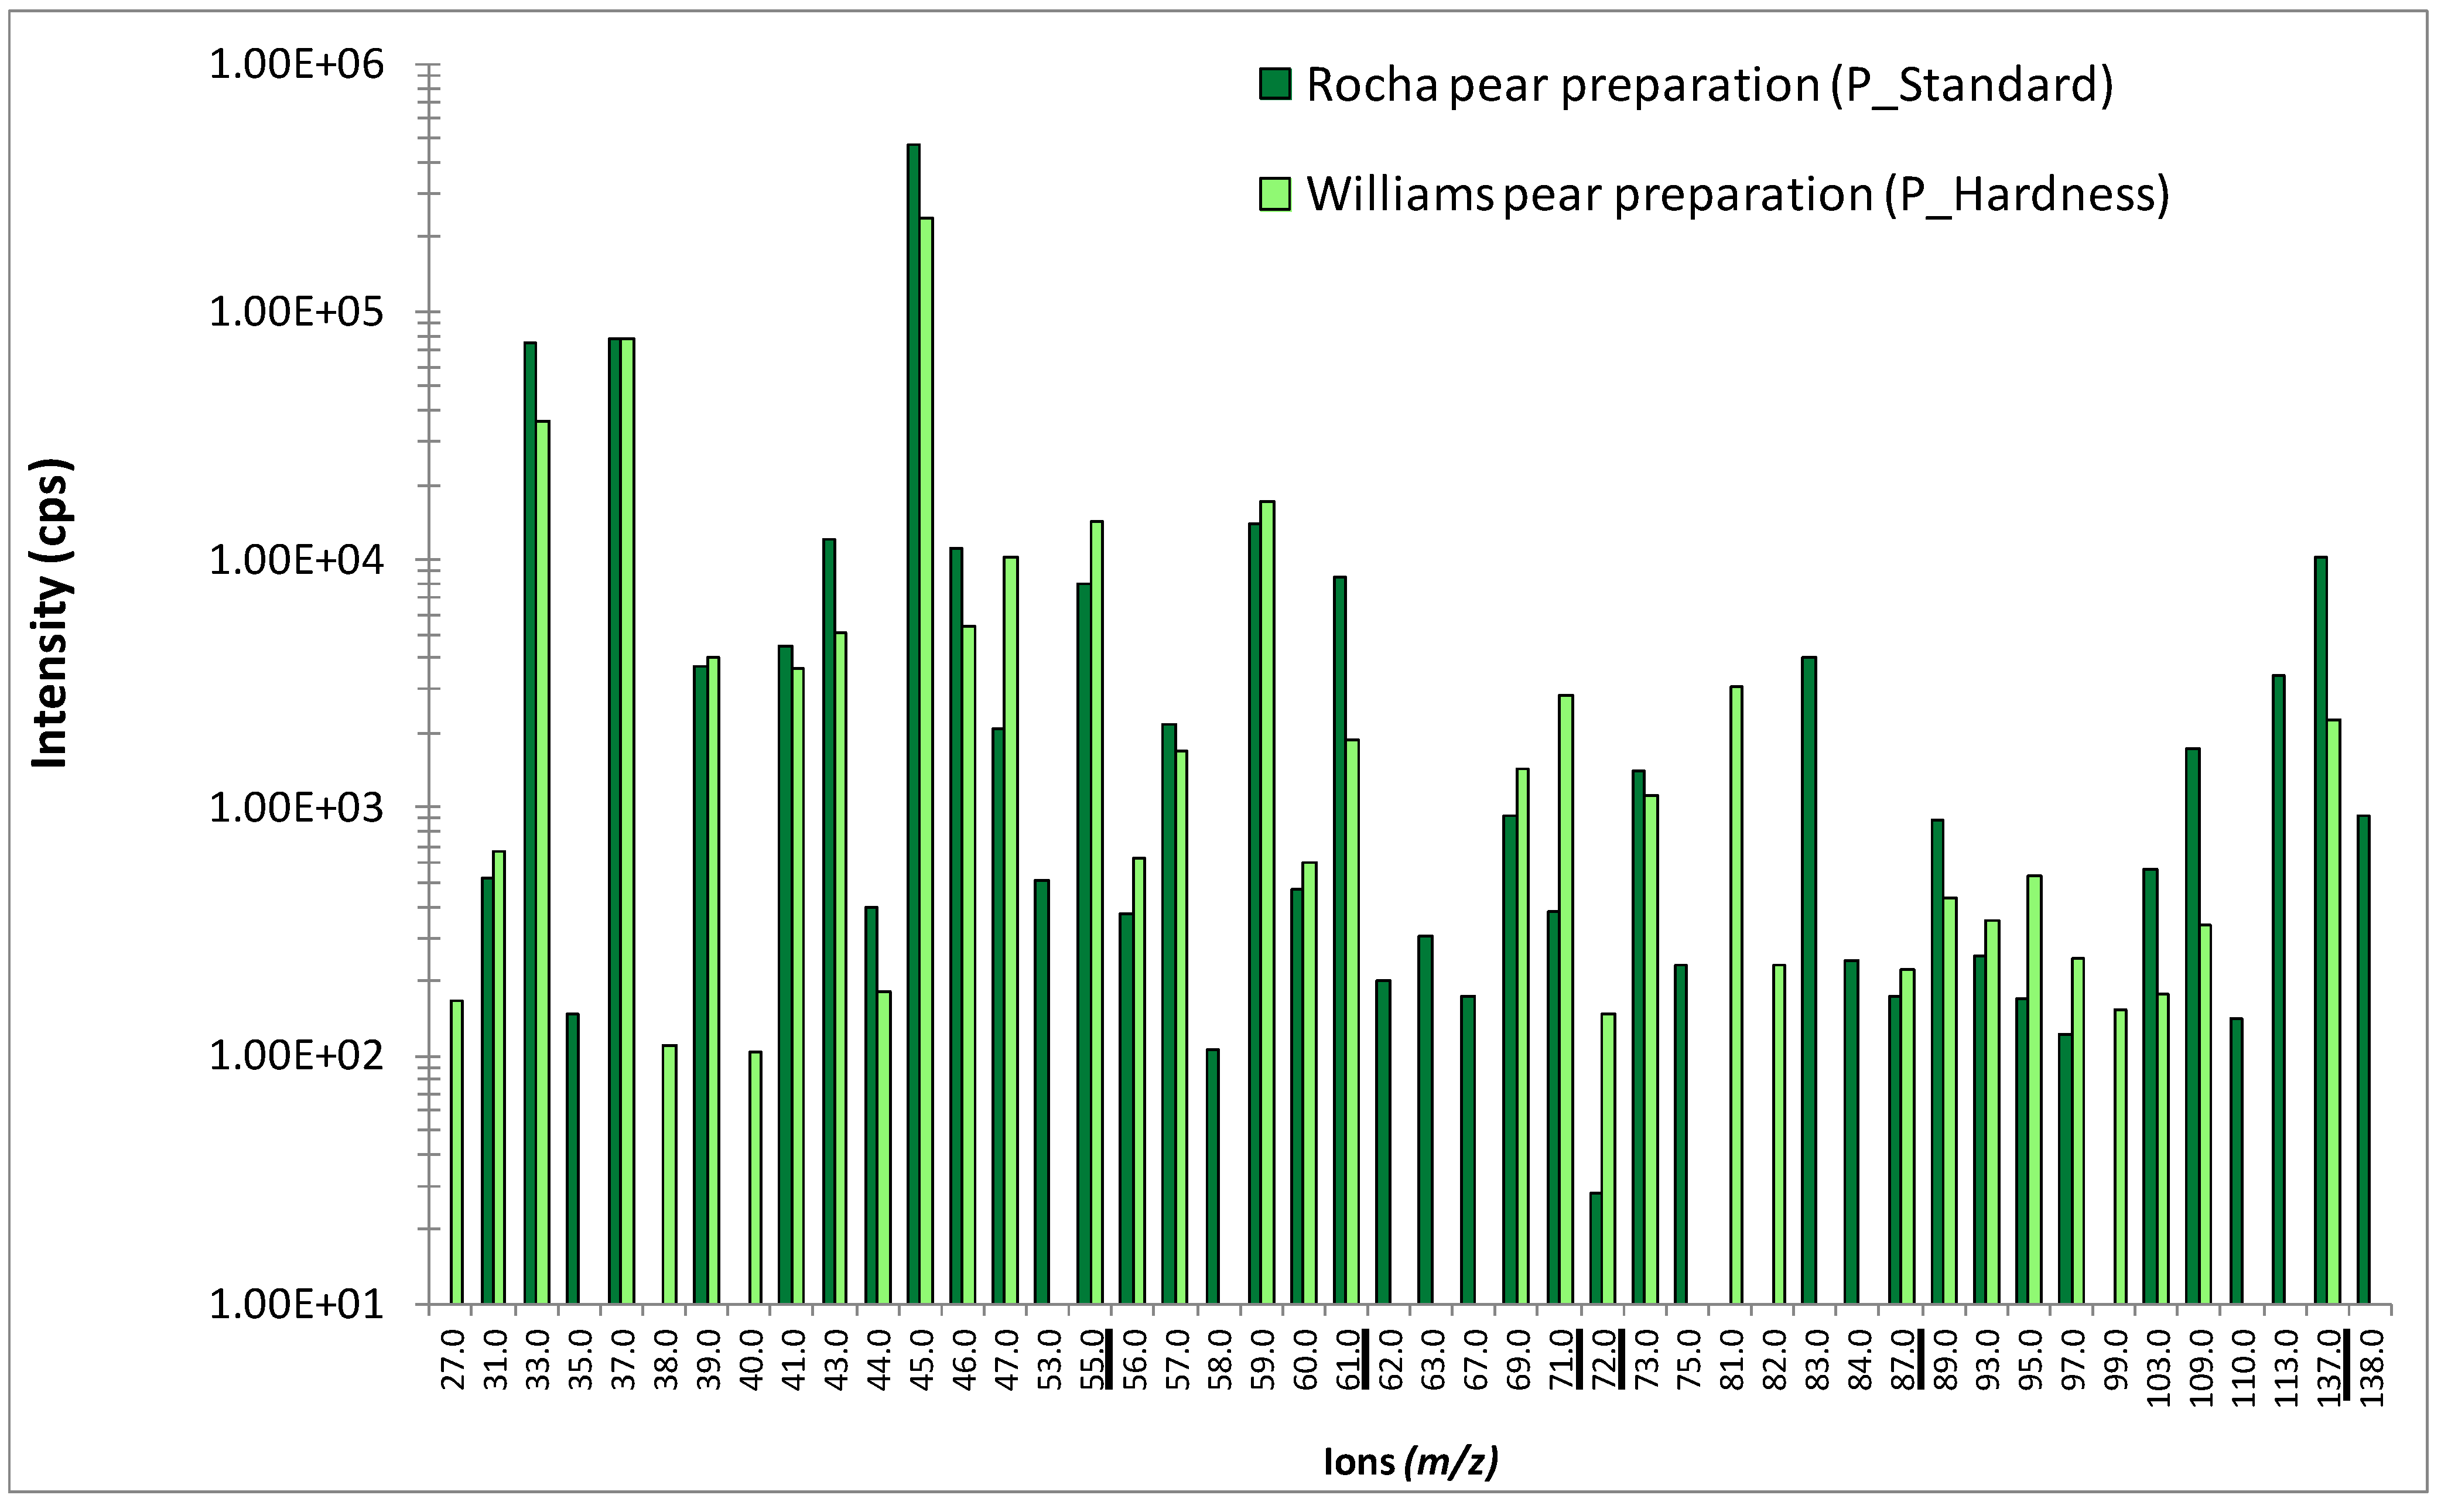
m/z 21 to 200 with a dwell time per mass of 50 ms. Fruit preparations with two different pear varieties were also individually analyzed under
in vitro conditions, following the same protocol. Concerning
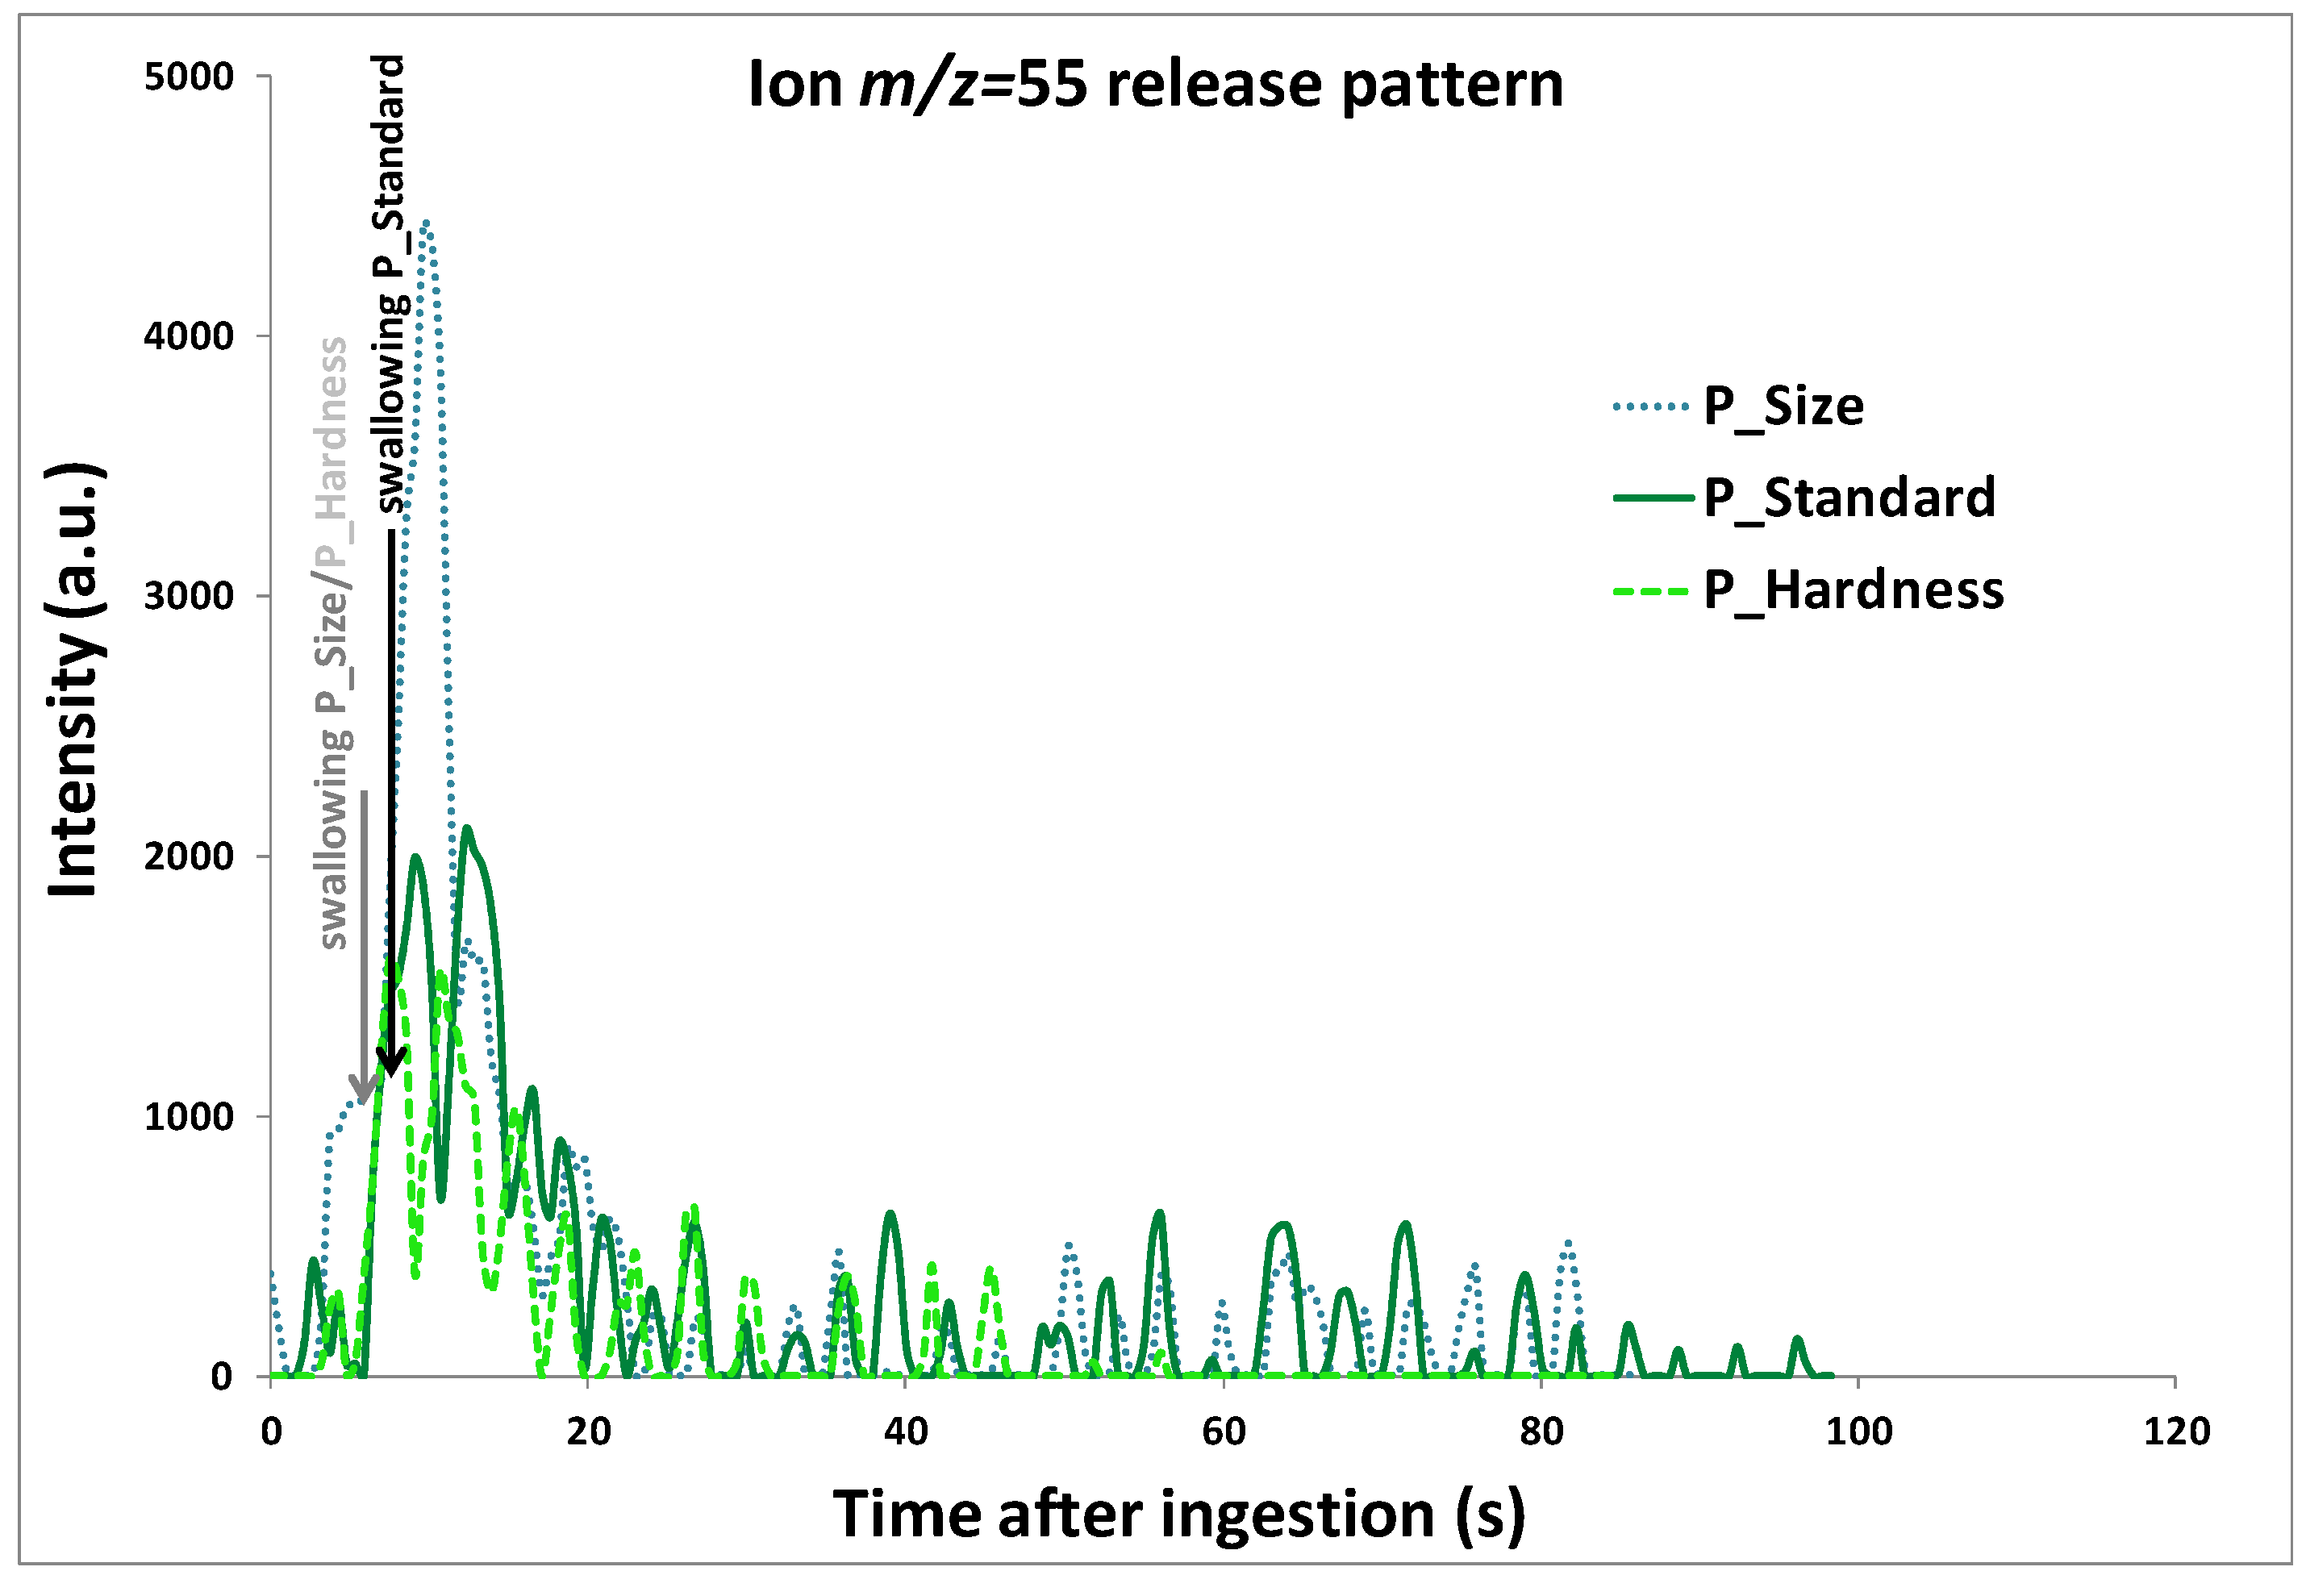
in vivo measurements, the breath of 14 panelists was sampled
via two inlets of a stainless steel nosepiece placed in both of the panelists’ nostrils. The inlet of the PTR-MS instrument was connected to the sampling device via a 1/16” PEEK™ tube maintained at 60 °C. Measurements were performed in the Multiple Ion Detection mode with a dwell time per mass of 0.5 s, except for
m/z 21, for which the dwell time per mass was 0.1 s. In addition to the ions previously selected, ion
m/z 59 (derived from acetone) was monitored to trace panelists’ breath [
12]. Moreover, the mass/charge ratios
m/z 21 (signal for H
3O
+) and
m/z 37 (signal for water clusters H
2O–H
3O
+) were monitored to check instrument performances and cluster ion formation.
In vivo analysis was performed following a standardized protocol. Panelists were instructed not to smoke, eat, drink, or use any persistent-flavored product for at least one hour before the session. Each assay lasted 6–7 min. During a given session, panelists had to eat six or seven samples served at 10 °C. Two sessions of 30 min per panelist were planned to obtain three replicates for each product. The room air was first analyzed for 10 s. Then, after positioning the sampling device in the two nostrils, panelists were asked to breathe regularly for 30 s (breath analysis). Panelists were instructed to put one spoonful of yogurt in their mouth and to consume it as they would normally. During all measurements, panelists were asked to keep their mouths closed and to only breathe through the nosepiece. The time of the first swallow was recorded for each panelist. Release data were acquired until release signals returned to their initial intensity. Between each sample, panelists were asked to cleanse their mouth by eating plain crackers and drinking mineral water (Evian, Danone, Evian, France). Panelists’ breath was tested before each new measurement. Samples were coded with three-digit numbers and presented in a sequential monadic way. All the measurements for each panelist were performed within a two-week period.
3.3. Sensory Analysis
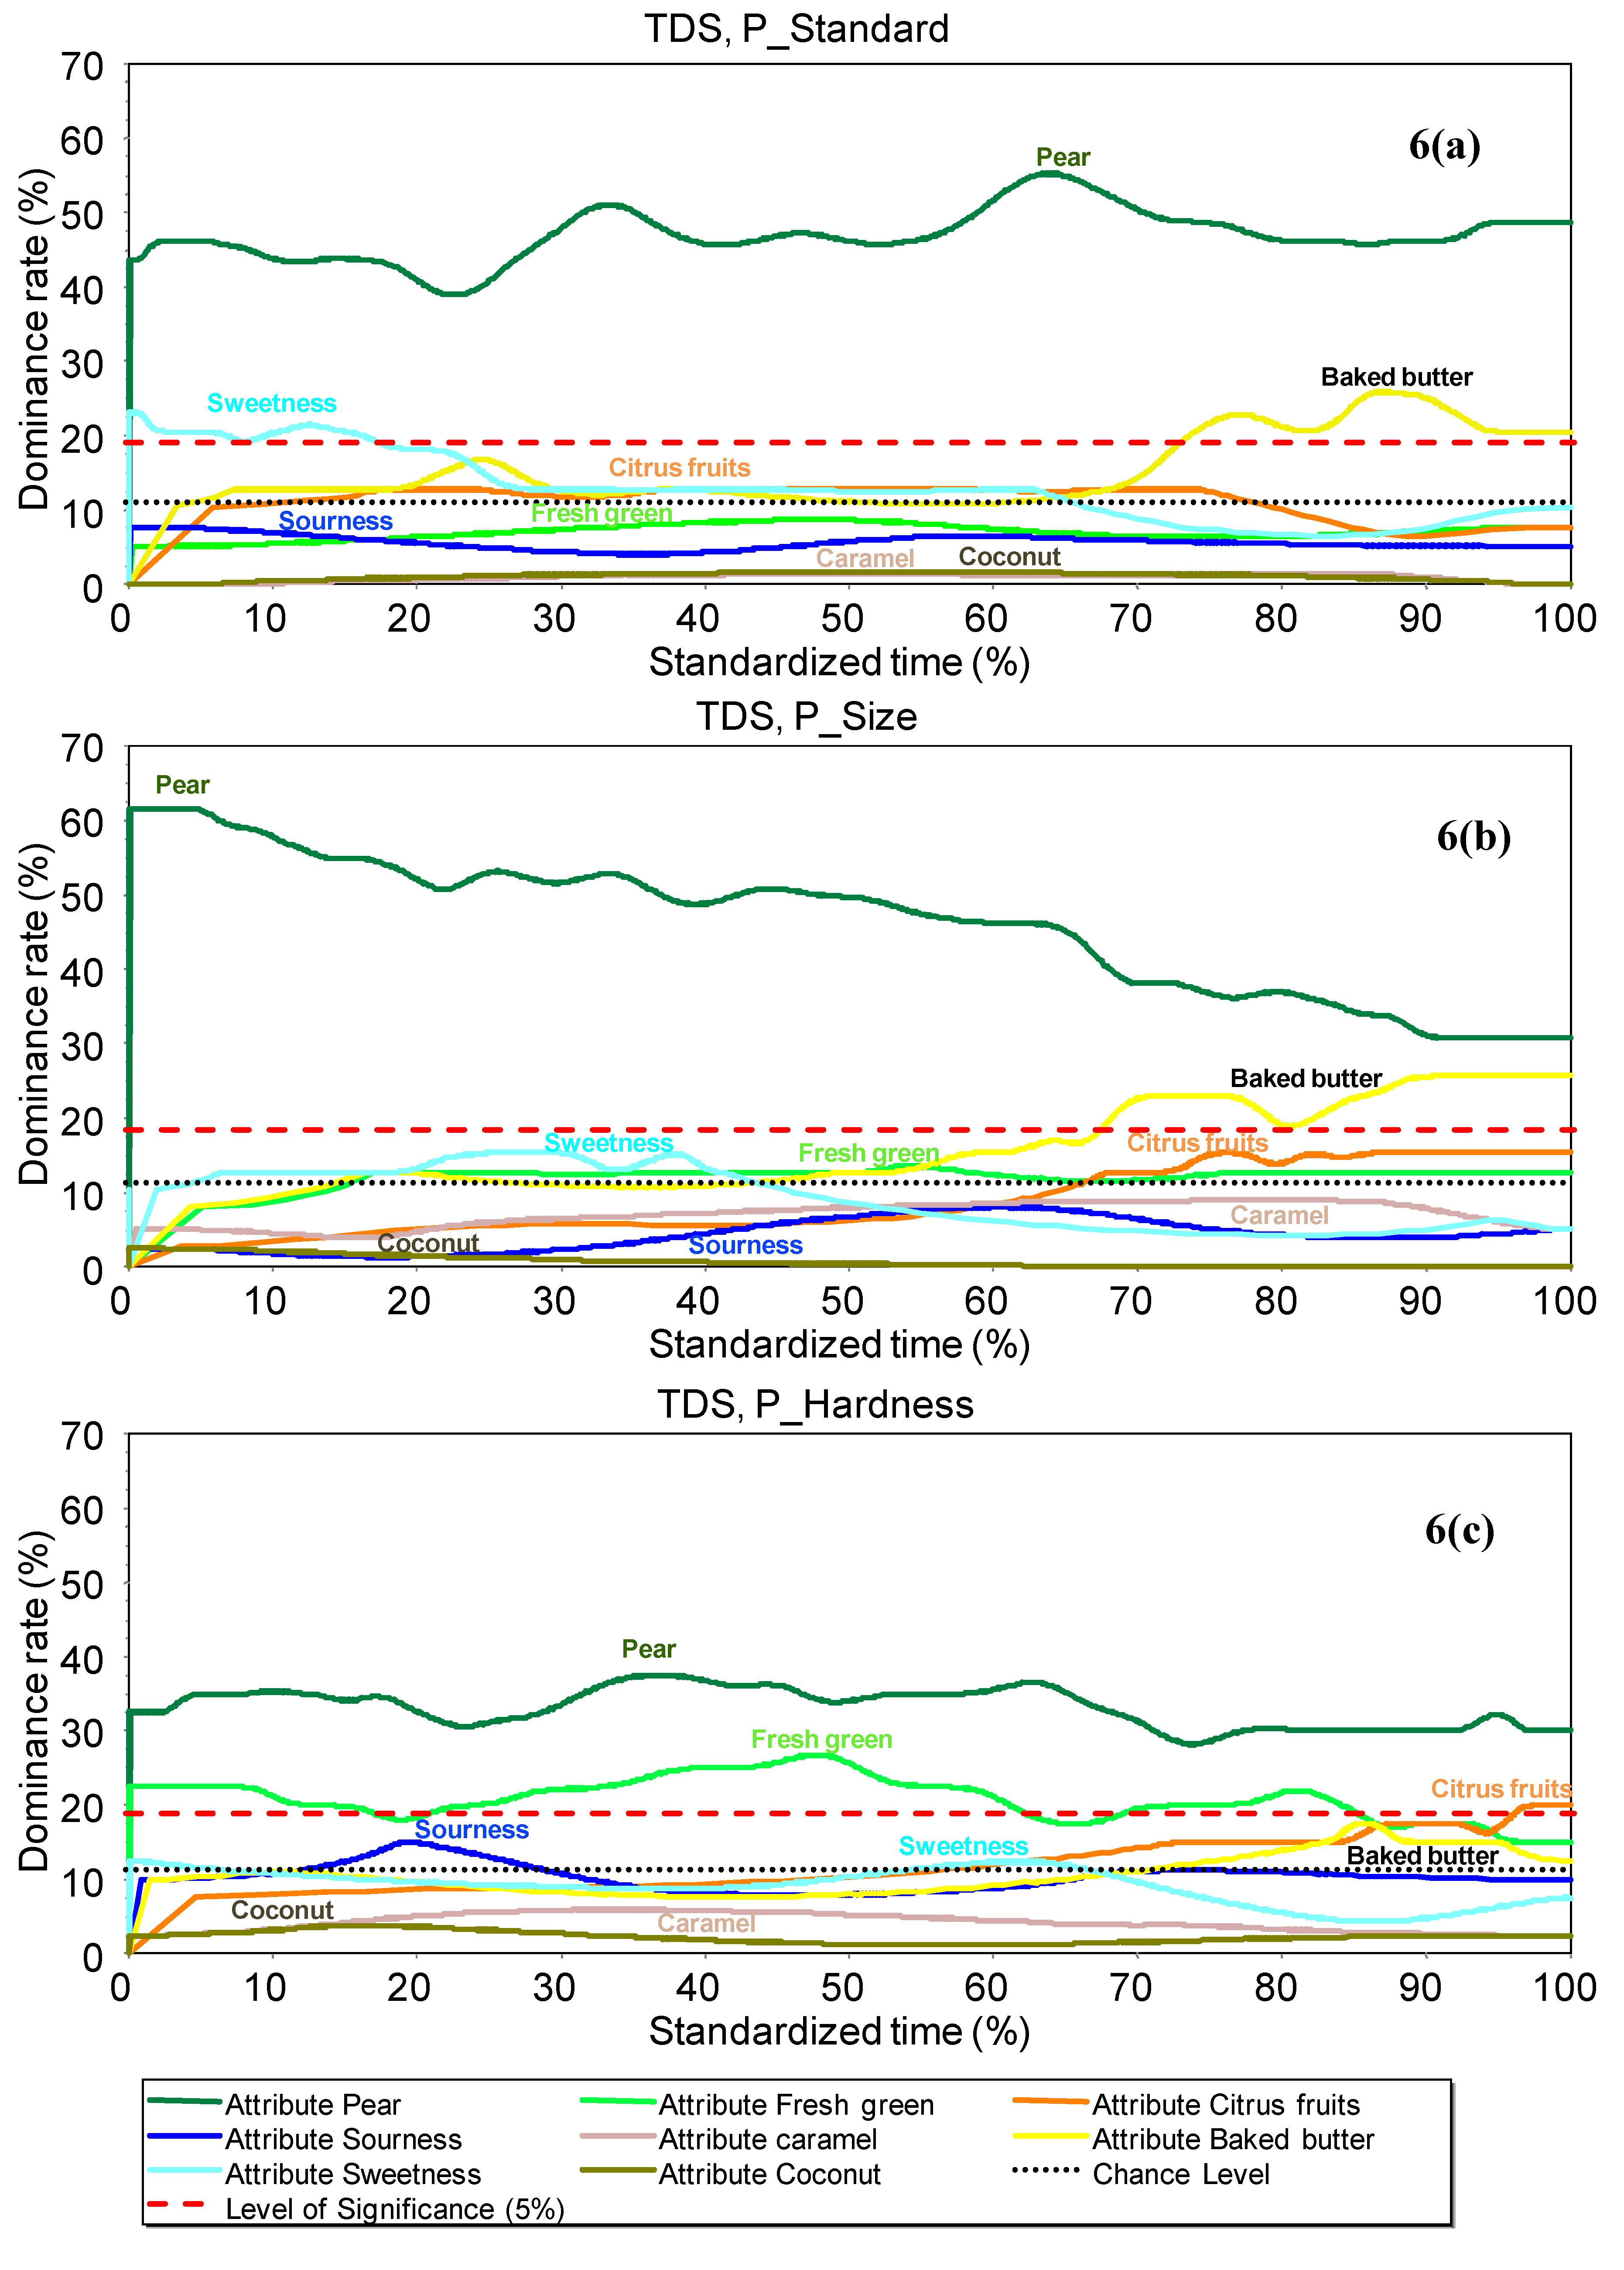
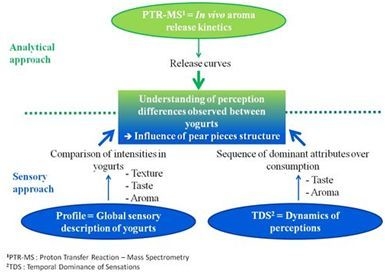
The sensory evaluation of products was performed using two different methods. First, a sensory profile was used to evaluate the texture, aroma and taste properties of yogurts. In addition, a Temporal Dominance of Sensations (TDS) test was used to study the dynamic perception of the three yogurts, focusing only on aroma and taste perceptions.
Fourteen panelists were recruited at the INRA laboratory according to their motivation and availability to pursue this two-month study with two sessions per week. Potential panelists were screened for self-reported current illnesses, food allergies and intolerances and pregnancy. Each panelist provided written consent to participate in this study. All panelists were trained in preliminary sessions for this specific study. Eight training sessions were designed to help panelists to perceive, recognize and quantify the sensory properties of pear yogurts. Attribute generation was carried out during two specific sessions where a wide range of commercial pear yogurts varying in texture and flavor characteristics was presented. After the generation step, the panelists agreed on a reduced list of attributes related to texture in the mouth, aroma and taste, defined in
Table 7. Panelists were then trained to quantify the perception of these attributes on a 10-point unstructured intensity scale, and learned how to use the FIZZ data collection software program (Biosystèmes, Couternon, France, 1999). For the TDS dynamic method, panelists were trained to perceive and describe changes in dominant perception over time. Panelist performances were evaluated prior to data collection, checking individual repeatability and panel consensus.
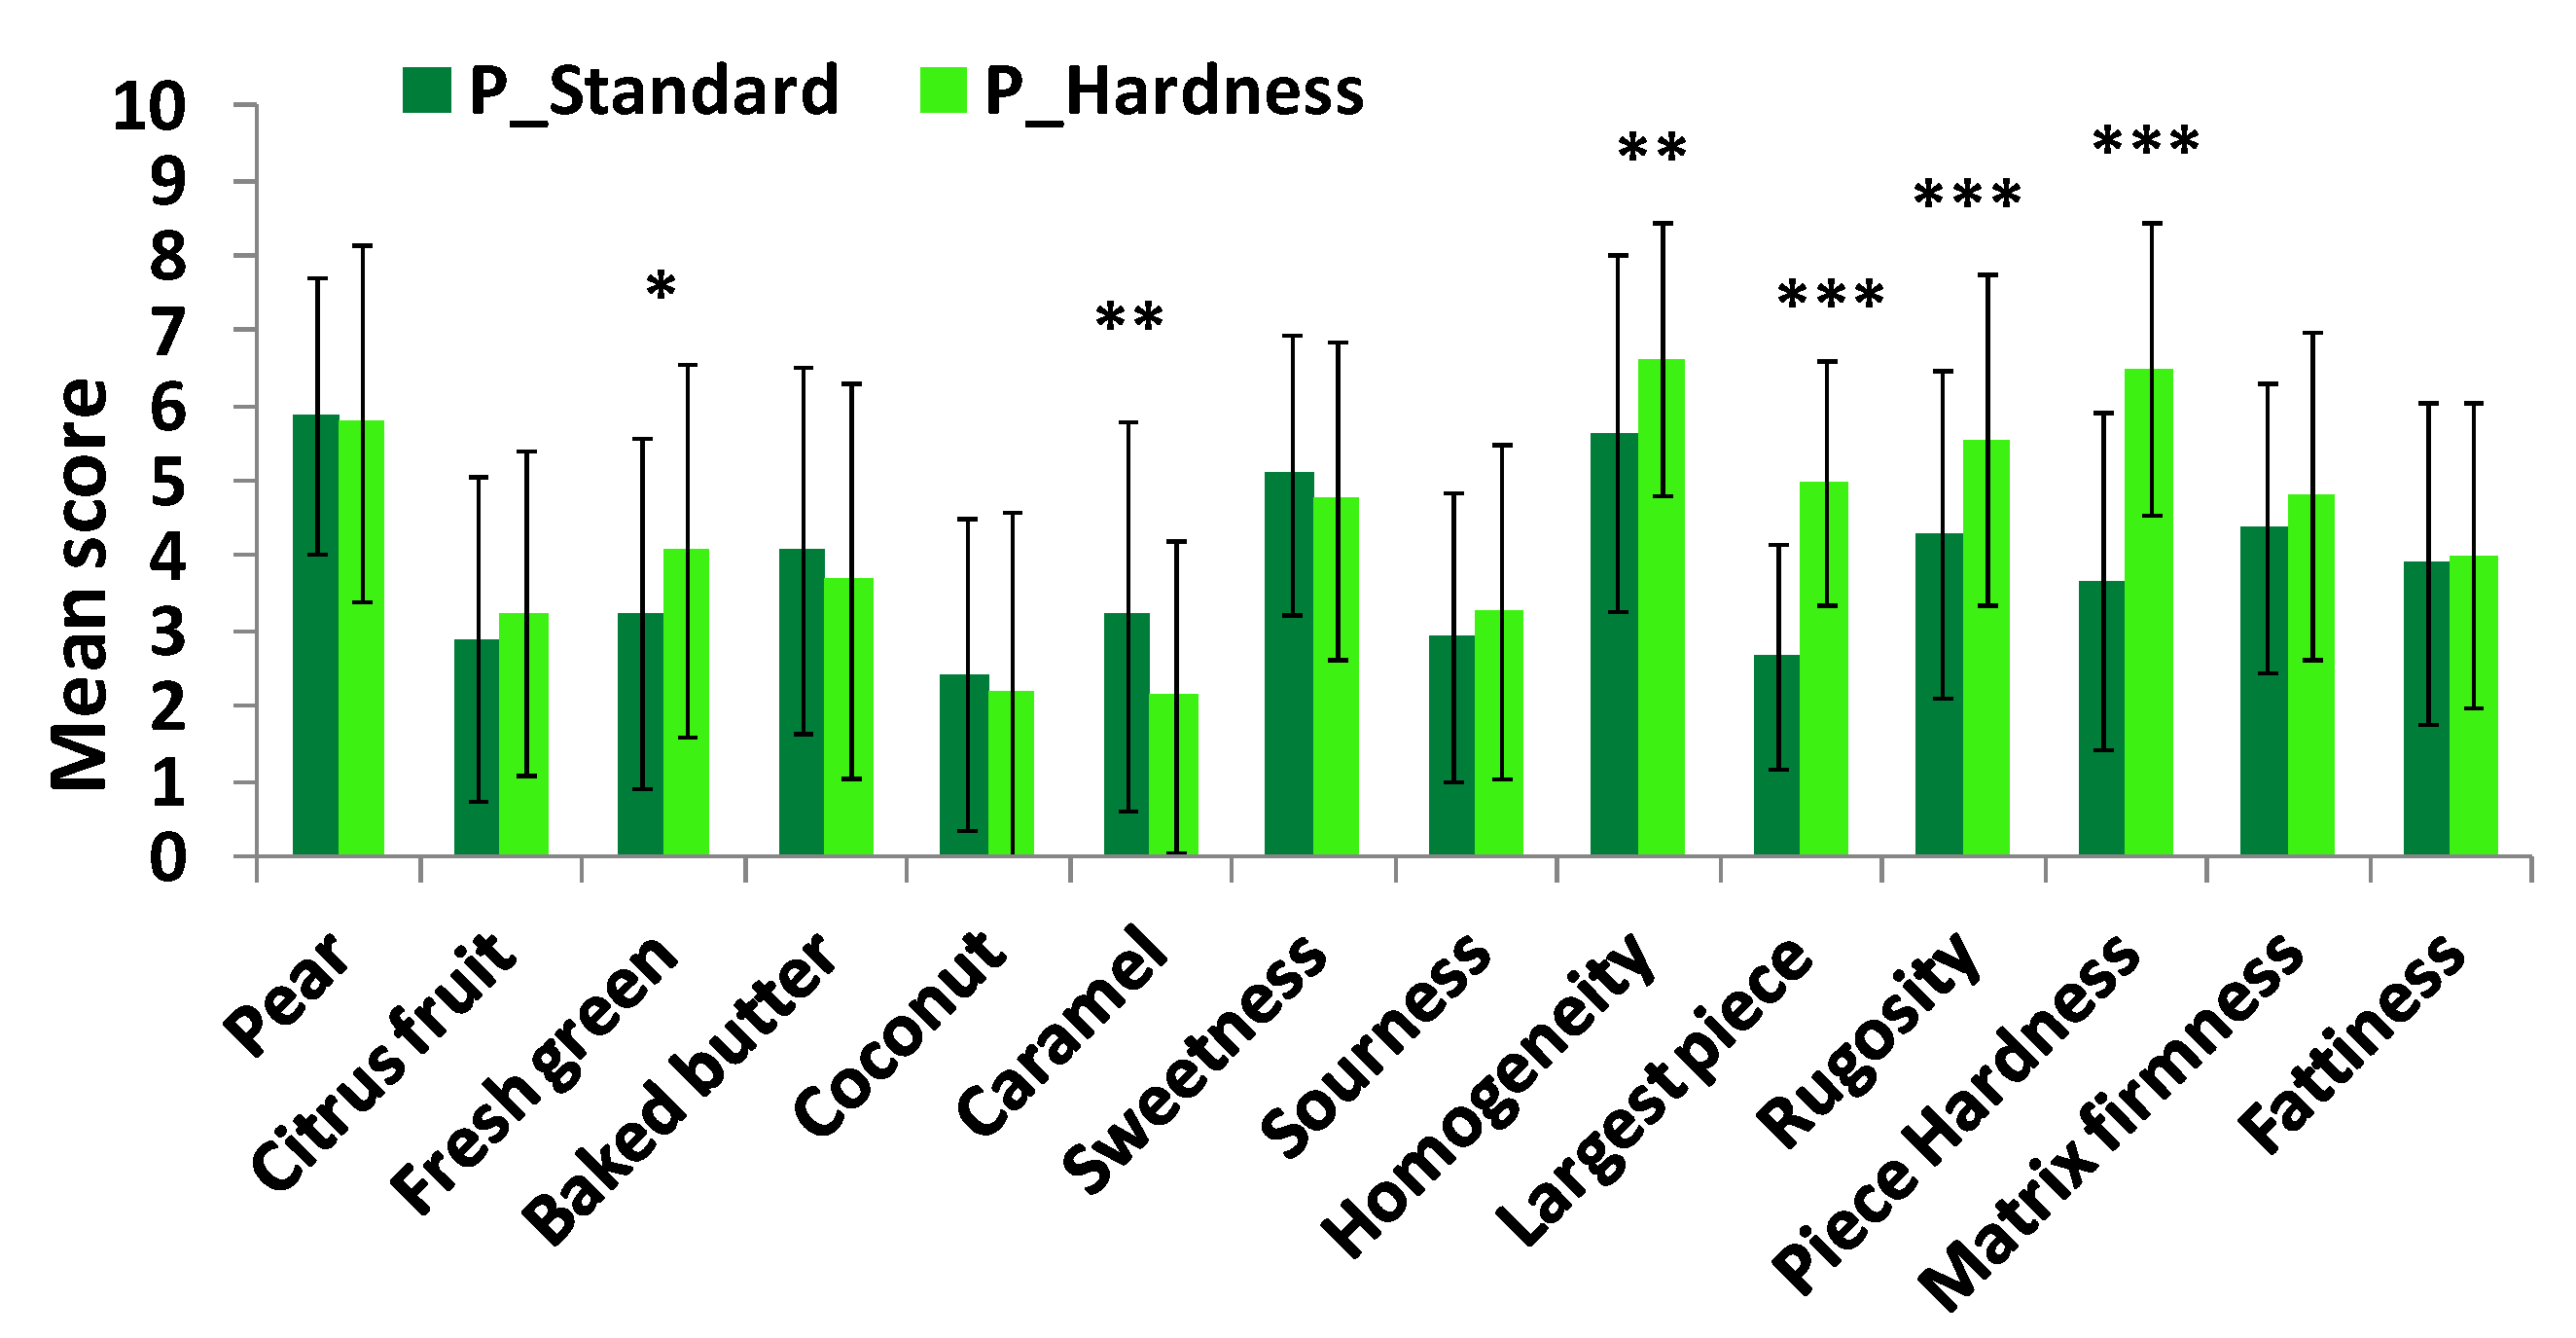
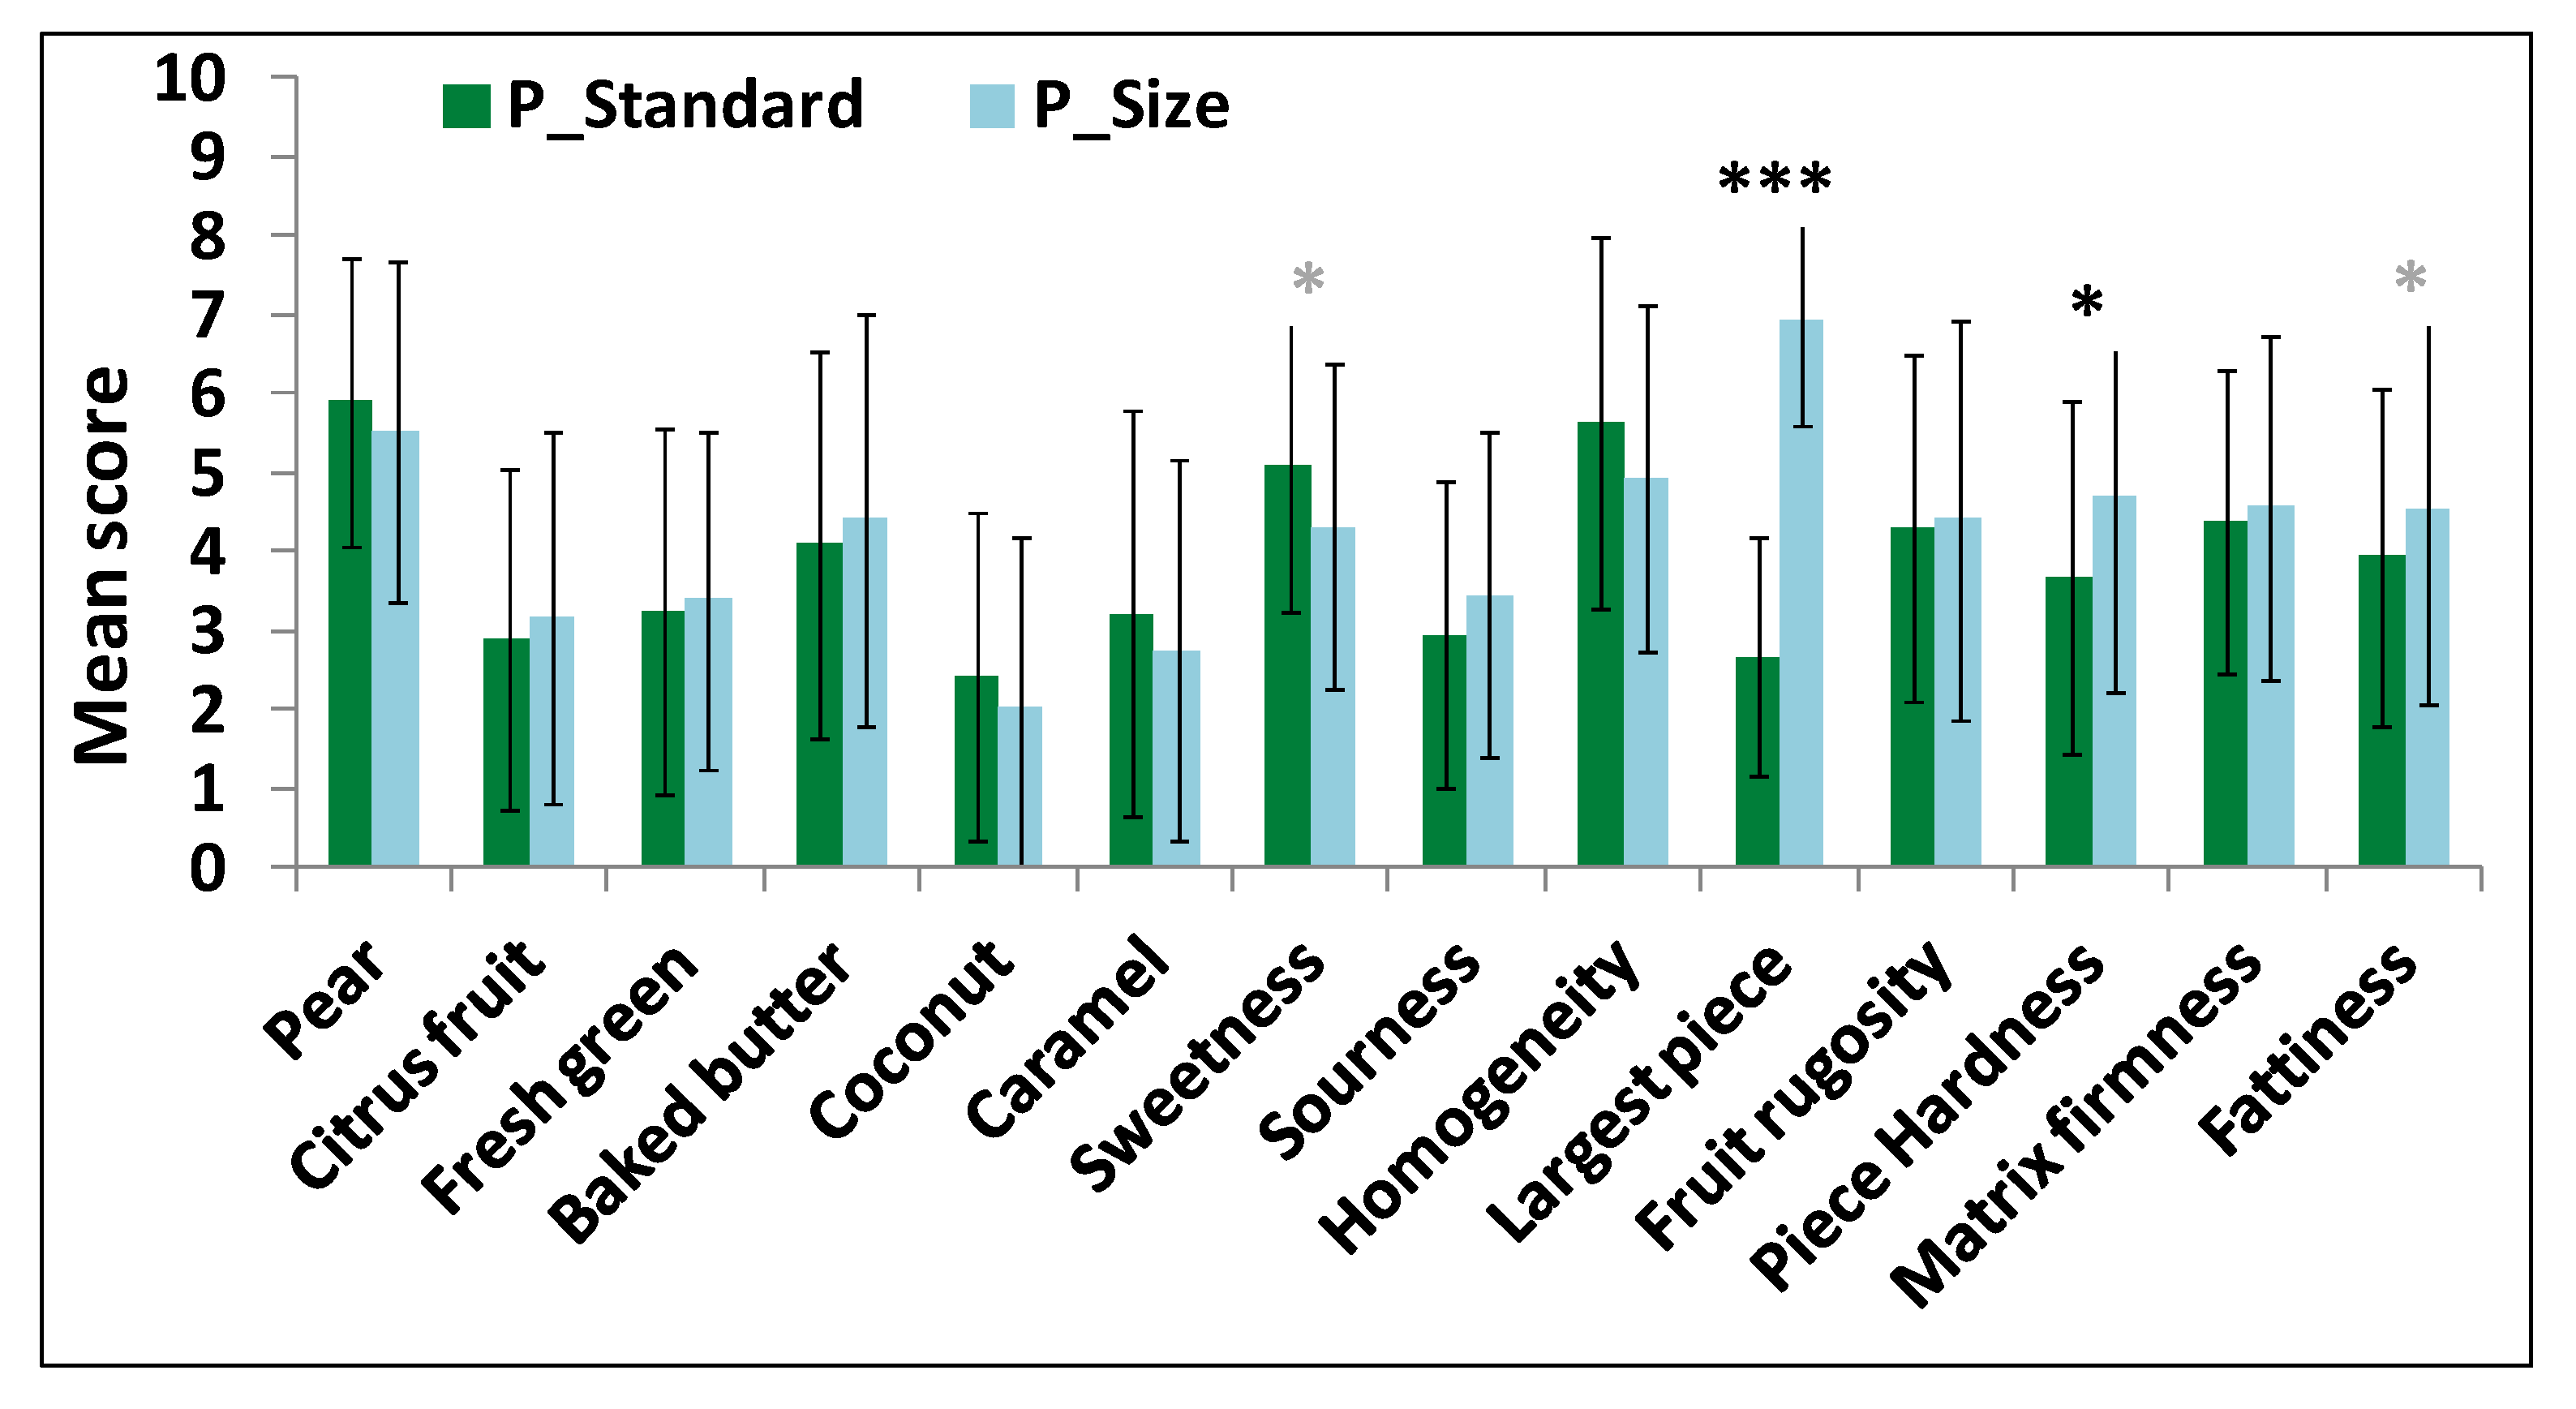
A sensory profile using the Descriptive Analysis method was performed. The intensity of 14 attributes was assessed on 10-point unstructured intensity scales. Panelists had to successively evaluate taste, aroma and texture of yogurts. They were asked to take homogeneous spoonfuls and to consume them as they would normally. Three replicates per product and panelist were performed in three sessions.
Table 7.
List of attributes used for the sensory profile and their definitions.
Table 7.
List of attributes used for the sensory profile and their definitions.
| | Attribute | Definition |
|---|
| Taste | Sweetness | Basic taste associated with sucrose |
| | Sourness | Basic taste associated with lactic acid |
| Aroma | Baked butter | Aroma perceived by the retronasal pathway associated with diacetyl |
| | Fresh green | Aroma perceived by the retronasal pathway associated with cis-3-hexenol / cis-3-hexenyl acetate |
| | Citrus fruit | Aroma perceived by the retronasal pathway associated with citrus fruit natural extract |
| | Pear | Aroma perceived by the retronasal pathway associated with hexyl-acetate |
| | Caramel | Aroma perceived by the retronasal pathway associated with maltol |
| | Coconut | Aroma perceived by the retronasal pathway associated with γ-octalactone |
| Texture of fruit | Fruit piece homogeneity | Related to the homogeneity of the size of fruit pieces |
| pieces | Largest piece size | Size of the largest fruit piece found in the yogurt |
| | Rugosity | Related to the perception of the size and shape of particles in fruit preparations |
| | Fruit piece hardness | Related to the force required to compress the fruit pieces between the teeth |
| Texture of the matrix | Matrix firmness | Related to the force required to compress the product between the tongue and the palate |
| | Matrix fattiness | Related to the perception of fat in products |
The TDS test was performed on the eight taste and aroma attributes. Panelists were instructed to take one spoonful of yogurt and successively select the attributes from the list that triggered his/her attention the most, from product introduction into the mouth (time t=0 when the first attribute was selected) until no sensation was any longer perceived. “I swallowed” and “stop” buttons allowed panelists to indicate the first swallow and the end of evaluation, respectively. Only one attribute could be selected at each time, but panelists were free to select an attribute several times. Attribute order within the list was randomized across panelists, but one panelist always had the same order. For descriptive analyses and the TDS test, yogurts were presented in a sequential monadic way, and a warm-up product was first tested to remind panelists of the test procedure. Three replicates were performed per product and panelist.
Yogurt samples were placed in isothermal plastic cups (40 g/cup) labeled with randomly selected three-digit numbers, covered with a lid and stored at 4 °C until evaluation. Sensory analyses were carried out in individual laboratory booths under a white light, in an air-conditioned room (19 °C). Samples were at approximately 10 °C when they were tested. The presentation order of samples was randomized across panelists to make sure that the run order did not introduce a bias in the results. Panelists were provided with mineral water (Evian, Danone, France) for rinsing and crackers for palate cleaning. The data were directly collected and recorded with FIZZ software (Biosystèmes).
3.4. Data Analysis
Data analysis was performed using XLSTAT (Addinsoft, Paris, France, 2009) and Fizz Data Treatment (Biosystèmes).
3.4.1. Aroma Release Parameters
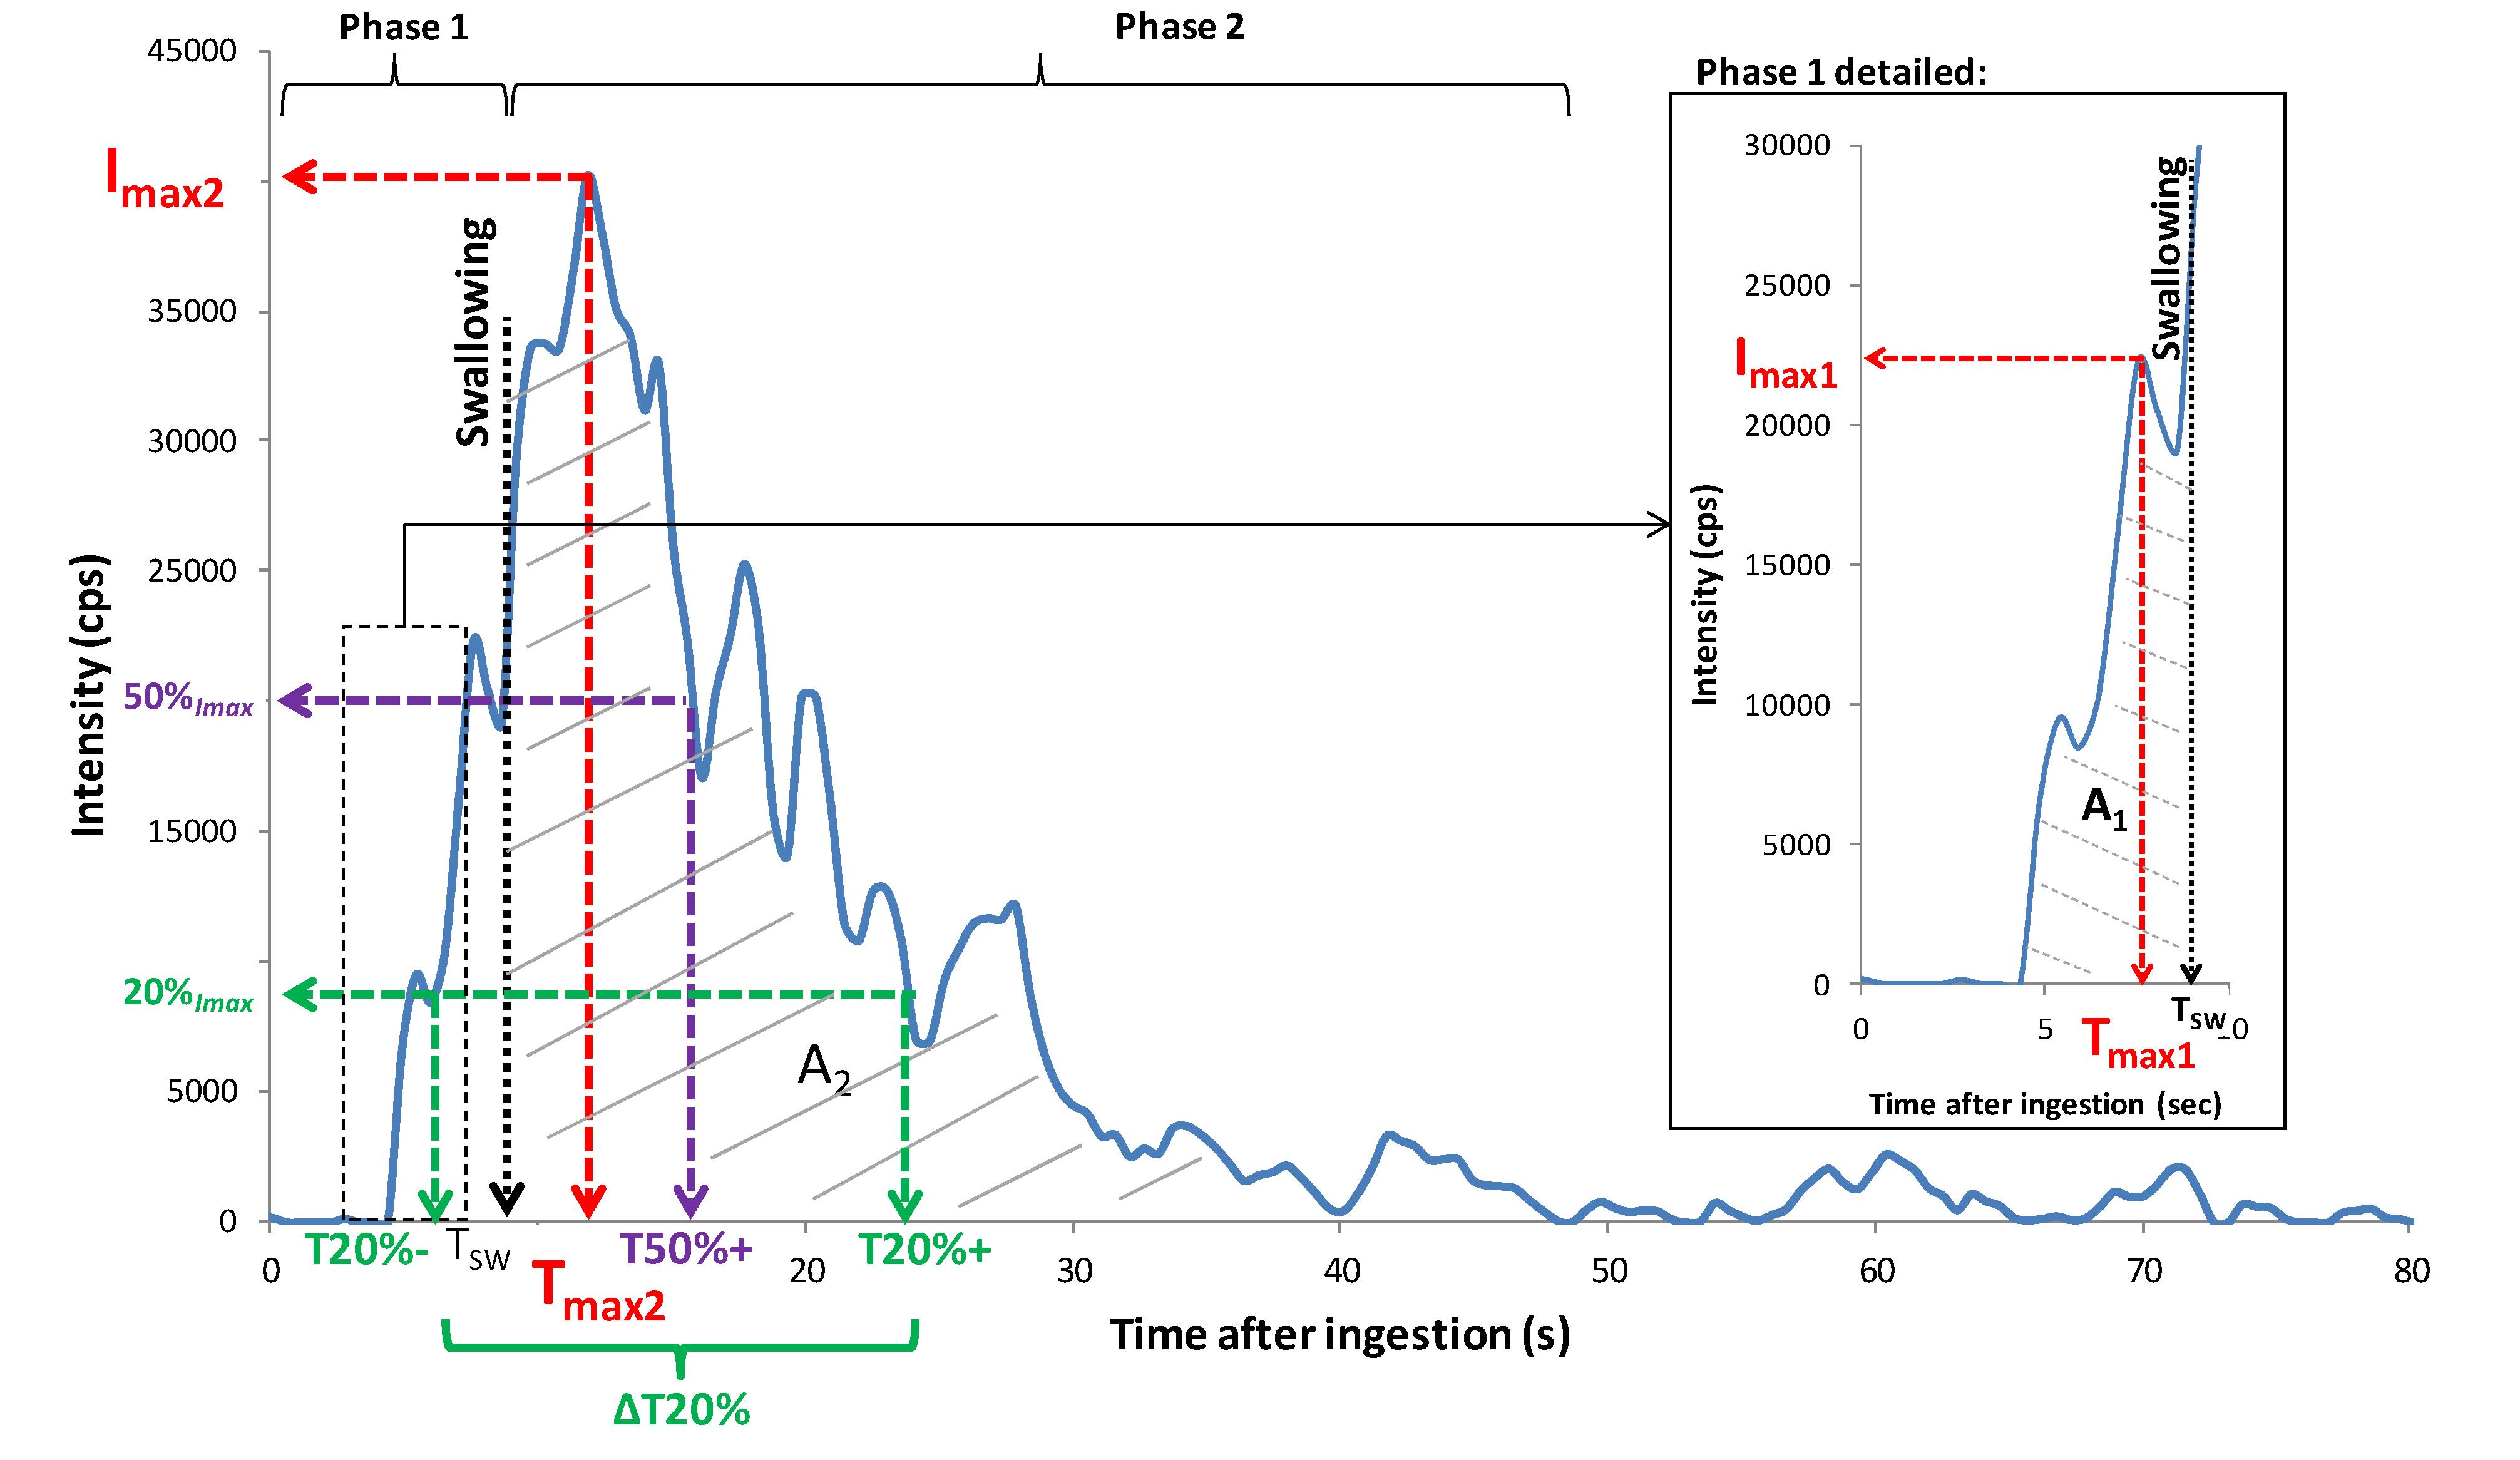
For data handling, release curves were divided into three main periods (
Figure 7): the phase before the product was put in the mouth (
0), the oral phase of consumption before swallowing (
1), and the phase after swallowing (
2). For each sample, the mean PTR-MS signal measured during phase 0 was subtracted from the PTR-MS signals obtained during the product consumption phases. The following release variables were extracted from each individual release curve and for each phase of product consumption using a software program developed by the laboratory: maximum intensities reached during phases (
1) and (
2) of in-nose analyses (
Imax1 and
Imax2), times necessary to reach
Imax1 and
Imax2 (T
max1 and T
max2), taking starting time (T
0) as the moment when the spoonful of yogurt was introduced into the mouth, and areas under the curve (A
1 and A
2). Times necessary to reach 20% of
Imax before and after T
max (T20%- and T20%+) and times necessary to reach 50% of I
max after T
max (T50%+) were also recorded. They represent the in-mouth release rate and release persistence, respectively. Parameter △T20% was calculated as the time difference between T20%− and T20%+ and represents the peak width. The time that elapsed between yogurt introduction into the mouth and swallowing (T
SW) was also recorded. All these parameters were subjected to a two-way analysis of variance (ANOVA) with interactions (product, panelist) to determine significant differences between the products and the panelists.
Figure 7.
Illustration of parameters extracted for data analysis from an in vivo aroma release, obtained for P_Standard yogurt eaten by panelist number 3 (first repetition) and ion m/z 61by PTR-MS measurement. Phases 1 and 2 refer to periods before and after swallowing.
Figure 7.
Illustration of parameters extracted for data analysis from an in vivo aroma release, obtained for P_Standard yogurt eaten by panelist number 3 (first repetition) and ion m/z 61by PTR-MS measurement. Phases 1 and 2 refer to periods before and after swallowing.
3.4.2. Sensory Analysis
Panel performances were monitored by evaluating the repeatability, discrimination power and homogeneity of panelists and of the panel. For TDS data, the repeatability index represents panelist consistency in their evaluation of a product. It corresponds to the percentage of common sensation sequences measured between the three replicates of each product (R1, R2 and R3) for each subject. First, for each subject and for each yogurt, the percentage of common sequences between each combination was calculated (R1/R2, R1/R3 and R2/R3) according to the formula below. The sequences were constructed by 250 ms-time periods. To calculate the percentage of common sequence between two sequences, they were compared chronologically by 250 ms-time period. Three percentages were obtained by combination Yogurt × Subject:
Then, the average of these three percentages by combination Yogurt ° Subject was calculated. Three percentages were obtained for each subject (one per yogurt). Finally, the average percentage got for the panel was calculated.
3.4.3. Profile Data Analysis
Student t-tests and two-way analyses of variance with interaction (ANOVA) using product and panelist as factors were performed for each attribute to determine if products could be discriminated by the trained panel. When differences were observed (p < 0.05), mean scores were compared using the Newman-Keuls multiple comparison test.
3.4.4. TDS Curves
TDS curves for each product were constructed with the panel dominance rate (%) calculated per product for each attribute and at each point in time, as described by Pineau
et al. [
10]. The end of the curve represents the time at which perception ends (T
end). In order to compare products, TDS curves were also determined using a standardized time scale, from 0% (beginning of consumption) to 100% (end of perception), as described in the literature [
45].
