
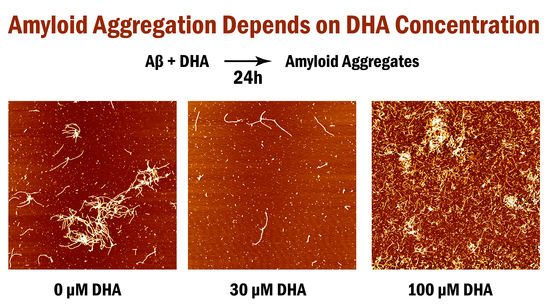
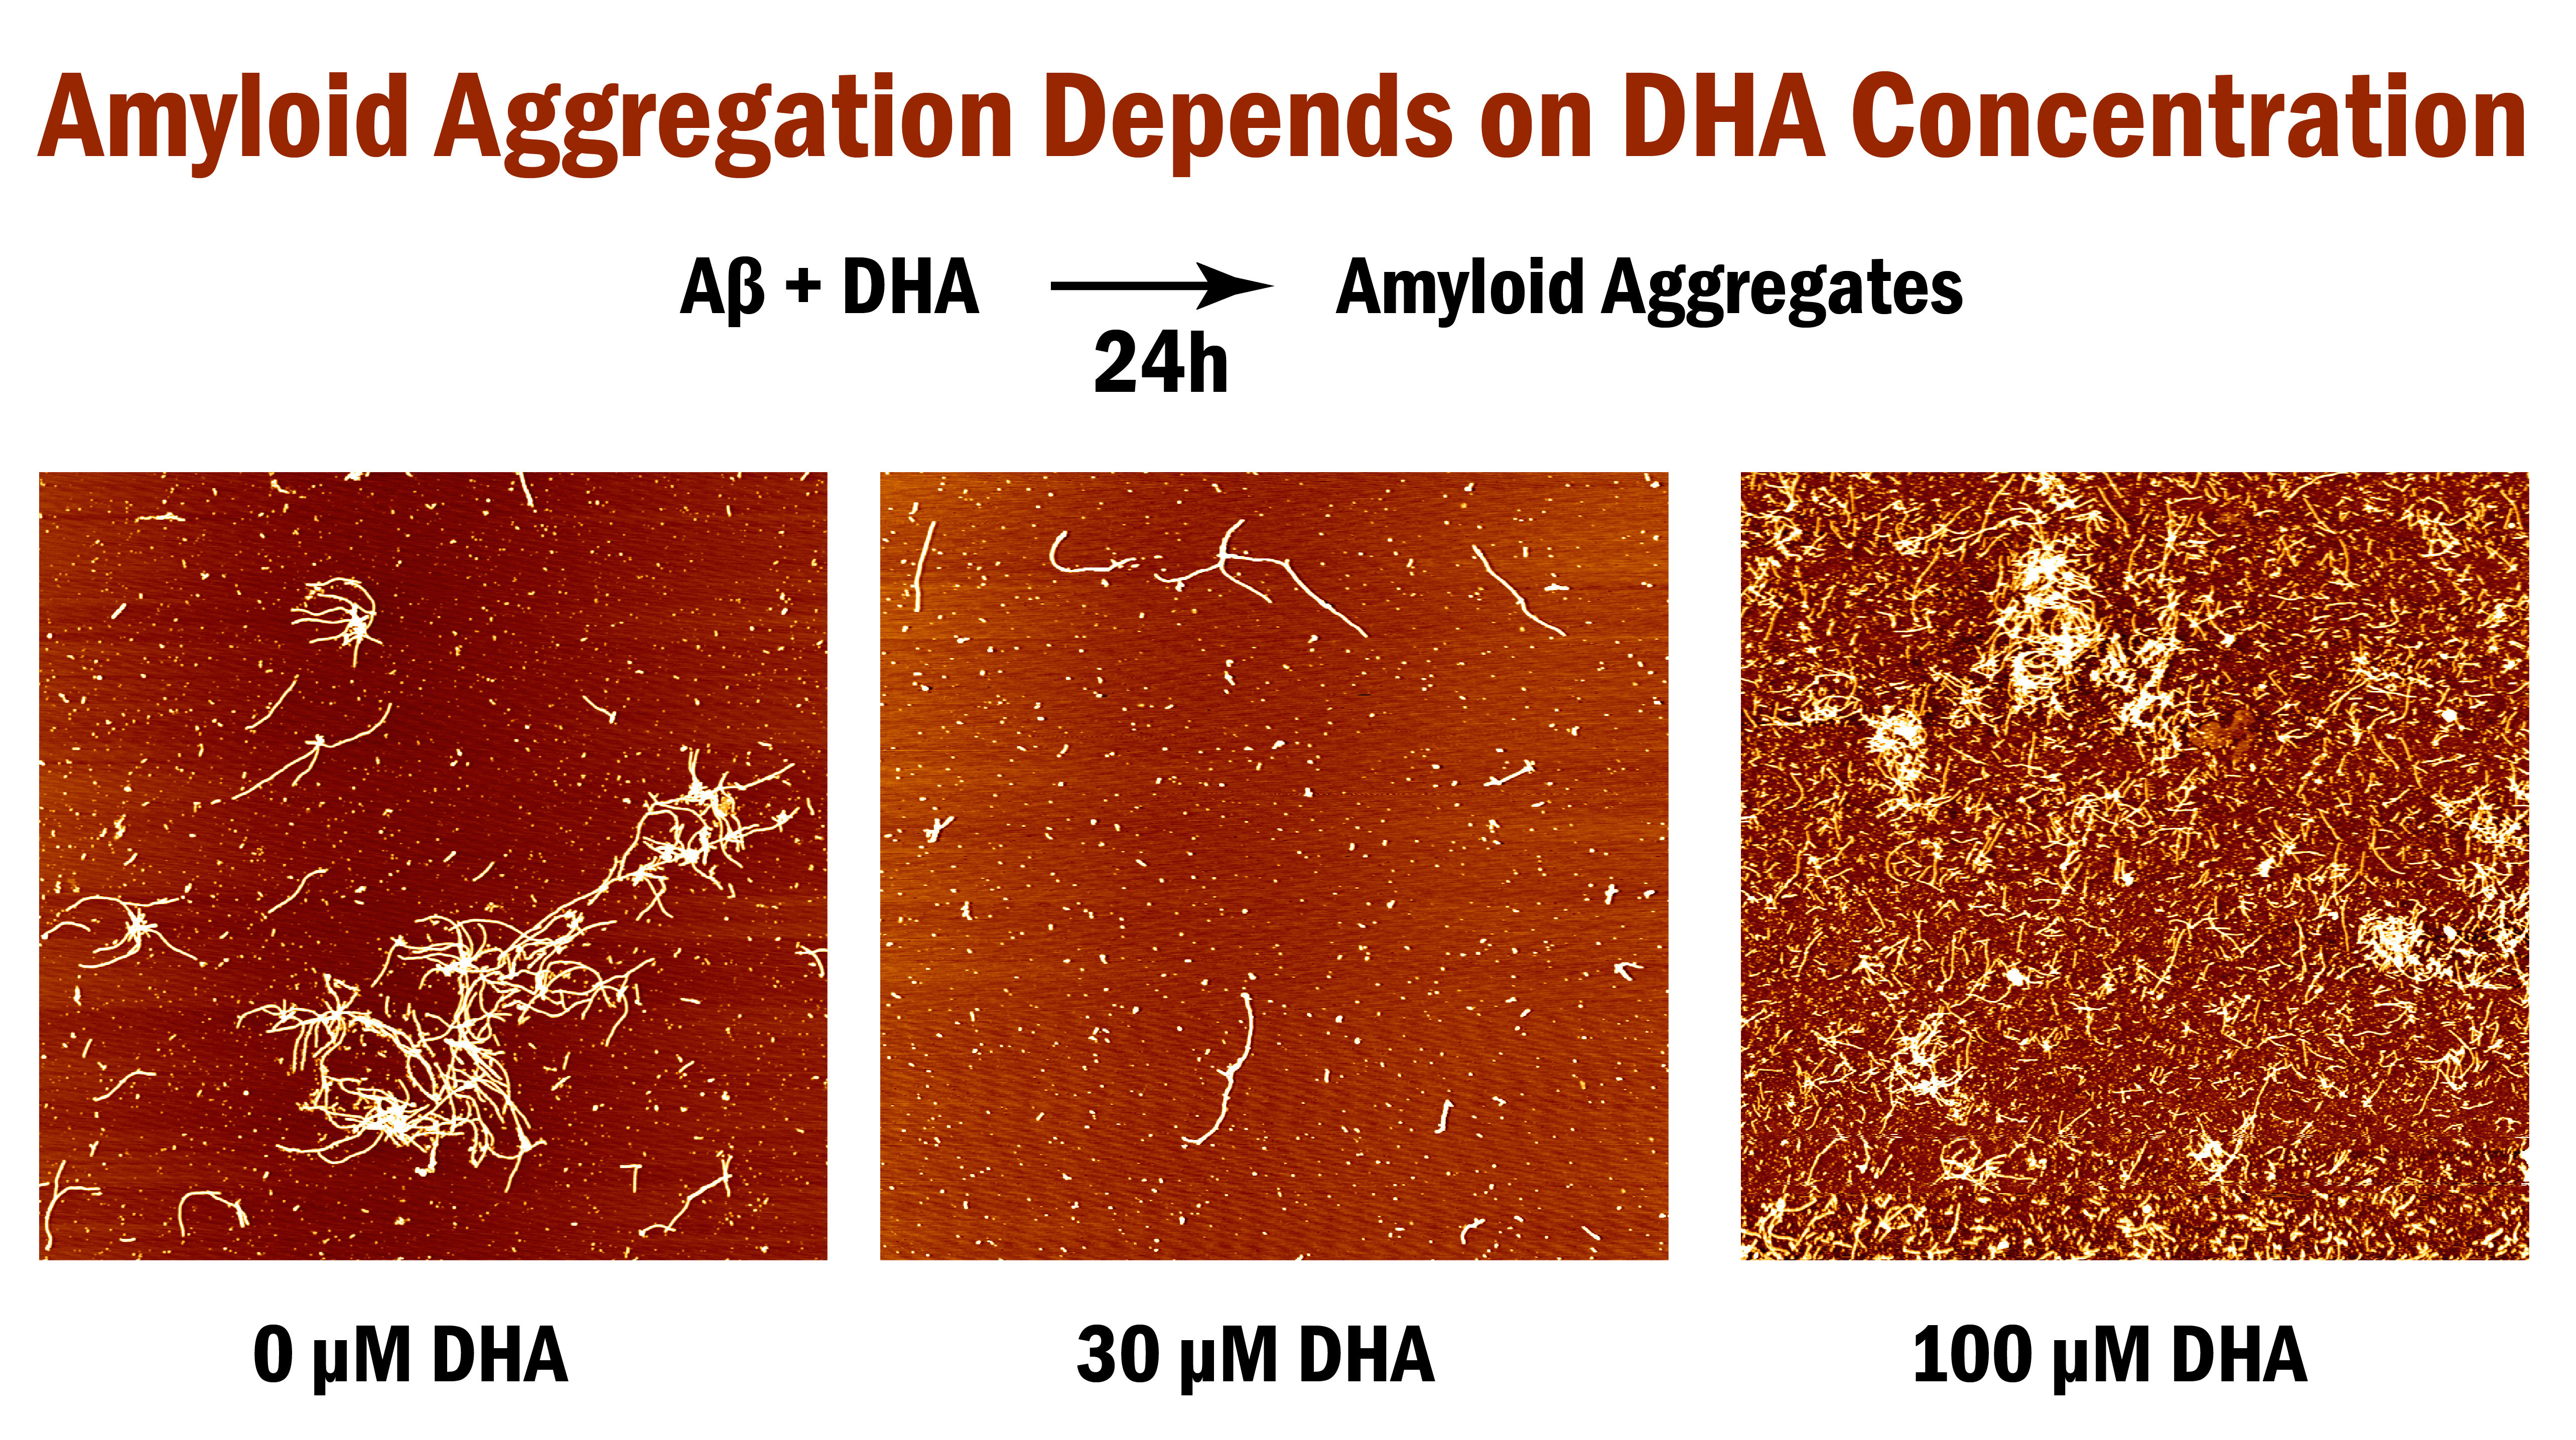
Effect of Varying Concentrations of Docosahexaenoic Acid on Amyloid Beta (1–42) Aggregation: An Atomic Force Microscopy Study


Abstract
:
1. Introduction
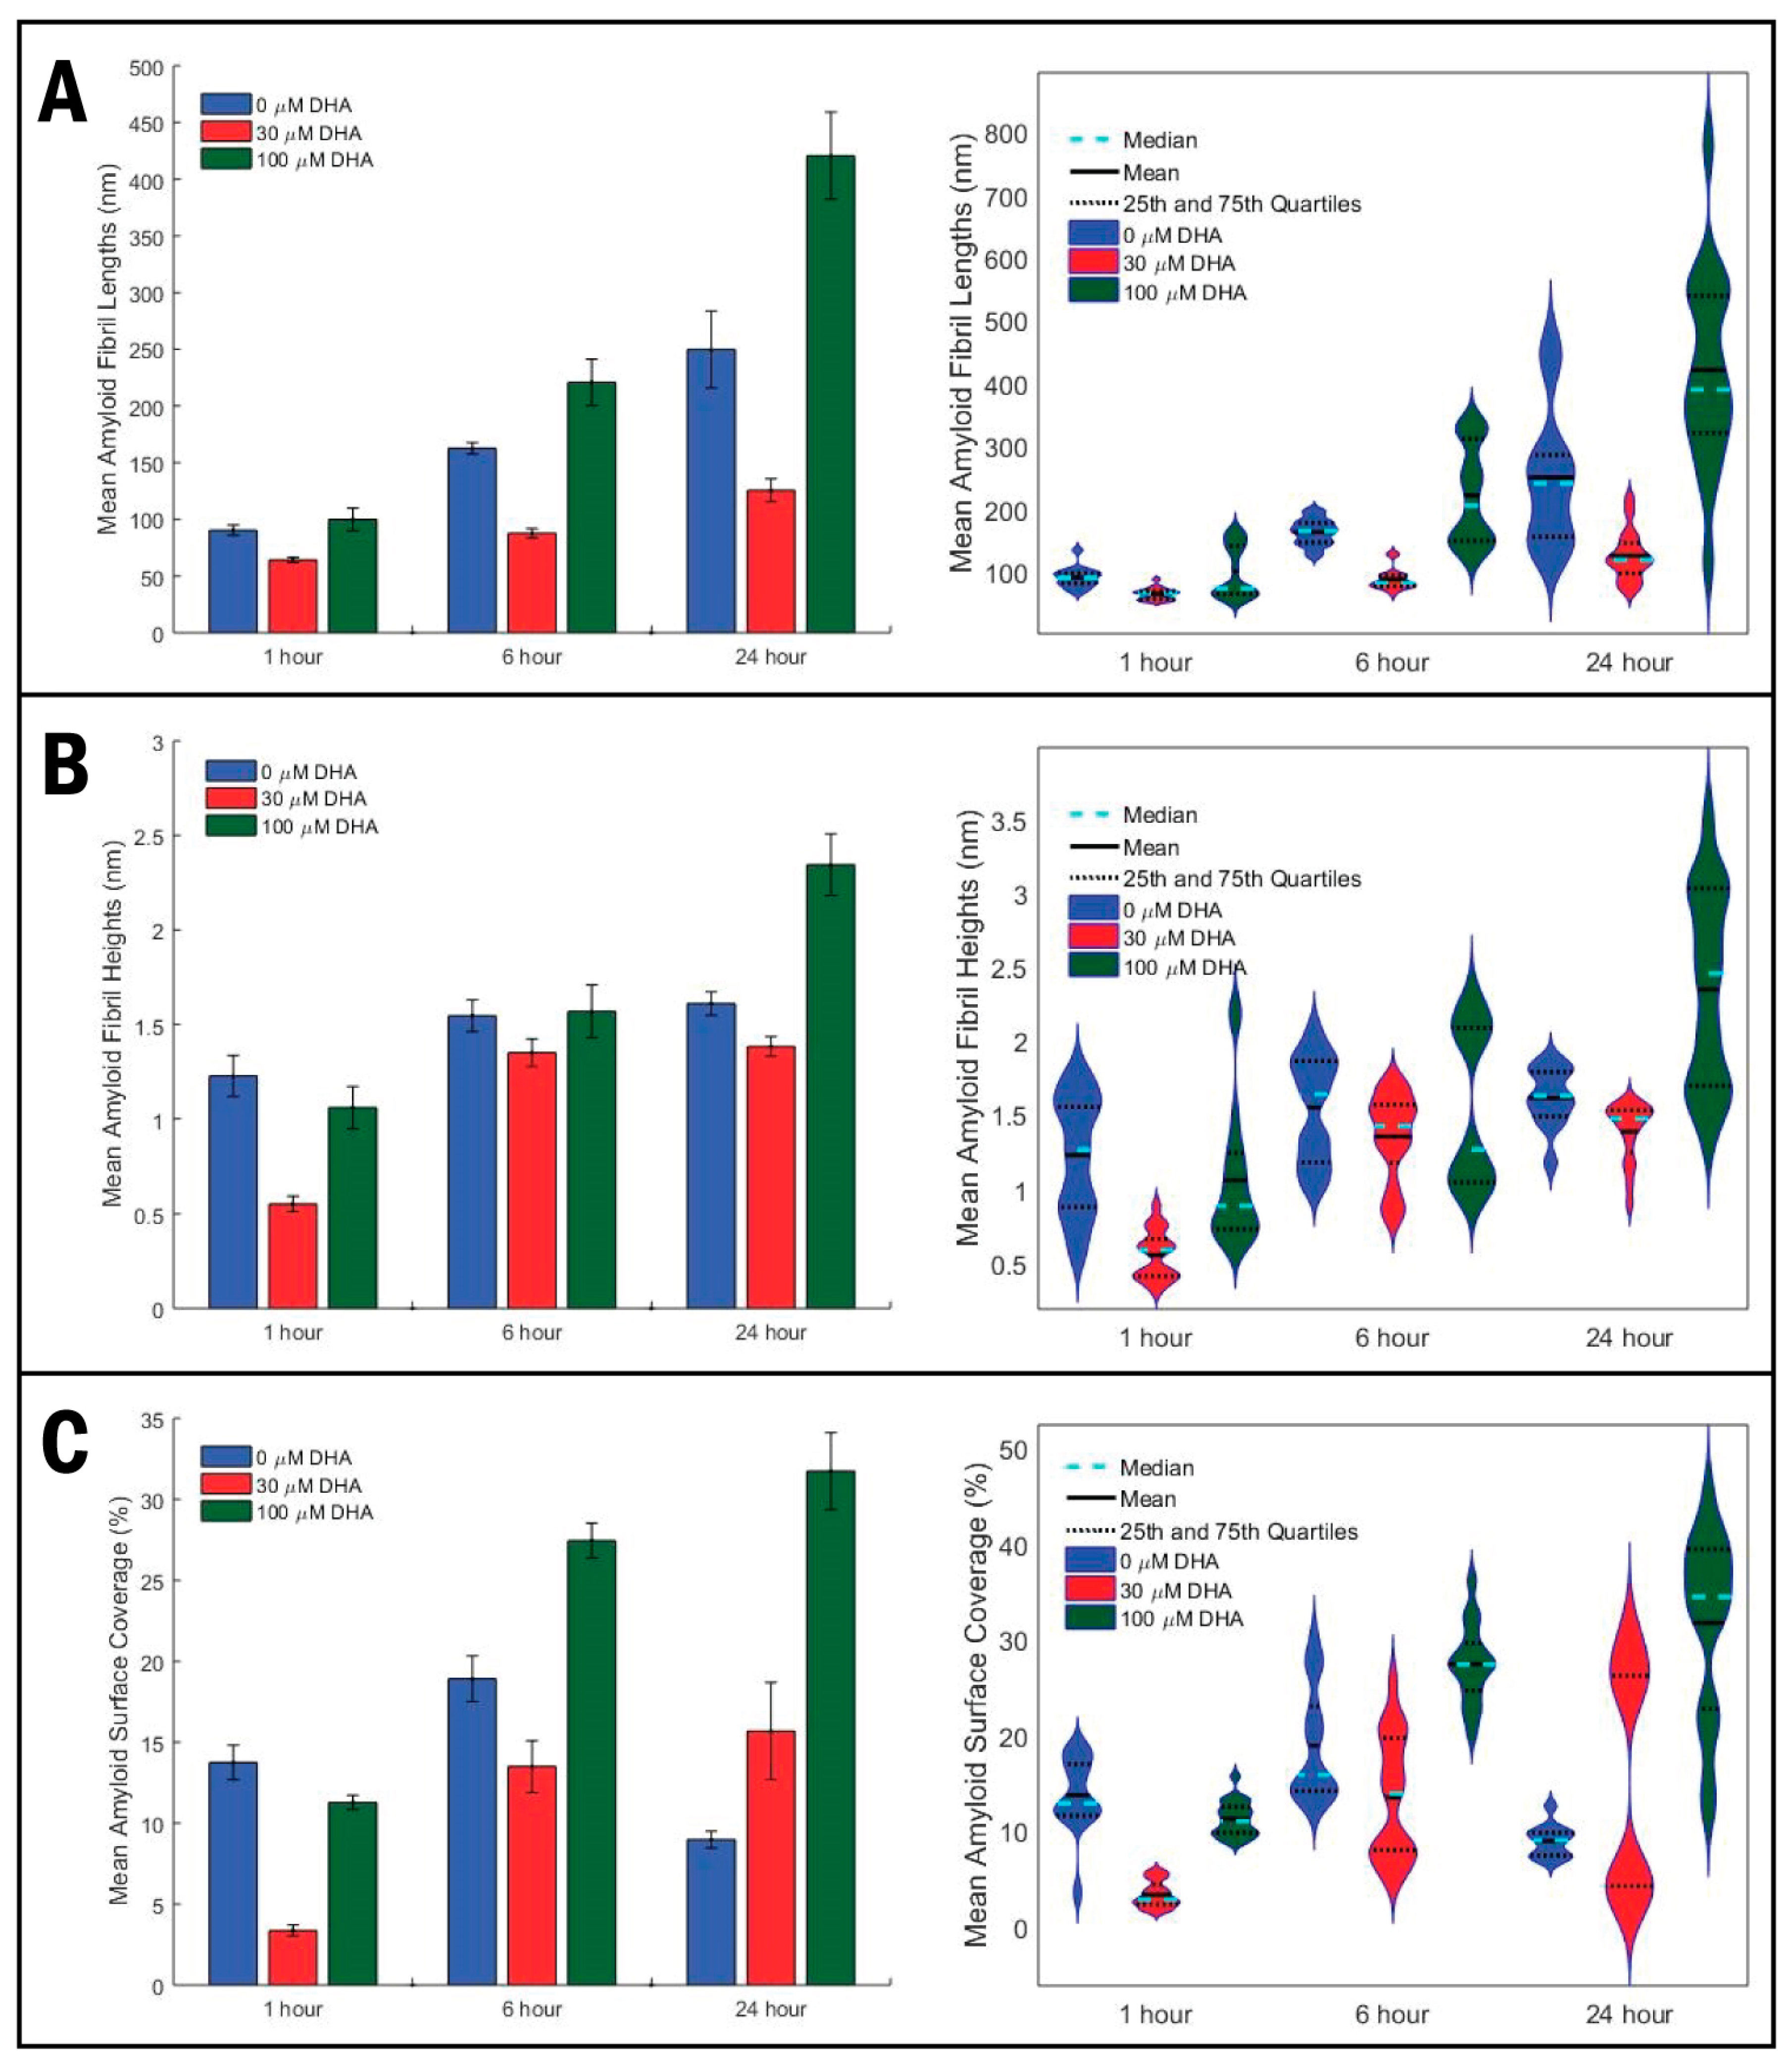
2. Results
3. Discussion
4. Materials and Methods
4.1. DHA and Aβ1–42 Incubation & Sample Preparation
4.2. Atomic Force Microscopy Imaging
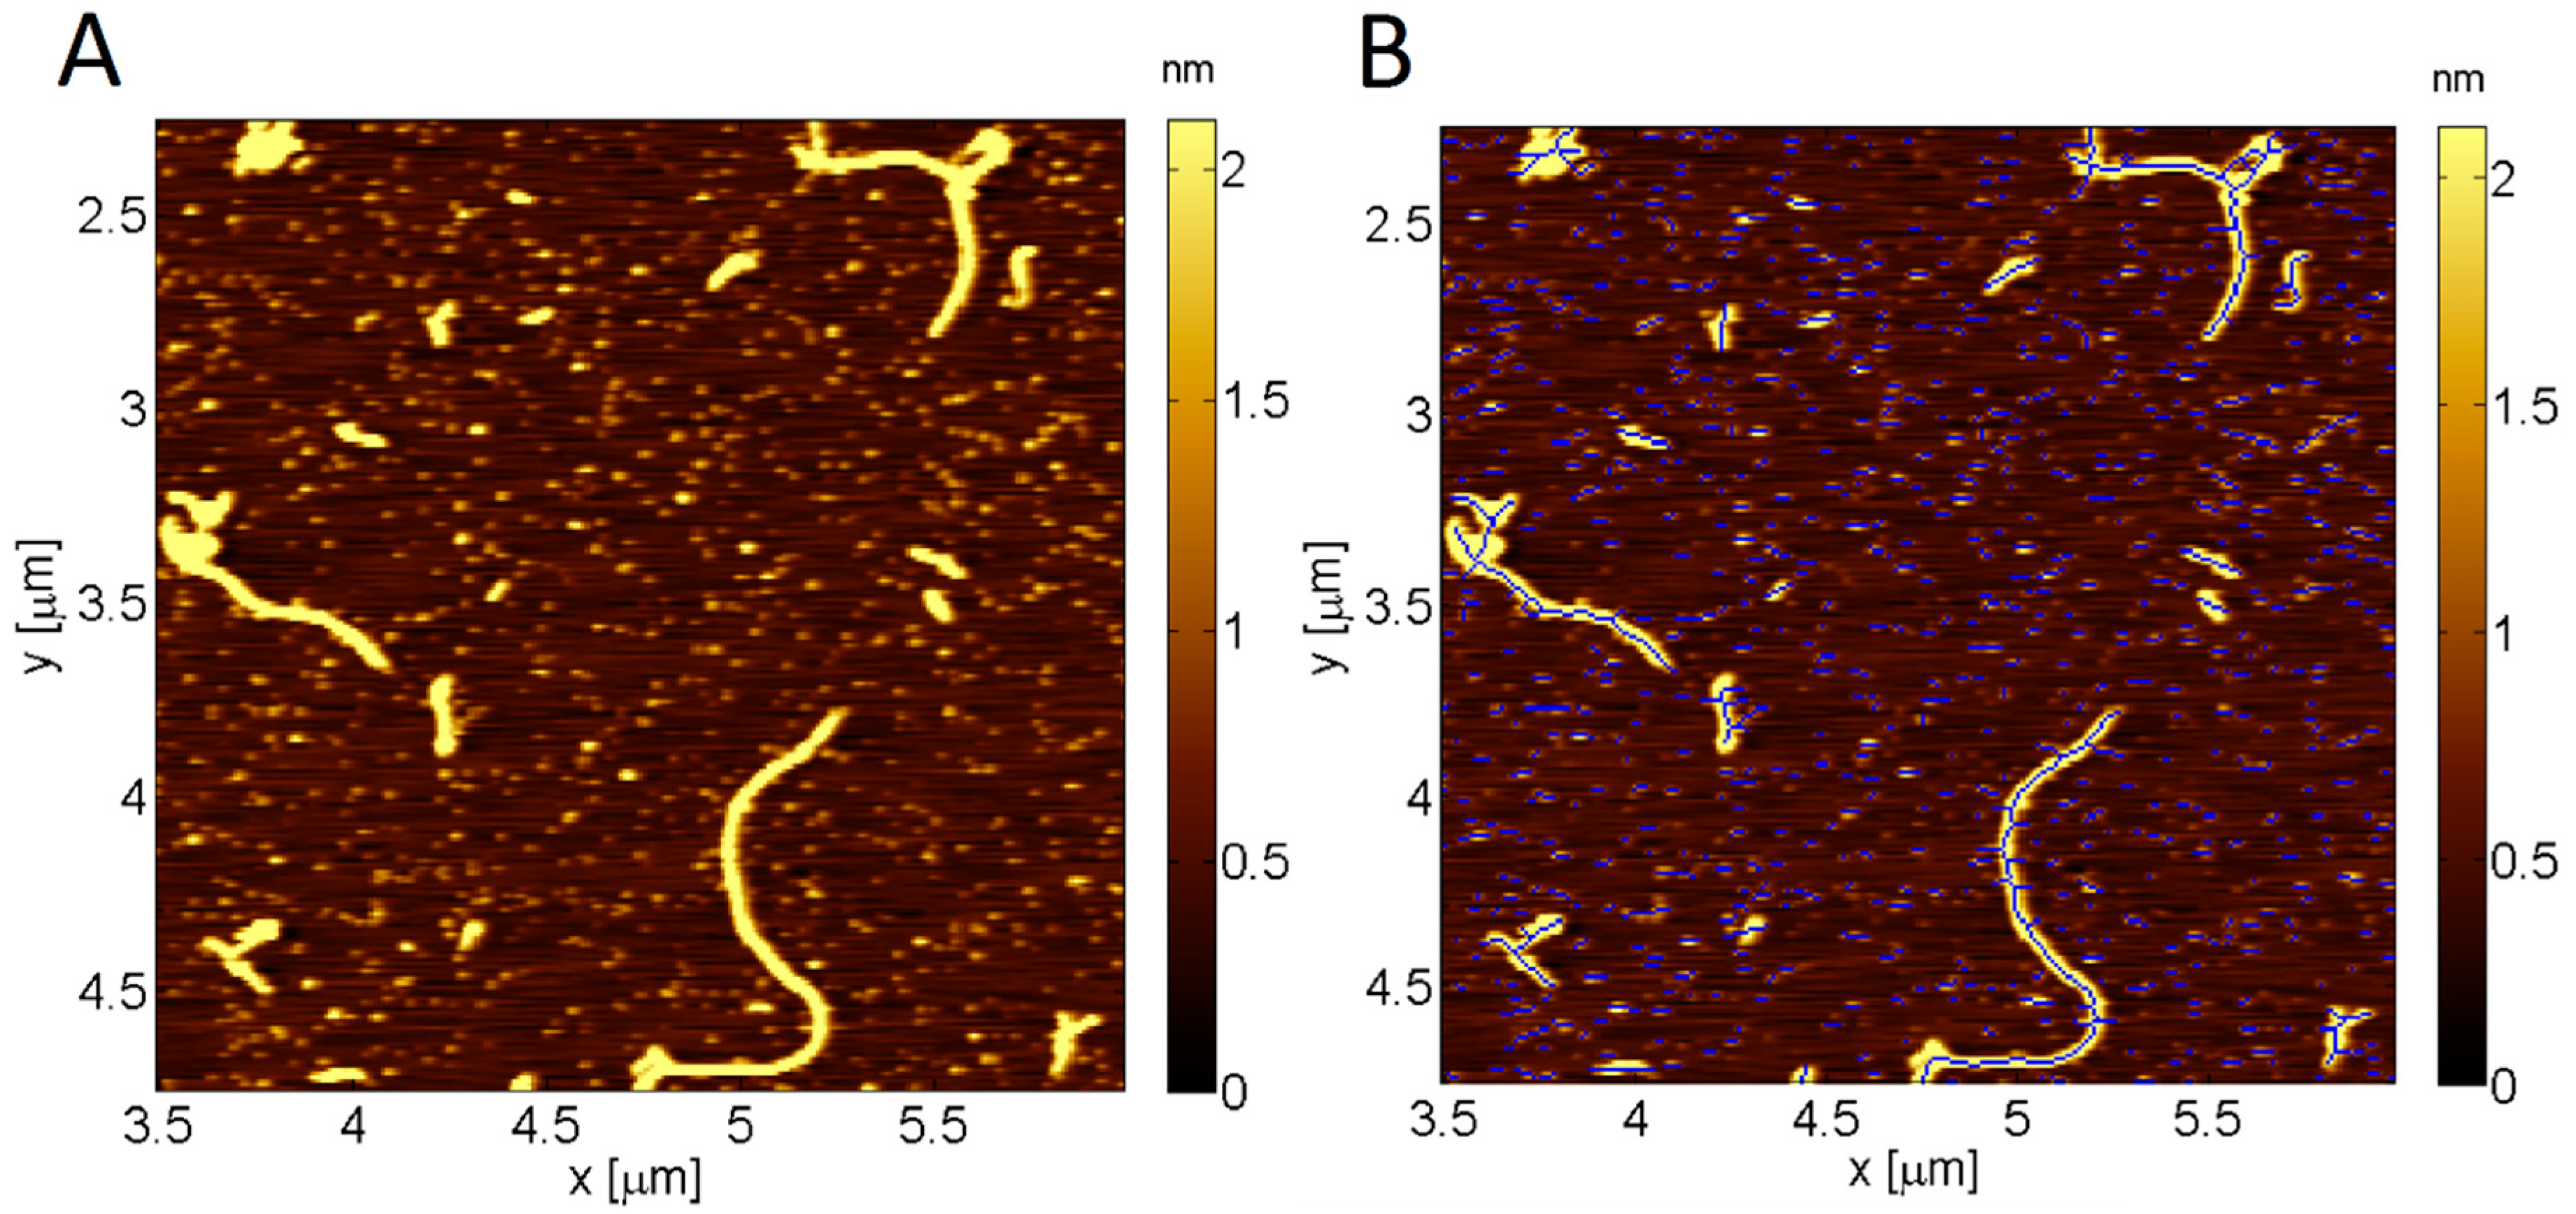
4.3. Image Analysis
4.4. Statistical Analysis
Author Contributions
Funding
Acknowledgments
Conflicts of Interest
References
- Fodero-Tavoletti, M.T.; Villemagne, V.L.; Rowe, C.C.; Masters, C.L.; Barnham, K.J.; Cappai, R. Amyloid-beta: The seeds of darkness. Int. J. Biochem. Cell. Biol. 2011, 43, 1247–1251. [Google Scholar] [CrossRef] [PubMed]
- Francis, P.T.; Palmer, A.M.; Snape, M.; Wilcock, G.K. The cholinergic hypothesis of Alzheimer’s disease: A review of progress. J. Neurol. Neurosurg. Psychiatry 1999, 66, 137–147. [Google Scholar] [CrossRef] [PubMed]
- Rauk, A. The chemistry of alzheimer’s disease. Chem. Soc. Rev. 2009, 38, 2698–2715. [Google Scholar] [CrossRef] [PubMed]
- Hu, N.; Yu, J.T.; Tan, L.; Wang, Y.L.; Sun, L.; Tan, L. Nutrition and the risk of alzheimer’s disease. Biomed. Res. Int. 2013, 2013. [Google Scholar] [CrossRef] [PubMed]
- Amtul, Z.; Uhrig, M.; Rozmahel, R.F.; Beyreuther, K. Structural insight into the differential effects of omega-3 and omega-6 fatty acids on the production of abeta peptides and amyloid plaques. J. Biol. Chem. 2011, 286, 6100–6107. [Google Scholar] [CrossRef] [PubMed]
- Drolle, E.; Hane, F.; Lee, B.; Leonenko, Z. Atomic force microscopy to study molecular mechanisms of amyloid fibril formation and toxicity in alzheimer’s disease. Drug Metab. Rev. 2014, 46, 207–223. [Google Scholar] [CrossRef] [PubMed]
- Saido, T.C. Metabolism of amyloid beta peptide and pathogenesis of alzheimer’s disease. Proc. Jpn. Acad. Ser. B Phys. Biol. Sci. 2013, 89, 321–339. [Google Scholar] [CrossRef] [PubMed]
- Shirwany, N.A.; Payette, D.; Xie, J.; Guo, Q. The amyloid beta ion channel hypothesis of alzheimer’s disease. Neuropsychiatr. Dis. Treat. 2007, 3, 597–612. [Google Scholar] [PubMed]
- Walsh, D.M.; Klyubin, I.; Fadeeva, J.V.; Rowan, M.J.; Selkoe, D.J. Amyloid-beta oligomers: Their production, toxicity and therapeutic inhibition. Biochem. Soc. Trans. 2002, 30, 552–557. [Google Scholar] [CrossRef] [PubMed]
- Fandrich, M.; Schmidt, M.; Grigorieff, N. Recent progress in understanding alzheimer’s beta-amyloid structures. Trends Biochem. Sci. 2011, 36, 338–345. [Google Scholar] [CrossRef] [PubMed]
- Luhrs, T.; Ritter, C.; Adrian, M.; Riek-Loher, D.; Bohrmann, B.; Dobeli, H.; Schubert, D.; Riek, R. 3D structure of alzheimer’s amyloid-beta(1-42) fibrils. Proc. Natl. Acad. Sci. USA 2005, 102, 17342–17347. [Google Scholar] [CrossRef] [PubMed]
- Mastrangelo, I.A.; Ahmed, M.; Sato, T.; Liu, W.; Wang, C.; Hough, P.; Smith, S.O. High-resolution atomic force microscopy of soluble abeta42 oligomers. J. Mol. Biol. 2006, 358, 106–119. [Google Scholar] [CrossRef] [PubMed]
- McLaurin, J.; Yang, D.; Yip, C.M.; Fraser, P.E. Review: Modulating factors in amyloid-beta fibril formation. J. Struct. Biol. 2000, 130, 259–270. [Google Scholar] [CrossRef] [PubMed]
- Dahlgren, K.N.; Manelli, A.M.; Stine, W.B., Jr.; Baker, L.K.; Krafft, G.A.; LaDu, M.J. Oligomeric and fibrillar species of amyloid-beta peptides differentially affect neuronal viability. J. Biol. Chem. 2002, 277, 32046–32053. [Google Scholar] [CrossRef] [PubMed]
- Selkoe, D.J. Translating cell biology into therapeutic advances in Alzheimer’s disease. Nature 1999, 399, A23–A31. [Google Scholar] [CrossRef] [PubMed]
- Rauk, A. Why is the amyloid beta peptide of alzheimer’s disease neurotoxic? Dalton Trans. 2008, 1273–1282. [Google Scholar] [CrossRef] [PubMed]
- Roher, A.E.; Chaney, M.O.; Kuo, Y.M.; Webster, S.D.; Stine, W.B.; Haverkamp, L.J.; Woods, A.S.; Cotter, R.J.; Tuohy, J.M.; Krafft, G.A.; et al. Morphology and toxicity of abeta-(1-42) dimer derived from neuritic and vascular amyloid deposits of alzheimer’s disease. J. Biol. Chem. 1996, 271, 20631–20635. [Google Scholar] [CrossRef] [PubMed]
- Serpell, L.C. Alzheimer’s amyloid fibrils: Structure and assembly. Biochim. Biophys. Acta 2000, 1502, 16–30. [Google Scholar] [CrossRef]
- Hane, F.T.; Lee, B.Y.; Leonenko, Z. Recent progress in Alzheimer’s disease research, part 1: Pathology. J. Alzheimers Dis. 2017, 57, 1–28. [Google Scholar] [CrossRef] [PubMed]
- Carballo-Pacheco, M.; Ismail, A.E.; Strodel, B. Oligomer formation of toxic and functional amyloid peptides studied with atomistic simulations. J. Phys. Chem. B 2015, 119, 9696–9705. [Google Scholar] [CrossRef] [PubMed]
- Lotz, G.P.; Legleiter, J. The role of amyloidogenic protein oligomerization in neurodegenerative disease. J. Mol. Med. 2013, 91, 653–664. [Google Scholar] [CrossRef] [PubMed]
- Viola, K.L.; Klein, W.L. Amyloid beta oligomers in Alzheimer’s disease pathogenesis, treatment, and diagnosis. Acta Neuropathol. 2015, 129, 183–206. [Google Scholar] [CrossRef] [PubMed]
- Hane, F.T.; Robinson, M.; Lee, B.Y.; Bai, O.; Leonenko, Z.; Albert, M.S. Recent progress in Alzheimer’s disease research, part 3: Diagnosis and treatment. J. Alzheimers Dis. 2017, 57, 645–665. [Google Scholar] [CrossRef] [PubMed]
- Horrocks, L.A.; Yeo, Y.K. Health benefits of docosahexaenoic acid (dha). Pharmacol. Res. 1999, 40, 211–225. [Google Scholar] [CrossRef] [PubMed]
- Pomponi, M.; Pomponi, M. Dha deficiency and Alzheimer’s disease. Clin. Nutr. 2008, 27, 170. [Google Scholar] [CrossRef] [PubMed]
- Pomponi, M.F.; Gambassi, G.; Pomponi, M.; Di Gioia, A.; Masullo, C. Why docosahexaenoic acid and aspirin supplementation could be useful in women as a primary prevention therapy against Alzheimer’s disease? Ageing Res. Rev. 2011, 10, 124–131. [Google Scholar] [CrossRef] [PubMed]
- Boudrault, C.; Bazinet, R.P.; Ma, D.W. Experimental models and mechanisms underlying the protective effects of n-3 polyunsaturated fatty acids in alzheimer’s disease. J. Nutr. Biochem. 2009, 20, 1–10. [Google Scholar] [CrossRef] [PubMed]
- Cunnane, S.C.; Plourde, M.; Pifferi, F.; Begin, M.; Feart, C.; Barberger-Gateau, P. Fish, docosahexaenoic acid and Alzheimer’s disease. Prog. Lipid Res. 2009, 48, 239–256. [Google Scholar] [CrossRef] [PubMed] [Green Version]
- Lukiw, W.J.; Bazan, N.G. Docosahexaenoic acid and the aging brain. J. Nutr. 2008, 138, 2510–2514. [Google Scholar] [CrossRef] [PubMed]
- Phillips, M.A. Omega-3 fatty acids, cognitive impairment and Alzheimer’s disease. Rev. Clin. Gerontol. 2010, 20, 219–238. [Google Scholar] [CrossRef]
- Cederholm, T.; Palmblad, J. Are omega-3 fatty acids options for prevention and treatment of cognitive decline and dementia? Curr. Opin. Clin. Nutr. Metab. Care 2010, 13, 150–155. [Google Scholar] [CrossRef] [PubMed]
- Hashimoto, M.; Shahdat, H.M.; Yamashita, S.; Katakura, M.; Tanabe, Y.; Fujiwara, H.; Gamoh, S.; Miyazawa, T.; Arai, H.; Shimada, T.; et al. Docosahexaenoic acid disrupts in vitro amyloid β1-40 fibrillation and concomitantly inhibits amyloid levels in cerebral cortex of alzheimer’s disease model rats. J. Neurochem. 2008, 107, 1634–1646. [Google Scholar] [CrossRef] [PubMed]
- Wang, P.Y.; Chen, J.J.; Su, H.M. Docosahexaenoic acid supplementation of primary rat hippocampal neurons attenuates the neurotoxicity induced by aggregated amyloid beta protein(42) and up-regulates cytoskeletal protein expression. J. Nutr. Biochem. 2010, 21, 345–350. [Google Scholar] [CrossRef] [PubMed]
- Sahlin, C.; Pettersson, F.E.; Nilsson, L.N.; Lannfelt, L.; Johansson, A.S. Docosahexaenoic acid stimulates non-amyloidogenic app processing resulting in reduced abeta levels in cellular models of Alzheimer’s disease. Eur. J. Neurosci. 2007, 26, 882–889. [Google Scholar] [CrossRef] [PubMed]
- Quinn, J.F.; Raman, R.; Thomas, R.G.; Yurko-Mauro, K.; Nelson, E.B.; Van Dyck, C.; Galvin, J.E.; Emond, J.; Jack, C.R., Jr.; Weiner, M.; et al. Docosahexaenoic acid supplementation and cognitive decline in alzheimer disease: A randomized trial. JAMA 2010, 304, 1903–1911. [Google Scholar] [CrossRef] [PubMed]
- Yehuda, S.; Rabinovitz, S.; Carasso, R.L.; Mostofsky, D.I. The role of polyunsaturated fatty acids in restoring the aging neuronal membrane. Neurobiol. Aging 2002, 23, 843–853. [Google Scholar] [CrossRef] [Green Version]
- Amtul, Z.; Keet, M.; Wang, L.; Merrifield, P.; Westaway, D.; Rozmahel, R.F. Dha supplemented in peptamen diet offers no advantage in pathways to amyloidosis: Is it time to evaluate composite lipid diet? PLoS ONE 2011, 6, e24094. [Google Scholar] [CrossRef] [PubMed]
- Pan, Y.; Khalil, H.; Nicolazzo, J.A. The impact of docosahexaenoic acid on Alzheimer’s disease: Is there a role of the blood-brain barrier? Curr. Clin. Pharmacol. 2015, 10, 222–241. [Google Scholar] [CrossRef] [PubMed]
- Barr, R.K.; Verdile, G.; Wijaya, L.K.; Morici, M.; Taddei, K.; Gupta, V.B.; Pedrini, S.; Jin, L.; Nicolazzo, J.A.; Knock, E.; et al. Validation and characterization of a novel peptide that binds monomeric and aggregated beta-amyloid and inhibits the formation of neurotoxic oligomers. J. Biol. Chem. 2016, 291, 547–559. [Google Scholar] [CrossRef] [PubMed]
- Hane, F.; Tran, G.; Attwood, S.J.; Leonenko, Z. Cu(2+) affects amyloid-beta (1-42) aggregation by increasing peptide-peptide binding forces. PLoS ONE 2013, 8, e59005. [Google Scholar] [CrossRef] [PubMed]
- Hane, F.T.; Lee, B.Y.; Petoyan, A.; Rauk, A.; Leonenko, Z. Testing synthetic amyloid-beta aggregation inhibitor using single molecule atomic force spectroscopy. Biosens. Bioelectron. 2014, 54, 492–498. [Google Scholar] [CrossRef] [PubMed]
- Moores, B.; Drolle, E.; Attwood, S.J.; Simons, J.; Leonenko, Z. Effect of surfaces on amyloid fibril formation. PLoS ONE 2011, 6, e25954. [Google Scholar] [CrossRef] [PubMed]
- Bin, Y.; Li, X.; He, Y.; Chen, S.; Xiang, J. Amyloid-beta peptide (1-42) aggregation induced by copper ions under acidic conditions. Acta Biochim. Biophys. Sin. 2013, 45, 570–577. [Google Scholar] [CrossRef] [PubMed]
- Parbhu, A.; Lin, H.; Thimm, J.; Lal, R. Imaging real-time aggregation of amyloid beta protein (1-42) by atomic force microscopy. Peptides 2002, 23, 1265–1270. [Google Scholar] [CrossRef]
- Sublimi Saponetti, M.; Grimaldi, M.; Scrima, M.; Albonetti, C.; Nori, S.L.; Cucolo, A.; Bobba, F.; D’Ursi, A.M. Aggregation of ass(25-35) on dopc and dopc/dha bilayers: An atomic force microscopy study. PLoS ONE 2014, 9, e115780. [Google Scholar] [CrossRef] [PubMed]
- Thid, D.; Benkoski, J.J.; Svedhem, S.; Kasemo, B.; Gold, J. Dha-induced changes of supported lipid membrane morphology. Langmuir 2007, 23, 5878–5881. [Google Scholar] [CrossRef] [PubMed]
- French Pharmacoeconomic Committee. Drugs for Alzheimer’s disease: Best avoided. No therapeutic advantage. Prescrire Int. 2012, 21, 150. [Google Scholar]
- Birks, J.; Harvey, R.J. Donepezil for dementia due to alzheimer’s disease. Cochrane Database Syst. Rev. 2006, 6, Cd001190. [Google Scholar] [CrossRef] [PubMed]
- Pohanka, M. Cholinesterases, a target of pharmacology and toxicology. Biomed. Pap. Med. Fac. Univ. Palacky Olomouc Czech. Repub. 2011, 155, 219–229. [Google Scholar] [CrossRef] [PubMed]
- Dolphin, G.T.; Chierici, S.; Ouberai, M.; Dumy, P.; Garcia, J. A multimeric quinacrine conjugate as a potential inhibitor of alzheimer’s beta-amyloid fibril formation. Chembiochem 2008, 9, 952–963. [Google Scholar] [CrossRef] [PubMed]
- Kawashima, H.; Sohma, Y.; Nakanishi, T.; Kitamura, H.; Mukai, H.; Yamashita, M.; Akaji, K.; Kiso, Y. A new class of aggregation inhibitor of amyloid-beta peptide based on an o-acyl isopeptide. Bioorg. Med. Chem. 2013, 21, 6323–6327. [Google Scholar] [CrossRef] [PubMed]
- Ouberai, M.; Dumy, P.; Chierici, S.; Garcia, J. Synthesis and biological evaluation of clicked curcumin and clicked klvffa conjugates as inhibitors of beta-amyloid fibril formation. Bioconjug. Chem. 2009, 20, 2123–2132. [Google Scholar] [CrossRef] [PubMed]
- Suzuki, H.; Ishigami, A.; Orimoto, A.; Matsuyama, A.; Handa, S.; Maruyama, N.; Yokoyama, Y.; Okuno, H.; Nakakoshi, M. Development of a new distyrylbenzene-derivative amyloid-beta-aggregation and fibril formation inhibitor. Chem. Pharm. Bull. 2012, 60, 1164–1170. [Google Scholar] [CrossRef] [PubMed]
- Taylor, M.; Moore, S.; Mayes, J.; Parkin, E.; Beeg, M.; Canovi, M.; Gobbi, M.; Mann, D.M.; Allsop, D. Development of a proteolytically stable retro-inverso peptide inhibitor of beta-amyloid oligomerization as a potential novel treatment for alzheimer’s disease. Biochemistry 2010, 49, 3261–3272. [Google Scholar] [CrossRef] [PubMed]
- Torok, B.; Sood, A.; Bag, S.; Kulkarni, A.; Borkin, D.; Lawler, E.; Dasgupta, S.; Landge, S.; Abid, M.; Zhou, W.; et al. Structure-activity relationships of organofluorine inhibitors of beta-amyloid self-assembly. Chem. Med. Chem. 2012, 7, 910–919. [Google Scholar] [CrossRef] [PubMed]
- Wei, C.W.; Peng, Y.; Zhang, L.; Huang, Q.; Cheng, M.; Liu, Y.N.; Li, J. Synthesis and evaluation of ferrocenoyl pentapeptide (fc-klvff) as an inhibitor of Alzheimer’s abeta(1)-(4)(2) fibril formation in vitro. Bioorg. Med. Chem. Lett. 2011, 21, 5818–5821. [Google Scholar] [CrossRef] [PubMed]
- Hashimoto, M.; Shahdat, H.M.; Katakura, M.; Tanabe, Y.; Gamoh, S.; Miwa, K.; Shimada, T.; Shido, O. Effects of docosahexaenoic acid on in vitro amyloid beta peptide 25–35 fibrillation. Biochim. Biophys. Acta Mol. Cell. Biol. Lipids 2009, 1791, 289–296. [Google Scholar] [CrossRef] [PubMed]
- Hossain, S.; Hashimoto, M.; Katakura, M.; Miwa, K.; Shimada, T.; Shido, O. Mechanism of docosahexaenoic acid-induced inhibition of in vitro aβ1–42 fibrillation and aβ1–42-induced toxicity in sh-s5y5 cells. J. Neurochem. 2009, 111, 568–579. [Google Scholar] [CrossRef] [PubMed]
- Arendash, G.W.; Jensen, M.T.; Salem Jr, N.; Hussein, N.; Cracchiolo, J.; Dickson, A.; Leighty, R.; Potter, H. A diet high in omega-3 fatty acids does not improve or protect cognitive performance in Alzheimer’s transgenic mice. Neuroscience 2007, 149, 286–302. [Google Scholar] [CrossRef] [PubMed]
- Yassine, H.N.; Braskie, M.N.; Mack, W.J.; Castor, K.J.; Fonteh, A.N.; Schneider, L.S.; Harrington, M.G.; Chui, H.C. Association of docosahexaenoic acid supplementation with Alzheimer disease stage in apolipoprotein e epsilon4 carriers: A review. JAMA Neurol. 2017, 74, 339–347. [Google Scholar] [CrossRef] [PubMed]
- Lim, G.P.; Calon, F.; Morihara, T.; Yang, F.; Teter, B.; Ubeda, O.; Salem, N., Jr.; Frautschy, S.A.; Cole, G.M. A diet enriched with the omega-3 fatty acid docosahexaenoic acid reduces amyloid burden in an aged Alzheimer mouse model. J. Neurosci. 2005, 25, 3032–3040. [Google Scholar] [CrossRef] [PubMed]
- Freund-Levi, Y.; Eriksdotter-Jönhagen, M.; Cederholm, T.; Basun, H.; Faxén-Irving, G.; Garlind, A.; Vedin, I.; Vessby, B.; Wahlund, L.-O.; Palmblad, J. ω-3 fatty acid treatment in 174 patients with mild to moderate Alzheimer disease: Omegad study: A randomized double-blind trial. Arch. Neurol. 2006, 63, 1402–1408. [Google Scholar] [CrossRef] [PubMed]
- Bate, C.; Marshall, V.; Colombo, L.; Diomede, L.; Salmona, M.; Williams, A. Docosahexaenoic and eicosapentaenoic acids increase neuronal death in response to huprp82-146 and abeta 1-42. Neuropharmacology 2008, 54, 934–943. [Google Scholar] [CrossRef] [PubMed]
- Hashimoto, M.; Hossain, S.; Katakura, M.; Al Mamun, A.; Shido, O. The binding of abeta1-42 to lipid rafts of rbc is enhanced by dietary docosahexaenoic acid in rats: Implicates to Alzheimer’s disease. Biochim. Biophys. Acta 2015, 1848, 1402–1409. [Google Scholar] [CrossRef] [PubMed]
- Lukiw, W.J.; Cui, J.G.; Marcheselli, V.L.; Bodker, M.; Botkjaer, A.; Gotlinger, K.; Serhan, C.N.; Bazan, N.G. A role for docosahexaenoic acid-derived neuroprotectin d1 in neural cell survival and Alzheimer disease. J. Clin. Invest. 2005, 115, 2774–2783. [Google Scholar] [CrossRef] [PubMed]
- Oksman, M.; Iivonen, H.; Hogyes, E.; Amtul, Z.; Penke, B.; Leenders, I.; Broersen, L.; Lutjohann, D.; Hartmann, T.; Tanila, H. Impact of different saturated fatty acid, polyunsaturated fatty acid and cholesterol containing diets on beta-amyloid accumulation in app/ps1 transgenic mice. Neurobiol. Dis. 2006, 23, 563–572. [Google Scholar] [CrossRef] [PubMed]
- Binnig, G.; Quate, C.F.; Gerber, C. Atomic force microscope. Phys. Rev. Lett. 1986, 56, 930–933. [Google Scholar] [CrossRef] [PubMed]
- Fezoui, Y.; Hartley, D.M.; Harper, J.D.; Khurana, R.; Walsh, D.M.; Condron, M.M.; Selkoe, D.J.; Lansbury, P.T.; Fink, A.L.; Teplow, D.B. An improved method of preparing the amyloid β-protein for fibrillogenesis and neurotoxicity experiments. Amyloid 2000, 7, 166–178. [Google Scholar] [CrossRef] [PubMed]
Sample Availability: Samples of the compounds are not available from the authors. |


© 2018 by the authors. Licensee MDPI, Basel, Switzerland. This article is an open access article distributed under the terms and conditions of the Creative Commons Attribution (CC BY) license (http://creativecommons.org/licenses/by/4.0/).
Share and Cite
Lee, B.Y.; Attwood, S.J.; Turnbull, S.; Leonenko, Z. Effect of Varying Concentrations of Docosahexaenoic Acid on Amyloid Beta (1–42) Aggregation: An Atomic Force Microscopy Study. Molecules 2018, 23, 3089. https://doi.org/10.3390/molecules23123089
Lee BY, Attwood SJ, Turnbull S, Leonenko Z. Effect of Varying Concentrations of Docosahexaenoic Acid on Amyloid Beta (1–42) Aggregation: An Atomic Force Microscopy Study. Molecules. 2018; 23(12):3089. https://doi.org/10.3390/molecules23123089
Chicago/Turabian StyleLee, Brenda Yasie, Simon James Attwood, Stephen Turnbull, and Zoya Leonenko. 2018. "Effect of Varying Concentrations of Docosahexaenoic Acid on Amyloid Beta (1–42) Aggregation: An Atomic Force Microscopy Study" Molecules 23, no. 12: 3089. https://doi.org/10.3390/molecules23123089