Antioxidant and Protective Mechanisms against Hypoxia and Hypoglycaemia in Cortical Neurons in Vitro


 ,
,
Abstract
:
1. Introduction
2. Results
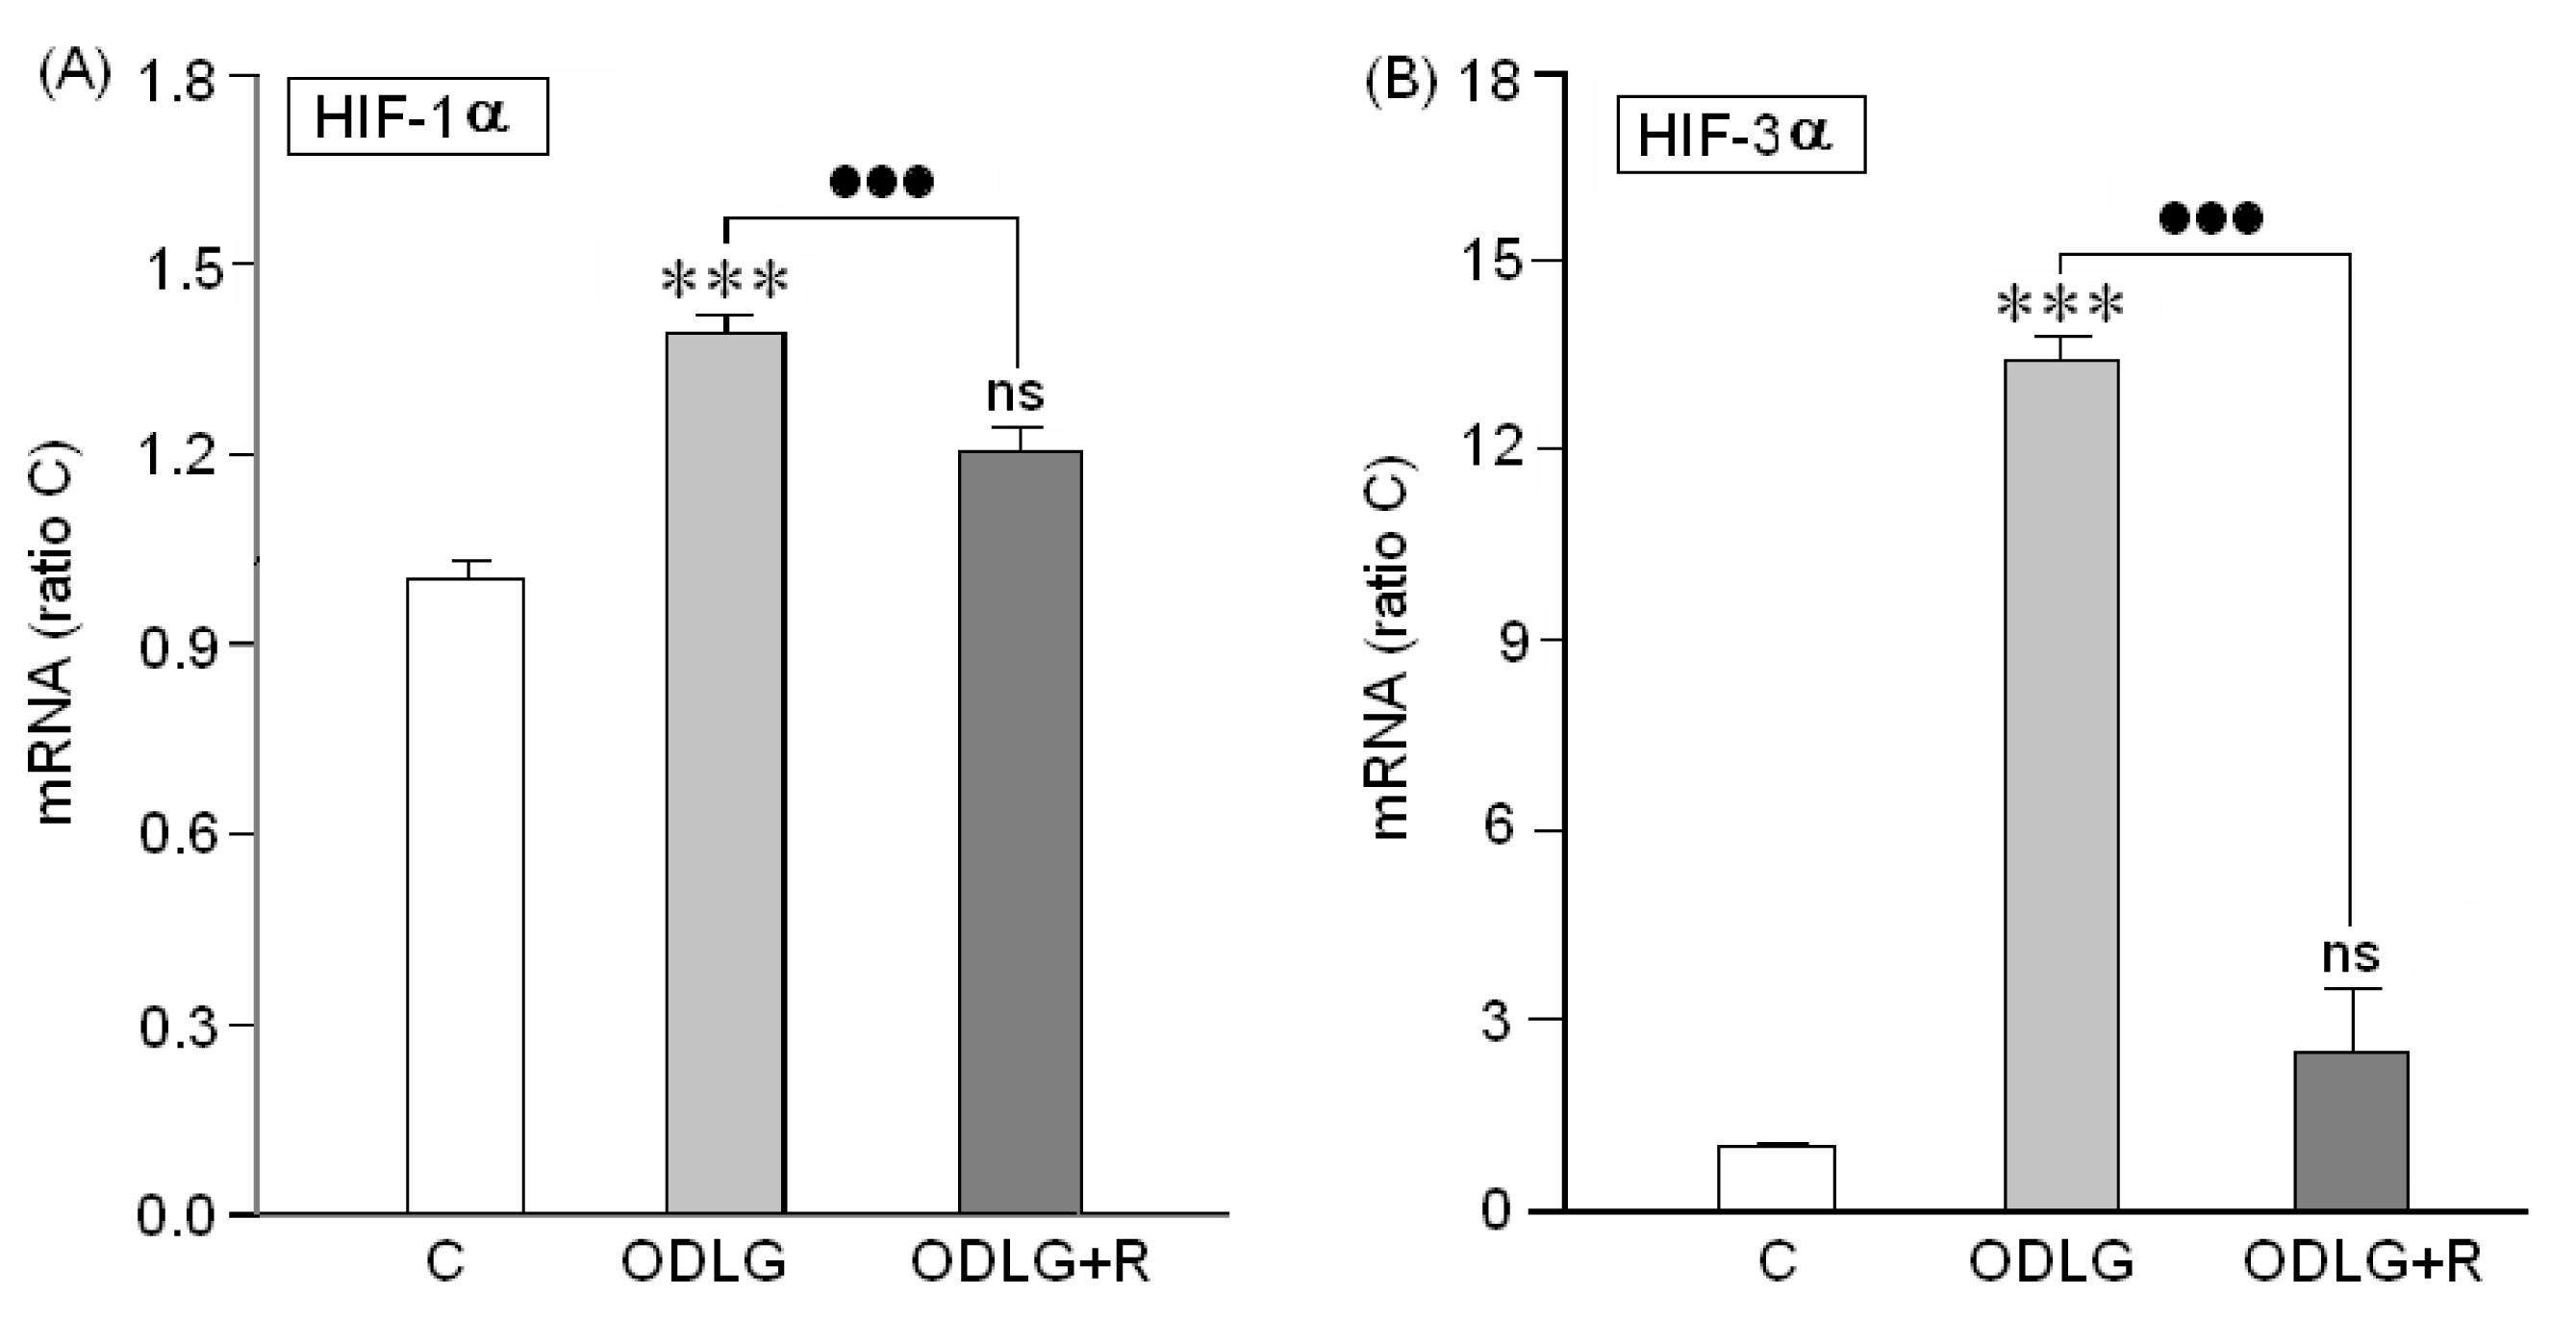
2.1. Presence of “HIF” Factor during Hypoxia
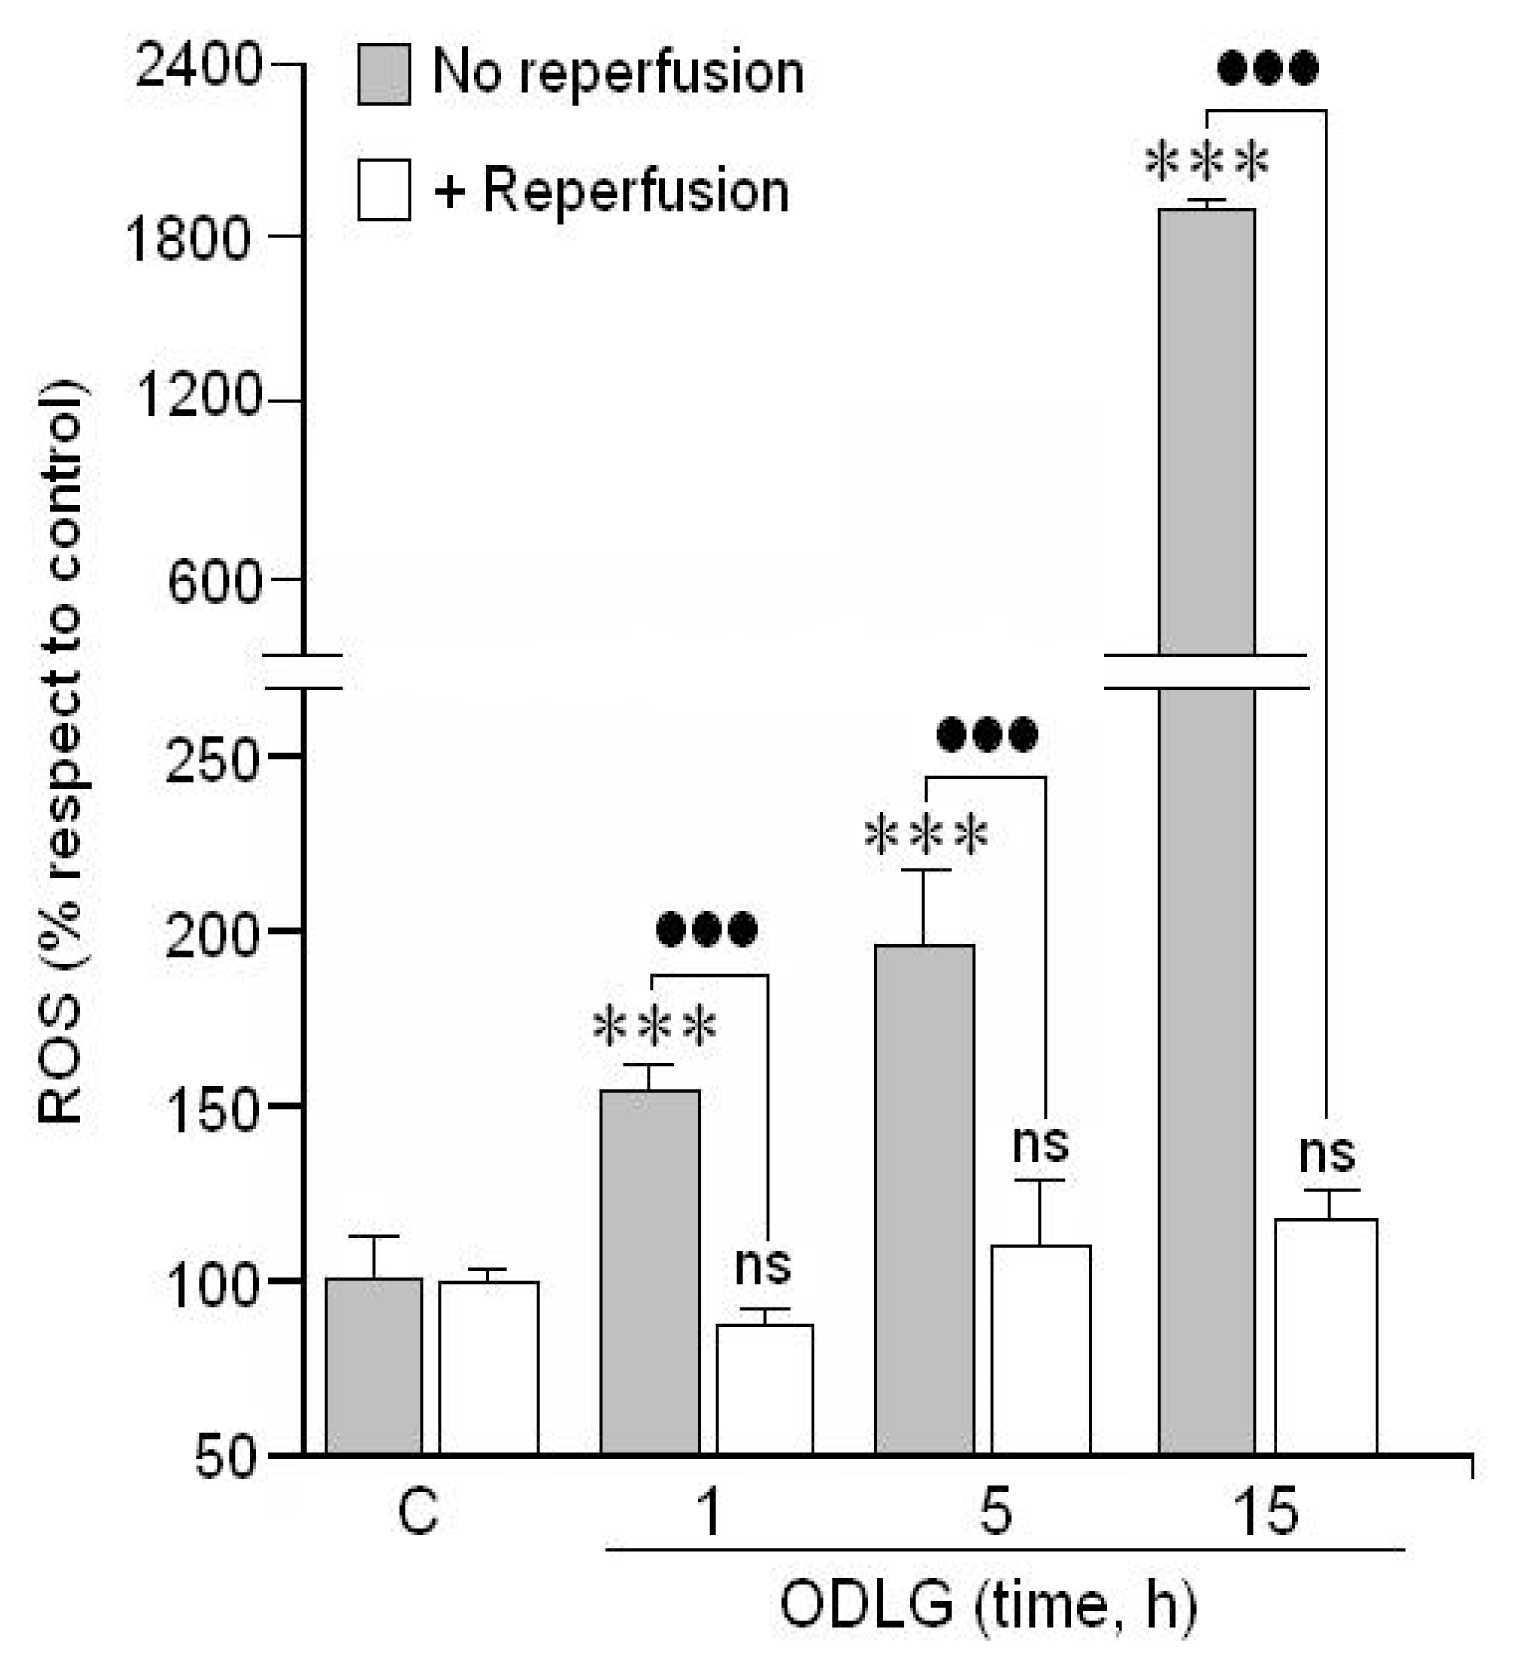
2.2. ROS Formation
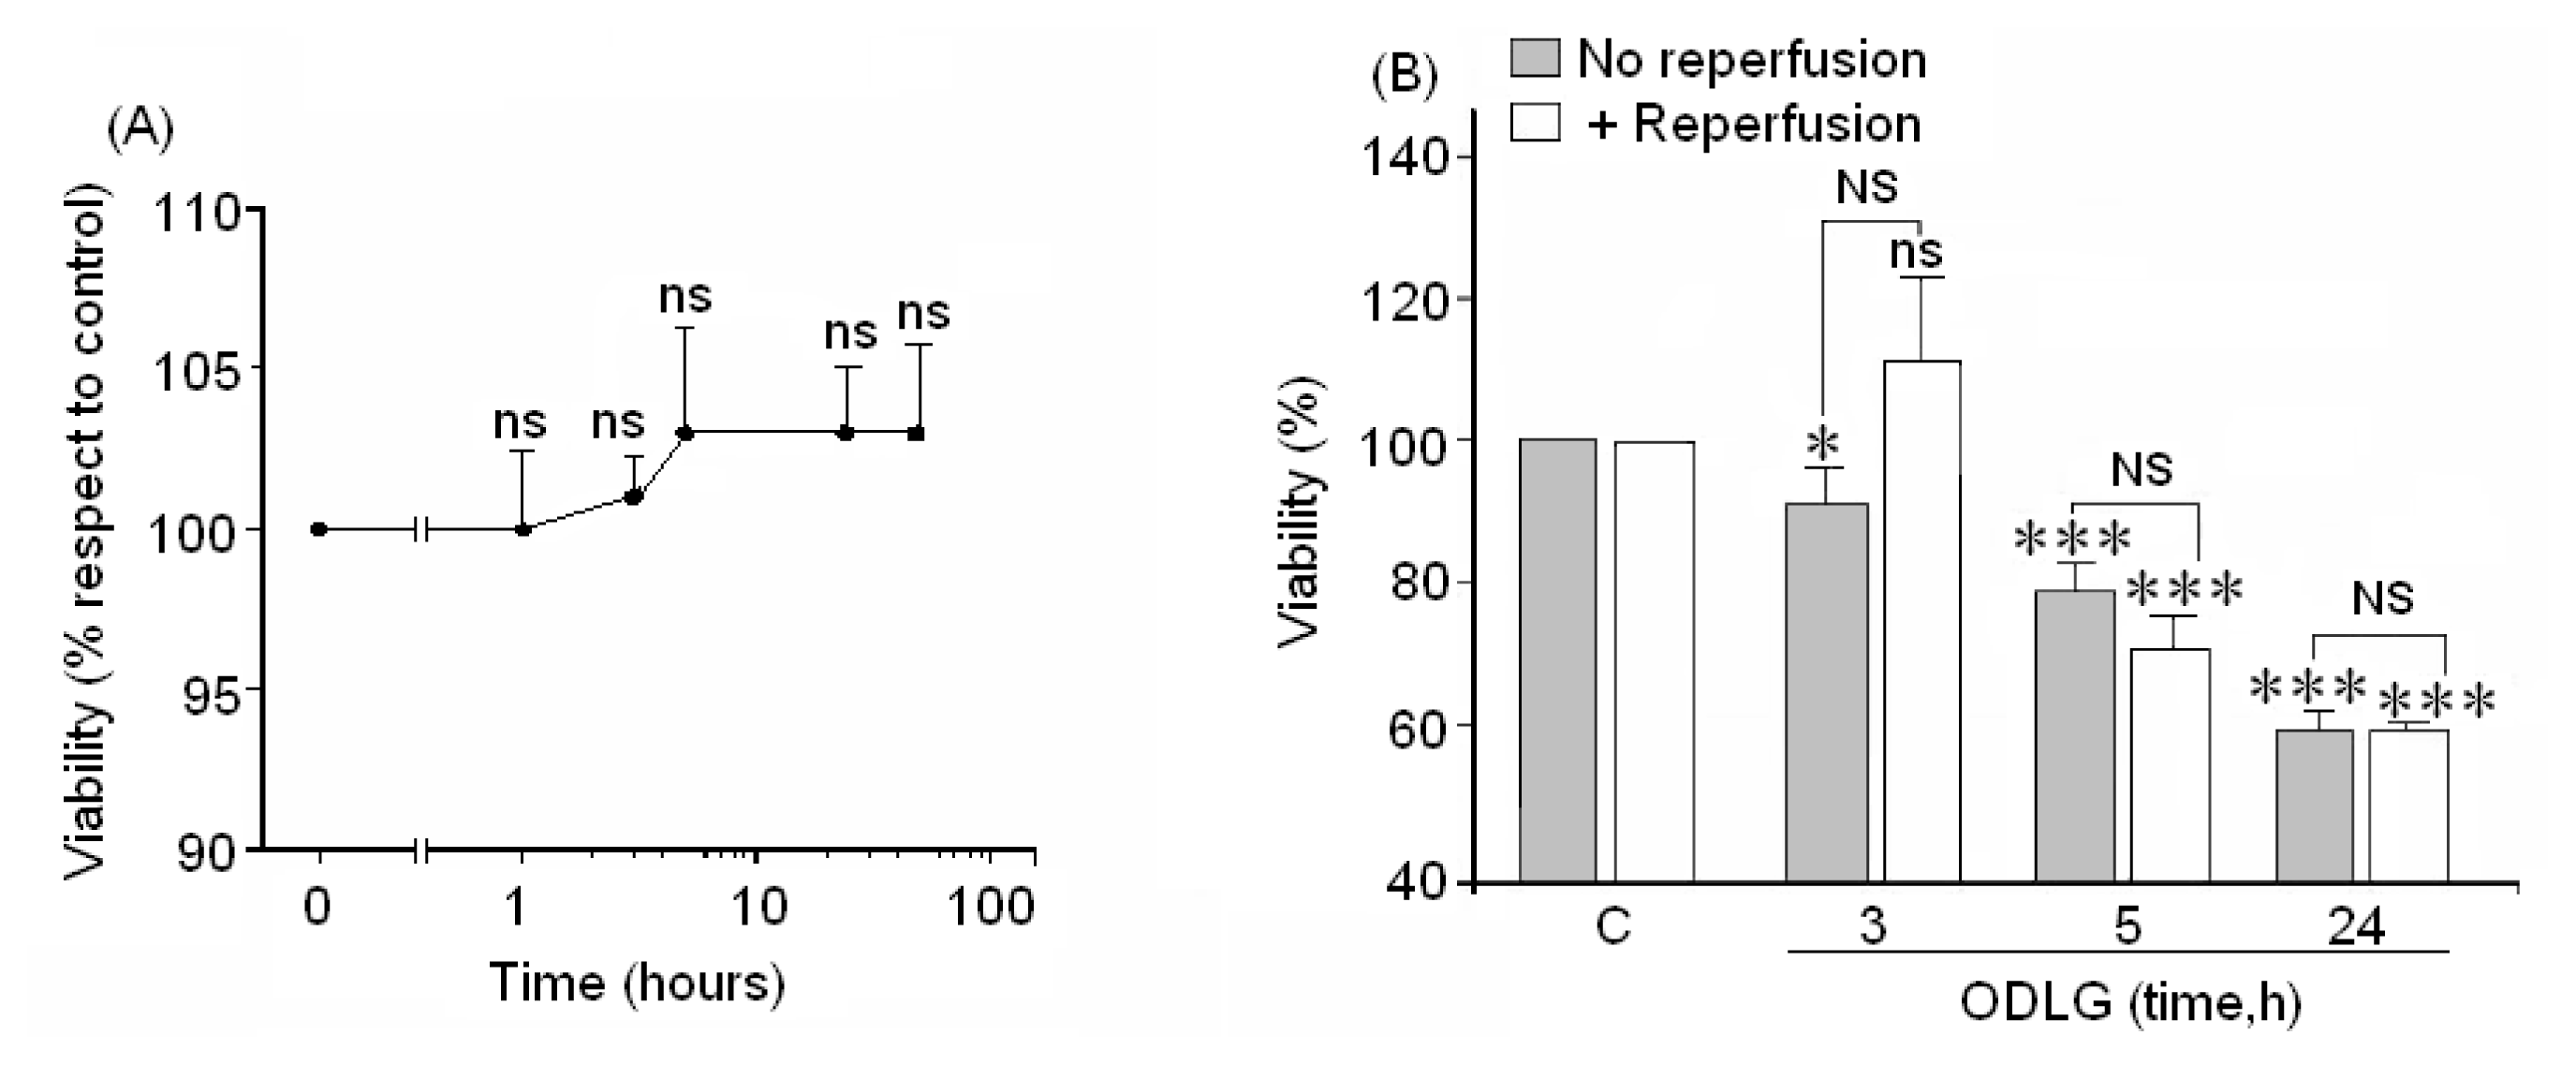
2.3. Cell Viability
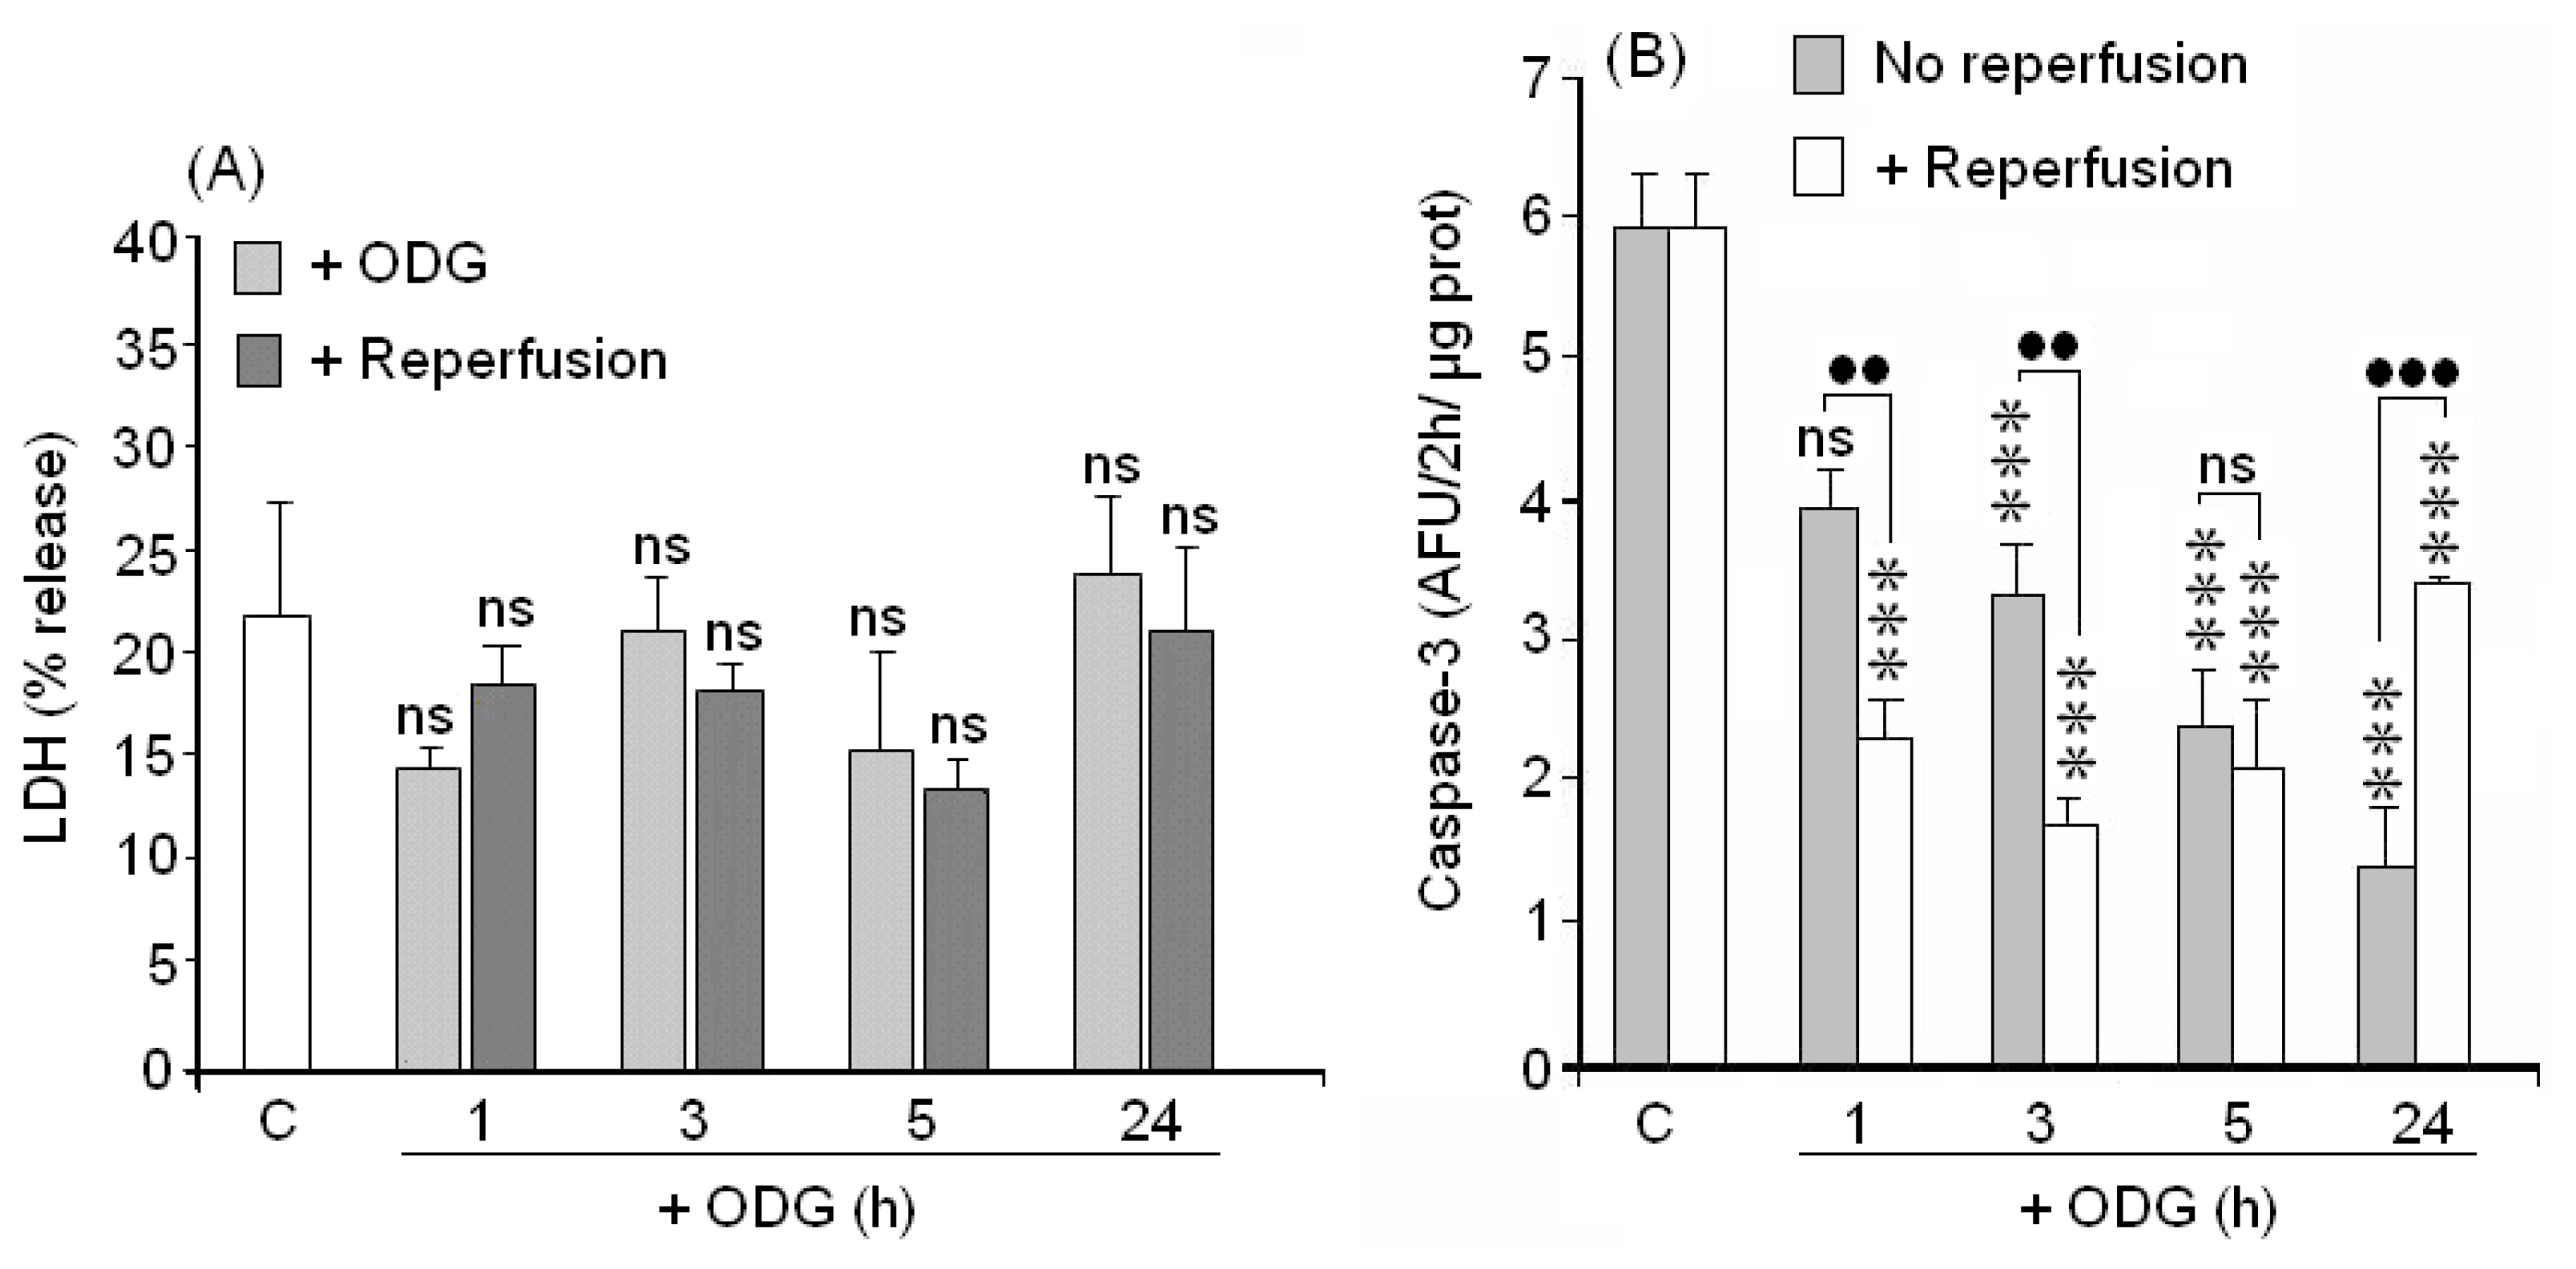
2.4. Cellular Death (LDH Assay)
2.5. Caspase-3 Activation
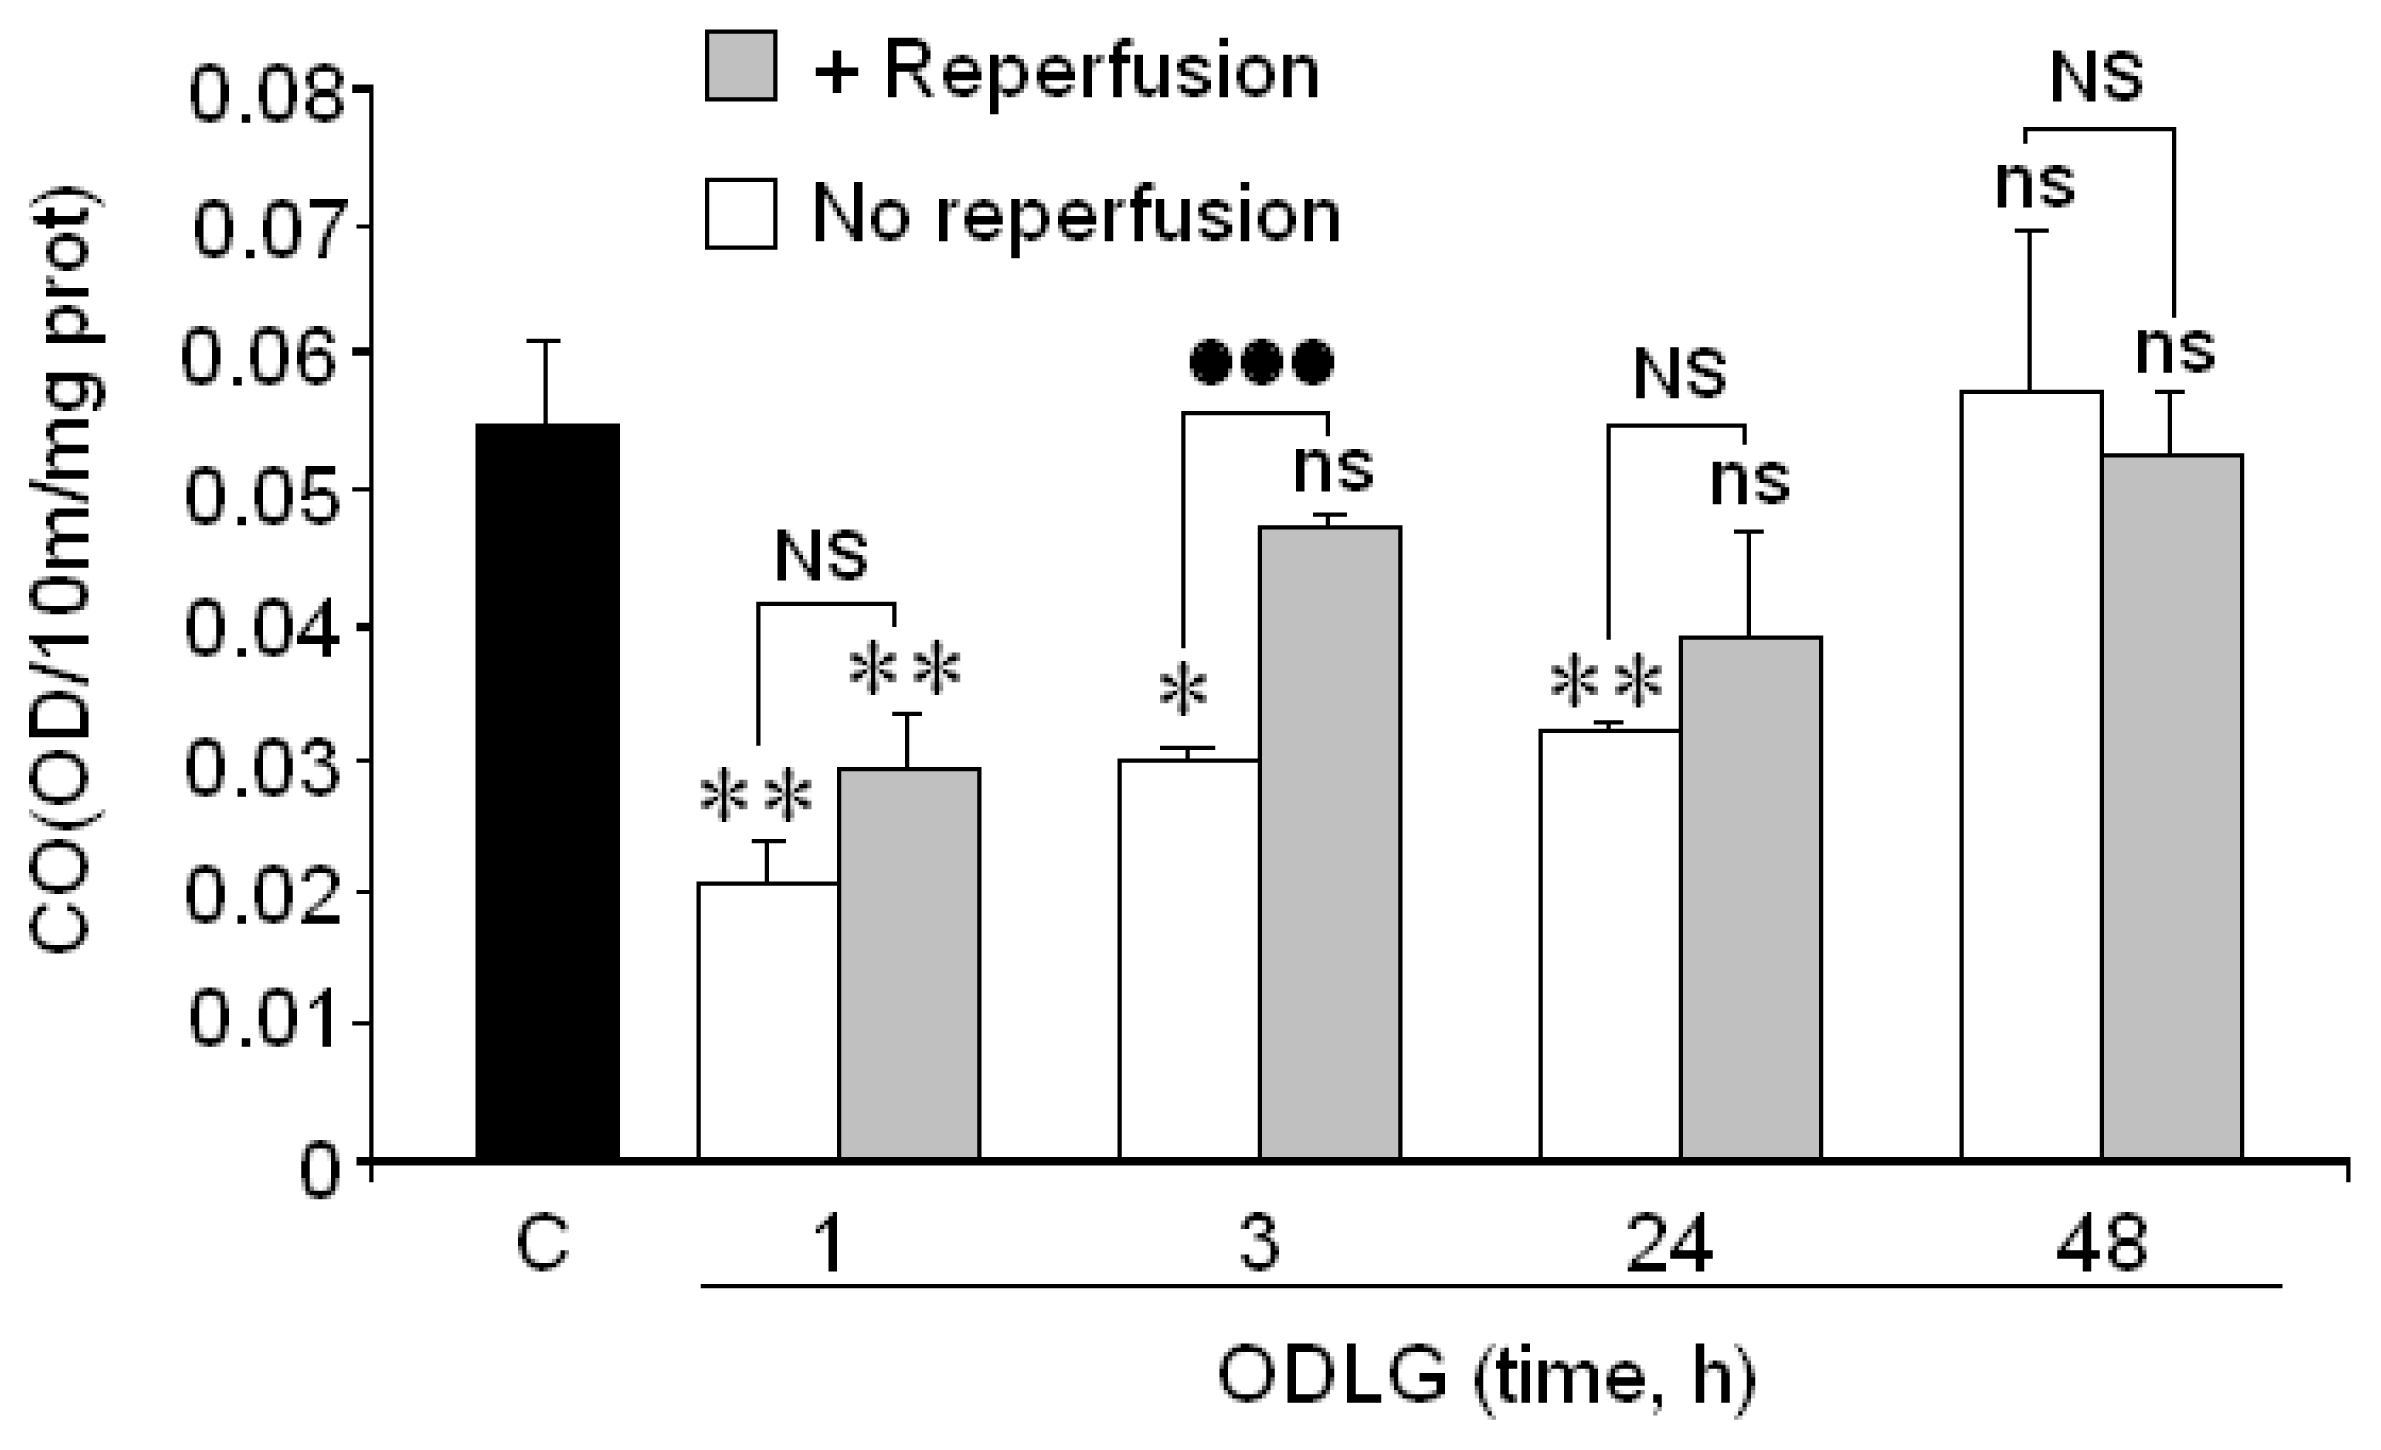
2.6. Cytochrome Oxidase
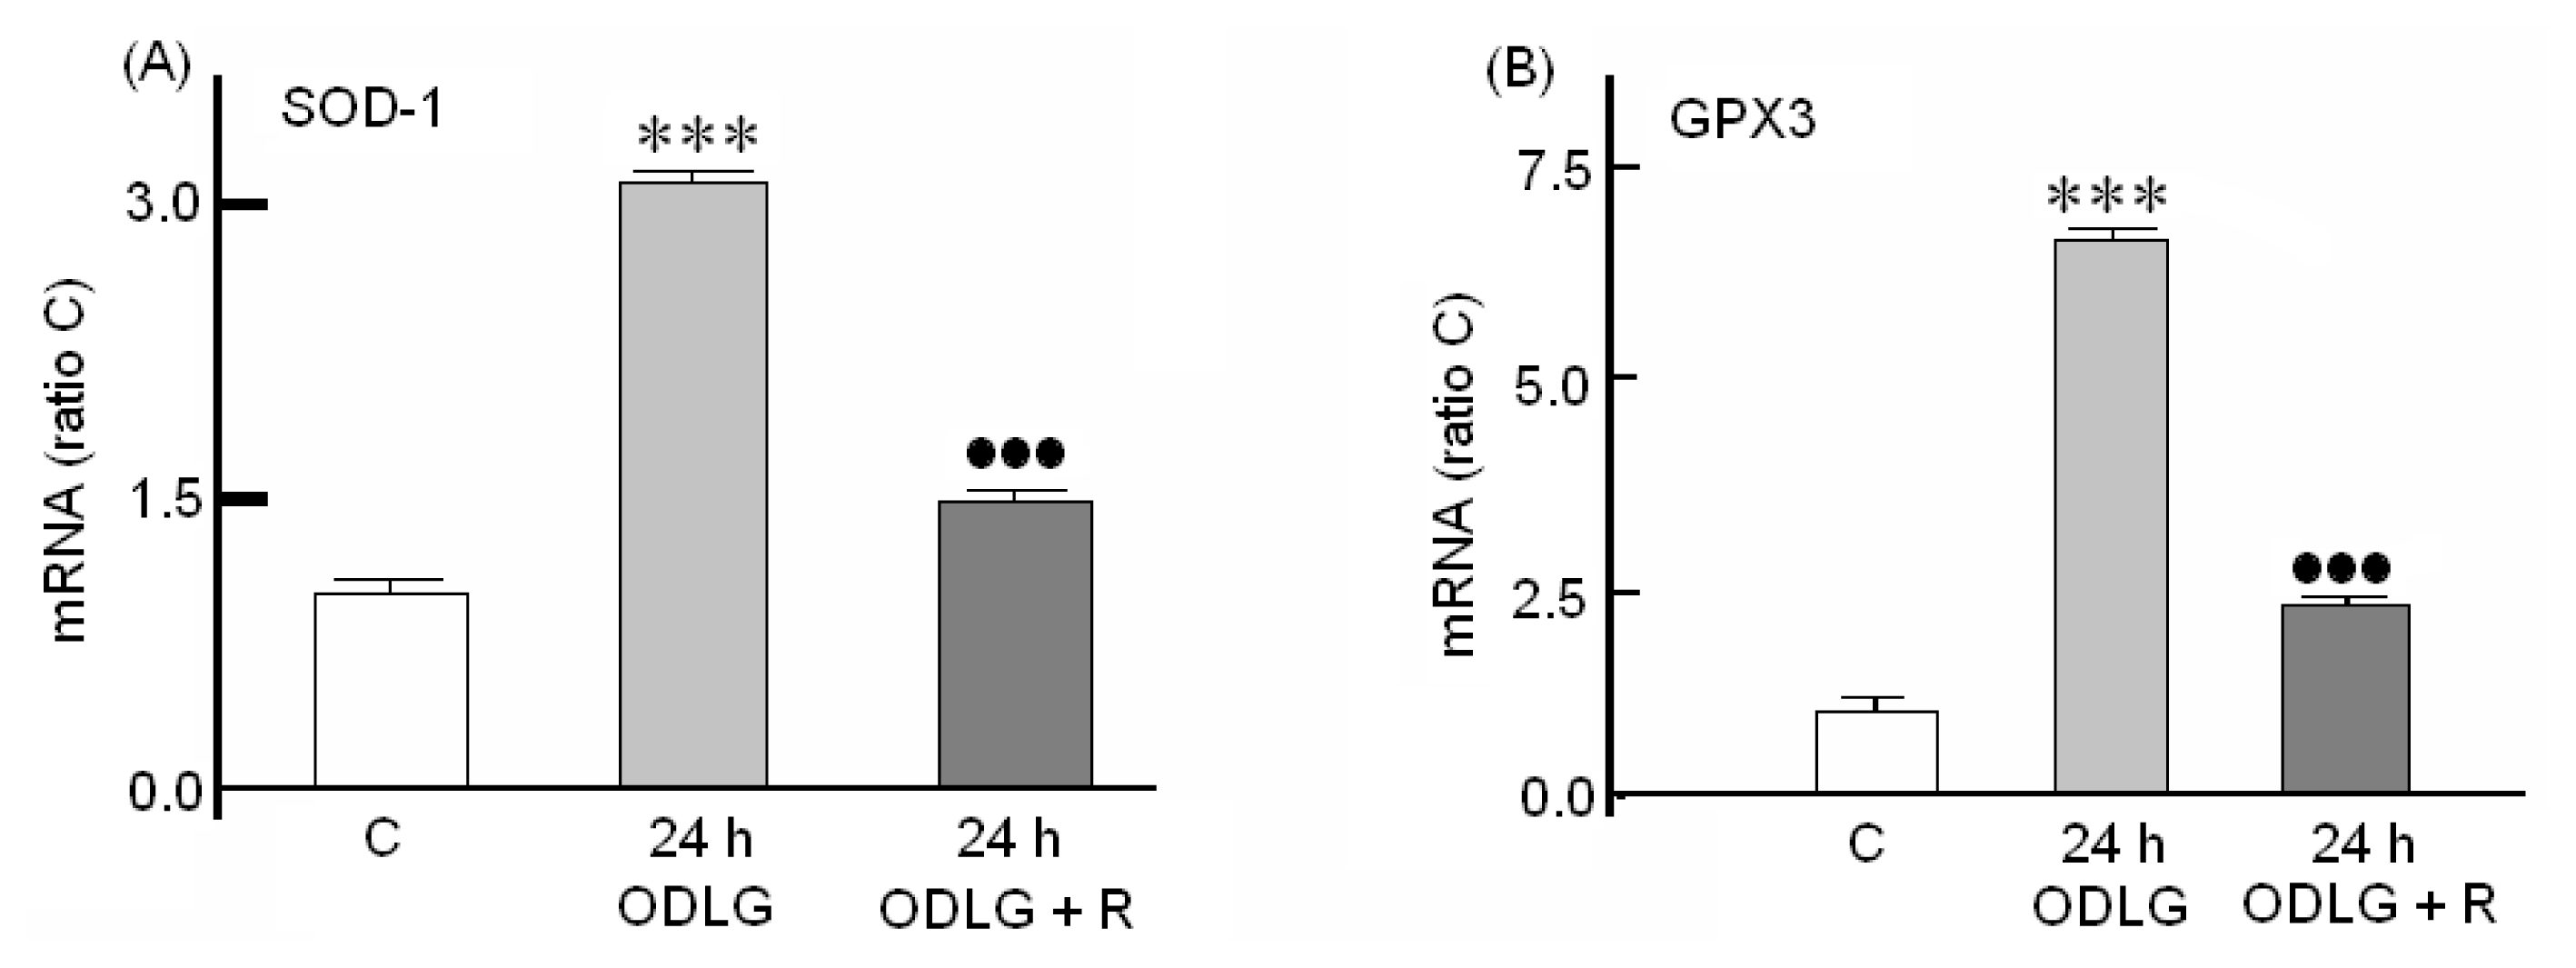
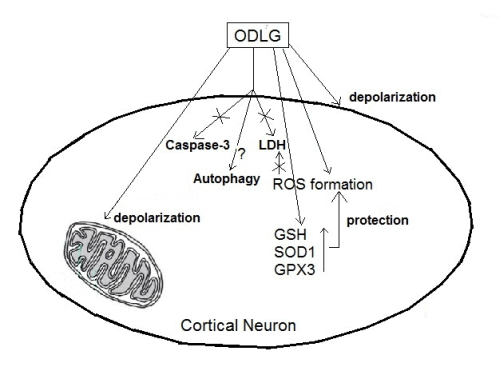
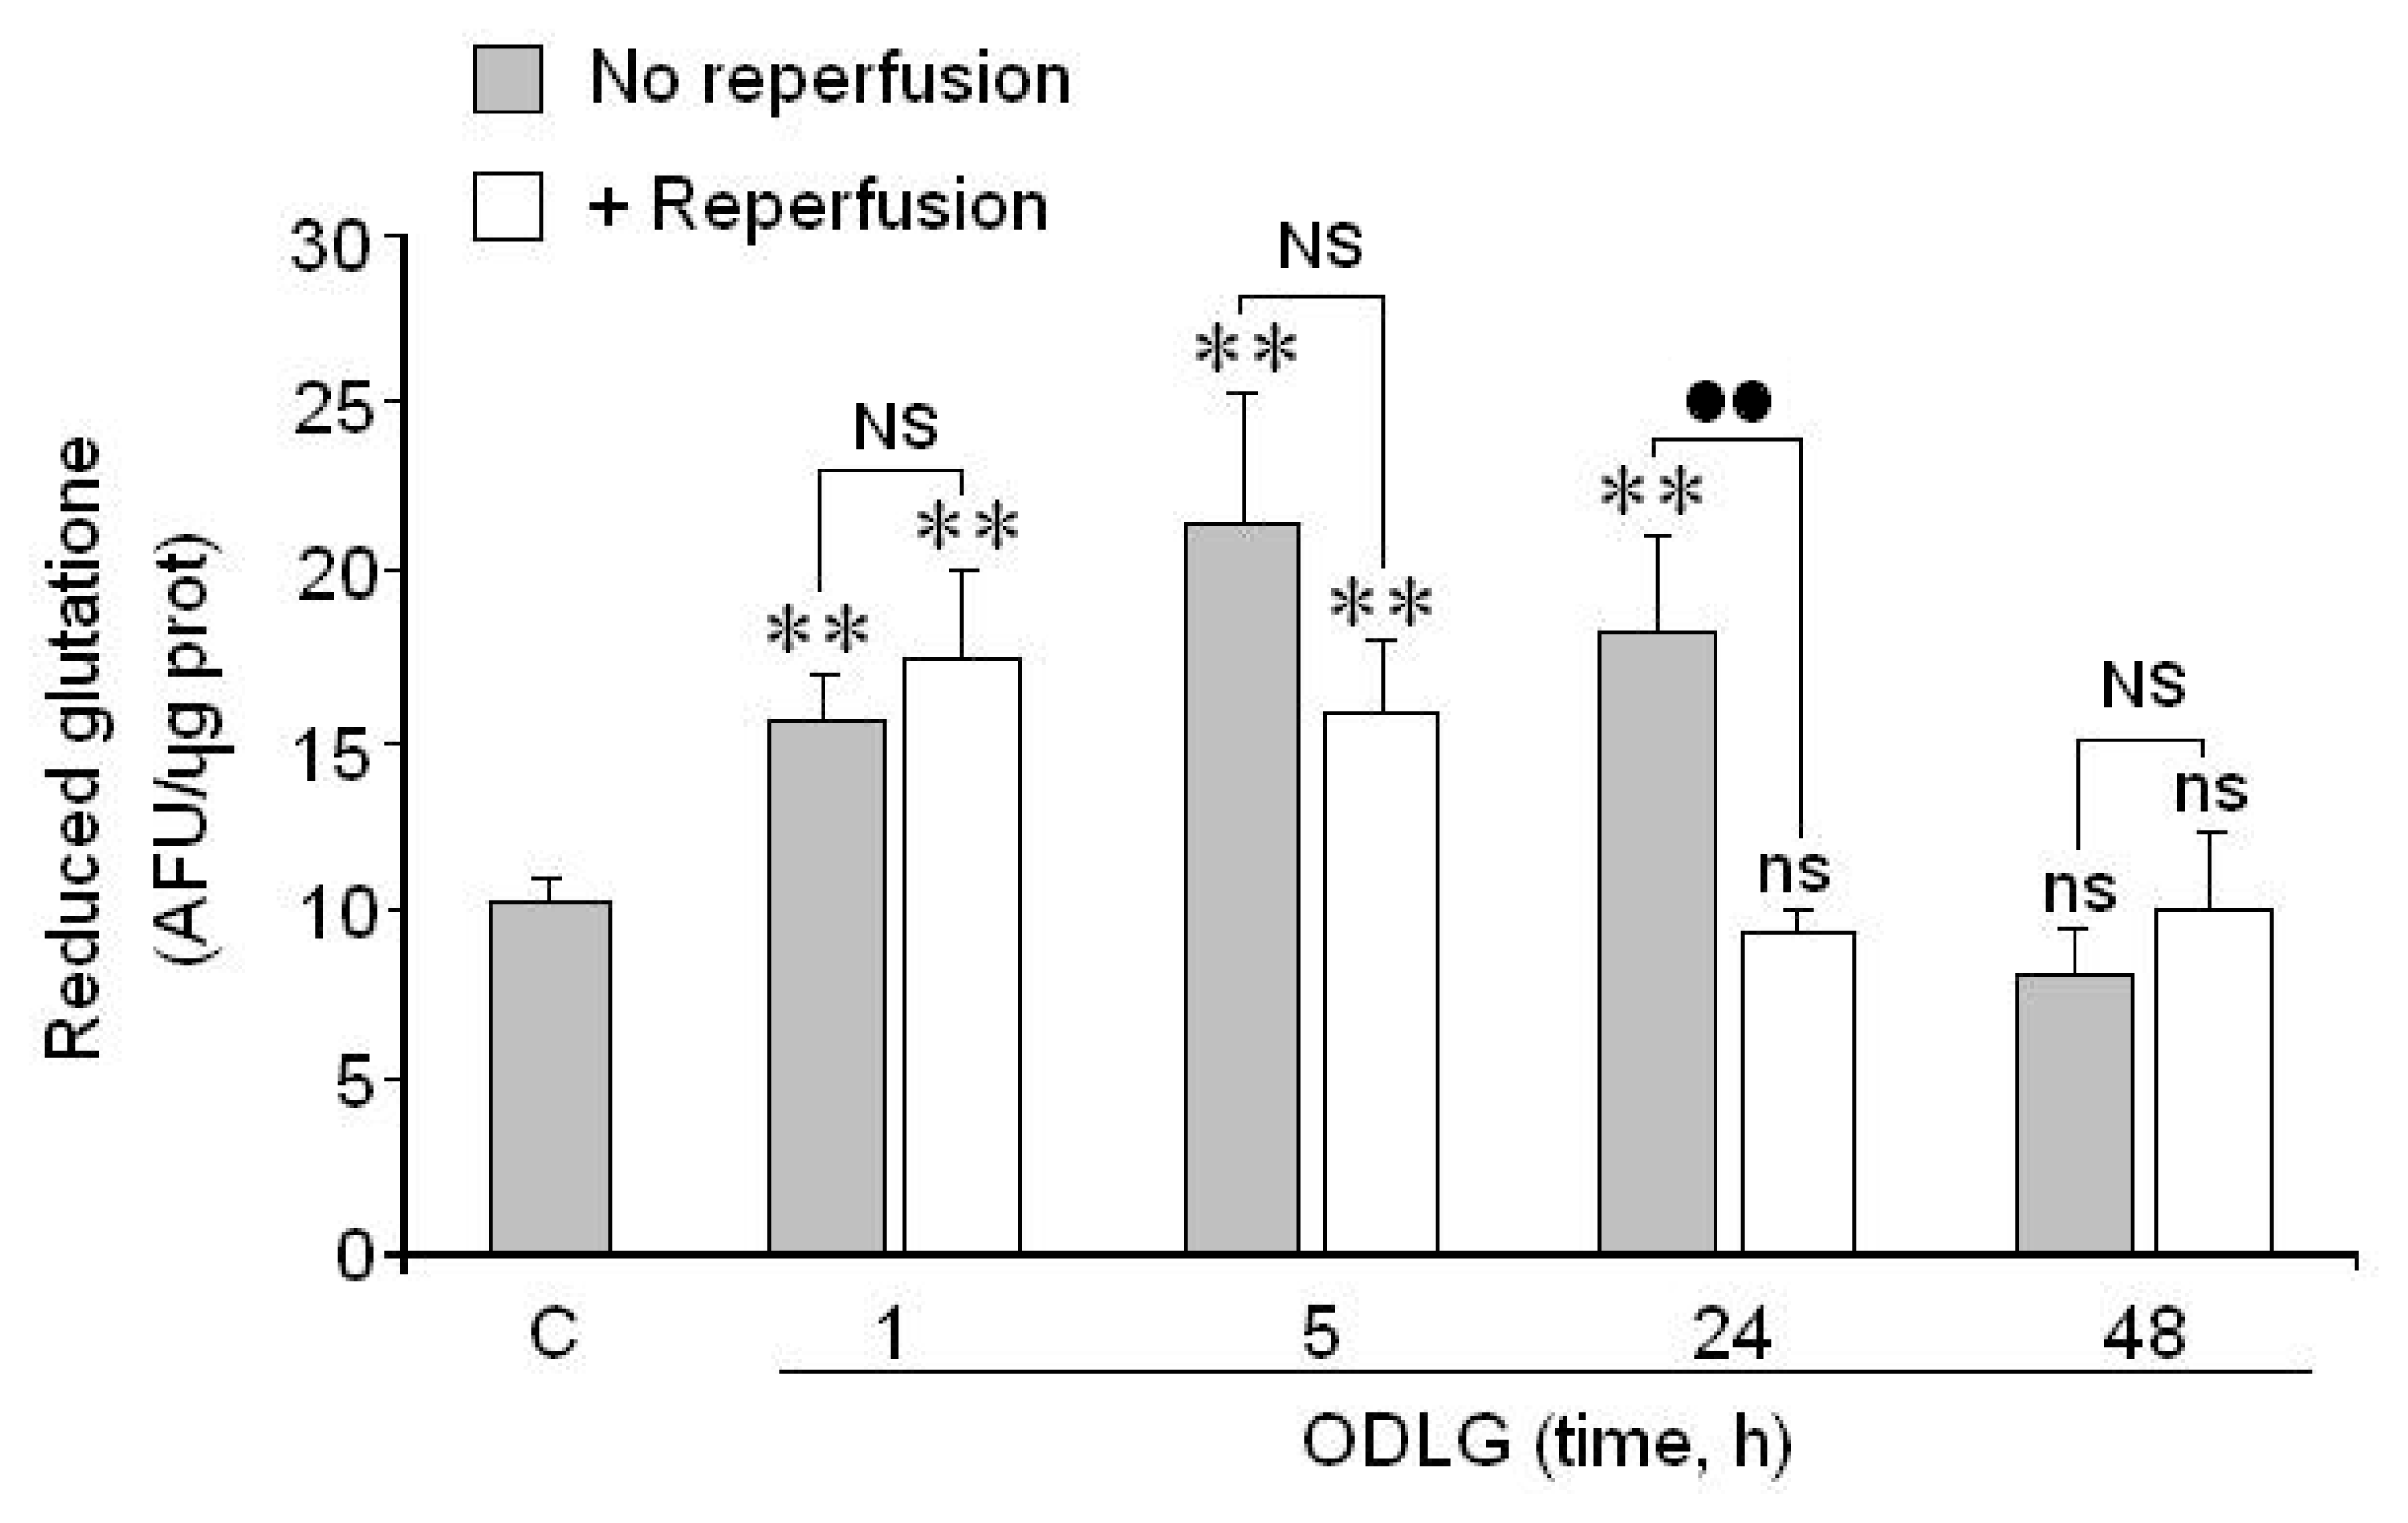
2.7. Possible Mechanisms which Protect against ROS Damage
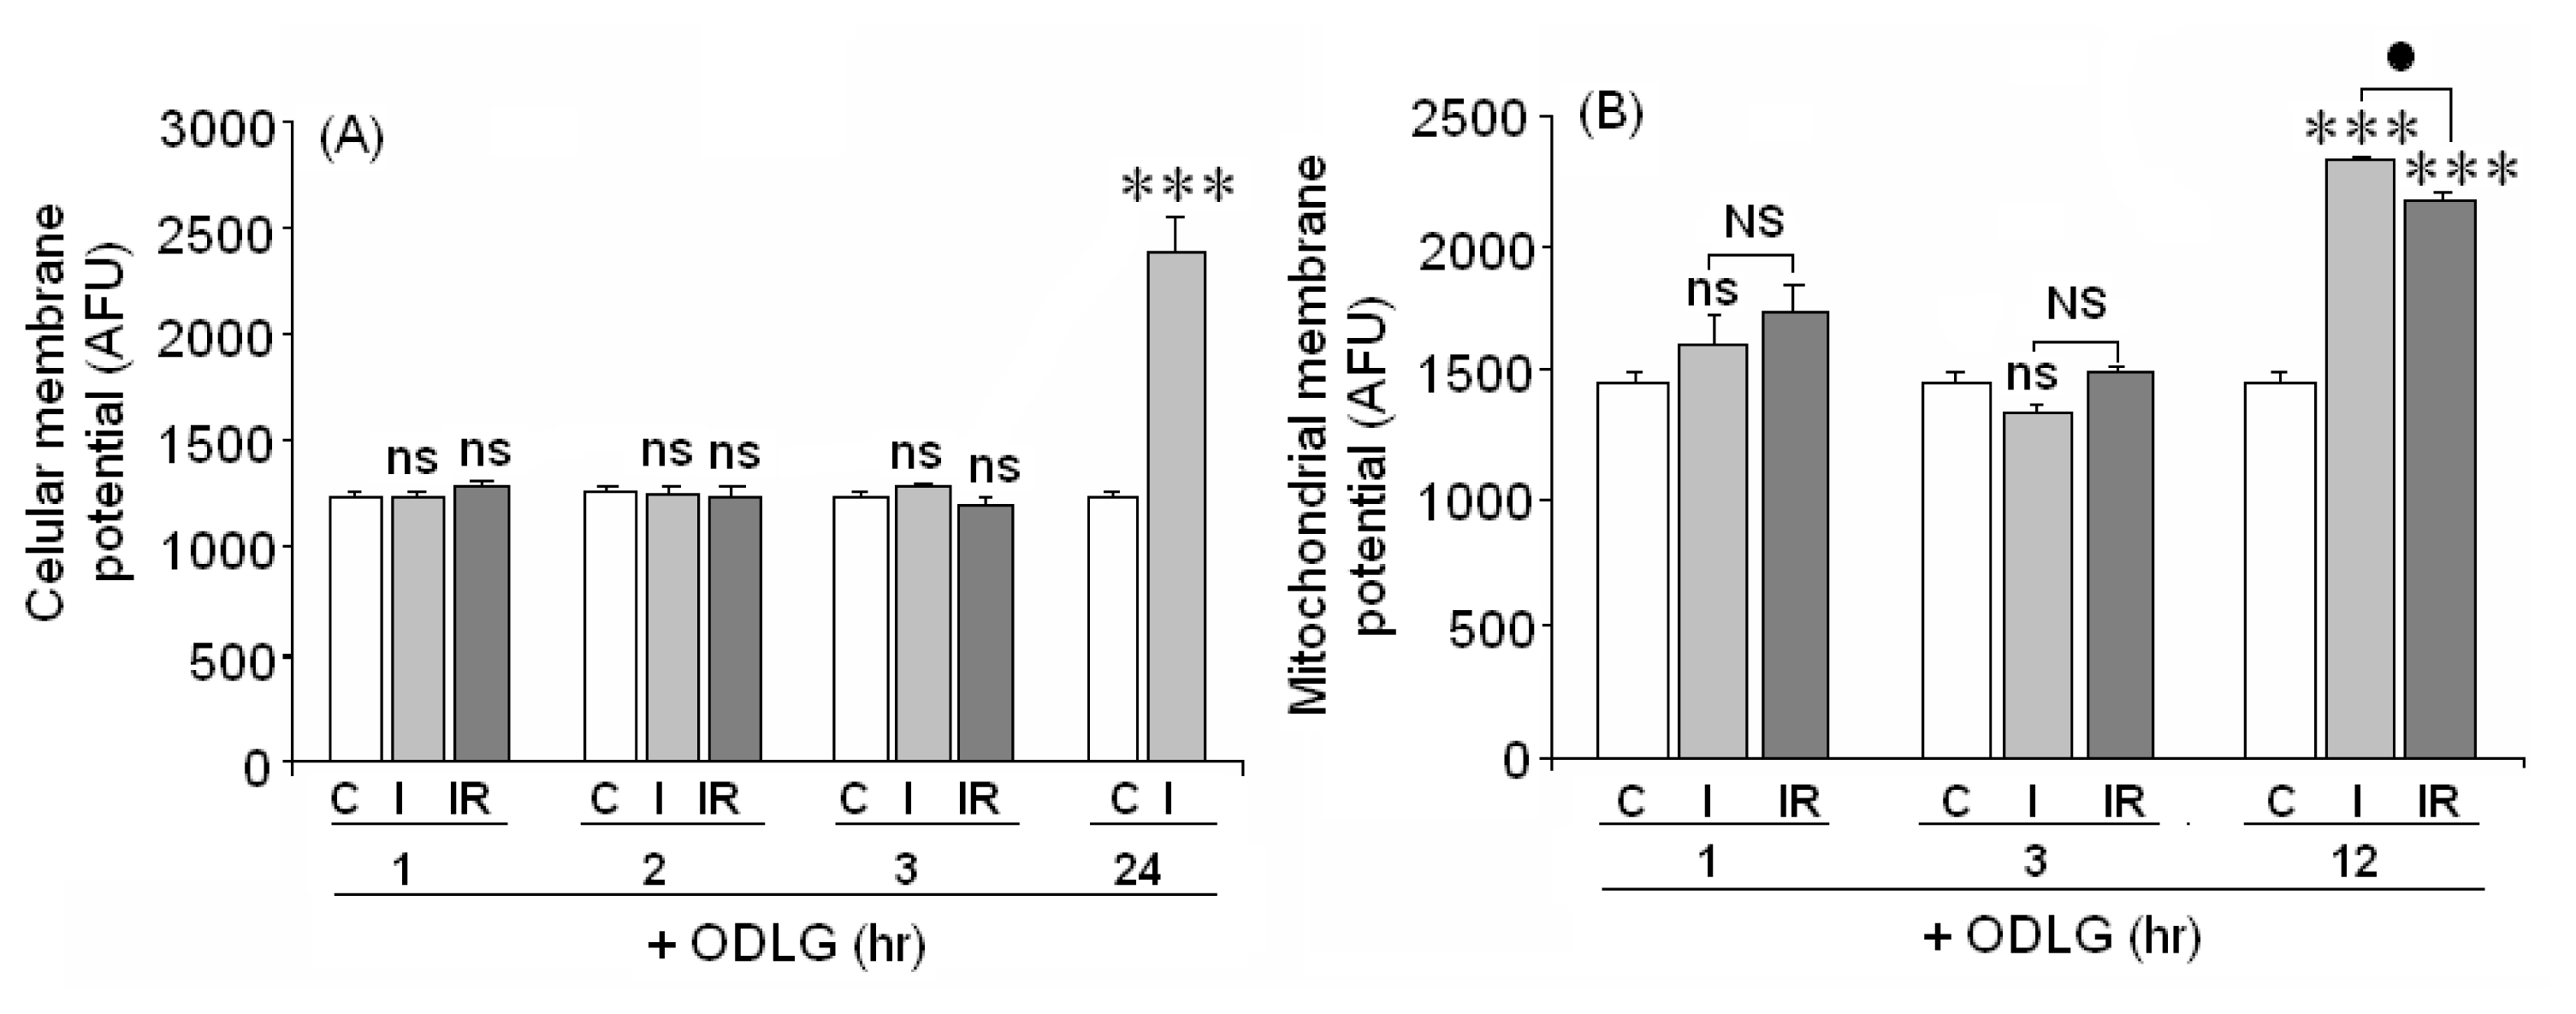
2.8. Cellular and Mitochondrial Membrane Potential
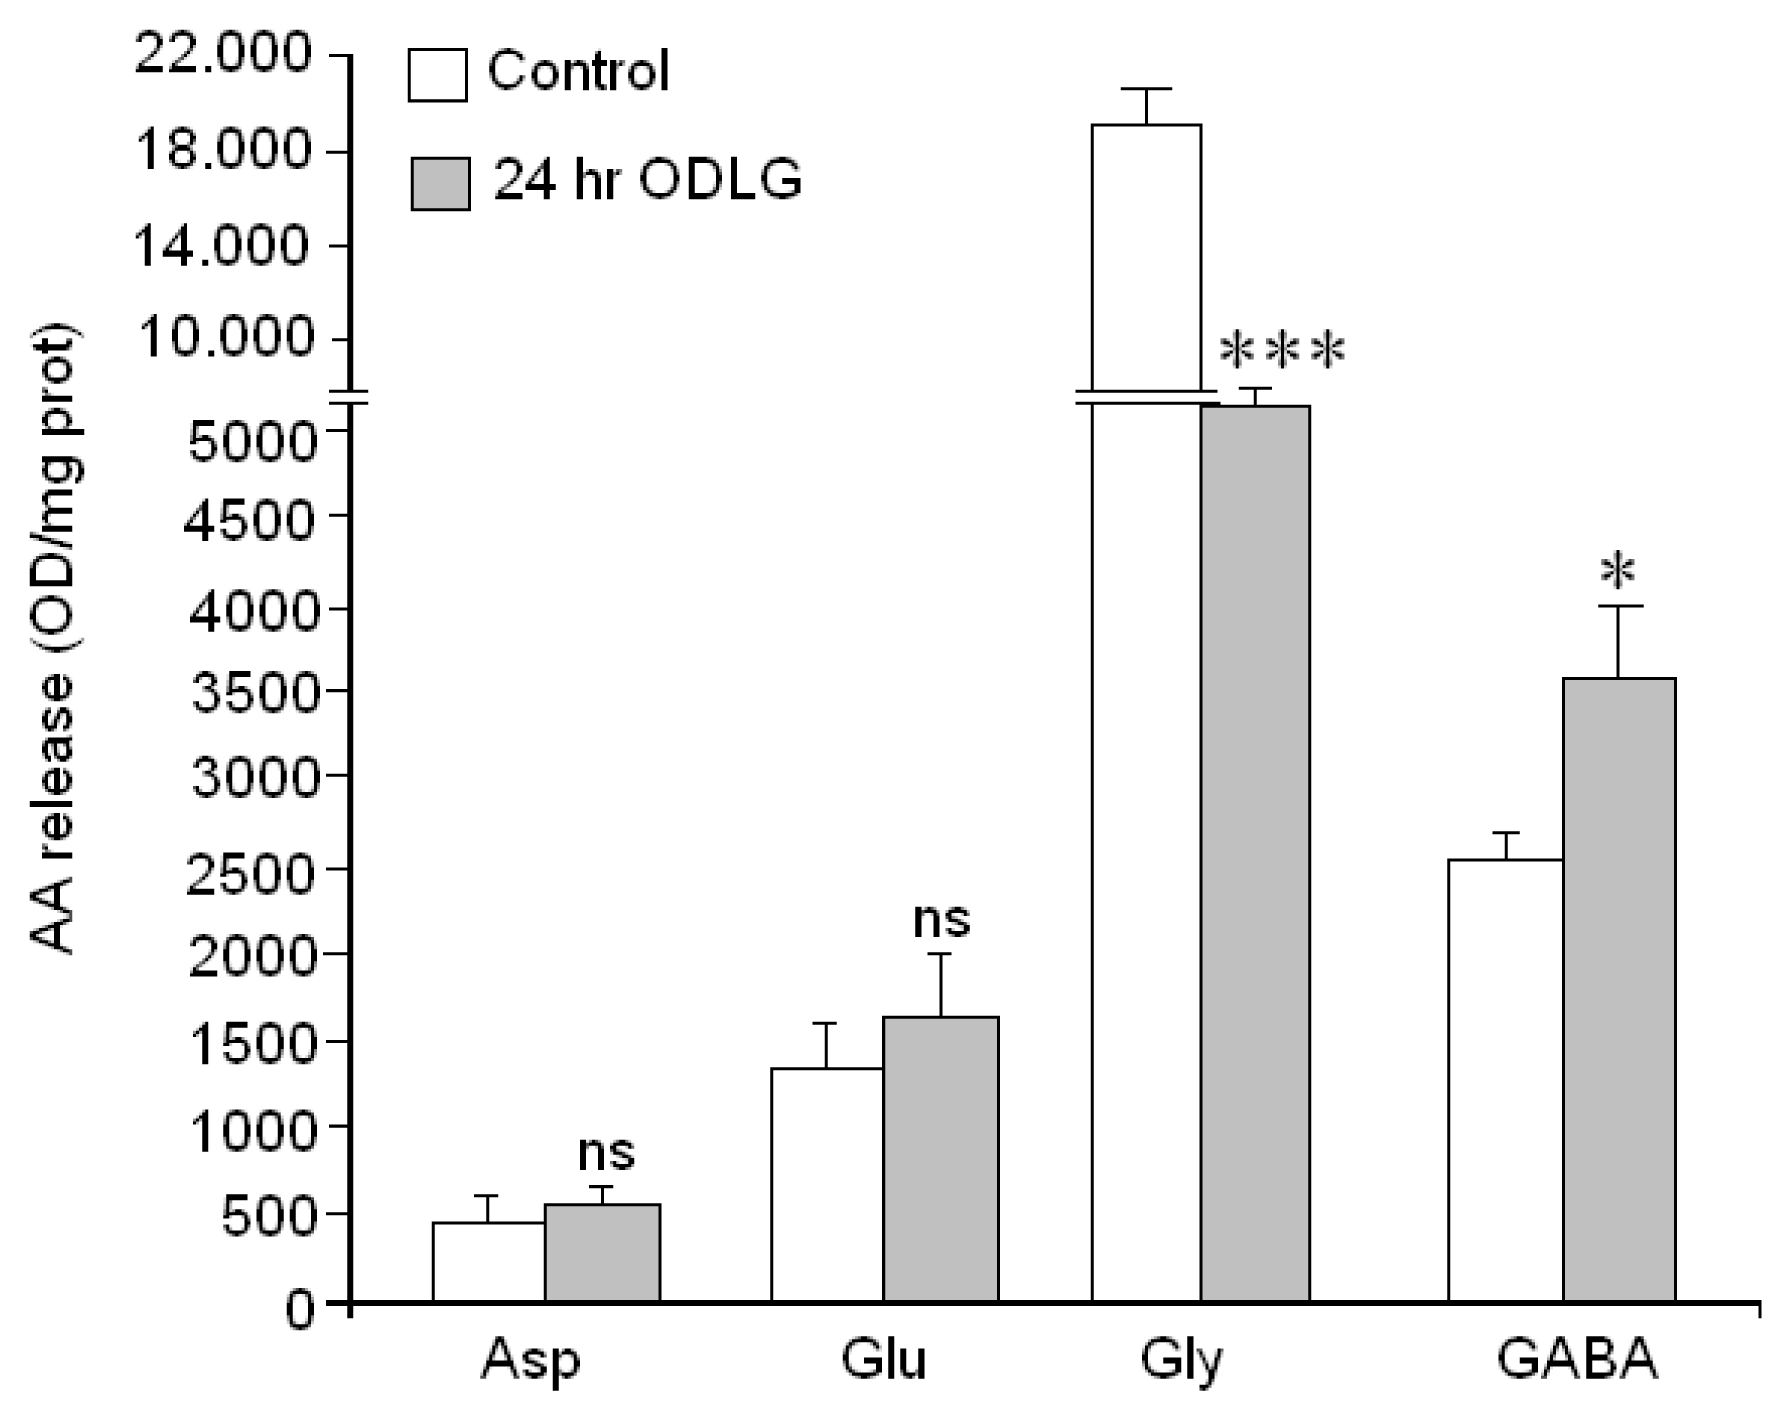
2.9. Cellular Functionality (Amino Acid Release)
3. Discussion
3.1. HIF1α and HIF3α Are Upregulated during ODLG
3.2. ROS Generation and Antioxidant Mechanisms
3.3. Cytochrome Oxidase and ODLG
3.4. ODLG and Cellular Death
3.5. ODLG and Cellular Malfunction
4. Experimental Section
4.1. Cell Isolation and Culture
4.2. ODLG Treatment
4.3. Reperfusion
4.4. Assessment of Cell Viability
4.4.1. Crystal Violet Determination
4.4.2. XTT Determination
4.5. Measurement of ROS Formation
4.6. Lactate Dehydrogenase (LDH) Release
4.7. Caspase-3 Activity Measurement
4.8. Cytochrome Oxidase Activity
4.9. Measurement of Glutathione
4.10. Measurement of Amino Acid Secretion
4.11. Membrane Potential Measurement
4.12. Mitochondrial Membrane Potential Assay
4.13. Analysis of Gene Expression
4.13.1. RT-PCR Analysis
4.13.2. Real-Time PCR
4.14. Statistical Analysis
4.15. Ethics Statement
5. Conclusions
Acknowledgments
Conflicts of Interest
References
- Lo, E.H.; Dalkara, T.; Moskowitz, M.A. Mechanism, challenges and opportunities in stroke. Nat. Rev. Neurosci 2003, 4, 399–405. [Google Scholar]
- Jie, L.; Yuqin, C.; Yao, D.; Shuai, H.; Yuanyuan, W. Occlusion of middle cerebral artery induces apoptosis of cerebellar cortex neural cells via caspase-3 in rats. Turk. Neurosurg 2011, 21, 567–574. [Google Scholar]
- Northington, F.J.; Chavez-Valdez, R.; Martin, L.J. Neuronal cell death in neonatal hypoxia-ischemia. Ann. Neurol 2011, 69, 743–758. [Google Scholar]
- Choi, S.Y.; Lee-Kwon, W.; Lee, H.H.; Lee, J.H.; Sanada, S.; Kwon, H.M. Multiple cell death pathways are independently activated by lethal hypertonicity in renal epithelial cells. Am. J. Physiol. Cell Physiol 2013, 305, C1011–C1020. [Google Scholar]
- Benveniste, H.; Drejer, J.; Schousboe, A.; Diemer, N.H. Elevation of the extracellular concentration of glutamate and aspartate in rat hippocampus during transient cerebral ischemia monitored by intracerebral microdyalisis. J. Neurochem 1984, 43, 1369–1374. [Google Scholar]
- Chan, P.H. Oxigen radicals in focal cerebral ischaemia. Brain Pathol 1994, 4, 59–65. [Google Scholar]
- Chan, P.H. Reactive oxygen radicals in signalling and damage in the ischemic brain. J. Cereb. Blood Flow Metab 2001, 21, 2–14. [Google Scholar]
- Kotur-Stevuljevic, J.; Memon, L.; Stefanovic, A.; Spasic, S.; Spasojevic-Kalimanovska, V.; Bogavac-Stanojevic, N.; Kalimanovska-Ostric, D.; Jelić-Ivanovic, Z.; Zunic, G. Correlation of oxidative stress parameters and inflamatory moukers in coronary arteric disease patients. Clin. Biochem 2007, 40, 181–187. [Google Scholar]
- Nistico, R.; Piccirilli, S.; Cucchiaroni, M.L.; Armogida, M.; Guatteo, E.; Giampa, C.; Fusco, F.R.; Bernardi, G.; Nistico, G.; Mercuri, N.B. Neuroprotective effect of hydrogen peroxide on an in vitro model of brain ischaemia. Br. J. Pharmacol 2008, 153, 1022–1029. [Google Scholar]
- Allen, R.G.; Tresini, M. Oxidative stress and gene regulation. Free Radic. Biol. Med 2000, 28, 463–499. [Google Scholar]
- Ten, V.S.; Starkovy, A. Hypoxic-ischemic injury in the developing brain: The role of reactive oxigen species originaty in mitochondria. Neurol. Res. Int 2012. [Google Scholar] [CrossRef]
- Rothman, S. Synaptic release of excitatory amino acid neurotransmitter mediated anoxic neuronal death. J. Neurosci 1984, 4, 1884–1891. [Google Scholar]
- Sen, C.K.; Packer, L. Antioxidant and redox regulation of gene transcription. FASEB J 1996, 10, 709–720. [Google Scholar]
- Finkel, T. Oxidant signals and oxidative stress. Curr. Opin. Cell Biol 2003, 15, 247–254. [Google Scholar]
- Rhee, S.G.; Yang, K.S.; Kang, S.W.; Woo, H.A.; Chang, T.S. Controlled elimination of intracellular H2O2: Regulation of peroxiredoxin, catalase, and glutathione peroxidase via post-translational modification. Antioxid. Redox Signal 2005, 7, 619–626. [Google Scholar]
- Louzada-Junior, P.; Dias, J.J.; Santos, W.F.; Lachat, J.J.; Bradford, M.F.; Coutinho-Netto, J. Gutamate release in experimental ischemia of the retina: An approach using microdialisis. J. Neurochem 1992, 59, 358–363. [Google Scholar]
- Ankarcrona, M. Glutamate induces cellular death: Apoptosis or necrosis? Prog. Brain Res 1998, 116, 265–272. [Google Scholar]
- Castellanos, M.; Sobrino, T.; Pedraza, S.; Moldes, O.; Pumar, J.M.; Silva, Y.; Serena, J.; Garcia-Gil, M.; Castillo, J.; Dávalos, A. High plasma glutamate concentrations are associated with infarct growth in acute ischemic stroke. Neurology 2008, 71, 1862–1868. [Google Scholar]
- Antonelli, T.; Tomasini, M.C.; Fournier, J.; Mazza, R.; Tanganelli, S.; Pirondi, S.; Fuxe, K.; Ferraro, L. Neurotensin receptor involvement in the rise of extracellular glutamate levels and apoptotic nerve cell death in primary cortical culture after oxygen and glucose deprivation. Cereb. Cortex 2008, 18, 1748–1757. [Google Scholar]
- Chi, O.Z.; Hunter, C.; Liu, X.; Weiss, H.R. Effect of exogenous excitatory amino acid neurotransmitters on blood-brain barrier disruption in focal cerebral ischemia. Neurochem. Res 2009, 34, 1249–1254. [Google Scholar]
- Pak, E.; Lee, G.J.; Choi, S.; Choi, S.K.; Kang, S.W.; Pak, K.J.; Pak, H.K. The role of glutamate releae on voltage-dependent anion channels (VDAC) mediated apoptosis in a eleven vessel occlusion model in rats. PLoS One 2010, 5, e15192. [Google Scholar]
- Sun, C.; Merg, Q.; Zhang, L.; Wang, H.; Quirion, R.; Zheng, W. Glutamate alterates IGF-1 receptor tyrosine phosphorilation in mouse brain: Possible significance in ischemic brain damage. Neurosci. Res 2012, 74, 290–297. [Google Scholar]
- Wang, D.; Zhao, Y.; Zhang, Y.; Zhang, T.; Shang, X.; Wan, J.; Liu, Y.; Kong, Q.; Sun, B.; Mu, L.; et al. Hypotermia protects against oxygen-glucose deprivation induced neuronal injury by downregulating the reverse transport of glutamate by astrocytes as mediated by neurons. Neuroscience 2013, 237, 130–138. [Google Scholar]
- Bao, D.Z.; Bao, H.Y.; Yao, L.Z.; Pan, Y.G.; Zhu, X.R.; Yang, X.S.; Wang, H.; Huang, Y.N. 64-Slice spiral CT perfusion combined with vascular imaging of acute ischemic stroke for assessment of infarct core and penumbra. Exp. Ther. Med 2013, 6, 133–139. [Google Scholar]
- Heiss, W.D.; Graf, R. The ischemic penumbra. Curr. Opin. Neurol 1994, 7, 11–19. [Google Scholar]
- Ginsberg, M.D. The new language of cerebral ischemia. Am. J. Neuroradiol 1997, 18, 1435–1445. [Google Scholar]
- Pulsinelli, W.A.; Jacewicz, M.; Levy, D.E.; Petito, C.K.; Plum, F. Ischemic brain injury and the therapeutic window. Ann. N. Y. Acad. Sci 1997, 835, 187–193. [Google Scholar]
- Siddiq, A.; Ayoub, A.; Chavez, J.C.; Aminova, L.; Shah, S.; LaManna, J.C.; Patton, S.M.; Connor, J.R.; Cherny, R.A.; Volitakis, I.; et al. Hypoxia-inducible factor prolyl 4-hydroxulase inhibition. A target for neuroprotection in the central nervous system. J. Biol. Chem 2005, 280, 41732–41743. [Google Scholar]
- Semenza, G.L.; Roth, P.H.; Frang, H.M.; Wang, G.L. Transcriptional regulation of genes encoding glycolitic enzymes by hypoxia-inducible factor. J. Biol. Chem 1994, 269, 23757–23763. [Google Scholar]
- Baba, K.; Muraguchi, T.; Imaoka, S. Role of the hypoxia response pathway in lens formation during embryonic development of Xenopus laevis. FEBS Open Bio 2013, 3, 490–495. [Google Scholar]
- Zhao, Y.; Matsuo-Takasaki, M.; Tsuboi, I.; Kimura, K.; Salazar, G.; Yamashita, T.; Ohneda, O. Dual functions of hypoxia inducible factor-1 alpha for the commitment of mouse embryonic stem cells toward a neural lineage. Stem Cells Dev 2013. [Google Scholar] [CrossRef]
- Semenza, G.L. Oxygen sensing, hypoxia-inducible factors, and disease pathophysiology. Annu. Rev. Pathol 2013. [Google Scholar] [CrossRef]
- Semenza, G.L. Hypoxia-inducible factors in physiology and medicine. Cell 2012, 148, 399–408. [Google Scholar]
- Semenza, G.L. Hypoxia-inducible factor 1: Oxygen homeostasis and disease pathophysiology. Trends Mol. Med 2001, 7, 345–350. [Google Scholar]
- Segal, M. Rat hippocampus neurons in culture: Responses to electrical and chemical stimuli. J. Neurophysiol 1983, 50, 1249–1264. [Google Scholar]
- Figueroa, S.; Oset-Gasque, M.J.; Arce, C.; Martinez-Honduvilla, C.J.; González, M.P. Mitochondrial involvement in nitric oxide-induced cellular death in cortical neurons in culture. J. Neurosci. Res 2006, 83, 441–449. [Google Scholar]
- Ebert, B.L.; Bunn, H.F. Regulation of transcription by hypoxia requires a multiprotein complex that induces hypoxia-inducible factot 1, an adjacent transcription factor, and p300/CREB-binding protein. Mol. Cell Biol 1998, 18, 4089–4096. [Google Scholar]
- Siddqi, A.; Aminova, L.R.; Ratan, R.R. Hypoxia inducible factor prolyl 4-hydroxylase encimes: Center stage in the battle against hypoxia, metabolic compromise and oxidative stress. Neurochem. Res 2007, 32, 931–946. [Google Scholar]
- Wu, C.; Hu, Q.; Chen, J.; Yan, F.; Li, J.; Wang, L.; Mo, H.; Gu, C.; Zhang, P.; Chen, G. Inhibiting HIF-1α by 2ME2 ameliorates early brain injury after experimental subarachnoid haemorrhage in rats. Biochem. Biophys. Res. Commun 2013, 437, 469–474. [Google Scholar]
- Chen, X.; Guan, T.; Li, C.; Shang, H.; Cui, L.; Li, X.M.; Kong, J. SOD1 aggregation in astrocytes following ischemia/reperfusion injury: A role of NO-mediated S-nitrosylation of protein disulfide isomerase (PDI). J. Neuroinflamm 2012, 237, 1–14. [Google Scholar]
- Kim, W.; Kim, D.W.; Yoo, D.Y.; Chung, J.Y.; Hwang, I.K.; Won, M.H.; Choi, S.Y.; Jeon, S.W.; Jeong, J.H.; Hwang, H.S.; et al. Neuroprotective effects of PEP-1-Cu,Zn-SOD against ischemic neuronal damage in i.e., rabbit spinal cord. Neurochem. Res 2012, 37, 307–313. [Google Scholar]
- Klimova, T.; Chandel, N.S. Mitochondrial complex III regulates hypoxic activation of HIF. Cell Death Differ 2008, 15, 660–666. [Google Scholar]
- Livnat, A.; Barbiro-Michaely, E.; Mayevsky, A. Mitochondrial function and cerebral blood flow variable responses to middle cerebral artery occlusion. J. Neurosci. Methods 2010, 188, 76–82. [Google Scholar]
- Jones, N.M.; Bergeron, M. Hypoxic preconditioning induces changes in HIF-1 target gene in neonatal rat brain. J. Cereb. Blood Flow Metab 2001, 21, 1105–1114. [Google Scholar]
- Schaller, S.; Graf, R. Cerebral ischemic preconditioning. An experimental phenomenon or a clinical important entity of stroke prevention? J. Neurol 2002, 249, 1503–1511. [Google Scholar]
- Xia, D.Y.; Li, W.; Qian, H.R.; Yao, S.; Liu, J.G.; Qi, X.K. Ischemia preconditioning is neuroprotective in a rat cerebral ischemic injury model through autophagy activation and apoptosis inhibition. Braz. J. Med. Biol. Res 2013, 46, 580–588. [Google Scholar]
- Mattson, M.P.; Culmsec, C.; Yu, Z.F. Apoptotic and antiapoptotic mechanisms in stroke. Cell Tissue Res 2000, 301, 173–187. [Google Scholar]
- Levenbrown, Y.; Ashraf, Q.M.; Maounis, N.; Mishra, O.P.; Delivoria-Papadopoulos, M. Phosphorylation of caspase-9 in the cytosolic fraction of the cerebral cortex of newborn piglets following hypoxia. Neurosci. Lett 2008, 447, 96–99. [Google Scholar]
- Yager, J.Y.; Kala, G.; Hertz, L.; Juurlink, B.H. Correlation between content of high-energy phosphates and hypoxic-ischemic damage in immature and mature astrocytes. Brain Res. Dev 1994, 82, 62–68. [Google Scholar]
- Arce, C.; Arteaga, J.L.; Sánchez-Mendoza, E.; Oset-Gasque, M.J.; Cañadas, S.; González, M.P. Added after anoxia-reoxigenation stress, genistein rescues from death the rat embryo cortical. Neurosci. Med 2010, 1, 50–59. [Google Scholar]
- Zhang, X.; Yan, H.; Yuan, Y.; Gao, J.; Shen, Z.; Cheng, Y.; Shen, Y.; Wang, R.R.; Wang, X.; Hu, W.W.; et al. Cerebral ischemia-reperfusion-induced autophagy protects against neuronal injury by mitochondrial clearance. Autophagy 2013, 9, 1321–1333. [Google Scholar]
- López, E.; Figueroa, S.; Oset-Gasque, M.J.; González, M.P. Apoptosis and necrosis: Two distinct events induced by cadmium in cortical neurons in culture. Br. J. Pharmacol 2003, 138, 901–911. [Google Scholar]
- Bradford, M.A. Rapid sensitive method for the quantitation of microgram quantities of protein utilizing the principle of protein-dye binding. Anal. Biochem 1976, 72, 248–253. [Google Scholar]
- Hissin, P.J.; Hilf, R. A fluorometric method for determination of oxidized and reduced glutathione in tissues. Anal. Biochem 1976, 74, 214–226. [Google Scholar]
- Marquez, F.J.; Quesada, A.R.; Sanchez-Jimenez, F.; de Castro, Y.N. Determination of 27 dansyl amino acid derivates in biological fluids by reversed-phase high-performance liquid chromatography. J. Chromatogr 1986, 380, 275–283. [Google Scholar]
- Waggoner, A.S. Dye indicators of membrane potential. Ann. Rev. Biophys. Bioenerg 1979, 8, 47–68. [Google Scholar]
- Tenneti, L.; D’Emilia, D.M.; Troy, C.M.; Lipton, S.A. Role of caspase in N-methyl-d-Aspartate-induced apoptosis in cerebrocortical neurons. J. Neurochem 1998, 71, 946–959. [Google Scholar]
- Bonova, P.; Burda, J.; Danielisova, V.; Nemethova, M.; Gottlieb, M. Development of a pattern in biochemical parameters in the core and penumbra during infarct evolution after transient MCAO in rats. Neurochem. Int 2013, 62, 8–14. [Google Scholar]


| mRNA | Primers |
|---|---|
| HIF1α | 5′-GAAACTCCAAAGCCACTTCG-3′ (forward) 5′-CTGGCTGATCTTGAATCTGG-3′ (reverse) |
| HIF3α | 5′-GCTTATCTGTGAAGCCATCC-3′ (forward) 5′-CAACTTCTGCAATCCTCTCG-3′ (reverse) |
| SOD1 | 5′-GATGAAGAGAGGCATGTTGG-3′ (forward) 5′-CCAATGATGGAATGCTCTCC-3′ (reverse) |
| GPX3 | 5′-CATGAAGATCCATGACATCC-3′ (forward) 5′-GATGTCCATCTTGACGTTGC-3′ (reverse) |
| GAPDH | 5′-AAGGGCTCATGACCACAGTC-3′ (forward) 5′-TTCAGCTCTGGGATGACCTT-3′ (reverse) |
© 2014 by the authors; licensee MDPI, Basel, Switzerland This article is an open access article distributed under the terms and conditions of the Creative Commons Attribution license (http://creativecommons.org/licenses/by/3.0/).
Share and Cite
Merino, J.J.; Roncero, C.; Oset-Gasque, M.J.; Naddaf, A.; González, M.P. Antioxidant and Protective Mechanisms against Hypoxia and Hypoglycaemia in Cortical Neurons in Vitro. Int. J. Mol. Sci. 2014, 15, 2475-2493. https://doi.org/10.3390/ijms15022475
Merino JJ, Roncero C, Oset-Gasque MJ, Naddaf A, González MP. Antioxidant and Protective Mechanisms against Hypoxia and Hypoglycaemia in Cortical Neurons in Vitro. International Journal of Molecular Sciences. 2014; 15(2):2475-2493. https://doi.org/10.3390/ijms15022475
Chicago/Turabian StyleMerino, José Joaquín, César Roncero, María Jesús Oset-Gasque, Ahmad Naddaf, and María Pilar González. 2014. "Antioxidant and Protective Mechanisms against Hypoxia and Hypoglycaemia in Cortical Neurons in Vitro" International Journal of Molecular Sciences 15, no. 2: 2475-2493. https://doi.org/10.3390/ijms15022475