Article

A Case-Control Study of the Genetic Variability in Reactive Oxygen Species—Metabolizing Enzymes in Melanoma Risk

1
Program in Public Health, University of California Irvine, Irvine, CA 92697, USA
2
Department of Neurobiology and Behavior, School of Biological Sciences, University of California Irvine, Irvine, CA 92697, USA
3
Department of Biomedical Engineering, The Henry Samueli School of Engineering, University of California Irvine, Irvine, CA 92697, USA
4
Department of Epidemiology, School of Medicine, University of California, Irvine, CA 92697, USA
5
Chao Family Comprehensive Cancer Center, Irvine, CA 92697, USA
*
Author to whom correspondence should be addressed.
Int. J. Mol. Sci. 2018, 19(1), 242; https://doi.org/10.3390/ijms19010242
Submission received: 18 December 2017 / Revised: 9 January 2018 / Accepted: 12 January 2018 / Published: 14 January 2018
(This article belongs to the Special Issue Chemically-Induced DNA Damage, Mutagenesis, and Cancer)

Abstract

:
Recent studies have shown that ultraviolet (UV)-induced chemiexcitation of melanin fragments leads to DNA damage; and chemiexcitation of melanin fragments requires reactive oxygen species (ROS), as ROS excite an electron in the melanin fragments. In addition, ROS also cause DNA damages on their own. We hypothesized that ROS producing and metabolizing enzymes were major contributors in UV-driven melanomas. In this case-control study of 349 participants, we genotyped 23 prioritized single nucleotide polymorphisms (SNPs) in nicotinamide adenine dinucleotide phosphate (NADPH) oxidases 1 and 4 (NOX1 and NOX4, respectively), CYBA, RAC1, superoxide dismutases (SOD1, SOD2, and SOD3) and catalase (CAT), and analyzed their associated melanoma risk. Five SNPs, namely rs1049255 (CYBA), rs4673 (CYBA), rs10951982 (RAC1), rs8031 (SOD2), and rs2536512 (SOD3), exhibited significant genotypic frequency differences between melanoma cases and healthy controls. In simple logistic regression, RAC1 rs10951982 (odds ratio (OR) 8.98, 95% confidence interval (CI): 5.08 to 16.44; p < 0.001) reached universal significance (p = 0.002) and the minor alleles were associated with increased risk of melanoma. In contrast, minor alleles in SOD2 rs8031 (OR 0.16, 95% CI: 0.06 to 0.39; p < 0.001) and SOD3 rs2536512 (OR 0.08, 95% CI: 0.01 to 0.31; p = 0.001) were associated with reduced risk of melanoma. In multivariate logistic regression, RAC1 rs10951982 (OR 6.15, 95% CI: 2.98 to 13.41; p < 0.001) remained significantly associated with increased risk of melanoma. Our results highlighted the importance of RAC1, SOD2, and SOD3 variants in the risk of melanoma.

1. Introduction

Ultraviolet (UV) rays are capable of inducing melanin production in melanocytes and promoting melanin transportation to the outermost layer of the skin—the keratinocytes. These melanins form a cap over the nucleus of both cell types and protect DNA from direct energy destruction [1,2]. On the other hand, UV rays are also able to initiate nicotinamide adenine dinucleotide phosphate (NADPH) oxidase (NOX) dominated reactive oxygen species (ROS) production and chemiexcitation of melanin fragments that affect DNA stability in melanocytes [3,4,5]. The oncogenic characteristics of UV-induced ROS signaling have not yet been fully elucidated, particularly in the transformation of melanocytes to melanomas.
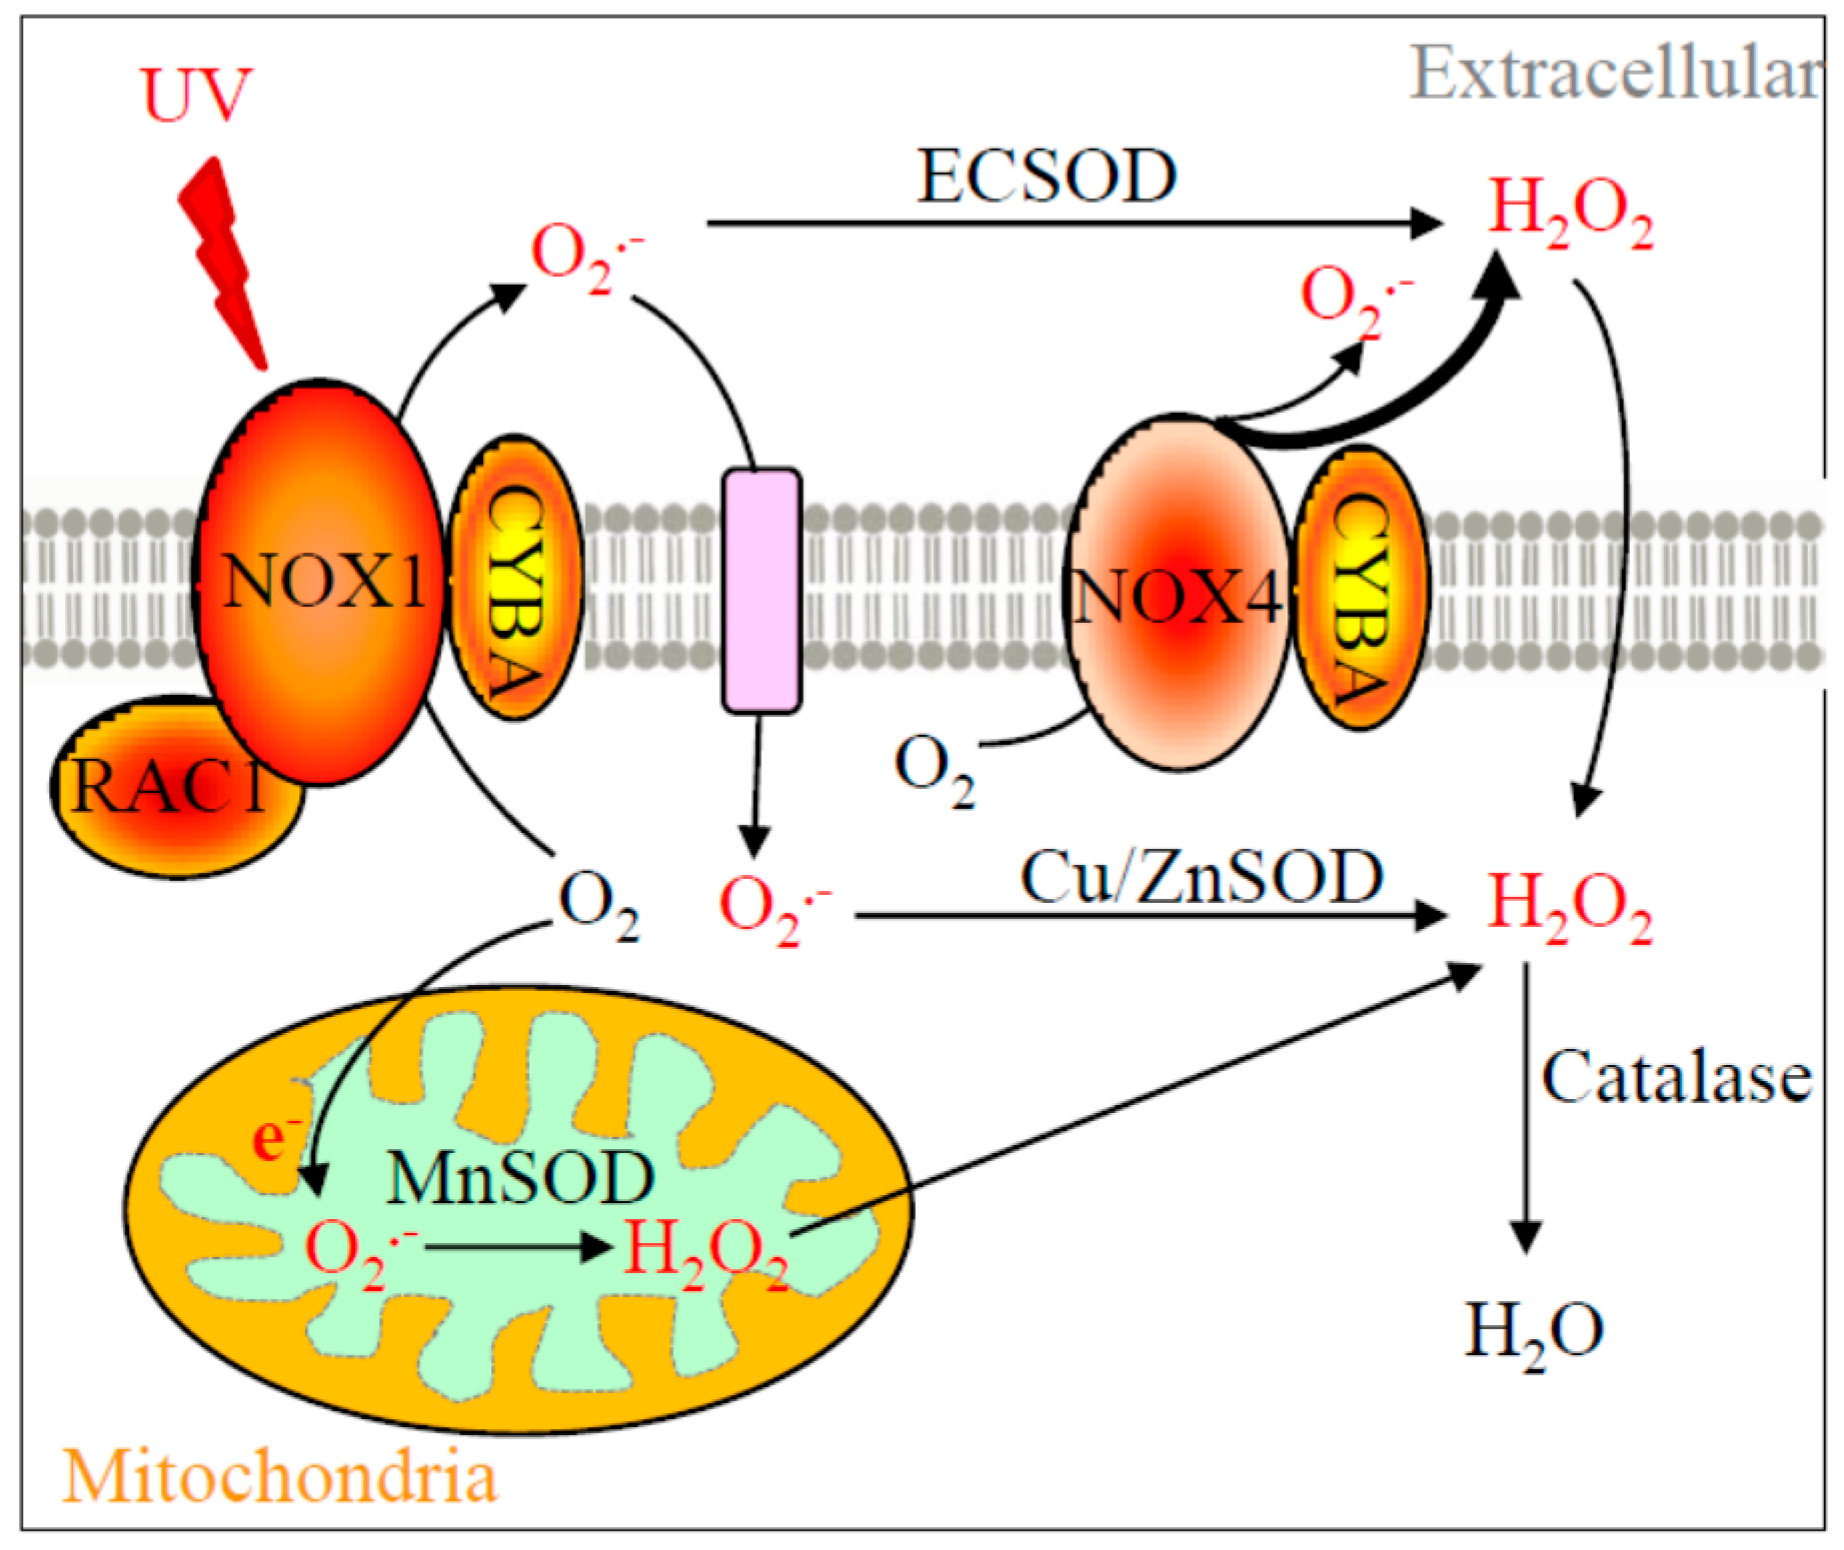
Recent understanding of melanoma photobiology has implied the etiological role of NOX enzymes, particularly NOX1 and NOX4 [6,7,8]. NOX enzymes produce superoxide and/or hydrogen peroxide when coupled with CYBA (p22phox) membrane protein [9]. RAC1, a newly defined melanoma oncogene [10], is shown to enhance NOX1 activity [11]. The downstream ROS metabolizing enzymes, e.g., copper-zinc superoxide dismutase (Cu-ZnSOD, SOD1), manganese superoxide dismutase (MnSOD, SOD2), and extracellular superoxide dismutase (ECSOD, SOD3), convert superoxide to hydrogen peroxide. Catalase then transforms hydrogen peroxide to water molecules (Figure 1). The cellular locations of NOX1, RAC1, NOX4, CYBA, and SOD enzymes, and their functions in ROS production and metabolism are illustrated in Figure 1. Little is known about the comprehensive role of this entire pathway in melanoma formation. However, risk associated with these genes has been reported in various health conditions. For example, V16A variant in SOD2 (rs4880) showed an impaired mitochondrial importing function and was associated with prostate cancer risk [12]. The rs7277748 and rs4998557 variants in SOD1 were found to be associated with amyotrophic lateral sclerosis [13]. Variants rs2536512 and rs699473 in SOD3 were linked to cerebral infarction [14] and brain tumor [15].
Although the causal network of melanoma has not yet been fully elucidated [17], UV exposure is the most tangible environmental risk factor that can be readily modified by behavioral precautions [18]. Therefore, the purpose of this study was to explore the relationship between the hypothesized photobiological pathway and risk of melanoma. Specifically, our aim was to use the candidate gene approach to discover the association of variations in the genetic profile of the redox enzymes with melanoma (Figure 1). Building upon this rationale, functional genetic variants, namely single nucleotide polymorphisms (SNPs), were identified in this study with a priori chance of being associated with the risk of melanoma based on the following criteria: (1) not a well-known somatic mutation found in tumors with an established causality; (2) presented strong associations with many other health conditions in humans; and (3) with a potential to alter normal protein function based on the nucleotide substitution. For instance, variant rs8031 in SOD2 was found to be associated with kidney complications in subjects with Type 1 diabetes [19]. Variant rs10951982 in RAC1 has been implied in the increased risk of hypertension [20]. Even though rs10951982 in RAC1 has not yet been reported in ROS-related malignancies, somatic mutations of RAC1 (e.g., RAC1P29S) were found in 9.2% of sun-exposed melanoma tumors [21,22].
With this genetic profiling information in hand, we hope to lay a foundation to identify those individuals predisposed to UV exposure and risk of melanoma. This in turn will contribute to a better primary prevention strategy, such as earlier-life behavioral precautions. To the best of our knowledge, our work was the first to use a hypothesis-driven and pathway-based approach to study the association between genetic variations in the ROS pathway and risk of melanoma.

2. Results

2.1. Study Participants

Gender and age distributions of melanoma patients and healthy controls are listed in Table 1. In total, 177 retrieved cases and 172 recruited controls were approximately matched for age groups and gender. Overall, there are higher percentages of female patients aged 19–39 (55.4%) and 40–59 (26.5%), while, at age 60 and older, there is a higher percentage of male patients (47.9%). This may reflect the actual sex ratios of melanoma incidence at different age groups [23]. Of particular note, cases were retrieved from the international Genes, Environment, and Melanoma (GEM) study, which may not be strictly generalizable to a broader melanoma patient population.
SNP candidates and their currently known disease associations are listed in 
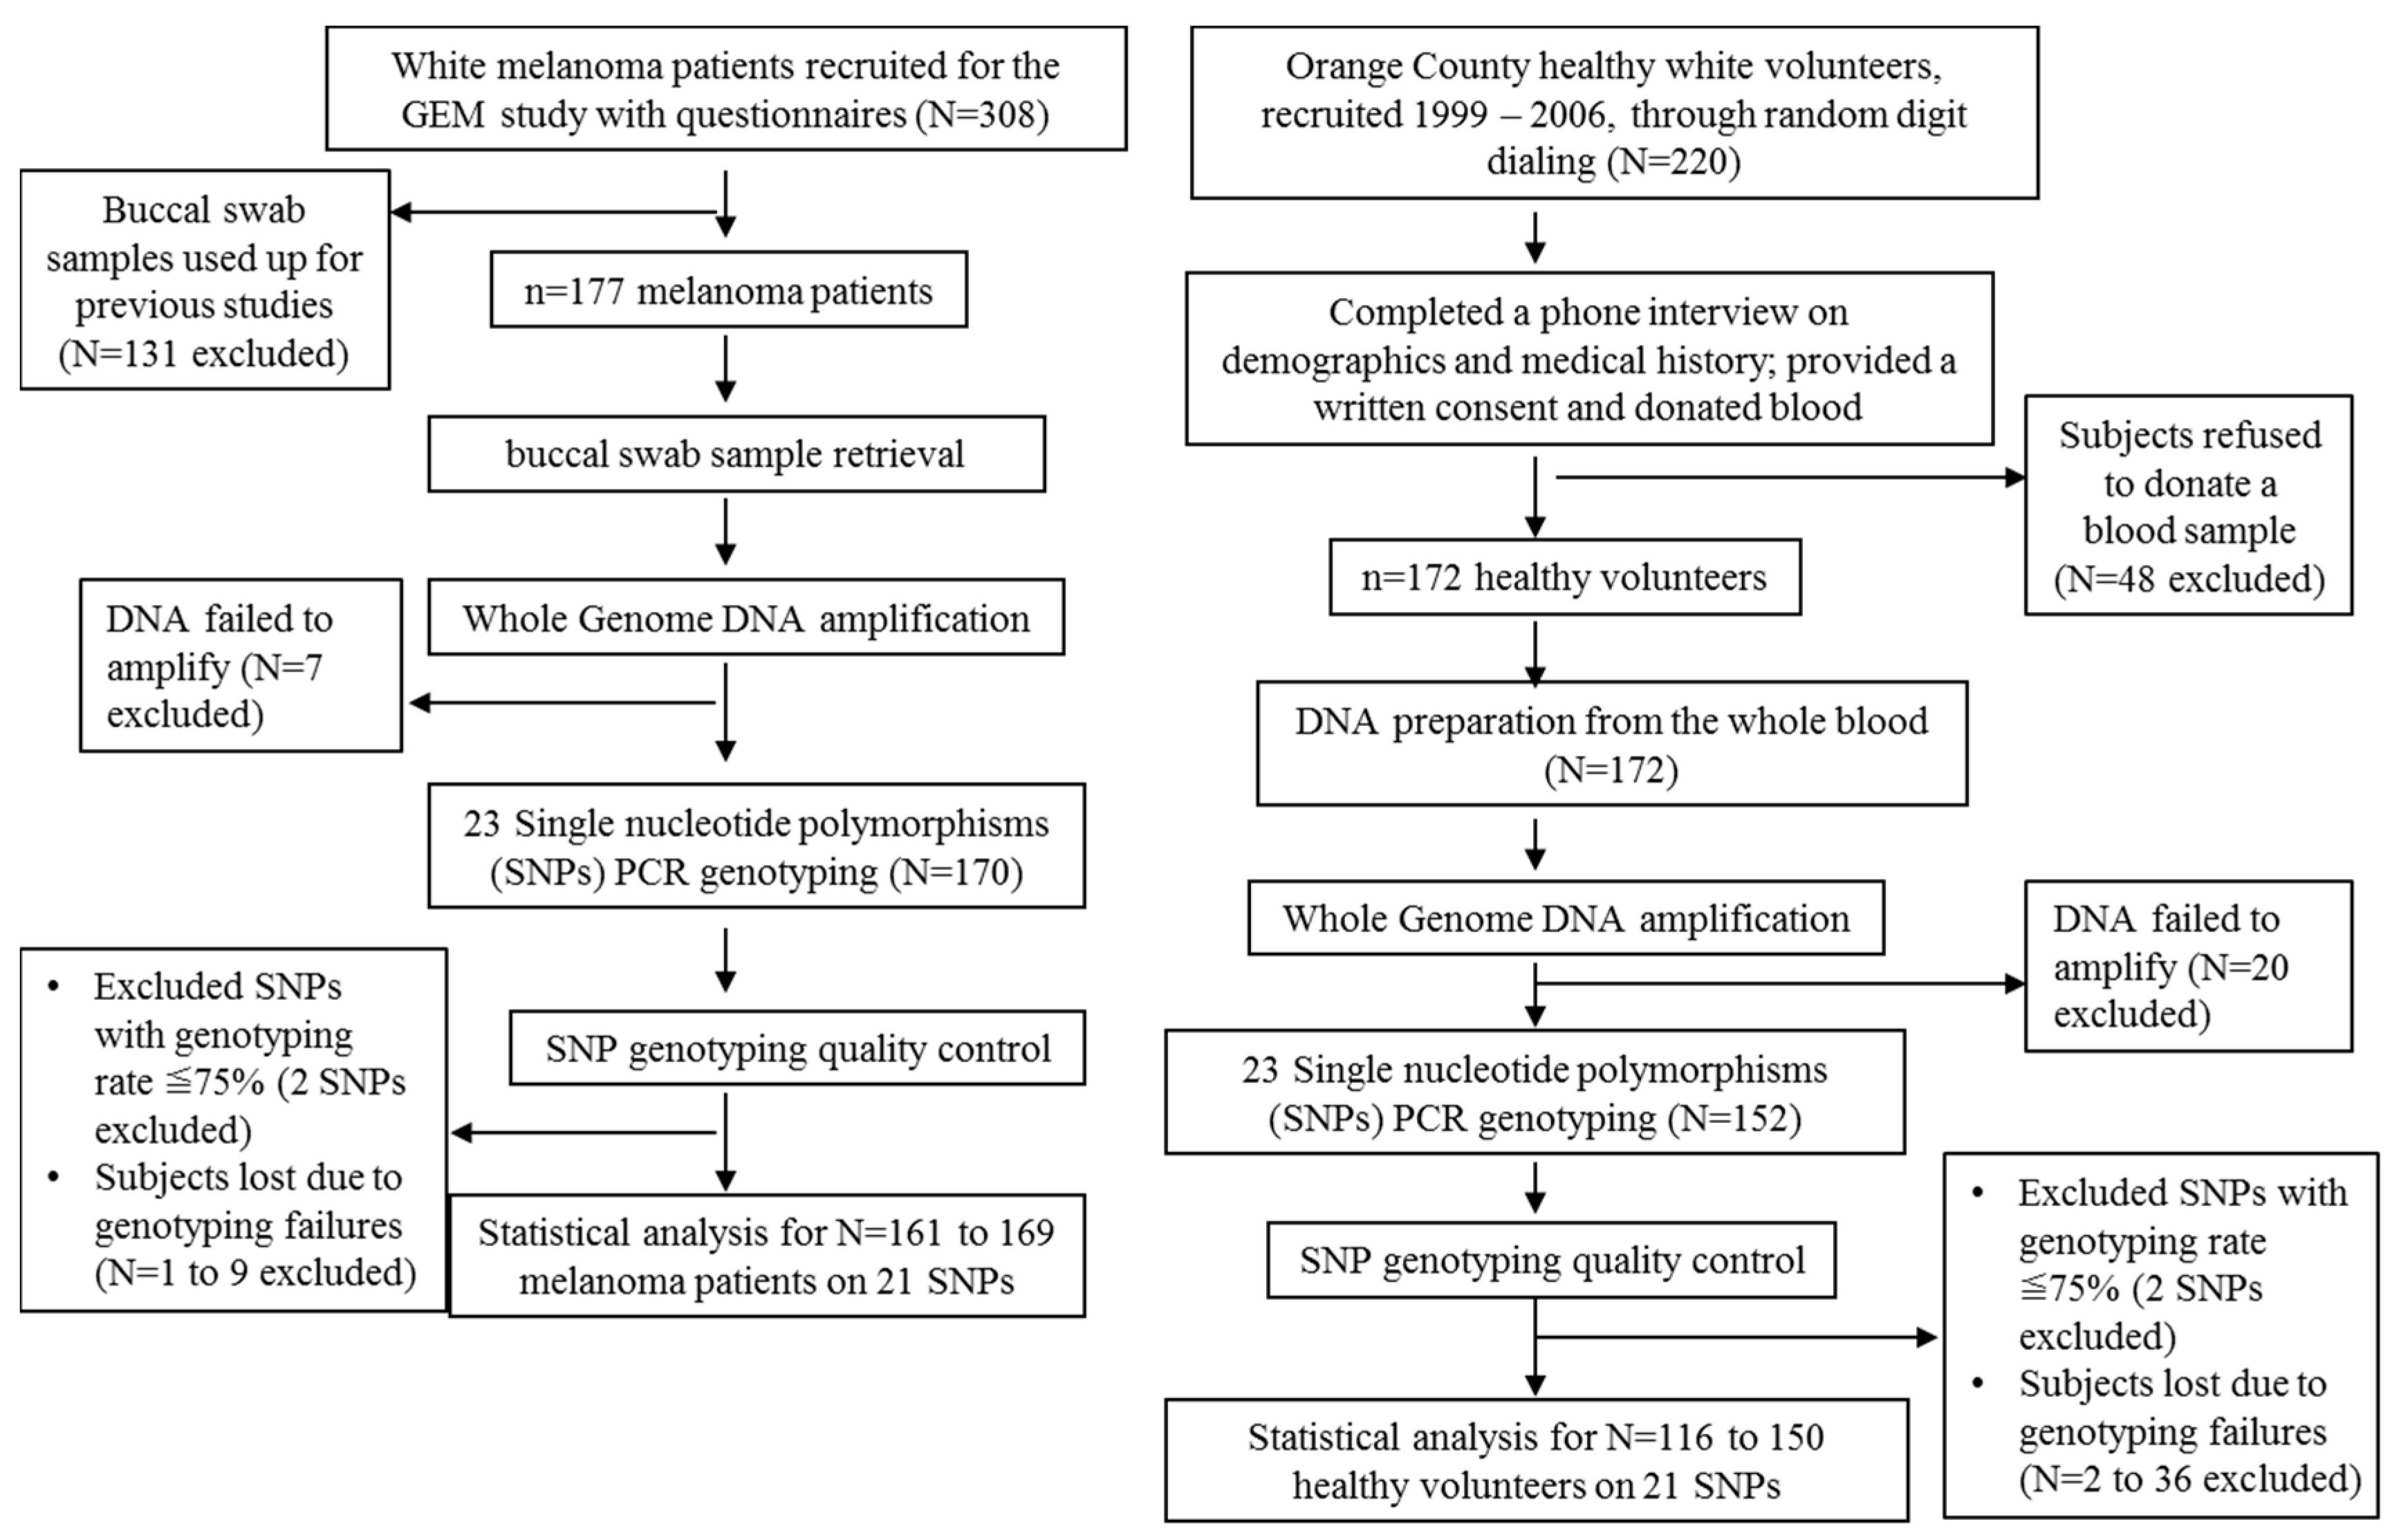
Table 2. Whole genome DNA amplification was successfully carried out in 322 study participants including 170 (96%) melanoma patients and 152 (88.4%) healthy controls (Figure 2). However, for each SNP, there were different number of failed genotyping samples due to poor PCR reaction, and the overall successful genotyping rates were between 66.4% and 98.7% in the controls, and between 78.8% and 99.4% in the cases. SNPs with genotyping rate less than 75% on either arm (case or control group) of the participants were thus excluded from further analyses (SNPs rs13306296 and rs585197 were excluded, Table 3). Ultimately, 161–169 melanoma patients, and 116–150 healthy controls remained to be further analyzed (Figure 2).

2.2. SNP Associations

Chi-square or Fisher’s exact test of independence was performed to identify SNP frequency differences between melanoma patients and healthy controls under genotypic, allelic, recessive, and dominant SNP models (Table 3). An exact test of genotype counts on Hardy–Weinberg equilibrium (HWE) was conducted to identify and exclude SNPs not in genotype balance in our study sample. Under the genotypic model, five SNPs exhibited statistically significant (p < 0.05) frequency differences between cases and controls: rs10951982 (RAC1), rs8031 (SOD2), rs2536512 (SOD3), rs4673 (CYBA), and rs1049255 (CYBA) (Table 3). The allelic model only determined three of them as being significant: rs10951982 (RAC1), rs8031 (SOD2), and rs2536512 (SOD3). These three alleles exhibited significance in the recessive model as well. In the dominant model, rs10951982 (RAC1), rs4673 (CYBA), and rs1049255 (CYBA) showed significance. The rs1001179 (CAT) showed a significant difference between cases and controls in the dominant and recessive models but the significance disappeared in the other two models.

2.3. Bivariate Logistic Regression Analyses

The top five SNPs identified from the genotypic model without HWE violations were fitted into bivariate logistic regressions with additive, recessive, and dominant allele models, respectively. The odds ratios of melanoma risk were calculated using the homozygous major allele genotype as the reference (Table 4). Odds ratios derived from the regression models were compared to a corrected significance level at 0.00238 (0.05/21) to justify for multiple comparisons among the remaining 21 SNP candidates. Odds ratios with p-values < 0.00238 were considered having statistical significance in the results.
In the additive allele model, carrying one copy of minor allele A in rs10951982 (RAC1) was significantly associated with a higher risk of melanoma (OR 8.98, 95% CI: 5.08, 16.44, p < 0.001), as compared to those who carried homozygous minor alleles AA (OR 8.23, 95% CI: 2.73, 28.39, p < 0.001). Dominant allele model further showed that combined minor allele copies (GA+AA) as compared to homozygous major alleles GG exhibited the highest risk of melanoma (OR 8.91, 95% CI: 5.09, 16.19, p < 0.001). A similar result was observed in rs4673 (CYBA), with one copy of the minor allele A exhibiting a higher risk of melanoma (OR 1.96, 95% CI: 1.23, 3.15, p = 0.005), and further confirmed in a dominant allele model (OR 1.84, 95% CI: 1.16, 2.92, p = 0.010). However, the p-values did not reach the corrected significance level of 0.00238.
The unadjusted odds of melanoma increased with homozygous minor allele T in rs1049255 (CYBA). TT exhibited an OR of 2.44 (95% CI: 1.27, 4.79, p = 0.008) in the additive model and an OR of 1.97 (95% CI: 1.10, 3.61, p = 0.022) in the recessive model. In both scenarios, p-values were greater than 0.00238, thus were non-significant because of the stringent Bonferroni correction for multiple comparison.
In contrast, homozygous minor allele genotypes at both rs8031 (SOD2) and rs2536512 (SOD3) exhibited significant association with a reduced risk of melanoma in the additive allele model, with 84% reduction in odds of melanoma (OR 0.16, 95% CI: 0.06, 0.39, p < 0.001) for rs8031 (SOD2), and 92% reduction in odds of melanoma (OR 0.08, 95% CI: 0.01, 0.31, p = 0.001) for rs2536512 (SOD3). Similar results were also observed in the recessive model, where an 85% reduction in the odds of melanoma (OR 0.15, 95% CI: 0.06, 0.33, p < 0.001) was observed for rs8031 (SOD2) with TT minor alleles, and a 91% reduction (OR 0.09, 95% CI: 0.01, 0.33, p = 0.002 with marginal significance) for rs2536512 (SOD3) with AA minor alleles.

2.4. Multivariate Logistic Regression Analyses

We continued to fit these top five SNPs into multivariate logistic regression under the three SNP models, controlling for major melanoma risk factors including gender, age at diagnosis, family history of melanoma, and lifetime ever-sunburned (Table 5). After adjusting for these risk factors, rs1049255 (CYBA), rs4673 (CYBA), rs8031 (SOD2), and rs2536512 (SOD3) were no longer associated with melanoma risk in all three models (p > 0.00238).
Consistent with what we have found in Table 4, the most significant genotype was heterozygous GA genotype in rs10951982 (RAC1), which exhibited an OR of 6.15 (95% CI: 2.98, 13.44, p < 0.001) after controlling for other risk factors. This minor allele also showed a significant association with melanoma risk in the dominant model (OR 5.79, 95% CI: 2.84, 12.51, p < 0.001). Similar results were also found for rs4673 (CYBA) but with only marginal significance. Heterozygous GA genotype was associated with an increased risk of melanoma (OR 2.17, 95% CI: 1.17, 4.07, p = 0.015), which was further confirmed in the dominant allele model (OR 1.88, 95% CI: 1.03, 3.47, p = 0.042), although the p-values did not reach the corrected significance level of 0.00238.
The homozygous minor allele TT genotype in rs8031 (SOD2) was found associated with a decreased risk of melanoma, with an OR of 0.32 (95% CI: 0.09, 0.94, p = 0.047) in the additive model, and an OR of 0.26 (95% CI: 0.08, 0.70, p = 0.011) in the recessive allele model, which indicated that homozygous minor alleles TT reduced the odds of melanoma by 74%, but neither of these results reached the universal significance level of 0.00238.

3. Discussion

After removal of SNP markers with high error rates during the assessment of genotyping quality, 21 SNP candidates remained to be eligible for the genetic association analysis. Eight SNPs showed significant association with melanoma but three of them were not in Hardy–Weinberg equilibrium, which may suggest that there are multiple alleles in the same locus, and we missed genotyping of other alleles. Therefore, only five SNP candidates showed genotypic significance and were further analyzed in regression models, including rs10951982 (RAC1), rs1049255 (CYBA), rs4673 (CYBA), rs8031 (SOD2), and rs2536512 (SOD3). We corrected the universal p-value to be compared with at 0.00238 (0.05/21, 21 SNPs being tested) to justify the multiple comparison issue in genetic association studies, using a Bonferroni approach [48,49]. The rs10951982 (RAC1) and rs4673 (CYBA) exhibited the highest increased risk of melanoma when presenting one copy of the minor allele in the unadjusted regression model, but rs4673 did not reach the universal significance level at 0.00238 in the multivariate regression model with adjustments for melanoma risk factors including age, sex, family history of melanoma, and lifetime ever-sunburned. Of particular note, a homozygous minor allele TT genotype in rs8031 (SOD2) was found to be associated with reduced risk of melanoma in the bivariate regression, however significance was lost in the multivariate regression analyses.
SOD2 is known to be a major superoxide detoxifying enzyme of cells, and therefore an altered function or expression of this enzyme may lead to unbalanced redox homeostasis and thus potentially increase or decrease the risk of melanoma [40]. Since SOD2 converts superoxide to hydrogen peroxide (Figure 1), which belongs to a type of ROS, the function of SOD2 is thus double-edged. Our multivariate analysis indicated that homozygous TT allele in rs8031 reduced the risk of melanoma, but little is currently known about the molecular function of this variant. We suggest a lab-based functional molecular biology study to unravel the discrepancy between zygote expression and enzymatic activity in this particular SNP.
SNPs rs1049255 and rs4673 in CYBA showed genotypic frequency differences between cases and controls in the unadjusted model (Table 4), with more patients carrying higher copies of minor alleles in rs1049255. Variant rs4673 changes the amino acid at position 72 from a tyrosine to a histidine (Y72H) of the CYBA (p22phox) protein, which is frequently referred to a C242T variant in the literature [50]. The T allele exhibited decreased dimerization with NOX and therefore may potentially reduce NOX activity and cellular ROS level [32]. In fact, the CT and TT genotype showed lower NADPH oxidase activity in hypertensive patients as compared with CC genotype [51]. However, opposite observation was also reported, where the CT genotype and T allele are associated with higher risk of coronary artery disease [52]. In our study, the CT and TT (GA and AA) showed higher risk for melanoma as compared to CC (GG) allele (the dominant model in Table 4 and Table 5). This observation needs further validation. Variant rs1049255 is located in the 3′ untranslated region (3′ UTR) of the CYBA gene. Although the molecular function of this SNP is unknown, current understanding of 3′ UTR is an important miRNA binding site, and SNPs located in this region might have the potential to regulate mRNA stability and translation efficiency [53,54].
RAC1-GTPase is an NOX1 activator which promotes binding of NOX1 with its subunits and forms the complete enzyme complex [55,56,57]. NOX1 was one of the first cellular molecules found to be directly regulated by RAC1 in the phagocytic process [58,59,60]. However, SNP rs10951982 in RAC1 alone has not been reported in any ROS-related activities thus far. Information on the function of this locus and its association with any malignancy is limited in the current literature. Nevertheless, this variant has been reported to be associated with over-reactive immune diseases and an increased risk of hypertension [20,35,36,61]. Considering that CYBA variants have been widely studied in cardiovascular diseases, including coronary heart disease [34] and hypertension [33], which are tightly associated with increased levels of ROS, RAC1 rs10951982 may also play a part in inducing oxidative stress. Since rs10951982 is the most significant variant in our current study, and in lieu of its function in immune diseases as well as a potential role in NOX1-induced oxidative stress, our discovery might not only suggest an inflammatory microenvironment created by RAC1 that is in favor of melanoma progression [62], but also indicate an elevation of ROS level via RAC1 in melanoma etiology. In addition, RAC1 is also a crucial kinase in the NRAS and PI3K pathway [63], both of which are key melanoma oncogenic pathways. Therefore, it is possible that RAC1 plays a non-ROS role and impacts these other oncogenic pathways.
Overall, of the three significant SNPs after adjustment against age, sex, family history and life time sun burn history, the minor allele of RAC1 rs10951982 (the A allele) showed a consistent role with an increase ROS and thus increased melanoma risk. The minor allele of rs4673 (the A allele) was reported controversial role in ROS association [51,64], it may exhibit certain cell-specific effects. In our study, the minor allele showed higher risk for melanoma in a dominant model. The minor allele of rs8031 (the T allele) exhibited a protective role against melanoma risk in a recessive model. It is unclear how this allele modifies ROS levels. Based on our results, the T allele can be associated with either increased or decreased SOD activities as SOD2 is double-edged and can play dual roles in ROS metabolism.
Of particular note, in our regression models, we applied the most common ways of disease transmission, namely additive, recessive, and dominant modes, in our analyses. This was because we did not want to make any assumptions of the disease transmission modes. According to Sham and Purcell [49], a test that assumed additive effects would have greater power than a test that also allowed dominance, if the true effects at the locus were indeed additive and did not show dominance. Conversely, if the underlying causal variant was recessive, then power would be lost by carrying out an analysis that assumed additively. If there was uncertainty regarding the true pattern of effects at a locus, then it might be appropriate to use several statistical tests to ensure adequate statistical power for all possible scenarios. We therefore included results from these additional models that may provide more information and maintain statistical power as well. Although the covariates were not presented as part of the results in our tables, family history of melanoma and lifetime ever-sunburned controlled in the multivariate models consistently showed statistical significance, whereas sex and age did not. Family history of melanoma [23], along with fair skin, light hair and eye color are known melanoma genetic risk factors, whereas the levels of sun exposure including sunburns and moles or freckles are important environmental risk factors for melanoma [65]. The statistical significance of the covariates might indicate a mediating role in our primary study interest, from the susceptible familial genetic makeup of these participants, as well as the behavior or attitude towards sun exposure that resulted in getting sunburns or freckles.
Our study had a few limitations. First, the small sample size does not always provide sufficient power [66]. Second, by the experimental design, we could only genotype two alleles. Therefore, loci with multiple alleles may not show HWE and must be excluded for analysis. Third, our study participants included only those white individuals from the southern California area, and therefore a loss of generalizability to the broader white population might be expected. Last, a common limitation of case-control studies is that the results provide only an association with risk, but they are not necessarily connected to causality. Replicating findings from another dataset is a common strategy to validate the results identified in our current study. However, even with the most stringent statistical design, SNP findings are usually hard to replicate [48,49]. Multiple reasons are considered, such as there are still unknown and uncontrolled confounders, multiple comparisons only lead to chance findings, the gene and environment interaction is not easy to account for, and the target allele is in linkage disequilibrium with the identified allele but the chance finding failed to locate the target allele and thus make replication difficult to achieve. Nevertheless, we will still validate our findings in a separate dataset in our next study, as our ultimate goal is to develop useful markers in prevention.
To conclude, our initial analyses revealed an increased risk of melanoma associated with rs10951982 (RAC1), and a decreased risk associated with rs8031 (SOD2). Multivariate analyses further confirmed the association of an increased risk of melanoma with rs10951982 (RAC1). Our results highlighted the importance of RAC1 enzyme and cellular oxidation-metabolizing efficiency controlled by SOD2 in association with ROS-mediated risk of melanoma. We suggest that these results shall be further validated with the goal of designing novel screening targets to identify highly UV-susceptible individuals, particularly in the RAC1 and SOD2 genes, in order to take the melanoma primary prevention strategy to a precision level.

4. Materials and Methods

4.1. Ethics Statement

We obtained approval from the Institutional Review Board of the University of California Irvine Office of Research (protocol number 2011-8238, approved 27 June 2011).

4.2. Study Population

Our study subjects were adopted from a previously designed case-control study (the international Genes, Environment, and Melanoma study, the GEM study), although we made considerable modifications. The original GEM case-control study compared white multiple melanomas patients to primary melanoma patients [67]. In total, 177 patients were recruited between 1998 and 2003 in the southern California area as part of the GEM study, and consent forms were obtained accordingly [67]. In our study, we used both of these patients as our cases and we recruited additional healthy participants as controls. Healthy white volunteers from Orange County were recruited through random-digit-dialing by trained interviewers during 1999 to 2006.
Demographic information regarding age, sex, family history of melanoma, and lifetime sun exposure were recorded via in-person questionnaires and phone interviews, with written consents from the patients and their physicians [67,68,69,70,71,72,73]. Random-digit-dialing healthy respondents completed eligibility screening questions over the phone, including being Orange County residents and having no personal history of melanoma or any other types of cancer. Eligible respondents were asked for their verbal informed consents for a 20 min standardized phone interview [67], in which they were asked questions about basic demographics, personal medical history, and family cancer history. In total, 172 participants further agreed to donate a blood sample. A phlebotomist obtained written consents from these participants while performing the blood draw [67]. Participation rate after phone eligibility screening was approximately 78%. Population-based controls were frequency-matched to cases with respect to sex and age (Table 1).

4.3. DNA Extraction

Buccal cells from melanoma patients and whole blood cells from healthy participants were re-suspended in a phosphate-buffered saline system. Ten microliters of the cell suspension were used directly as a template for whole genome amplification (WGA). The WGA procedure was conducted following the manufacturer’s instruction from Sigma. In brief, a cell suspension (10 μL each) was heated to 95 °C for 5 min in a PCR machine in a strip of PCR tubes and cooled down on ice. One microliter of 10× Fragmentation Buffer was added to each tube. Tubes were then heated again in a PCR machine at 95 °C for exactly 4 min. Samples were cooled down on ice immediately and then centrifuged briefly to consolidate the contents. Out of 70 μL of the amplified sample, 6 μL was mixed with 1 μL of 6× loading buffer and directly used to load on an agarose DNA gel containing ethidium bromide. DNA was visualized under a UV lamp and water was used as a non-DNA negative control to compare with the presence of the visualized DNA product. Participants with little to no whole genome amplified DNA product were excluded from SNP genotyping (7 patients and 20 healthy controls were excluded, Figure 2).

4.4. SNP Candidates

Functional SNPs were selected from a publicly available SNP database (dbSNP, NCBI) that have been found correlated with other diseases, based on the three criteria listed in the introduction (Table 2). In brief, 6 SNPs in the coding region of NOX1 appeared in dbSNP. We were interested in D360N (rs34688635) and R315H (rs2071756) variants for the following reasons: (1) D360 is shared in NOX1, -2, -3, and -4 [25], and conserved in various species including fish, mouse, bird, amphibian, and man [9]; and (2) 315H allele was found associated with diabetic patients, suggesting that this is a functional allele and may be associated with other disease risks [24]. SNPs rs585197 and rs2164521 in NOX4 have been linked to a protective effect on Hepatopulmonary Syndrome [27]; and rs11018628 has a possible effect on plasma homocysteine level [26]. −930A > G in CYBA promoter region (rs9932581) affects gene transcription activity and has been found to be associated with coronary heart disease due to ROS involvement in the pathogenesis of atherosclerosis [28]. Similarly, increased or decreased risks of hypertension [33] and coronary heart disease [34], respectively, have been found in CYBA alleles rs4673, rs13306296, and rs1049255. CYBA rs3180279 has been related to non-Hodgkin lymphoma prognosis [13]. Three SNPs, rs10951982, rs4720672, and rs836478 in RAC1, have been associated with risks in hypertension, inflammatory bowel disease, and end-stage renal disease [20,35,36,61]. Although these loci in RAC1 have not yet been discussed in ROS-related malignancies, RAC1 is a well-known melanoma oncogene with constantly activated mutations in some melanoma tumors [74,75].
SNPs in the three subtypes of SOD and CAT genes have been widely studied with various disease associations. For instance, rs7277748 and rs4998557 variants in SOD1 (Cu-ZnSOD) were found to cause amyotrophic lateral sclerosis. Ile58Thr (rs1141718) in SOD2 (MnSOD) severally impaired SOD2 enzymatic activity [40], while a variant of rs8031 increased oxidative stress [44]. V16A variant rs4880 in SOD2 impaired mitochondrial importing and was found to be a risk factor for prostate cancer [12], whereas rs2758330 showed a protective effect on prostate cancer [45]. Variants rs2536512 and rs699473 in SOD3 were associated with brain diseases, including cerebral infarction [14] and brain tumor [15]. The rs1001179 in CAT was also correlated to brain malignancy [15]. Additionally, −262C > T (rs1049982) variant in CAT showed a decreased interaction with HIF1α upon oxidative stress stimulation [46,47] (Table 2).

4.5. SNP Genotyping

SNP genotyping polymerase chain reaction (PCR) assay kit was purchased from Life Technologies™ (Carlsbad, CA, USA). Allele-specific primers and probe sets for each SNP were also purchased from Life Technologies™, either custom-designed or from the library. DNA sample per participant was genotyped for every SNP in duplicates to ensure accuracy. About 97% of the SNPs were replicable. By definition, if one allele was amplified during PCR reaction, the call for that SNP assay was homozygous alleles (inherited the same alleles from both parents); if both alleles were amplified, the call for that SNP assay was heterozygous alleles (inherited different alleles from the parents). However, if no significant PCR amplification for either allele was observed, then the SNP assay was defined as N/A (genotyping failure) due to no reaction to the designed allele primers and probe. SNPs with genotyping rate < 75% were excluded from statistical analysis (SNPs rs13306296 and rs585197 were excluded from further analysis, Table 3). SNPs with inconsistent duplicated results were validated manually by reading the raw real-time PCR amplification plots, or through additional genotyping reactions.

4.6. SNP Quality Control

The raw PCR amplification data was analyzed by QuantStudio™ (Thermo Fisher Scientific Inc., Huntington Beach, CA, USA) Real-Time PCR software (v1.2). Those duplicated samples presenting identical calls were automatically determined by the software. However, if the calls were made differently between duplicates, or, in some rare cases, if the calls were “undetermined” by the software, then the individual PCR amplification plots were read manually and subjectively. Any amplification curve appearing after 20 cycles of PCR, and being at least two-fold elevated from the threshold was determined as presenting a positive PCR amplification curve. Genotyping failure was assigned as N/A if no clear PCR amplification curve was observed.

4.7. Statistics

Allele frequency was determined by making counts of the participants based on different SNP conditions: genotypic, allelic, recessive, and dominant models. Chi-square or Fisher’s exact test of independence was performed to examine the associations between SNP conditions and melanoma case-control status. Two-sided statistical significance level by default was set to be 0.05 (5%), and, to justify for multiple comparison among the SNP candidates, universal significance level was further adjusted to 0.05 divided by the number of final SNP candidates being tested, which was 0.05/21 = 0.00238, applying the most stringent Bonferroni approach [48,49]. Participant numbers varied among SNPs due to different genotyping rates, and only complete data was used for statistical analysis (participants with N/A data were excluded per SNP analysis). Bivariate simple logistic regression models showing the unadjusted associations between the binary response variable (melanoma cases vs. controls) and primary study variables of interest (SNPs) were conducted separately based on additive, recessive, and dominant allele models. Dummy variables of the SNPs in the three allele models were created by default, making genotype with homozygous major alleles as the reference to compare with. Odds ratios and 95% confidence intervals were calculated accordingly in RStudio (v0.99.893). Adjusted associations between SNPs and melanoma status were analyzed by fitting multivariate logistic regression models with the three allele models separately, controlling for known melanoma risk factors, including gender [76], age at diagnosis [77], family history of melanoma [23], and ever sunburned [78]. Genotypic Hardy–Weinberg equilibrium exact test, which examines the expected frequencies of genotypes if mating is non-assortative and there are no mutations from one allele to another, was carried out by using R package HardyWeinberg. In brief, a two-sided test was performed on genotype counts, whether an excess or a dearth of heterozygotes counts as evidence (p < 0.05) against Hardy–Weinberg equilibrium.

Acknowledgments

This study was supported by NCI/NIH K07 grant to Feng Liu-Smith (CA 160756). Tze-An Yuan was supported by the UCI Public Health Graduate Program.

Author Contributions

Feng Liu-Smith conceived and designed the experiments; Vandy Yourk and Ali Farhat performed the experiments; Tze-An Yuan and Argyrios Ziogas analyzed the data; Hoda Anton-Culver and Frank L. Meyskens contributed materials; and Tze-An Yuan and Feng Liu-Smith wrote the paper.

Conflicts of Interest

The authors declare no conflict of interest. The founding sponsors had no role in the design of the study; in the collection, analyses, or interpretation of data; in the writing of the manuscript, and in the decision to publish the results.

Abbreviations

UVUltraviolet
ROSReactive oxygen species
SNPSingle nucleotide polymorphism
NOXNADPH oxidase
SODSuperoxide dismutase
CATCatalase
OROdds ratio
HWEHardy–Weinberg equilibrium

References

  1. D’Orazio, J.; Jarrett, S.; Amaro-Ortiz, A.; Scott, T. UV radiation and the skin. Int. J. Mol. Sci. 2013, 14, 12222–12248. [Google Scholar] [CrossRef] [PubMed]
  2. Kobayashi, N.; Nakagawa, A.; Muramatsu, T.; Yamashina, Y.; Shirai, T.; Hashimoto, M.W.; Ishigaki, Y.; Ohnishi, T.; Mori, T. Supranuclear melanin caps reduce ultraviolet induced DNA photoproducts in human epidermis. J. Investig. Dermatol. 1998, 110, 806–810. [Google Scholar] [CrossRef] [PubMed]
  3. Raad, H.; Serrano-Sanchez, M.; Harfouche, G.; Mahfouf, W.; Bortolotto, D.; Bergeron, V.; Kasraian, Z.; Dousset, L.; Hosseini, M.; Taieb, A.; et al. NADPH oxidase-1 plays a key role in keratinocyte responses to ultraviolet radiation and UVB-induced skin carcinogenesis. J. Investig. Dermatol. 2017. [Google Scholar] [CrossRef] [PubMed]
  4. Premi, S.; Wallisch, S.; Mano, C.M.; Weiner, A.B.; Bacchiocchi, A.; Wakamatsu, K.; Bechara, E.J.; Halaban, R.; Douki, T.; Brash, D.E. Photochemistry. Chemiexcitation of melanin derivatives induces DNA photoproducts long after UV exposure. Science 2015, 347, 842–847. [Google Scholar] [CrossRef] [PubMed]
  5. Liu-Smith, F.; Poe, C.; Farmer, P.J.; Meyskens, F.L., Jr. Amyloids, melanins and oxidative stress in melanomagenesis. Exp. Dermatol. 2015, 24, 171–174. [Google Scholar] [CrossRef] [PubMed]
  6. Liu-Smith, F. Reactive Oxygen Species in Melanoma Etiology. In Reactive Oxygen Species in Biology and Human Health; Shamim, A., Ed.; CRC Press: Boca Raton, FL, USA, 2016; pp. 259–275. [Google Scholar]
  7. Liu-Smith, F.; Dellinger, R.; Meyskens, F.L., Jr. Updates of reactive oxygen species in melanoma etiology and progression. Arch. Biochem. Biophys. 2014, 563, 51–55. [Google Scholar] [CrossRef] [PubMed]
  8. Liu, F.; Garcia, A.M.G.; Meyskens, F.L. NADPH Oxidase 1 Overexpression Enhances Invasion via Matrix Metalloproteinase-2 and Epithelial-Mesenchymal Transition in Melanoma Cells. J. Investig. Dermatol. 2012, 132, 2033–2041. [Google Scholar] [CrossRef] [PubMed]
  9. Kawahara, T.; Quinn, M.T.; Lambeth, J.D. Molecular evolution of the reactive oxygen-generating NADPH oxidase (Nox/Duox) family of enzymes. BMC Evol. Biol. 2007, 7, 109. [Google Scholar] [CrossRef] [PubMed]
  10. Hodis, E.; Watson, I.R.; Kryukov, G.V.; Arold, S.T.; Imielinski, M.; Theurillat, J.P.; Nickerson, E.; Auclair, D.; Li, L.; Place, C.; et al. A landscape of driver mutations in melanoma. Cell 2012, 150, 251–263. [Google Scholar] [CrossRef] [PubMed]
  11. Cheng, G.; Diebold, B.A.; Hughes, Y.; Lambeth, J.D. Nox1-dependent reactive oxygen generation is regulated by Rac1. J. Biol. Chem. 2006, 281, 17718–17726. [Google Scholar] [CrossRef] [PubMed]
  12. Kang, D.; Lee, K.M.; Park, S.K.; Berndt, S.I.; Peters, U.; Reding, D.; Chatterjee, N.; Welch, R.; Chanock, S.; Huang, W.Y.; et al. Functional variant of manganese superoxide dismutase (SOD2 V16A) polymorphism is associated with prostate cancer risk in the prostate, lung, colorectal, and ovarian cancer study. Cancer Epidemiol. Biomark. Prev. 2007, 16, 1581–1586. [Google Scholar] [CrossRef] [PubMed]
  13. Hoffmann, M.; Schirmer, M.A.; Tzvetkov, M.V.; Kreuz, M.; Ziepert, M.; Wojnowski, L.; Kube, D.; Pfreundschuh, M.; Trumper, L.; Loeffler, M.; et al. A Functional Polymorphism in the NAD(P)H Oxidase Subunit CYBA Is Related to Gene Expression, Enzyme Activity, and Outcome in Non-Hodgkin Lymphoma. Cancer Res. 2010, 70, 2328–2338. [Google Scholar] [CrossRef] [PubMed]
  14. Naganuma, T.; Nakayama, T.; Sato, N.; Fu, Z.; Soma, M.; Aoi, N.; Hinohara, S.; Doba, N.; Usami, R. Association of extracellular superoxide dismutase gene with cerebral infarction in women: A haplotype-based case-control study. Hereditas 2008, 145, 283–292. [Google Scholar] [CrossRef] [PubMed]
  15. Rajaraman, P.; Hutchinson, A.; Rothman, N.; Black, P.M.; Fine, H.A.; Loeffler, J.S.; Selker, R.G.; Shapiro, W.R.; Linet, M.S.; Inskip, P.D. Oxidative response gene polymorphisms and risk of adult brain tumors. Neuro Oncol. 2008, 10, 709–715. [Google Scholar] [CrossRef] [PubMed]
  16. Case, A.J.; Li, S.; Basu, U.; Tian, J.; Zimmerman, M.C. Mitochondrial-localized NADPH oxidase 4 is a source of superoxide in angiotensin II-stimulated neurons. Am. J. Physiol. Heart Circ. Physiol. 2013, 305, H19–H28. [Google Scholar] [CrossRef] [PubMed]
  17. Pal, A.; Alam, S.; Mittal, S.; Arjaria, N.; Shankar, J.; Kumar, M.; Singh, D.; Pandey, A.K.; Ansari, K.M. UVB irradiation-enhanced zinc oxide nanoparticles-induced DNA damage and cell death in mouse skin. Mutat. Res. Genet. Toxicol. Environ. Mutagen. 2016, 807, 15–24. [Google Scholar] [CrossRef] [PubMed]
  18. Dellinger, R.W.; Liu-Smith, F.; Meyskens, F.L., Jr. Continuing to illuminate the mechanisms underlying UV-mediated melanomagenesis. J. Photochem. Photobiol. B Biol. 2014, 138, 317–323. [Google Scholar] [CrossRef] [PubMed]
  19. Mohammedi, K.; Bellili-Munoz, N.; Driss, F.; Roussel, R.; Seta, N.; Fumeron, F.; Hadjadj, S.; Marre, M.; Velho, G. Manganese superoxide dismutase (SOD2) polymorphisms, plasma advanced oxidation protein products (AOPP) concentration and risk of kidney complications in subjects with type 1 diabetes. PLoS ONE 2014, 9, e96916. [Google Scholar] [CrossRef] [PubMed]
  20. Tapia-Castillo, A.; Carvajal, C.A.; Campino, C.; Vecchiola, A.; Allende, F.; Solari, S.; Garcia, L.; Lavanderos, S.; Valdivia, C.; Fuentes, C.; et al. Polymorphisms in the RAC1 gene are associated with hypertension risk factors in a Chilean pediatric population. Am. J. Hypertens. 2014, 27, 299–307. [Google Scholar] [CrossRef] [PubMed]
  21. Dulak, A.M.; Stojanov, P.; Peng, S.; Lawrence, M.S.; Fox, C.; Stewart, C.; Bandla, S.; Imamura, Y.; Schumacher, S.E.; Shefler, E.; et al. Exome and whole-genome sequencing of esophageal adenocarcinoma identifies recurrent driver events and mutational complexity. Nat. Genet. 2013, 45, 478–486. [Google Scholar] [CrossRef] [PubMed]
  22. Krauthammer, M.; Kong, Y.; Ha, B.H.; Evans, P.; Bacchiocchi, A.; McCusker, J.P.; Cheng, E.; Davis, M.J.; Goh, G.; Choi, M.; et al. Exome sequencing identifies recurrent somatic RAC1 mutations in melanoma. Nat. Genet. 2012, 44, 1006–1014. [Google Scholar] [CrossRef] [PubMed]
  23. Liu, F.; Bessonova, L.; Taylor, T.H.; Ziogas, A.; Meyskens, F.L., Jr.; Anton-Culver, H. A unique gender difference in early onset melanoma implies that in addition to ultraviolet light exposure other causative factors are important. Pigment Cell Melanoma Res. 2013, 26, 128–135. [Google Scholar] [CrossRef] [PubMed]
  24. Lim, S.C.; Liu, J.J.; Low, H.Q.; Morgenthaler, N.G.; Li, Y.; Yeoh, L.Y.; Wu, Y.S.; Goh, S.K.; Chionh, C.Y.; Tan, S.H.; et al. Microarray analysis of multiple candidate genes and associated plasma proteins for nephropathy secondary to type 2 diabetes among Chinese individuals. Diabetologia 2009, 52, 1343–1351. [Google Scholar] [CrossRef] [PubMed]
  25. O’Neill, S.; Brault, J.; Stasia, M.J.; Knaus, U.G. Genetic disorders coupled to ROS deficiency. Redox Biol. 2015, 6, 135–156. [Google Scholar] [CrossRef] [PubMed]
  26. Pare, G.; Chasman, D.I.; Parker, A.N.; Zee, R.R.; Malarstig, A.; Seedorf, U.; Collins, R.; Watkins, H.; Hamsten, A.; Miletich, J.P.; et al. Novel associations of CPS1, MUT, NOX4, and DPEP1 with plasma homocysteine in a healthy population: A genome-wide evaluation of 13,974 participants in the Women’s Genome Health Study. Circ. Cardiovasc. Genet. 2009, 2, 142–150. [Google Scholar] [CrossRef] [PubMed]
  27. Roberts, K.E.; Kawut, S.M.; Krowka, M.J.; Brown, R.S., Jr.; Trotter, J.F.; Shah, V.; Peter, I.; Tighiouart, H.; Mitra, N.; Handorf, E.; et al. Genetic risk factors for hepatopulmonary syndrome in patients with advanced liver disease. Gastroenterology 2010, 139, 130–139. [Google Scholar] [CrossRef] [PubMed]
  28. Niemiec, P.; Nowak, T.; Iwanicki, T.; Krauze, J.; Gorczynska-Kosiorz, S.; Grzeszczak, W.; Ochalska-Tyka, A.; Zak, I. The-930A > G polymorphism of the CYBA gene is associated with premature coronary artery disease. A case-control study and gene-risk factors interactions. Mol. Biol. Rep. 2014, 41, 3287–3294. [Google Scholar] [CrossRef] [PubMed]
  29. San Jose, G.; Moreno, M.U.; Olivan, S.; Beloqui, O.; Fortuno, A.; Diez, J.; Zalba, G. Functional effect of the p22phox-930A/G polymorphism on p22phox expression and NADPH oxidase activity in hypertension. Hypertension 2004, 44, 163–169. [Google Scholar] [CrossRef] [PubMed]
  30. Li, A.; Prasad, A.; Mincemoyer, R.; Satorius, C.; Epstein, N.; Finkel, T.; Quyyumi, A.A. Relationship of the C242T p22phox gene polymorphism to angiographic coronary artery disease and endothelial function. Am. J. Med. Genet. 1999, 86, 57–61. [Google Scholar] [CrossRef]
  31. Wyche, K.E.; Wang, S.S.; Griendling, K.K.; Dikalov, S.I.; Austin, H.; Rao, S.; Fink, B.; Harrison, D.G.; Zafari, A.M. C242T CYBA polymorphism of the NADPH oxidase is associated with reduced respiratory burst in human neutrophils. Hypertension 2004, 43, 1246–1251. [Google Scholar] [CrossRef] [PubMed]
  32. Guzik, T.J.; West, N.E.; Black, E.; McDonald, D.; Ratnatunga, C.; Pillai, R.; Channon, K.M. Functional effect of the C242T polymorphism in the NAD(P)H oxidase p22phox gene on vascular superoxide production in atherosclerosis. Circulation 2000, 102, 1744–1747. [Google Scholar] [CrossRef] [PubMed]
  33. Moreno, M.U.; San Jose, G.; Fortuno, A.; Beloqui, O.; Redon, J.; Chaves, F.J.; Corella, D.; Diez, J.; Zalba, G. A novel CYBA variant, the -675A/T polymorphism, is associated with essential hypertension. J. Hypertens. 2007, 25, 1620–1626. [Google Scholar] [CrossRef] [PubMed]
  34. Gardemann, A.; Mages, P.; Katz, N.; Tillmanns, H.; Haberbosch, W. The p22 phox A640G gene polymorphism but not the C242T gene variation is associated with coronary heart disease in younger individuals. Atherosclerosis 1999, 145, 315–323. [Google Scholar] [CrossRef]
  35. Muise, A.M.; Walters, T.; Xu, W.; Shen-Tu, G.; Guo, C.H.; Fattouh, R.; Lam, G.Y.; Wolters, V.M.; Bennitz, J.; van Limbergen, J.; et al. Single nucleotide polymorphisms that increase expression of the guanosine triphosphatase RAC1 are associated with ulcerative colitis. Gastroenterology 2011, 141, 633–641. [Google Scholar] [CrossRef] [PubMed] [Green Version]
  36. Lev-Tzion, R.; Renbaum, P.; Beeri, R.; Ledder, O.; Mevorach, R.; Karban, A.; Koifman, E.; Efrati, E.; Muise, A.M.; Chowers, Y.; et al. Rac1 Polymorphisms and Thiopurine Efficacy in Children With Inflammatory Bowel Disease. J. Pediatr. Gastroenterol. Nutr. 2015, 61, 404–407. [Google Scholar] [CrossRef] [PubMed]
  37. Saeed, M.; Yang, Y.; Deng, H.X.; Hung, W.Y.; Siddique, N.; Dellefave, L.; Gellera, C.; Andersen, P.M.; Siddique, T. Age and founder effect of SOD1 A4V mutation causing ALS. Neurology 2009, 72, 1634–1639. [Google Scholar] [CrossRef] [PubMed]
  38. Nyaga, S.G.; Lohani, A.; Jaruga, P.; Trzeciak, A.R.; Dizdaroglu, M.; Evans, M.K. Reduced repair of 8-hydroxyguanine in the human breast cancer cell line, HCC1937. BMC Cancer 2006, 6, 297. [Google Scholar] [CrossRef] [PubMed]
  39. Oestergaard, M.Z.; Tyrer, J.; Cebrian, A.; Shah, M.; Dunning, A.M.; Ponder, B.A.; Easton, D.F.; Pharoah, P.D. Interactions between genes involved in the antioxidant defence system and breast cancer risk. Br. J. Cancer 2006, 95, 525–531. [Google Scholar] [CrossRef] [PubMed]
  40. Holley, A.K.; Bakthavatchalu, V.; Velez-Roman, J.M.; St Clair, D.K. Manganese superoxide dismutase: Guardian of the powerhouse. Int. J. Mol. Sci. 2011, 12, 7114–7162. [Google Scholar] [CrossRef] [PubMed]
  41. Mollsten, A.; Marklund, S.L.; Wessman, M.; Svensson, M.; Forsblom, C.; Parkkonen, M.; Brismar, K.; Groop, P.H.; Dahlquist, G. A functional polymorphism in the manganese superoxide dismutase gene and diabetic nephropathy. Diabetes 2007, 56, 265–269. [Google Scholar] [CrossRef] [PubMed]
  42. Han, J.; Colditz, G.A.; Hunter, D.J. Manganese superoxide dismutase polymorphism and risk of skin cancer (United States). Cancer Causes Control 2007, 18, 79–89. [Google Scholar] [CrossRef] [PubMed]
  43. Rajaraman, P.; Wang, S.S.; Rothman, N.; Brown, M.M.; Black, P.M.; Fine, H.A.; Loeffler, J.S.; Selker, R.G.; Shapiro, W.R.; Chanock, S.J.; et al. Polymorphisms in apoptosis and cell cycle control genes and risk of brain tumors in adults. Cancer Epidemiol. Biomark. Prev. 2007, 16, 1655–1661. [Google Scholar] [CrossRef] [PubMed]
  44. Rodrigues, P.; de Marco, G.; Furriol, J.; Mansego, M.L.; Pineda-Alonso, M.; Gonzalez-Neira, A.; Martin-Escudero, J.C.; Benitez, J.; Lluch, A.; Chaves, F.J.; et al. Oxidative stress in susceptibility to breast cancer: Study in Spanish population. BMC Cancer 2014, 14, 861. [Google Scholar] [CrossRef] [PubMed] [Green Version]
  45. Abe, M.; Xie, W.; Regan, M.M.; King, I.B.; Stampfer, M.J.; Kantoff, P.W.; Oh, W.K.; Chan, J.M. Single-nucleotide polymorphisms within the antioxidant defence system and associations with aggressive prostate cancer. BJU Int. 2011, 107, 126–134. [Google Scholar] [CrossRef] [PubMed]
  46. Perianayagam, M.C.; Liangos, O.; Kolyada, A.Y.; Wald, R.; MacKinnon, R.W.; Li, L.; Rao, M.; Balakrishnan, V.S.; Bonventre, J.V.; Pereira, B.J.; et al. NADPH oxidase p22phox and catalase gene variants are associated with biomarkers of oxidative stress and adverse outcomes in acute renal failure. J. Am. Soc. Nephrol. 2007, 18, 255–263. [Google Scholar] [CrossRef] [PubMed]
  47. Nadif, R.; Mintz, M.; Jedlicka, A.; Bertrand, J.P.; Kleeberger, S.R.; Kauffmann, F. Association of CAT polymorphisms with catalase activity and exposure to environmental oxidative stimuli. Free Radic. Res. 2005, 39, 1345–1350. [Google Scholar] [CrossRef] [PubMed]
  48. Jorgensen, T.J.; Ruczinski, I.; Kessing, B.; Smith, M.W.; Shugart, Y.Y.; Alberg, A.J. Hypothesis-driven candidate gene association studies: Practical design and analytical considerations. Am. J. Epidemiol. 2009, 170, 986–993. [Google Scholar] [CrossRef] [PubMed]
  49. Sham, P.C.; Purcell, S.M. Statistical power and significance testing in large-scale genetic studies. Nat. Rev. Genet. 2014, 15, 335–346. [Google Scholar] [CrossRef] [PubMed]
  50. Taylor, R.M.; Dratz, E.A.; Jesaitis, A.J. Invariant local conformation in p22phox p.Y72H polymorphisms suggested by mass spectral analysis of crosslinked human neutrophil flavocytochrome b. Biochimie 2011, 93, 1502–1509. [Google Scholar] [CrossRef] [PubMed]
  51. Moreno, M.U.; San Jose, G.; Fortuno, A.; Beloqui, O.; Diez, J.; Zalba, G. The C242T CYBA polymorphism of NADPH oxidase is associated with essential hypertension. J. Hypertens. 2006, 24, 1299–1306. [Google Scholar] [CrossRef] [PubMed]
  52. Mazaheri, M.; Karimian, M.; Behjati, M.; Raygan, F.; Hosseinzadeh Colagar, A. Association analysis of rs1049255 and rs4673 transitions in p22phox gene with coronary artery disease: A case-control study and a computational analysis. Ir. J. Med. Sci. 2017, 186, 921–928. [Google Scholar] [CrossRef] [PubMed]
  53. Tanguay, R.L.; Gallie, D.R. Translational efficiency is regulated by the length of the 3′ untranslated region. Mol. Cell. Biol. 1996, 16, 146–156. [Google Scholar] [CrossRef] [PubMed]
  54. Wilkie, G.S.; Dickson, K.S.; Gray, N.K. Regulation of mRNA translation by 5′- and 3′-UTR-binding factors. Trends Biochem. Sci. 2003, 28, 182–188. [Google Scholar] [CrossRef]
  55. Hordijk, P.L. Regulation of NADPH oxidases—The role of Rac proteins. Circ. Res. 2006, 98, 453–462. [Google Scholar] [CrossRef] [PubMed]
  56. Raz, L.; Zhang, Q.G.; Zhou, C.F.; Han, D.; Gulati, P.; Yang, L.C.; Yang, F.; Wang, R.M.; Brann, D.W. Role of Rac1 GTPase in NADPH Oxidase Activation and Cognitive Impairment Following Cerebral Ischemia in the Rat. PLoS ONE 2010, 5, e12606. [Google Scholar] [CrossRef] [PubMed]
  57. Nikolova, S.; Lee, Y.S.; Lee, Y.S.; Kim, J.A. Rac1-NADPH oxidase-regulated generation of reactive oxygen species mediates glutamate-induced apoptosis in SH-SY5Y human neuroblastoma cells. Free Radic. Res. 2005, 39, 1295–1304. [Google Scholar] [CrossRef] [PubMed]
  58. Abo, A.; Boyhan, A.; West, I.; Thrasher, A.J.; Segal, A.W. Reconstitution of neutrophil NADPH oxidase activity in the cell-free system by four components: p67-phox, p47-phox, p21rac1, and cytochrome b-245. J. Biol. Chem. 1992, 267, 16767–16770. [Google Scholar] [PubMed]
  59. Bokoch, G.M. Regulation of the phagocyte respiratory burst by small GTP-binding proteins. Trends Cell Biol. 1995, 5, 109–113. [Google Scholar] [CrossRef]
  60. Bosco, E.E.; Mulloy, J.C.; Zheng, Y. Rac1 GTPase: A “Rac”of All Trades. Cell. Mol. Life Sci. 2009, 66, 370–374. [Google Scholar] [CrossRef] [PubMed]
  61. Liu, Y.; Zhou, J.; Luo, X.; Yang, C.; Zhang, Y.; Shi, S. Association of RAC1 Gene Polymorphisms with Primary End-Stage Renal Disease in Chinese Renal Recipients. PLoS ONE 2016, 11, e0148270. [Google Scholar] [CrossRef] [PubMed]
  62. Doma, V.; Gulya, E. Genetic diversity and immunological characteristics of malignant melanoma: The therapeutic spectrum. Orv. Hetil. 2015, 156, 583–591. [Google Scholar] [CrossRef] [PubMed]
  63. Lissanu Deribe, Y. Interplay between PREX2 mutations and the PI3K pathway and its effect on epigenetic regulation of gene expression in NRAS-mutant melanoma. Small GTPases 2016, 7, 178–185. [Google Scholar] [CrossRef] [PubMed]
  64. Genius, J.; Grau, A.J.; Lichy, C. The C242T polymorphism of the NAD(P)H oxidase p22phox subunit is associated with an enhanced risk for cerebrovascular disease at a young age. Cerebrovasc. Dis. 2008, 26, 430–433. [Google Scholar] [CrossRef] [PubMed] [Green Version]
  65. Czene, K.; Lichtenstein, P.; Hemminki, K. Environmental and heritable causes of cancer among 9.6 million individuals in the Swedish family-cancer database. Int. J. Cancer 2002, 99, 260–266. [Google Scholar] [CrossRef] [PubMed]
  66. Neil, A.; Campbell, J.B.R.; Urry, L.A.; Cain, M.L.; Wasserman, S.A.; Minorsky, P.V.; Jackson, R.B. Campbell Biology, 8th ed.; Pearson Benjamin Cummings: Boston, MA, USA, 2008; p. 1393. [Google Scholar]
  67. Begg, C.B.; Hummer, A.J.; Mujumdar, U.; Armstrong, B.K.; Kricker, A.; Marrett, L.D.; Millikan, R.C.; Gruber, S.B.; Culver, H.A.; Zanetti, R.; et al. A design for cancer case-control studies using only incident cases: Experience with the GEM study of melanoma. Int. J. Epidemiol. 2006, 35, 756–764. [Google Scholar] [CrossRef] [PubMed]
  68. Kricker, A.; Armstrong, B.K.; Goumas, C.; Litchfield, M.; Begg, C.B.; Hummer, A.J.; Marrett, L.D.; Theis, B.; Millikan, R.C.; Thomas, N.; et al. Ambient UV, personal sun exposure and risk of multiple primary melanomas. Cancer Causes Control 2007, 18, 295–304. [Google Scholar] [CrossRef] [PubMed]
  69. Orlow, I.; Begg, C.B.; Cotignola, J.; Roy, P.; Hummer, A.J.; Clas, B.A.; Mujumdar, U.; Canchola, R.; Armstrong, B.K.; Kricker, A.; et al. CDKN2A germline mutations in individuals with cutaneous malignant melanoma. J. Investig. Dermatol. 2007, 127, 1234–1243. [Google Scholar] [CrossRef] [PubMed]
  70. Kanetsky, P.A.; Rebbeck, T.R.; Hummer, A.J.; Panossian, S.; Armstrong, B.K.; Kricker, A.; Marrett, L.D.; Millikan, R.C.; Gruber, S.B.; Culver, H.A.; et al. Population-based study of natural variation in the melanocortin-1 receptor gene and melanoma. Cancer Res. 2006, 66, 9330–9337. [Google Scholar] [CrossRef] [PubMed]
  71. Berwick, M.; Orlow, I.; Hummer, A.J.; Armstrong, B.K.; Kricker, A.; Marrett, L.D.; Millikan, R.C.; Gruber, S.B.; Anton-Culver, H.; Zanetti, R.; et al. The prevalence of CDKN2A germ-line mutations and relative risk for cutaneous malignant melanoma: An international population-based study. Cancer Epidemiol. Biomark. Prev. 2006, 15, 1520–1525. [Google Scholar] [CrossRef] [PubMed]
  72. Millikan, R.C.; Hummer, A.; Begg, C.; Player, J.; de Cotret, A.R.; Winkel, S.; Mohrenweiser, H.; Thomas, N.; Armstrong, B.; Kricker, A.; et al. Polymorphisms in nucleotide excision repair genes and risk of multiple primary melanoma: The Genes Environment and Melanoma Study. Carcinogenesis 2006, 27, 610–618. [Google Scholar] [CrossRef] [PubMed]
  73. Begg, C.B.; Orlow, I.; Hummer, A.J.; Armstrong, B.K.; Kricker, A.; Marrett, L.D.; Millikan, R.C.; Gruber, S.B.; Anton-Culver, H.; Zanetti, R.; et al. Lifetime risk of melanoma in CDKN2A mutation carriers in a population-based sample. J. Natl. Cancer Inst. 2005, 97, 1507–1515. [Google Scholar] [CrossRef] [PubMed]
  74. Vu, H.L.; Rosenbaum, S.; Purwin, T.J.; Davies, M.A.; Aplin, A.E. RAC1 P29S regulates PD-L1 expression in melanoma. Pigment Cell Melanoma Res. 2015, 28, 590–598. [Google Scholar] [CrossRef] [PubMed]
  75. Halaban, R. RAC1 and melanoma. Clin. Ther. 2015, 37, 682–685. [Google Scholar] [CrossRef] [PubMed]
  76. Arce, P.M.; Camilon, P.R.; Stokes, W.A.; Nguyen, S.A.; Lentsch, E.J. Is Sex an Independent Prognostic Factor in Cutaneous Head and Neck Melanoma? Laryngoscope 2014, 124, 1363–1367. [Google Scholar] [CrossRef] [PubMed]
  77. CDC. Melanoma Incidence Rates and Death Rates by Race and Ethnicity. Available online: http://www.cdc.gov/cancer/skin/statistics/race.htm (accessed on 18 December 2017).
  78. Gandini, S.; Sera, F.; Cattaruzza, M.S.; Pasquini, P.; Picconi, O.; Boyle, P.; Melchi, C.F. Meta-analysis of risk factors for cutaneous melanoma: II. Sun exposure. Eur. J. Cancer 2005, 41, 45–60. [Google Scholar] [CrossRef] [PubMed]
Figure 1. Diagram of the relevant reactive oxygen species (ROS) production pathway. NOX1, NOX4, CYBA, RAC1, SOD enzymes, catalase, their subcellular locations, and their functions in ROS production and metabolism are depicted in this diagram. NOX1 enzyme complex utilizes CYBA as one of its subunits and is activated by RAC1-GTPase to produce superoxide. On the other hand, NOX4 only couples with CYBA to generate hydrogen peroxide and superoxide. Of particular note, only plasma membrane NOX4 is shown in this diagram but mitochondrial or nuclear NOX4 has also been reported [16]. NOX1 is activated by UV to enhance its superoxide production, which requires the GTPase activity of RAC1. Superoxide is further metabolized into hydrogen peroxide at various subcellular locations by different SOD isozymes. Hydrogen peroxide is then converted into water molecules by catalase. Other additional redox enzymes (e.g., glutathione peroxidases, which also convert hydrogen peroxide into water) are not the focus in this study and therefore not included. Black arrows indicate the cellular movement of oxygen, ROS, and enzymatic metabolisms. A bold arrow represents a greater relative amount of ROS produced.
Ijms 19 00242 g001
Figure 2. The inclusion and exclusion criteria of the participants in this study.
Ijms 19 00242 g002
Table 1. Characteristics of the study participants.
Study ParticipantGender
MaleFemaleTotal
n (%) 1n (%)n (%)
Patients (n = 177)
Age (years)
19–395 (5.32%)15 (18.1%)20 (11.3%)
40–5944 (46.8%)46 (55.4%)90 (50.8%)
≥6045 (47.9%)22 (26.5%)67 (37.9%)
Controls (n = 172)
Age (years)
19–397 (7.1%)15 (20.3%)22 (12.8%)
40–5945 (45.9%)41 (55.4%)86 (50.0%)
≥6046 (46.9%)18 (24.3%)64 (37.2%)
1 Percentage may not add up to 100% due to rounding.
Table 2. Twenty-three SNP candidates.
GeneSNPlocationdbSNP IDDisease AssociationReference
NOX1944G>AR315Hrs2071756Diabetes[24]
1284G>AD360Nrs34688635Severe pancolitis[25]
NOX4T>CIntronrs11018628Increased plasma homocysteine level (risk in cardiovascular diseases)[26]
−114 C>T5’UTRrs585197Decreased risk of hepatic-pulmonary syndrome[27]
C>TIntronrs2164521Decreased risk of hepatic-pulmonary syndrome[27]
CYBAp22phox−930A>GPromoterrs9932581Modulates CYBA promoter activity[28,29]
242C>TY72Hrs4673Decreased NOX activity; protective role in coronary heart disease[30,31,32]
−675A>TPromoterrs13306296Related to hypertension[33]
C>GIntronrs3180279Associated with non-Hodgkin lymphoma prognosis[13]
640A>G3′UTRrs1049255Associated with coronary heart disease [34]
RAC1G>AIntronrs10951982Risks in ulcerative colitis, hypertension, inflammatory bowel disease, end-stage renal disease[20]
T>CExonrs4720672Risks in inflammatory bowel disease, ulcerative colitis [35,36]
C>TIntronrs836478Hypertension risk factor[20]
SOD1A>G5’UTRrs7277748Familial amyotrophic lateral sclerosis[37]
7958G>AIntronrs4998557Caused amyotrophic lateral sclerosis[37,38,39]
SOD2399T>CIle58Thrrs1141718Reduced enzyme activity[40]
T>C,A,GV16A,D,Grs4880Mitochondrial importing, diabetes and prostate cancer[12,41,42,43]
T>AIntronrs8031Oxidative stress[44]
C>AIntronrs2758330Protective role in prostate cancer[45]
SOD3C>TPromoterrs699473Brain tumor[15]
G>AA377Trs2536512Cerebral infarction[14]
CAT−262C>T5’UTRrs1049982Down-regulated transcription upon oxidative stimulation[46,47]
C>T5’UTRrs1001179Brain tumor[15]
Table 3. Descriptive statistics of the 23 SNP candidates.
SNP 1GeneGenotyping Rate 2Minor Allele Frequency (MAF)Association (p-Value) 4HWE 5 (p-Value)dbSNP MAF 6
Cases (n = 170) 3Controls (n = 152) 3CasesControlsGenotypicAllelicRecessiveDominant
rs10951982RAC196.5%83.0%47.3%23.6%<0.001<0.0010.333<0.0010.45916.6%
rs11018628NOX499.4%94.1%50.0%33.9%<0.001<0.0010.458<0.001<0.00116.7%
rs8031SOD295.9%87.5%38.3%49.6%<0.0010.008<0.0010.5760.60536.7%
rs2536512SOD397.1%75.8%27.6%37.5%<0.0010.016<0.0010.1680.43140.1%
rs4720672RAC196.5%92.2%23.8%17.6%0.0090.0760.5820.0140.04312.5%
rs4673CYBA98.8%93.5%36.6%30.6%0.0140.1320.5610.0130.23833.6%
rs3180279CYBA98.8%94.7%48.2%48.6%0.0220.9850.1540.1270.03044.5%
rs1049255CYBA97.1%90.3%48.2%37.1%0.0270.0070.0340.0410.71946.9%
rs1001179CAT96.5%95.4%16.8%24.1%0.0620.0300.6100.0251.00012.6%
rs4880SOD298.2%93.5%53.3%55.2%0.0740.6850.1330.4020.17541.1%
rs9932581CYBA99.4%90.9%45.9%42.5%0.3570.4501.0000.2120.16841.7%
rs699473SOD397.1%90.9%63.0%59.3%0.4610.3880.7450.2800.86144.1%
rs7277748SOD195.9%85.6%4.0%2.7%0.4860.518N/A0.5111.0003.9%
rs2164521NOX498.2%86.8%9.3%10.6%0.6460.6880.4420.7921.00026.2%
rs836478RAC197.1%94.8%51.8%50.0%0.7400.7100.5511.0001.00030.9%
rs4998557SOD198.8%94.1%10.4%11.5%0.7490.7741.0000.6750.69532.9%
rs1049982CAT94.7%88.8%35.7%36.3%0.9620.9511.0000.9040.71047.1%
rs34688635NOX197.6%90.2%1.5%1.1%1.0000.7341.0001.0001.0000.5%
rs1141718SOD296.5%98.7%49.4%49.0%1.0000.9881.0001.000<0.001N/A
rs2758330SOD296.5%96.1%20.7%20.6%1.0001.0001.0001.0000.01026.5%
rs2071756NOX198.2%92.2%0%0%N/A1.000N/AN/A1.0000.1%
rs585197NOX473.5%70.4%Excluded from further analysis due to low genotyping rate (≤75.0%)
rs13306296CYBA78.8%66.4%Excluded from further analysis due to low genotyping rate (≤75.0%)
1 Ordered according to smallest to largest genotypic p-values; 2 Percentage of participants with SNP genotyping success; 3 Participant number = n * %; 4 Chi-square or Fisher’s exact test of independence between SNP models and melanoma status (case and control); 5 Exact test for Hardy–Weinberg equilibrium (HWE) on the controls, p < 0.05 counts as evidence against HWE. HWE is a test of genotype balance in a given population; 6 Reference minor allele frequencies documented in dbSNP database. N/A: not available.
Table 4. Crude associations between the top five SNPs and melanoma risk.
SNP/ModelAlleleCases (n = 170)Controls (n = 152)OR (95% CI)p-Value 2
n (%) 1n (%)
rs10951982 (RAC1)
AdditiveGG21 (12.4%)72 (47.4%)Reference--
GA131 (77.1%)50 (32.9%)8.98 (5.08, 16.44)<0.001
AA12 (7.1%)5 (3.3%)8.23 (2.73, 28.39)<0.001
RecessiveGG+GA152 (89.4%)122 (80.3%)Reference--
AA12 (7.1%)5 (3.3%)1.93 (0.69, 6.19)0.230
DominantGG21 (12.4%)72 (47.4%)Reference--
GA+AA143 (84.1%)55 (36.2%)8.91 (5.09, 16.19)<0.001
rs1049255 (CYBA)
AdditiveCC47 (27.6%)56 (36.8%)Reference--
CT77 (45.3%)63 (41.4%)1.46 (0.88, 2.44)0.149
TT41 (24.1%)20 (13.2%)2.44 (1.27, 4.79)0.008
RecessiveCC+CT124 (72.9%)119 (78.3%)Reference--
TT41 (24.1%)20 (13.2%)1.97 (1.10, 3.61)0.022
DominantCC47 (27.6%)56 (36.8%)Reference--
CT+TT118 (69.4%)83 (54.6%)1.69 (1.05, 2.74)0.031
rs4673 (CYBA)
AdditiveGG53 (31.2%)66 (43.4%)Reference--
GA107 (62.9%)68 (44.7%)1.96 (1.23, 3.15)0.005
AA8 (4.7%)10 (6.6%)1.00 (0.36, 2.70)0.994
RecessiveGG+GA160 (94.1%)134 (88.2%)Reference--
AA8 (4.7%)10 (6.6%)0.67 (0.25, 1.75)0.412
DominantGG53 (31.2%)66 (43.4%)Reference--
GA+AA115 (67.6%)78 (51.3%)1.84 (1.16, 2.92)0.010
rs8031 (SOD2)
AdditiveAA45 (26.5%)32 (21.1%)Reference--
AT111 (65.3%)70 (46.1%)1.13 (0.65, 1.94)0.665
TT7 (4.1%)31 (20.4%)0.16 (0.06, 0.39)<0.001
RecessiveAA+AT156 (91.8%)102 (67.1%)Reference--
TT7 (4.1%)31 (20.4%)0.15 (0.06, 0.33)<0.001
DominantAA45 (26.5%)32 (21.1%)Reference--
AT+TT118 (69.4%)101 (66.4%)0.83 (0.49, 1.40)0.489
rs2536512 (SOD3)
AdditiveGG76 (44.7%)43 (28.3%)Reference--
GA87 (51.2%)59 (38.8%)0.83 (0.51, 1.37)0.477
AA2 (1.2%)14 (9.2%)0.08 (0.01, 0.31)0.001
RecessiveGG+GA163 (95.9%)102 (67.1%)Reference--
AA2 (1.2%)14 (9.2%)0.09 (0.01, 0.33)0.002
DominantGG76 (44.7%)43 (28.3%)Reference--
GA+AA89 (52.4%)73 (48.0%)0.69 (0.42, 1.12)0.134
1 Participants lost due to genotyping failure; 2 p-value of the coefficient from the regression model. p-value was compared to a Bonferroni corrected significance level at 0.05/21 = 0.00238 to determine statistical significance. --: no p-value in the reference group.
Table 5. Adjusted 1 associations between the top five SNPs and melanoma risk.
SNP/ModelAlleleCases (n = 170)Controls (n = 152)OR (95% CI)p-Value 3
n (%) 2n (%)
rs10951982 (RAC1)
AdditiveGG21 (12.4%)72 (47.4%)Reference--
GA131 (77.1%)50 (32.9%)6.15 (2.98, 13.41)<0.001
AA12 (7.1%)5 (3.3%)2.88 (0.68, 12.56)0.149
RecessiveGG+GA152 (89.4%)122 (80.3%)Reference--
AA12 (7.1%)5 (3.3%)0.79 (0.21, 3.03)0.719
DominantGG21 (12.4%)72 (47.4%)Reference--
GA+AA143 (84.1%)55 (36.2%)5.79 (2.84, 12.51)<0.001
rs1049255 (CYBA)
AdditiveCC47 (27.6%)56 (36.8%)Reference--
CT77 (45.3%)63 (41.4%)1.20 (0.63, 2.30)0.574
TT41 (24.1%)20 (13.2%)1.42 (0.61, 3.38)0.420
RecessiveCC+CT124 (72.9%)119 (78.3%)Reference--
TT41 (24.1%)20 (13.2%)1.28 (0.59, 2.83)0.531
DominantCC47 (27.6%)56 (36.8%)Reference--
CT+TT118 (69.4%)83 (54.6%)1.26 (0.69, 2.31)0.456
rs4673 (CYBA)
AdditiveGG53 (31.2%)66 (43.4%)Reference--
GA107 (62.9%)68 (44.7%)2.17 (1.17, 4.07)0.015
AA8 (4.7%)10 (6.6%)0.50 (0.11, 1.82)0.315
RecessiveGG+GA160 (94.1%)134 (88.2%)Reference--
AA8 (4.7%)10 (6.6%)0.31 (0.07, 1.07)0.080
DominantGG53 (31.2%)66 (43.4%)Reference--
GA+AA115 (67.6%)78 (51.3%)1.88 (1.03, 3.47)0.042
rs8031 (SOD2)
AdditiveAA45 (26.5%)32 (21.1%)Reference--
AT111 (65.3%)70 (46.1%)1.33 (0.66, 2.65)0.421
TT7 (4.1%)31 (20.4%)0.32 (0.09, 0.94)0.047
RecessiveAA+AT156 (91.8%)102 (67.1%)Reference--
TT7 (4.1%)31 (20.4%)0.26 (0.08, 0.70)0.011
DominantAA45 (26.5%)32 (21.1%)Reference--
AT+TT118 (69.4%)101 (66.4%)1.06 (0.54, 2.08)0.864
rs2536512 (SOD3)
AdditiveGG76 (44.7%)43 (28.3%)Reference--
GA87 (51.2%)59 (38.8%)0.68 (0.35, 1.28)0.232
AA2 (1.2%)14 (9.2%)0.26 (0.03, 1.50)0.144
RecessiveGG+GA163 (95.9%)102 (67.1%)Reference--
AA2 (1.2%)14 (9.2%)0.33 (0.04, 1.83)0.218
DominantGG76 (44.7%)43 (28.3%)Reference--
GA+AA89 (52.4%)73 (48.0%)0.65 (0.34, 1.21)0.175
1 Adjusted for gender, age at diagnosis/interview, family history of melanoma, and ever sunburned; 2 Participants lost due to genotyping failure; 3 p-value of the coefficient from the regression model. p-value was compared to a Bonferroni corrected significance level at 0.05/21 = 0.00238 to determine statistical significance. --: no p-value in the reference group.

