Article

Building the Resilience of Marginal Rural Areas Using a Complementary Characterization Approach: Possible Beneficial Health Effects and Stress Tolerance of Italian Common Bean (Phaseolus vulgaris L.) Landraces

Department of Biosciences and Territory, University of Molise, 86090 Pesche, Italy
*
Author to whom correspondence should be addressed.
Diversity 2024, 16(4), 240; https://doi.org/10.3390/d16040240
Submission received: 23 February 2024 / Revised: 4 April 2024 / Accepted: 15 April 2024 / Published: 17 April 2024
(This article belongs to the Special Issue Advances in Crop Genetic Diversity: Challenges and Opportunities)

Abstract

:
Common bean landraces, besides contributing to the preservation of the social and cultural identity of the local communities of the production area, typically display adaptability to adverse agro-climatic conditions. This adapted germplasm is a repository of the gene pool and also shows typical phytochemical profiles, representing an essential source of bioactive components. However, genetic erosion is progressively affecting this genetic material, creating serious threats to its cultivation in marginal rural areas and use as a source of biodiversity and bioproducts. In the present work, a comprehensive approach was used to characterize the seed morpho-colorimetric traits, genetic diversity, and NMR metabolomic profiles of three Italian common bean landraces. Specific physiological and biochemical features (antioxidant molecules, osmolytes, structural reorganization of photosynthetic pigment, etc.), together with the accumulation of distinctive metabolites, contribute to the description of the observed diversity among the landraces in terms of the salt stress response and antiproliferative abilities on intestinal human cancer cells. This information could be useful in establishing their value in terms of environmental and/or human health “service”, both essential to translating landraces into competitive products, a prerequisite for envisioning appropriate strategies for their conservation and a driving force for the revitalization of marginal rural areas.

Graphical Abstract

1. Introduction

Over the last few decades, agricultural ecosystems have increasingly lost their biological diversity based on local landraces. This loss has been due to the use of modern intensive farming systems characterized by high-input and high-yielding crop varieties. Thus, there has been an abandonment of the use of traditional cropping practice, landrace cultivation and on-farm conservation [1].
Local landraces, besides contributing to the preservation of the social and cultural identity of the local communities in the production area, are repositories of gene pools that enrich agrobiodiversity, sustainably maintaining and stabilizing ecosystems to make them functional [2]. Indeed, this local germplasm shows adaptability to different agroclimatic conditions, maintaining considerable diversity among and within populations [3]. They are also characterized by typical phytochemical profiles, as compared to more common modern varieties, representing an essential source of important nutraceutical and bioactive components with multiple beneficial effects for human health [4].
The Mediterranean basin has a long and rich history of cultivation of several landraces [5,6]. Particularly, since ancient times, legume landraces have been the backbone of the Mediterranean agroecosystems, providing an excellent and inexpensive source of high-quality nutrients and representing a staple food for the human diet [7,8]. Among them, the common bean (Phaseolus vulgaris L.), an annual herbaceous plant with different growth habits, varying from determinate/indeterminate bush to climber/semi-climber vine, is a global resource for direct human consumption [9]. Independently domesticated in Andean South America and Mesoamerica some 7 million years ago, it achieved widespread distribution in Europe after several introductions from the New World, combined with direct trade among other Mediterranean countries over the centuries [10,11]. Thus, this legume species has adapted to grow in a wide range of environments, generating a huge diversification that serves as a source of plant stress response and adaptation to environmental constraints [12]. High yields and quality traits could be achieved with low inputs, thus addressing current and future climate change challenges [13]. Moreover, its nitrogen-fixing properties improve soil fertility and productivity, with a low impact on the carbon footprint and supporting agroecosystem biodiversity [14]. From the nutritional point of view, the common bean is regarded as “a grain of hope”, particularly for poor communities, being rich in protein, complex carbohydrates, fiber, vitamins, unsaturated fatty acids, such as linoleic and oleic acids, and inorganic minerals (iron, zinc, copper, phosphorous, and aluminum) [15,16]. In addition to representing a valuable source of nutrients, lectins (phytohemagglutinins, PHAs; PHA-E and PHA-L), condensed tannins and phytic acids exert major antinutritional effects, reducing the bioavailability of important micronutrients for human dietary use, especially iron and zinc [17]. Furthermore, several studies reported the presence of a complex chemical composition in common bean genotypes, which is directly related to a plethora of structurally and functionally diverse metabolites. Many of these metabolites show beneficial and effective roles in the prevention and/or regulation of chronic conditions, such as obesity, diabetes, cancer, and cardiovascular diseases [18,19].
In recent years, common beans have drawn attention for their unique nutraceutical profiles and their role in agriculture sustainability, climate change mitigation and global food security. FAO report [20] stated that “the answer to mitigate, adapt and reduce the effects of climate change come in the form of a single seed: the pulse”.
Given these considerations, common beans could be considered as the potential future natural resources able to achieve the Sustainable Development Goals (SDGs) promoted by the United Nations Agenda 2030: zero hunger/food security, good health and well-being, climate change mitigation, promotion of the sustainable use of ecosystems, and halting biodiversity loss [21,22].
However, like all major crops, the common bean is sensitive to salinity stress [15], one of the most alarming abiotic stresses caused by climate change in the Mediterranean region [23], inducing multiple alterations in plant morpho-physiology and biochemical processes. The negative effects of salt on plants are related to a reduction in the osmotic potential, water deficit, nutrient imbalance, and ion toxicity [24]. Furthermore, a high level of salt hampers the photosynthetic process in all its stages, limiting the CO2 supply to leaves and causing ultrastructural changes in chloroplasts, alterations of the polypeptide composition of the photosystems, reduced electron flow from PSII to PSI, impaired chlorophyll biosynthesis or accelerated degradation, and accumulation of reactive oxygen species (ROS) [25].
However, plant salt tolerance is dependent on the growth development stage [26]; the germination and early seedling stages are known to be the most sensitive to stress, as also reported in common bean varieties [27,28]. Although severe impairments are commonly described in P. vulgaris plants under salinity conditions [29,30], several cultivars respond better to salt stress [31,32,33], also demonstrating high potential for salinity tolerance during early vegetative growth. Thus, the observed substantial diversity in salinity tolerance among landraces could represent an important prerequisite for identifying stress-tolerant traits/markers able to address the threats posed by climate change.
However, globalization and technological modernization of agricultural practices in the last few decades have drastically reduced and genetically eroded traditional and local bean agro-ecotypes, restricting them to isolated local markets or causing them to completely disappear [34]. The survival of common bean landraces therefore occurs in limited mountainous and hilly areas along the Apennine ridge of the central and southern regions, prevailing in internal and marginal territories where traditional forms of agriculture are practiced by elderly farmers, mostly for family subsistence [35]. Although these areas suffer from demographic decline and disadvantaged conditions, they still have remarkable environmental resources (high-quality agricultural products and natural landscapes) and cultural assets (archaeological and historic settlements) capable of creating new income opportunities and promoting territorial competitiveness [36]. From this perspective, as detailed in the Italian public policy National Strategy for Inland Areas (Italian SNAI) plan, “place-based” strategies must be implemented to valorize the local resources (particularly agricultural products) and, thus, promote territorial development and the economic and social regeneration of these fragile Italian territories [37]. In this context, the assessment of the existing morphological and genetic diversity of germplasm represents the first step in a characterization process focused on the preservation and possible exploitation of endangered local resources [38].
Among them, the characterization of phaseolin isoforms allows the identification of the Andean or Mesoamerican gene pool of the populations, helping to assess the genetic structure of beans from different geographical locations [39,40].
During the last years, nuclear magnetic resonance (NMR) spectroscopy-based metabolomics has turned into a fast and reliable analytical tool to characterize the metabolite diversity and estimate the nutritional quality of several crops [12,41,42]. However, despite this notion, to the best of our knowledge, only a few published articles have reported the use of NMR metabolomics to characterize the diversity of common beans [43,44]. It could be fundamental to establish landraces’ value and peculiarities in terms of environment and human health “services”, both essential to translating them into competitive products and a prerequisite for envisioning appropriate strategies for their on-farm conservation.
Based on these premises, in the present study, a comprehensive characterization of three Italian autochthonous P. vulgaris L. landraces was performed at the morphological, genetic and metabolomic levels, also examining the presence of promising bioactive compounds involved in plant stress tolerance or with some antiproliferative capability in intestinal human cancer cells. Successively, to tackle the climate change challenge, the ability of these landraces to counteract salinity stress was evaluated by monitoring the main plant morpho-physiological and biochemical parameters after 15 days of salt stress exposure.

2. Materials and Methods

2.1. Plant Material Collection

Seeds of three common bean (Phaseolus vulgaris L.) landrace populations were collected from local farmers in Italian hilly and mountainous areas and successively stored ex situ in the Molise Germplasm Bank. Ciliegino (CV) and Fagiolo d’Acqua (FDA) are cultivated with low input and traditional farming systems in two different marginalized areas of the Molise region located, respectively, in Vastogirardi [41°46′9.651″ (N) 14°15′28.894″ (E)] and Pietrabbondante [41°43′9.829″ (N) 14°22′47.892″ (E)] municipalities, both belonging to the Alto Medio Sannio Inner Area [45]. In detail, CV takes its name from the cherry red seed coat color, also small and oval, and is particularly appreciated for its sweet taste. FDA is an oval bean with a light brown seed coat, commonly used in soups because of its thin skin and whose name refers to the old farming location, near water sources, where it was grown in the past.
San Michele Rosso (SMR) is cultivated by Belisario Farm [Sarconi, PZ; 40°14′38.04″ (N) 15°51′55.439″ (E)], in the hilly areas of the Basilicata region, and is associated with the PGI (Protected Geographical Indication) quality marker. It owes its name to the red color of its seed coat and to the time when it ripens, usually on the day dedicated to Saint Michele, and it is particularly appreciated for its taste and short cooking time.
All the populations are characterized by round-shaped seeds and white hilum but different seed coat colors: CV and SMR show a full shiny red coat color, while FDA presents a uniform light brown coat color (Supplementary Figure S1).

2.2. Landrace Diversity Assessment

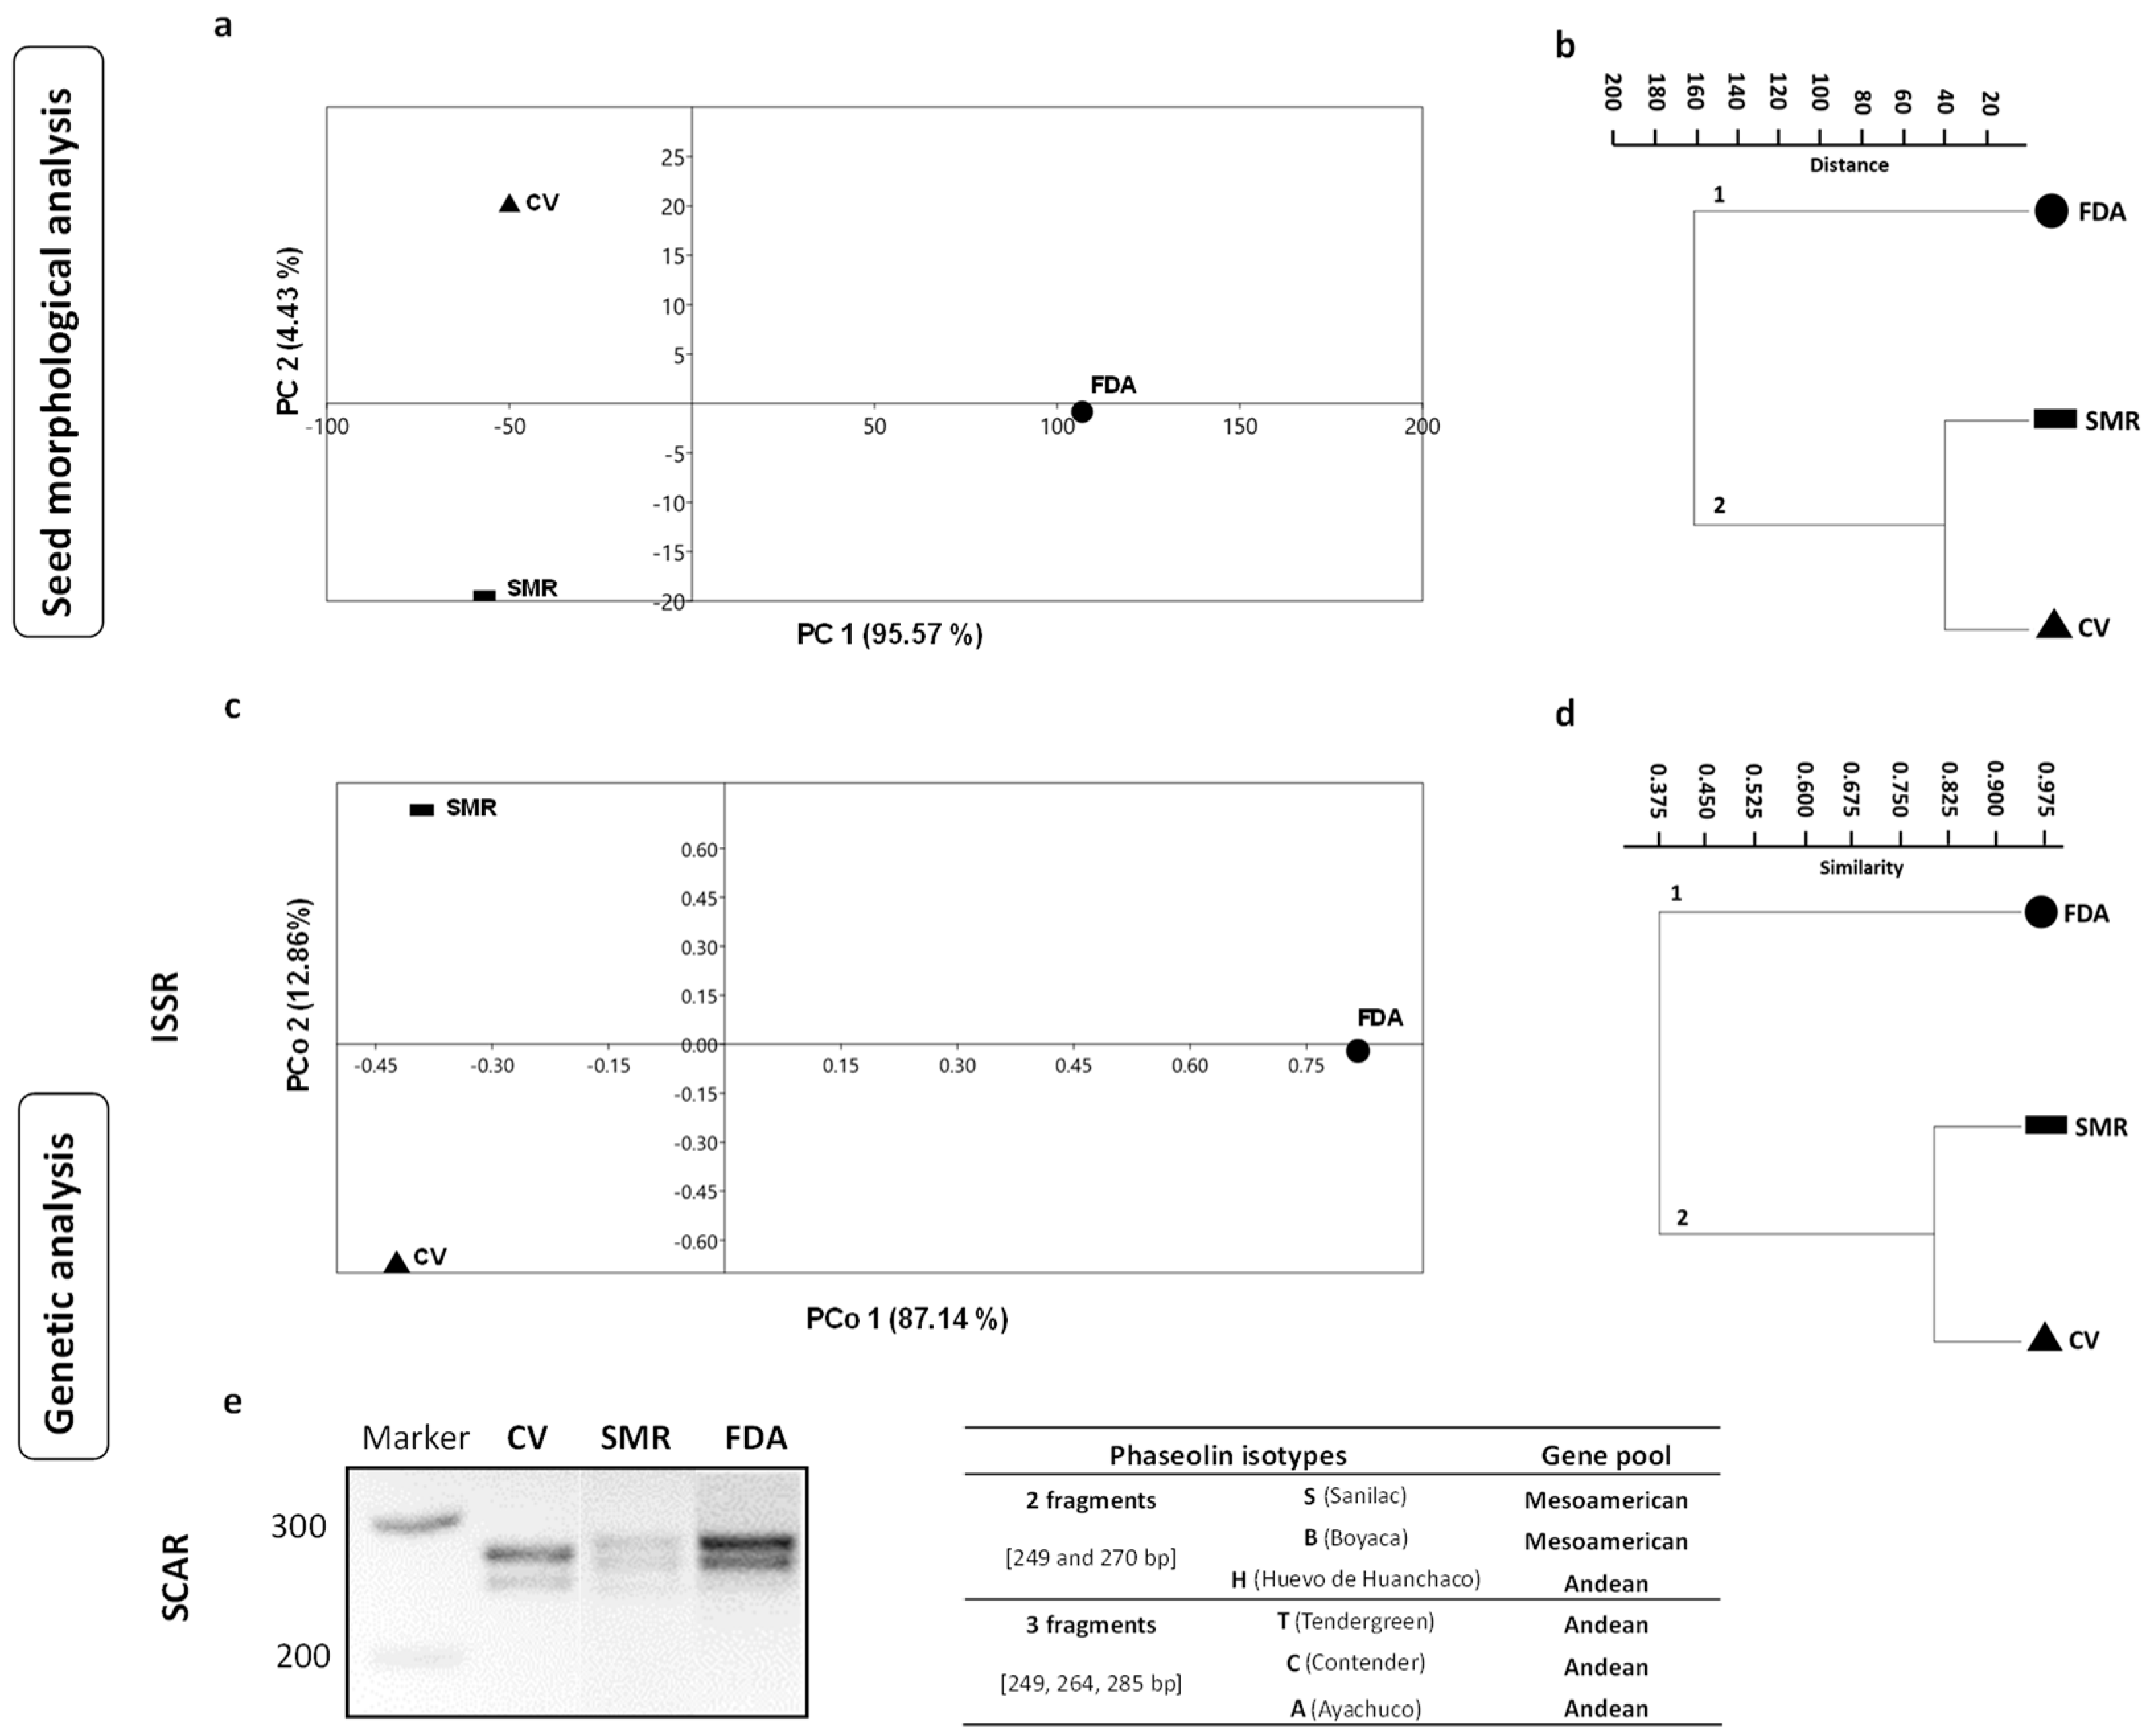
2.2.1. Seed Morphological Analysis

A total of 14 seed morpho-colorimetric parameters were measured on a digital image of 10 seeds for each common bean population by using software Image J (Version 1.51iWayne Rasband-NIH; https://rsb.info.nih.gov/ij/, accessed on 20 April 2023). Only the seed weight (g), volume (mL), and density (g·mL−1) were measured on 100 seeds. The morpho-colorimetric features were selected by referring to Loddo et al. [46], and the measurements were conducted in triplicate and expressed as the mean ± standard error.

2.2.2. DNA Analysis: ISSR and SCAR Amplification

The total genomic DNA was used to investigate the genetic relationships among the common bean populations by using a total of 8 inter-simple sequence repeat (ISSR) primers and the sequence-characterized amplified region (SCAR) marker of the phaseolin (Phs) locus (Supplementary Table S1), following the same procedures reported in Falcione et al. [47].

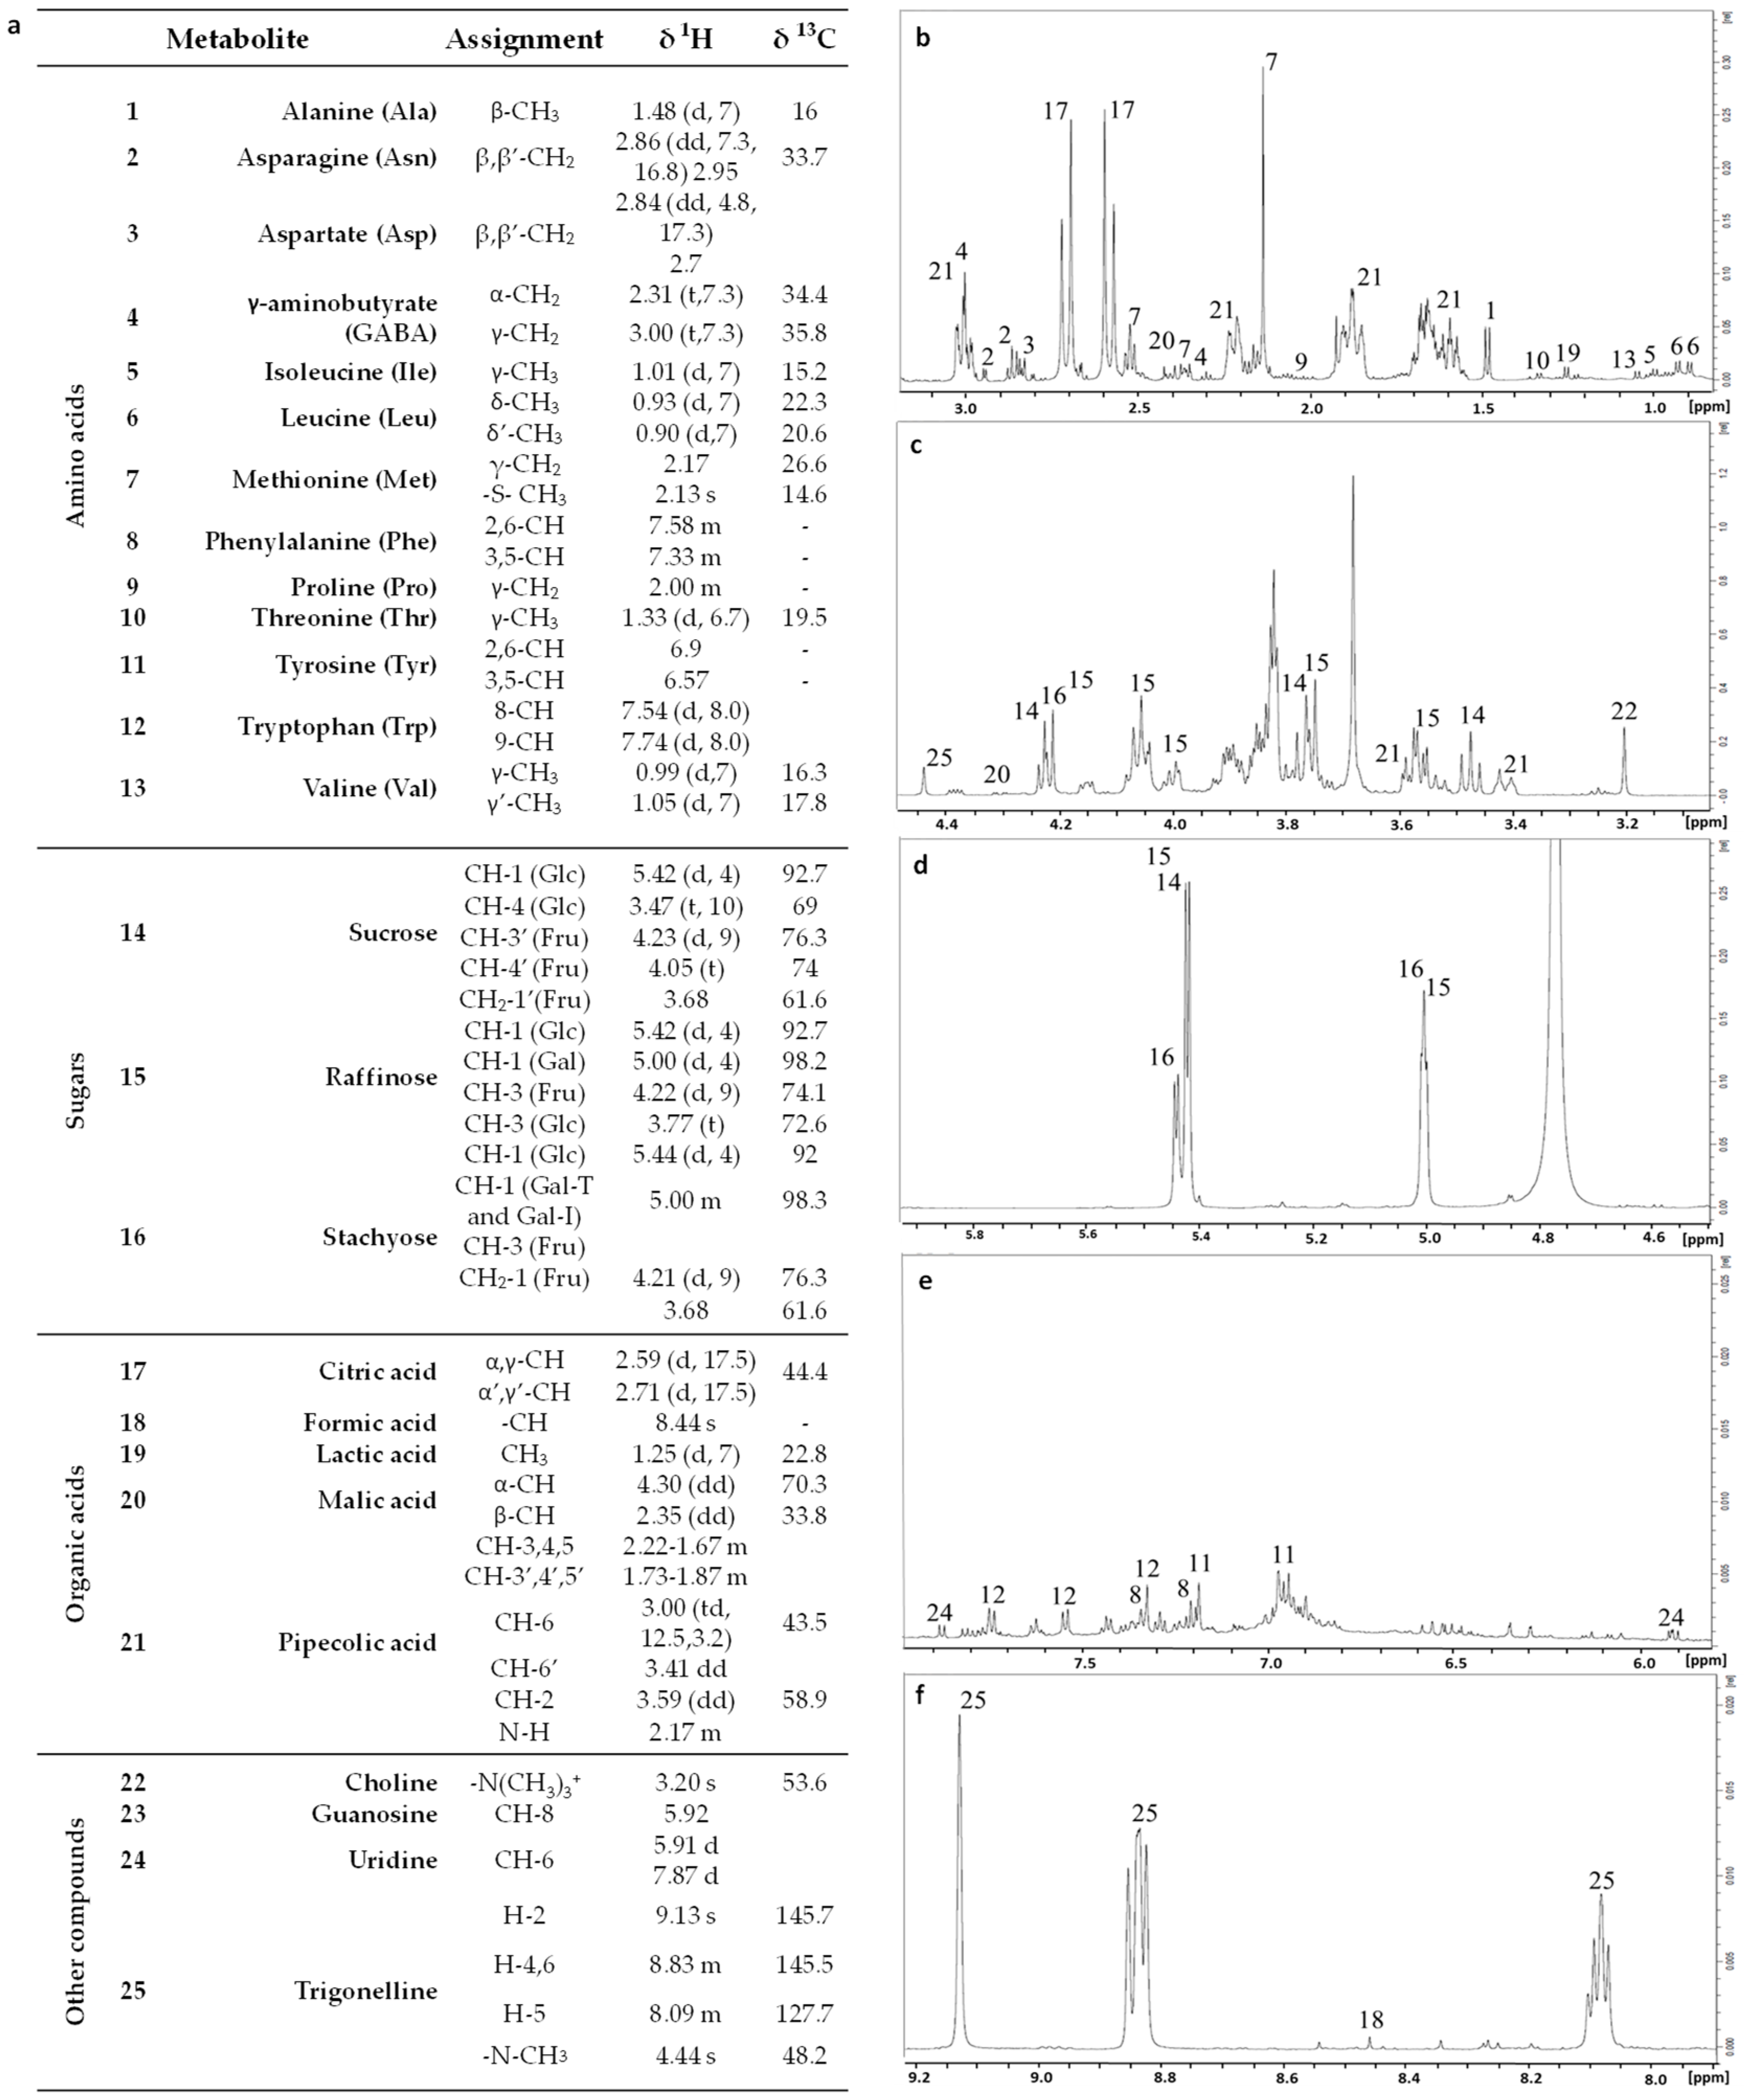
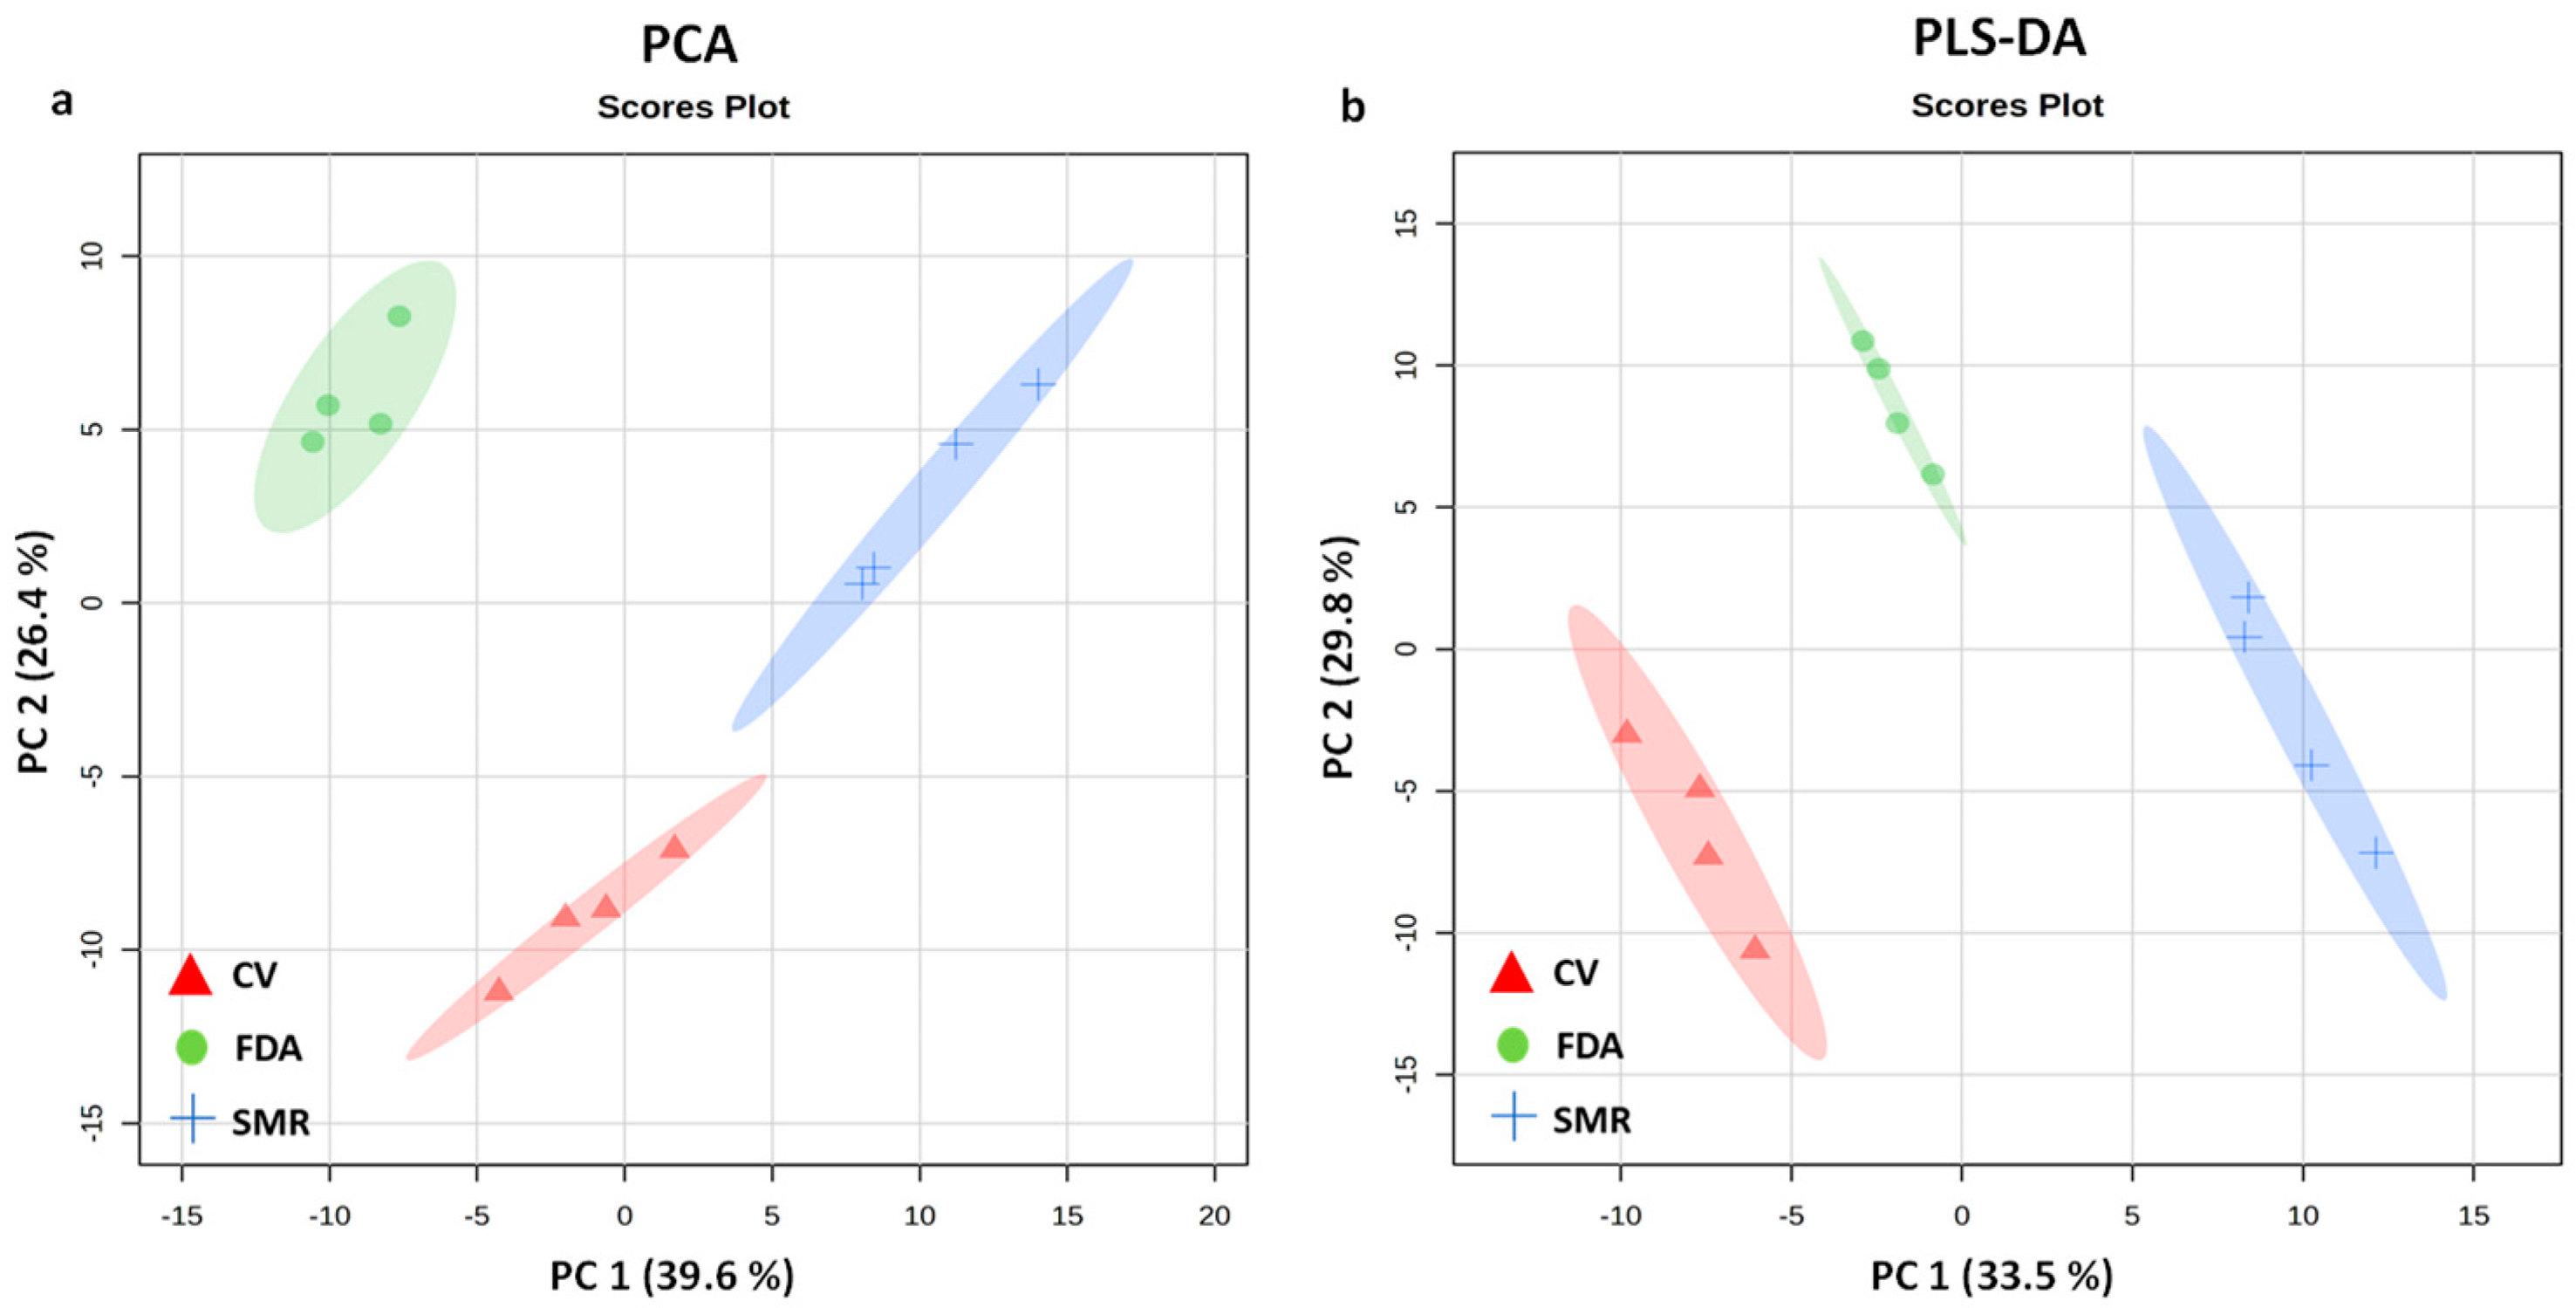
2.2.3. NMR Metabolomic Profiling

The extraction of all the metabolites was performed according to the procedure applied by Samukha et al. [48]. Briefly, powdered seed (1.5 g) was incubated for 1 h at room temperature with CH2Cl2/MeOH/H2O (2:1:1) The resulting lipophilic and hydroalcoholic phases were accurately separated and vacuum dried in a Rotavapor (R-114, Büchi, Switzerland), keeping the temperature at 30 °C to inhibit the decomposition of the thermolabile compounds. Next, the samples were placed in a SpeedVac (Thermo Fisher Scientific, Waltham, MA, USA) and successively transferred to the freeze dryer (CHRIST, Hosterode am Harz, Germany) for two days until complete solvent evaporation. All the experiments were performed in quadruplicate to ensure their reproducibility.
For the NMR experiments, the aqueous extract (7 mg) was resuspended in 500 µL of deuterated water (D2O, 99.95% D, Sigma-Aldrich, Milan, Italy) containing 0.1 mM sodium 3-trimethylsilyl [2,2,3,3-2H4] propionate (TMSP 0.75 wt% sodium salt, 99.9% D, Sigma-Aldrich, Milan, Italy), for 1 H spectral reference, and phosphate-buffered saline (PBS) at pH 6. The lipophilic extract (7 mg) was solubilized in 500 µL of deuterated chloroform (CDCl3, 99.8%, Sigma-Aldrich, Milan, Italy) adding Tetramethylsilane Si(CH3)4 (TMS, 0.03% v/v, 99.8% D, Sigma-Aldrich, Milan, Italy) as an internal standard. Finally, the samples were transferred into NMR tubes and analyzed via 1H and 13C NMR spectroscopy, homonuclear correlation spectroscopy (2D 1H−1H COSY), heteronuclear single quantum correlations (2D 1H−13C HSQC) and heteronuclear multiple bond correlation (2D 1H–13C HMBC).
One-dimensional (1D) and two-dimensional (2D) (COSY, HSQC and HMBC) spectra were acquired on a Bruker DRX-600 spectrometer (Bruker BioSpin GmbH, Rheinstetten, Germany), equipped with 5 mm TXI 1H/D-13C/15N-GRD Z816801/0193 probes, operating at 298 K. The acquisition parameters for the 1H–NMR (1D) were: FID size = 64 k, dummy scans = 4, spectral width = 11, number of scans = 512, acquisition time = 2.18 s, relaxation delay = 5 s, receiver gain = 90.5 and FID resolution= 0.45 Hz. The acquisition parameters for the 1H–NMR (2D) were: COSY dummy scans = 16, number of scans = 32, relaxation delay = 1.5 s, receiver gain= 228; HSQC dummy scans = 16, number of scans = 64, relaxation delay = 1 s, receiver gain = 2050; HMBC dummy scans= 16, number of scans = 96, relaxation delay = 1 s, receiver gain = 2050. Data acquisition was achieved by using TOPSPIN 3.5 software (Bruker BioSpin GmbH, Rheinstetten, Germany).
Phase and baseline corrections were performed for the NMR data processing. For the data calibration, the TMSP shift signal was adjusted to 0.0 ppm using TOPSPIN 3.5 software (Bruker BioSpin GmbH, Rheinstetten, Germany).
Metabolite profiling was assigned by comparison with the Human Metabolome Database (HMDB; http://www.hmdb.ca/, accessed on 20 May 2023) and the signal assignments were confirmed by recording and analyzing the 1D and 2D NMR experiments. These were 13C spectroscopy (1D), homonuclear correlation spectroscopy (2D, 1H–1H COSY), heteronuclear single quantum correlations (2D, 1H–13C HSQC) and heteronuclear multiple bond correlation (2D, 1H–13C HMBC). To differentiate the samples through the NMR spectra, we carried out a multivariate statistical analysis of the NMR qualitative data using projection methods.
For the quantification of the metabolites, considering that the signal intensity in the 1H NMR spectrum is proportional to the molar concentration of the metabolites [49], the most abundant compounds were quantified by an integration of the 1H NMR signals, using TSP as the internal standard, and considering several parameters, such as the mass of the target compound [μg] in the solution used for the 1H NMR measurement, the molecular weight of the target compound [g∙mol−1], the relative integral value of the 1H NMR signal of the target compound, the relative integral value of the 1H NMR signal of the standard compound, the number of protons belonging to the 1H NMR signal of the standard compound, the number of protons belonging to the 1H NMR signal of the target compound, the concentration of the internal standard (TSP) in the solution used for the 1H NMR measurement [mmol∙L−1], and the volume of the solution used for 1H NMR measurement [mL]. The quantification of the metabolites was expressed in mg/g of dry weight of bean seeds.

2.3. Anti-Proliferative Activity of Seed Aqueous Extracts on Caco-2 Cell Line

Cancer coli-2 (Caco-2) cells were cultured at 5% CO2 in high-glucose Dulbecco’s modified Eagle’s medium (DMEM) (Merck Life Science, Milan, Italy), containing 10% (v/v) fetal bovine serum (FBS) (Merck Life Science, Milan, Italy), L-glutamine (2 mM), and penicillin/streptomycin solution. The growth curve experiments were assessed by seeding Caco-2 cells into 12-well plates (50,000 cells for each well). Then, 5 h and 48 h after seeding, the cells were treated with the bean extracts (CV, FDA, SMR) at different concentrations: 0.1 µg·mL−1, 1 µg·mL−1, 100 µg·mL−1, while the control cells received DMSO (dilution 1:1000 in cell culture medium) as the vehicle. Cell counts were performed after 96 h, and the results were expressed as the means ± SD (standard deviation).

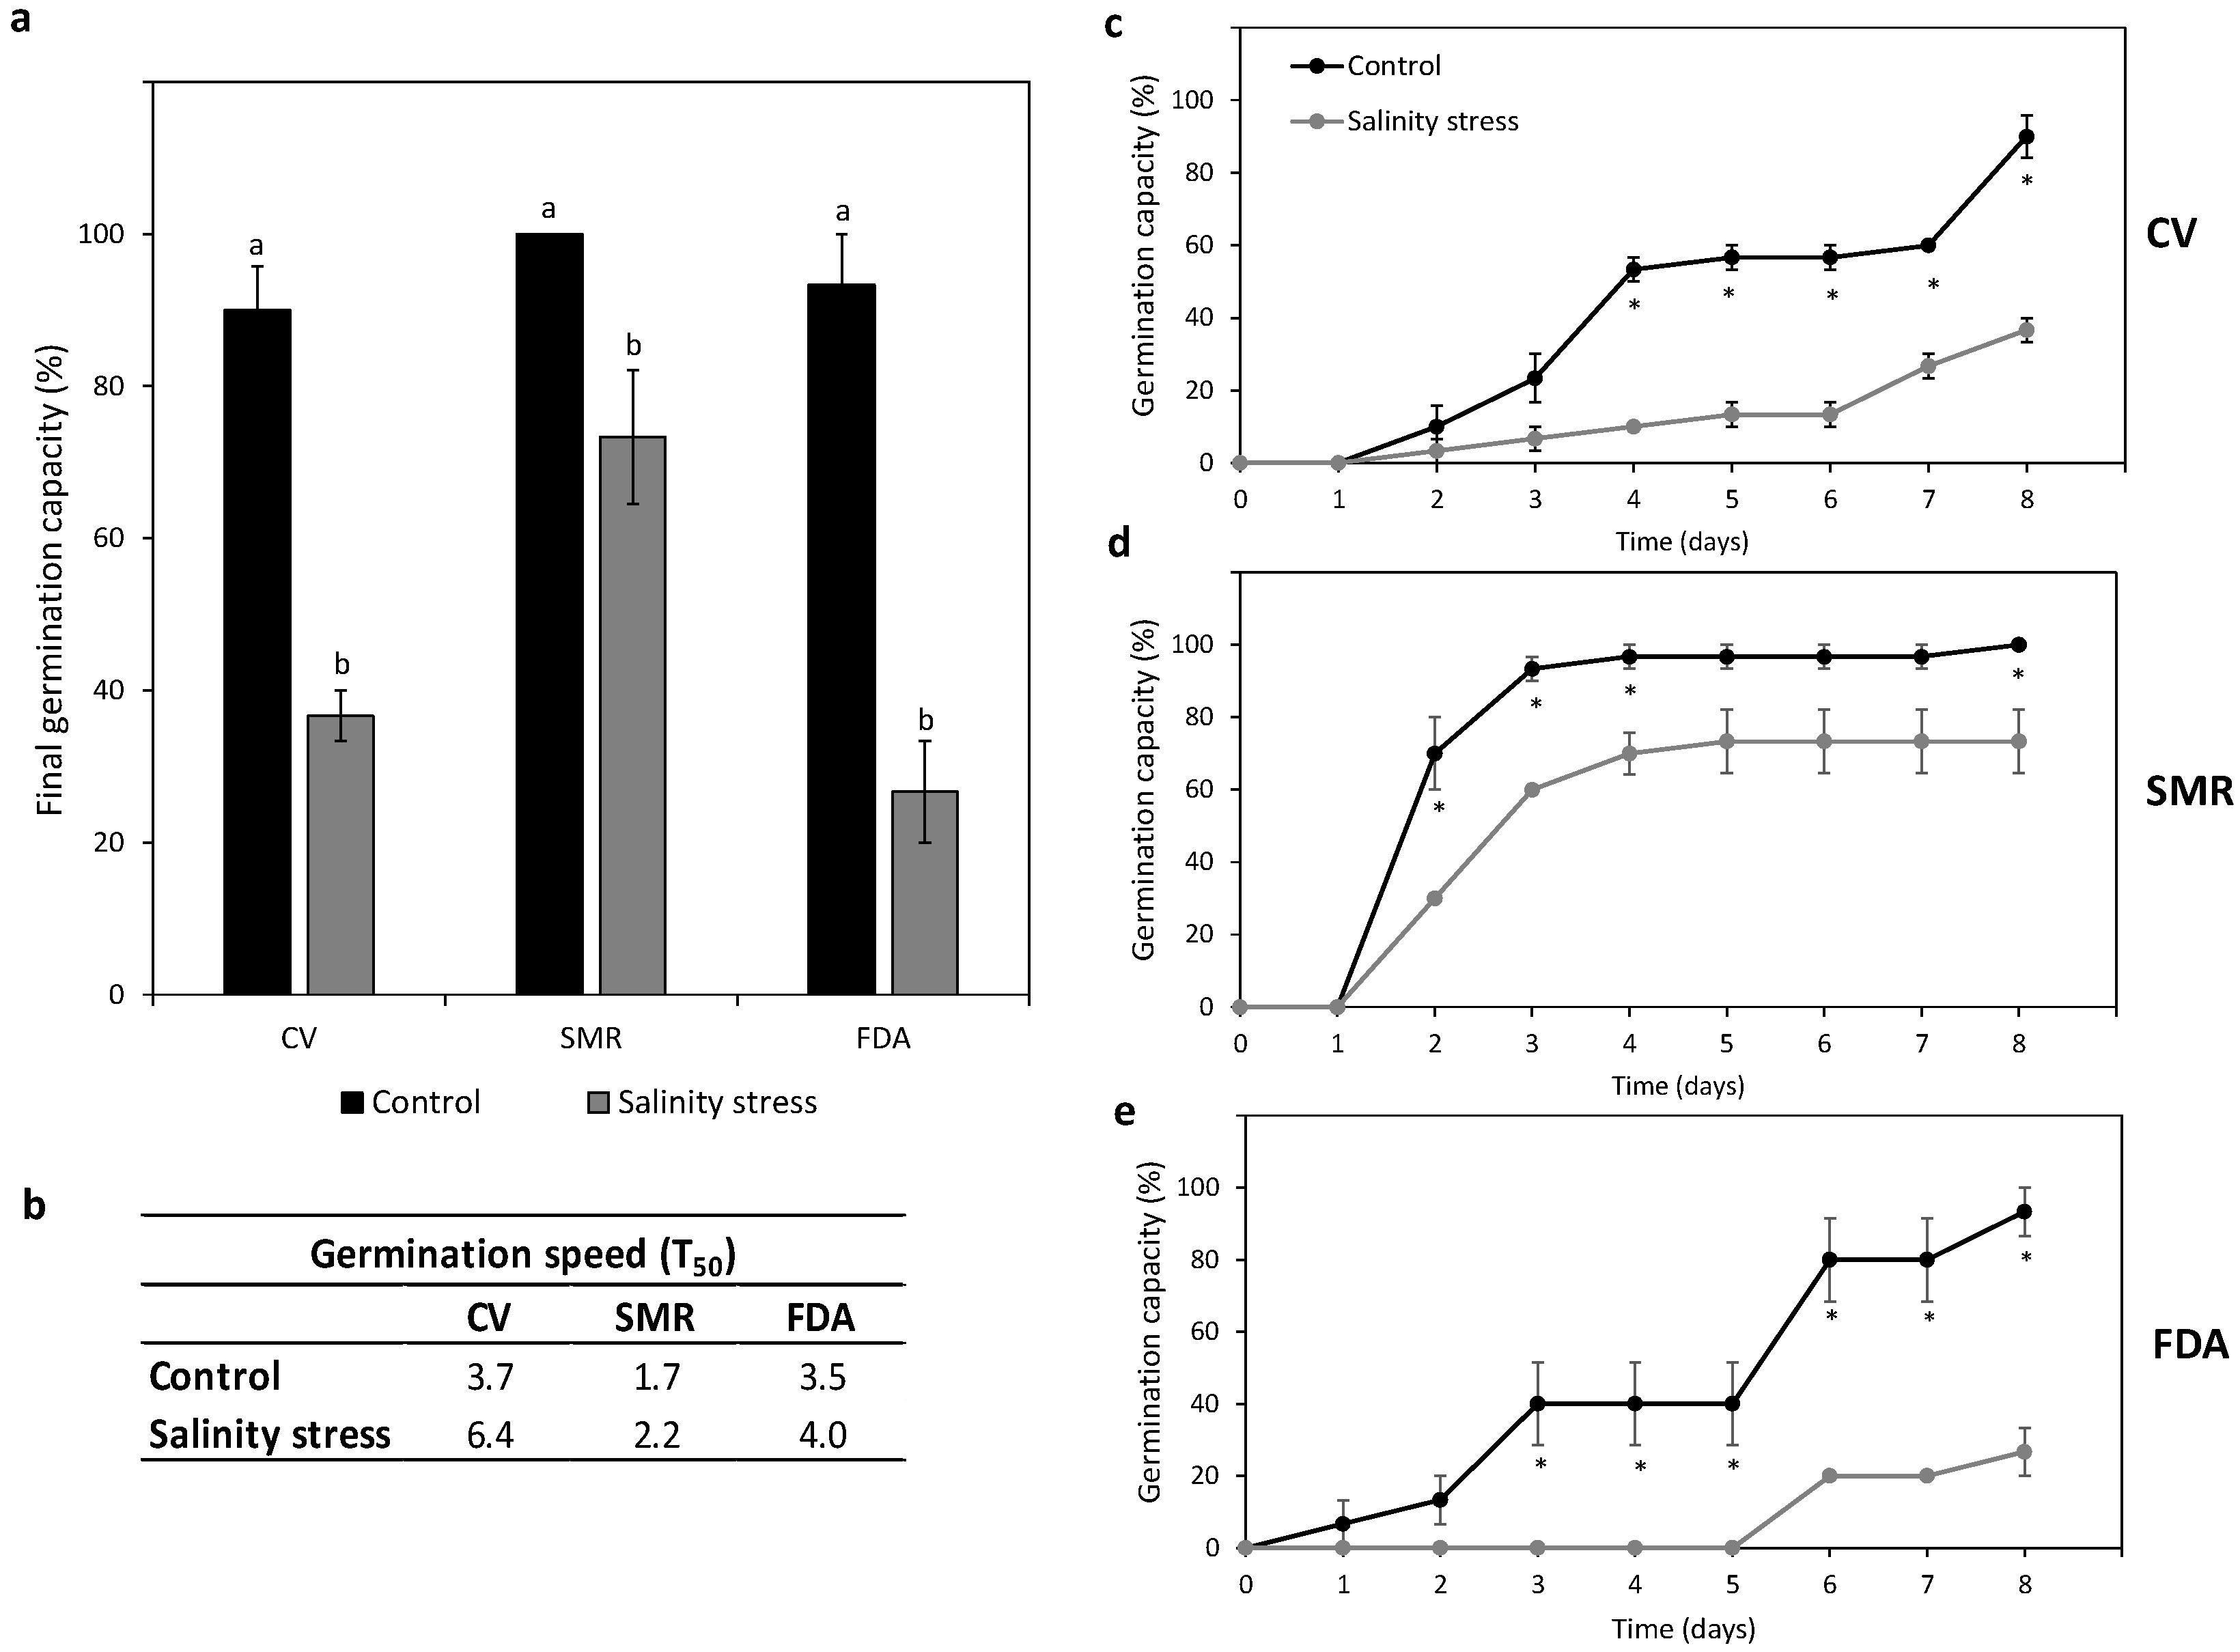
2.4. Seed Germination Behavior under Salt Stress

To germinate, sterilized seeds from each population were placed in 9 cm diameter Petri dishes on Whatman filter papers moistened with 2 mL of distilled water (control; 10 seeds) or with 200 mM NaCl solution to reproduce the osmotic potential of −0.8 MPa [50] (salt stress; 10 seeds). All the Petri dishes were subsequently kept in a growth chamber under controlled environmental conditions (25 °C with a photocycle of 16 h of light and 8 h of dark), and the solutions were renewed every 2 days.
The number of seeds germinated was recorded for 8 days (Supplementary Figure S2) and the data were expressed as the germination capacity/germination percentage and as the germination speed (mean ± standard error of three biological replicate). The germination capacity was obtained by dividing the number of germinated seeds in each Petri dish (n) by the total number of seeds tested (N), multiplied by 100 (G = n/N·100). The germination speed (T50), expressed as the number of days required to reach 50% of the final germination capacity, was calculated using the formula reported in Kouam et al. [51].

2.5. Plant Performance under Salt Stress

Eight Phaseolus vulgaris plants for each population were grown in a growth chamber (16 h light/8 h dark cycle under 25 °C temperature) in the control and salt stressed conditions for 15 days, as reported in Falcione et al. [47] (Supplementary Figure S2). At the end of the experiment, the soil electrical conductivity (EC) was measured (control soil EC: 1.35 dS·m−1; salt-stressed soil: 9.57 dS·m−1, data not showed) and plant material (roots and leaves) was harvested and subjected to further analyses.
The plant morphological changes were analyzed after the 15 days of treatment by measuring the fresh (FW) and dry biomass (DW) of different organs, together with the relative water content (RWC) and the photosynthetic pigments. In detail, the leaf and root FW was immediately measured after harvesting. Then, each organ was incubated in the dark in deionized water for 4 h and weighed to determine the turgid weight (TW). These samples were, successively, dried at 80 °C for 48 h and the DW was recorded. The RWC was calculated using the formula reported in Smart [52]: [(FW − DW)/(TW − DW)]·100. All the morpho-physiological measurements were performed on four plants and expressed as mean ± standard error.
The total chlorophyll (Chl), Chl A/Chl B ratio, and carotenoid contents were assessed following the spectrophotometric procedure described in Polzella et al. [53] and expressed as µg·mg−1 (mean ± standard error of triplicate measurements).
The plant stress response was evaluated in the roots and leaves of different landraces by analyzing the proline and sugar content and estimating the lipid peroxidation. In detail, the proline content and lipid peroxidation were evaluated as reported by Falcione et al. [47].
Briefly, the proline concentration was spectrophotometrically determined at 520 nm as the mean ± standard error of triplicate measurements using a standard curve and expressed as µmol·g−1 using the equation reported by Carillo and Gibon [54]. The lipid peroxidation, expressed as the malondialdehyde (MDA) content, was measured by using the thiobarbituric acid (TBA) method according to Abdallah et al. [55] as the mean ± standard error of triplicate measurements and was expressed as nmol·mL−1 (molar extinction coefficient reported by Hodges et al. [56]).
The total carbohydrate content was measured by using the Total Carbohydrate Assay Kit (MAK104, Sigma-Aldrich, St. Louis, MO, USA) according to the manufacturer’s instructions, with some modifications. In detail, plant material (50 mg) was homogenized in 200 µL of ice-cold Assay Buffer and the samples were centrifuged at 13,000× g for 5 min. Next, 150 µL of sulfuric acid (H2SO4) was added to 30 µL of supernatant and the mixture was heated at 90 °C for 15 min in the dark. Then, 30 µL of Developer were added to each sample and mixed well using a horizontal shaker for 5 min. Successively, H2O MilliQ was added to each sample and the absorbance was read at 490 nm with a spectrophotometer (Bio-Rad, South Granville, NSW, Australia). The amount of total carbohydrates present in the samples was determined from a standard curve made by dilutions of 2 mg·mL−1 D-Glucose standard and expressed as mg·g¯1 of fresh weight and as the mean ± standard error of triplicate measurements.

2.6. Statistical Analysis

The statistical analysis of the genetic and seed morpho-colorimetric data was conducted using Past Version 4.03 software (https://past.en.lo4d.com/windows, accessed on 1 October 2023). In detail, Principal Component Analysis (PCA) was carried out to define the role of each morphological trait in the grouping of accessions and cluster analysis was performed by unweighted pair group methods using arithmetic averages (UPGMA) with the Euclidean distance index to create a dendrogram. Principal Coordinate Analysis (PCoA) was carried out to estimate the overall genetic relationship among populations and UPGMA clustering was used with Jaccard’s similarity index to create a dendrogram.
The 1H NMR qualitative data were imported into MetaboAnalyst 5.0 (https://www.metaboanalyst.ca/, accessed on 15 October 2023) and PCA and Partial Least Squares Discriminant Analysis (PLS-DA) were performed. The quality of the PLS-DA model was evaluated using the correlation coefficient R2 and a cross-validation correlation coefficient Q2. Furthermore, the Variables Importance in Projection (VIPs) score (value > 1) for the PLS-DA was selected. Student’s t-test was performed to determine significant quantitative differences in the metabolite levels among populations (p ≤ 0.05).
Analysis of the anti-proliferative activity of the seed aqueous extracts on the Caco-2 cell line was performed by using two-way ANOVA followed by a Bonferroni post-test (p ≤ 0.05) on GraphPad Prism 5 (GraphPad, La Jolla, CA, USA) for Windows.
Differences between the control and treated samples in terms of the germination behavior and plant morpho-physiological (biomass, RWC and photosynthetic pigment content) and biochemical (proline, lipid peroxidation and total carbohydrate contents) parameters were determined through a Student’s t-test (p ≤ 0.05).

3. Results

3.1. Seed Morphological Traits and Genetic Data

The results of the seed morpho-colorimetric analysis are shown in Supplementary Table S2. The Principal Component Analysis (PCA) of the 14 seed morpho-colorimetric descriptors noted differences among the populations. In detail, in the PCA scatter plot (Figure 1a), along Principal Component 1 (PC 1), CV and SMR both appeared in negative coordinates values, while FDA projected in the positive coordinates. On the other hand, on the Principal Component 2 (PC 2), CV showed positive values, while FDA and SMR were placed along negative values. These differences were mainly related to the seed volume, seed weight, and seed coat colorimetric parameters (max gray value, modal gray value, and median values of the pixels in the selected image), accounting for 95.57% and 4.43% of the total variance, on the PC1 and PC 2, respectively (Supplementary Figure S3). The dendrogram, resulting from the unweighted pair group method with arithmetic mean (UPGMA) clustering, revealed two main clusters: cluster 1 was characterized by only FDA (Euclidean distance ≈ 160), and cluster 2 contained both CV and SMR (Euclidean distance ≈ 40) (Figure 1b).
The genetic relationships among the autochthonous common bean populations were analyzed by using eight inter-simple sequence repeat (ISSR) markers. The PCoA analysis of the amplified products resulted in a scatter plot with PCo 1 and PCo 2 scores that accounted for 87.14% and 12.86% of the total variance, respectively (Figure 1c). Regarding PCo 1, on the one hand, CV and SMR both showed negative coordinates values; on the other hand, FDA was distributed in positive coordinates (Figure 1c). Along PCo 2, only SMR was placed in positive values, while FDA and CV displayed negative values (Figure 1c). In the corresponding dendrogram, constructed using the UPGMA clustering, two main clusters were identified: FDA was assigned to cluster 1 (Jaccard similarity index ≈ 0.38); CV and SMR were grouped in cluster 2 (Jaccard similarity index ≈ 0.84) (Figure 1d).
The phaseolin pattern analysis [PCR amplification of sequence-characterized amplified region (SCAR) marker of the phaseolin (Phs) locus] allowed the assignment of the three common bean populations to the Andean gene pool. However, as also shown in Falcione et al. [47], the CV profile consisted of two fragments of 249 and 275 bp, typical of S-, B-, or H-type phaseolins, while both SMR and FDA contained three fragments of 249, 275 and 290 bp, characteristic of T-, C-, or A-type phaseolin profiles (Figure 1e).

3.2. NMR Metabolomic Profiling Data

The 1H NMR spectra of the common bean seed aqueous and lipophilic extracts showed a similar chemical profile among the populations. In detail, the 1H NMR spectrum of the aqueous extract revealed a total of 25 metabolites, which ranged from 0.90 to 10 ppm: 3 sugars, 13 amino acids, 5 organic acids, and 4 other miscellaneous compounds (Figure 2). The 1H and 13C NMR chemical shifts (Figure 2a) were assigned based on the 2D-NMR experiments (COSY, HSQC, and HMBC) and comparison with published data in the HMDB (Human Metabolome Database) (https://hmdb.ca/, accessed on 20 May 2023).
In detail, in the first region of the 1H NMR spectra (from 0.9 to 3.0 ppm), the signals of several amino acids (leucine, isoleucine, valine, threonine, alanine, proline, methionine, GABA, aspartate and asparagine) and organic acids (lactic acid, pipecolic acid, malic acid and citric acid) were detected (Figure 2b). The second region (from 3.0 to 4.5 ppm) was characterized by the presence of organic acids (pipecolic acid and malic acid), sugars (sucrose, raffinose, fructose, galactose, stachyose), and other miscellaneous compounds (choline and trigonelline) (Figure 2c). In the third region (from 4.5 to 5.9 ppm), several various sugars, such as stachyose, raffinose and sucrose, were observed (Figure 2d). The fourth region (from 5.9 to 7.9 ppm) was characterized by the signals of aromatic groups from amino acids (tyrosine, phenylalanine and tryptophan) and other compounds, such as uridine (Figure 2e). Finally, in the fifth region (from 7.9 to 9.2 ppm), evident signals of trigonelline and formic acid were found (Figure 2f).
The analysis of the 1H NMR spectrum of the seed lipophilic extracts, obtained from the three common bean populations, showed the presence of different metabolite classes: fatty acids in the first region, which ranged from 0.9 to 3.0 ppm, and glycerol and polyunsaturated fatty acids (PUFA), in the second one, which ranged from 3.0 to 6.0 ppm (Supplementary Figure S4). The assignments of the 1H NMR chemical shifts of the compounds were performed as described for the aqueous extract.
The data of the 1H NMR spectra of the aqueous seed extracts were imported for the construction of the PCA and Partial Least Squares Discriminant Analysis (PLS-DA) (Figure 3).
In the PCA score plot, PC1 and PC2 accounted for 39.6% and 26.4% of the total variance, respectively. Three separate groups, related to CV, SMR and FDA populations, can be observed. In detail, in PC1, FDA and CV were displayed along negative coordinates, with an outlier point of CV placed in positive values, while SMR was positioned in positive coordinates. The three populations can also be discriminated by PC2: FDA and SMR were placed in positive values, while CV was displayed along negative PC2 values (Figure 3a). The corresponding PCA loadings plot is reported in Supplementary Figure S5a.
PLS-DA was then applied to improve the group separation and to deeply investigate the sample classification according to the metabolic profiles expressed by the three different populations. The PLS-DA regression (R2 = 0.98; Q2 = 0.95) showed a good group separation along all the components in the score plot (PC1 = 33.5%; PC2 = 20.7%). In particular, CV and FDA were projected in negative PC1 coordinates, while SMR displayed along positive PC1 values. Regarding PC2, FDA and CV were placed in positive and negative values, respectively; conversely, SMR appeared in both positive and negative values (from 5 to −10) (Figure 3b). From the corresponding loadings plot (Supplementary Figure S5b), the metabolites responsible for data clustering in the PLS-DA, with a Variables Importance in Projection (VIPs) score > 1, were selected. The 10 most discriminant metabolites are illustrated in the VIPs plot in Supplementary Figure S6.

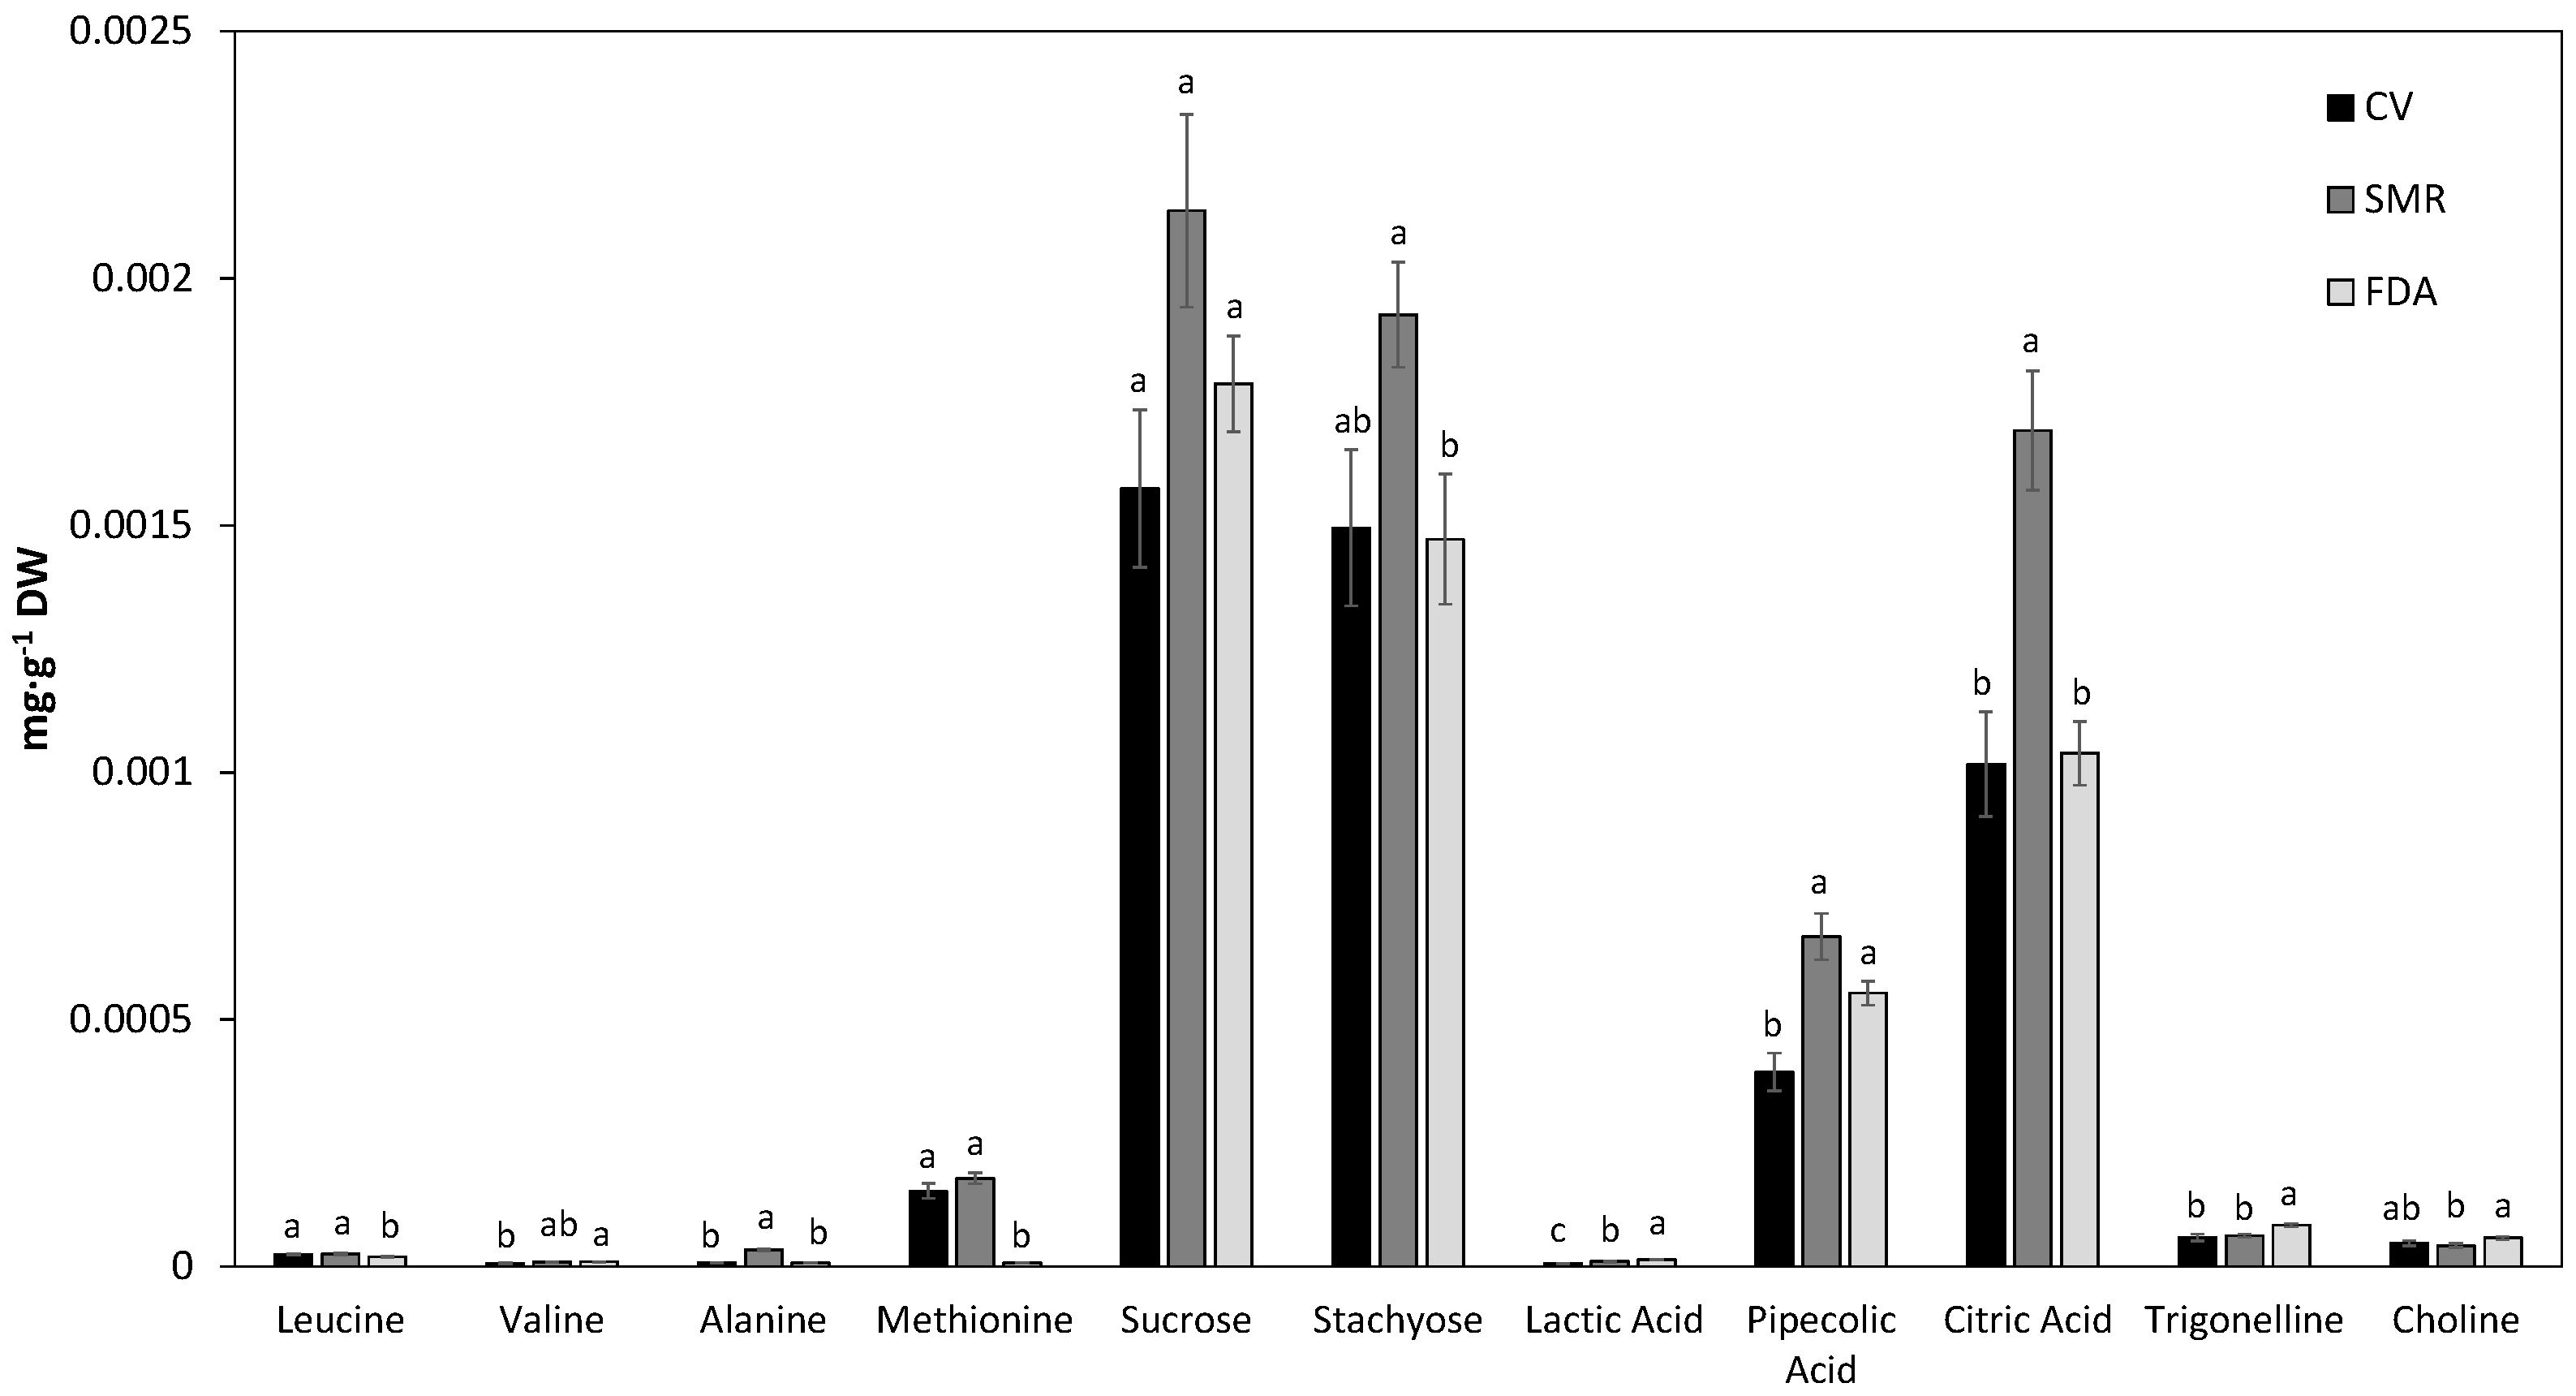
3.3. Quantification of Metabolites in Aqueous Common Bean Seed Extracts

Among all the metabolic profiles, the most intense and distinct signals of the 1H NMR spectra have been quantified. The dominant compounds, detected in the three bean populations, turned out to be sugars (sucrose and stachyose) and organic acids (citric and pipecolic acid) (Figure 4).
Sucrose and stachyose showed high contents in all three bean populations (sucrose: 0.0016–0.0021 mg·g−1 DW; stachyose: 0.0015–0.0019 mg·g−1 DW), with no significant variation in the sucrose content among the populations. In contrast, for stachyose, on the one hand, the amount present in CV showed no significant differences compared with SMR and FDA; on the other hand, the sugar concentration in SMR was significantly higher than that in FDA (Figure 4).
The three bean populations also contained substantial levels of organic acids (lactic acid: 5.40 × 10⁻⁶–1.35·10−5 mg × g−1 DW; pipecolic acid: 0.0004–0.0007 mg·g−1 DW; citric acid: 0.0010–0.0017 mg·g−1 DW), with the highest content detected for citric acid, followed by pipecolic and lactic acid (Figure 4). Regarding citric acid, SMR had the highest amount compared to CV and FDA; the latter showed no significant differences between them. In addition, SMR and FDA showed no significant differences in the pipecolic acid content, but these concentrations were higher than those observed in CV. Lastly, the highest lactic acid content was found in FDA, followed by SMR and CV (Figure 4).
Regarding amino acids, leucine, valine and alanine showed lower concentrations (leucine: 1.91 × 10⁻⁵–2.51 × 10⁻⁵ mg·g−1 DW; alanine: 7.15 × 10⁻⁶–3.35 × 10⁻⁵ mg·g−1 DW; valine: 6.42 × 10⁻⁶–9.05 × 10⁻⁶ mg·g−1 DW) than methionine (7.33 × 10⁻⁶–1.78 × 10⁻⁴ mg·g−1 DW). The methionine concentrations in CV and SMR were not significantly different but were higher than the content in FDA. For leucine, equivalent contents were found in CV and SMR, which were found to be higher than in FDA. SMR showed no differences in the valine concentrations compared with CV and FDA; however, the valine content in FDA was higher than in CV. Finally, SMR reported the highest alanine amount compared with CV and FDA (Figure 4).
Other compounds, such as trigonelline and choline, showed quite low content (trigonelline: 5.83 × 10⁻⁵–8.37 × 10⁻⁵ mg·g−1 DW; choline: 4.22 × 10⁻⁵–5.75 × 10⁻⁵ mg·g−1 DW). In detail, an increased trigonelline content was observed in FDA compared to CV and SMR. CV showed no differences with respect to SMR and FDA for choline, but FDA had a higher choline amount than SMR (Figure 4).

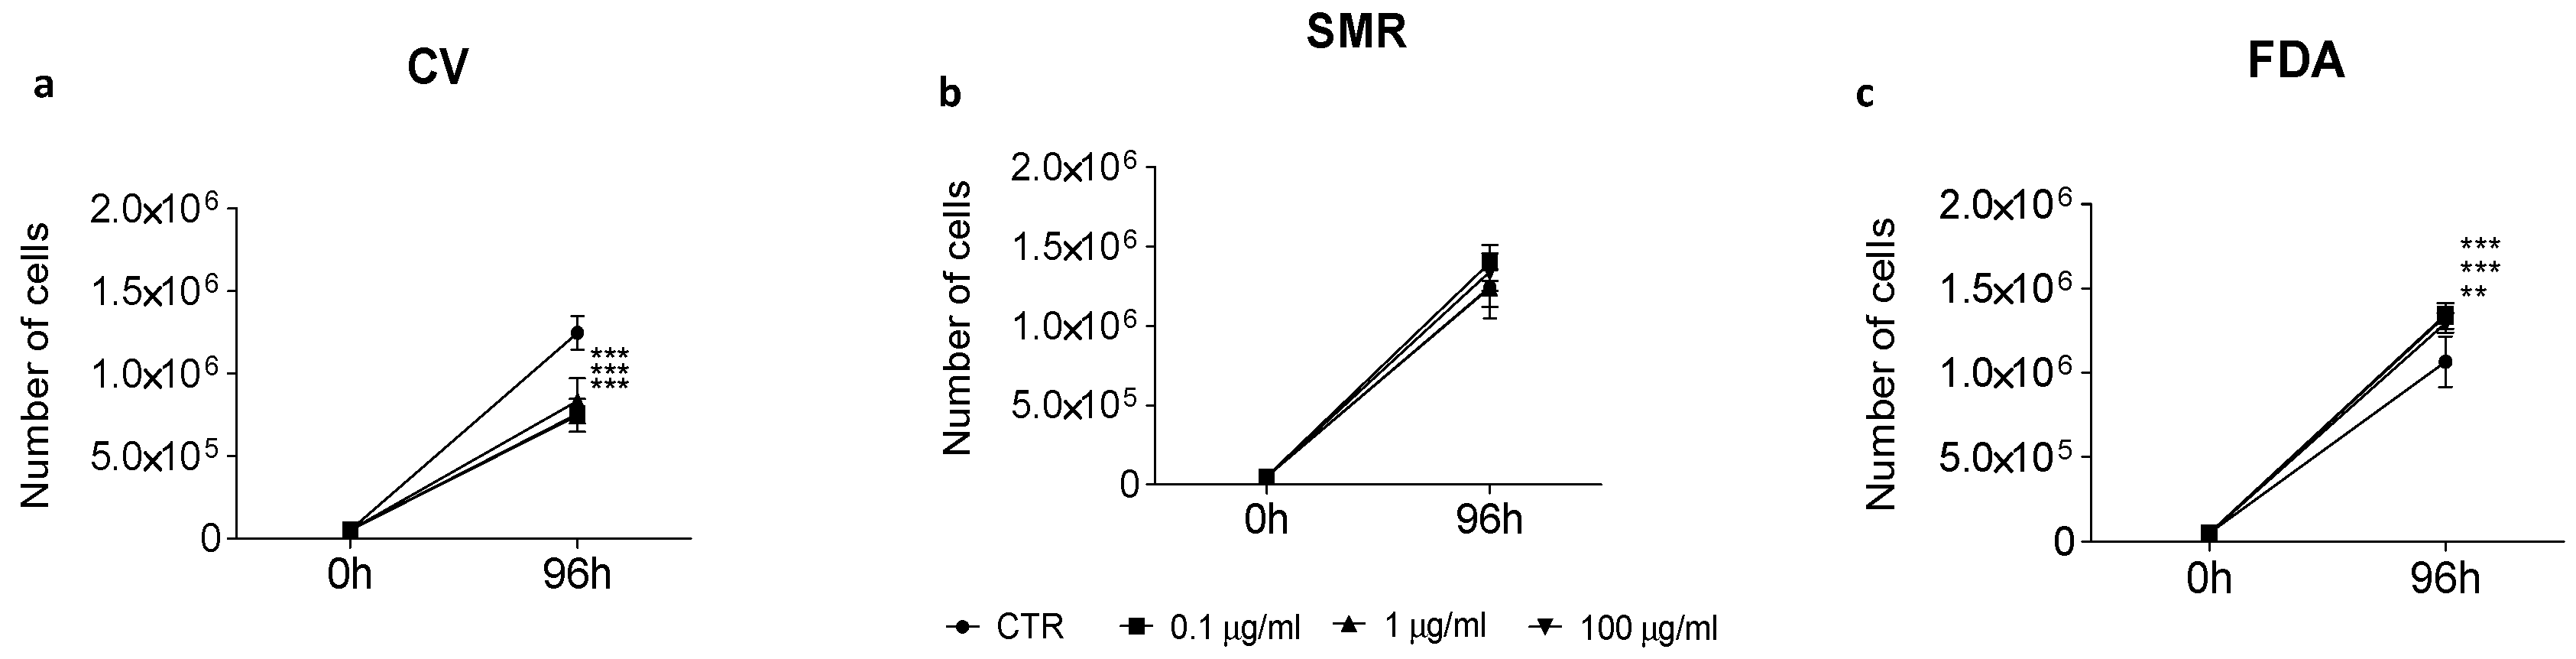
3.4. Anti-Proliferative Activity of Bean Aqueous Extracts on Caco-2 Cell Line

The aqueous bean extracts had different effects on the cell growth of the Caco-2 line (Figure 5). Specifically, after 96 h, the Caco-2 cell proliferation was significantly reduced following the administration of all three concentrations of CV extracts (Figure 5a). On the other hand, the increasing doses of SMR extracts induced no change in cell growth compared with the control (Figure 5b). Conversely, interestingly, all three concentrations of FDA extracts increased the number of Caco-2 cells compared to the vehicle-treated cells (Figure 5c).

3.5. Effects of Salt Stress on Germination and Plant Morpho-Physiological and Biochemical Responses

3.5.1. Germination Behavior

Seeds of the CV bean population that received no stress treatment had a final germination capacity of 90%. In comparison, a 37% final germination capacity was observed under salt stress treatment after 8 days (Figure 6a). Furthermore, the germination speed was also negatively affected by salinity stress, as indicated by the higher T50 value under salinity stress (T50 = 6.4) compared to control (T50 = 3.7) (Figure 6b). No difference was observed between the control and the stress condition during the first three days, while from the fourth day (4d) to the eighth day (8d), salinity stress induced a reduction in the germination rate. In detail, the salt stress condition decreased the germination capacity by five times at the fourth day with respect to the control (53%) until two times at the eighth day compared to the control condition (90%) (Figure 6c).
The SMR bean population reached 100% final germination capacity under controlled conditions, while a final germination percentage of 73% was observed under salinity stress (Figure 6a). A slight delay in the germination speed was reported under salinity stress (T50 = 2.2) with respect to the controlled conditions (T50 = 1.7) (Figure 6b). Salt treatment had little impact on the germination rate and only at the 2 d, 3 d, 4 d, and 8 d. More specifically, under salt stress conditions, the germination capacity was 2-fold lower (2 d) and 1-fold lower (3 d, 4 d and 8 d) than the control (2 d: 70%, 3 d: 93%, 4 d: 97%, 8 d: 100%) (Figure 6d).
The FDA untreated seeds reached the final germination of 93% at the 8 d, while the salt-treated showed a final germination capacity of 27% (Figure 6a). A slight decrease in the germination speed was also reported under salinity stress (T50 = 4.0) compared to the untreated seeds (T50 = 3.5) (Figure 6b). In detail, no significant differences were reported between the germination rates under controlled and salinity stress conditions during the first 2 days, whilst from the 3rd d to the end of germination test (8 d), the germination percentage was 0% (3 d, 4 d and 5 d), 20% (6 d and 7 d) and 27% (8 d) under salt stress, compared to control (3 d–5 d = 40%, 6 d–7 d = 80%, 8 d = 93%) (Figure 6e).

3.5.2. Plant Morpho-Physiological Data

The analysis of the biomass allocation showed that the fresh (FWroot) and dry (DWroot) root biomass did not change significantly in the SMR plants, while they were negatively affected by salinity stress in CV and FDA (Figure 7a,d). More specifically, salinity stress reduced the FWroot by 44% in CV and 56% in FDA, and it decreased the DWroot by 69% in CV and by 58% in FDA, compared with the control plants (Figure 7a,d). A decline in both the fresh and dry weight was observed in CV and FDA leaves under salt stress treatment: the leaf fresh weight (FWleaf) was reduced by 89% in CV and by 90% in FDA, while the leaf dry weight (DWleaf) declined by 44% and by 56% in CV and FDA, respectively. Conversely, salinity stress led to a reduction in the SMR FWleaf by 86%, while the SMR DWleaf was not affected by salt stress compared to the control (Figure 7b,e).
The root relative water content (RWCroot) was not influenced by the salt treatment. However, a decline in the leaf relative water content (RWCleaf) was shown in all three bean populations under salinity stress compared to the control. More specifically, the CV, SMR and FDA RWCleaf were reduced by 63%, 76%, and 78%, respectively (Figure 7g,h).
The analysis of the photosynthetic pigments revealed that salt stress induced an increase in the total chlorophylls in only CV (220%) and FDA (28%), whilst no significant change was found in SMR, compared to the control (Figure 7c). On the other hand, the Chl A/B ratio was decreased by 31% in CV, by 72% in SMR and by 45% in FDA under salinity stress (Figure 7f). Finally, salt stress caused an increase in the carotenoid content in all three populations compared to untreated plants: by 234% in CV, 22% in SMR, and 145% in FDA (Figure 7i).

3.5.3. Plant Biochemical Data

Salt stress led to increased proline in the roots and leaves of the bean populations (Figure 8a,d). In detail, proline increased in the roots of CV (116%) and SMR (38%), while no change was found in the FDA roots, compared to the control plants (Figure 8a). The leaf proline level was found to be sharply increased by salinity stress in all three bean populations: CV (1091%), SMR (823%), and FDA (1197%) (Figure 8d).
Salt stress differently affected the total carbohydrate content in the common bean roots and leaves (Figure 8b,e). Specifically, salt stress led to a decline in the root total carbohydrates in CV, SMR and FDA by 36%, 45% and 40%, respectively (Figure 8b). On the contrary, a significant total carbohydrate content increase was observed in the leaves of the three bean populations: CV (116%), SMR (123%) and FDA (1791%) (Figure 8e).
The analysis of the MDA content, directly related to oxidative damage, indicated a decrease in the lipid peroxidation levels in the SMR (by 44%) and FDA (by 34%) roots under salt stress treatment, whilst CV showed unchanged root MDA levels, compared with the control (Figure 8c). In the leaves, salt stress led to an increase in the MDA levels in all the bean populations: the MDA level in CV was increased by 1359%, in SMR by 871%, and in FDA by 462% (Figure 8f).

4. Discussion

In the present work, for the first time, the combined use of morphological, biochemical, molecular, and metabolomic data allowed for the differentiation of three Apennines landraces of Phaseolus vulgaris called “Ciliegino”, “Fagiolo D’Acqua”, and “San Michele Rosso”. In detail, despite CV and SMR sharing similar seed colorimetric features, CV seeds are bigger and more rounded compared to SMR. Indeed, besides these red-colored seed populations (CV and SMR) being grouped together and well separated from FDA in the genetic and morphological dendrograms, they were well differentiated along the PCA and PCoA. However, the diversity assessment could not be unequivocally performed when studies deal with few accessions [57], considering that a higher genetic distance between CV and SMR populations was observed in our previous work [47].
Their diversity also emerged by analyzing the phaseolin type: despite all the three common bean populations belonging to the Andean gene pool, SMR and FDA showed three typical bands of phaseolin, while the CV profile was characterized by two bands, as also reported in Falcione et al. [47]. This result matches with other studies reporting a higher frequency of the Andean gene pool among common bean germplasm dispersed in Italy, the Iberian Peninsula, and the Balkan area [10,35]. This suggests that most of the common bean landraces were brought to Italy more likely through Spain rather than directly from America—between the 16th and 17th centuries many Italian regions, including Molise, were under Spanish control. However, a certain extent of admixture in the phaseolin diversity also indicated the occurrence of past (or recurring) hybridization events among gene pools [58], in combination with adaptation to different environments [59]. Thus, the CV population, subjected to different domestication flux, could be as putative hybrids between the two Mesoamerican and Andean gene pools. Our research, carried out by collecting the historical memories of the elderly inhabitants of Vastogirardi village, suggested that CV seeds could have arrived in Molise territory between the late 1800s and the early 1900s through Italian emigrants to the United States and their return to Italy. The CV could originate from an old local bean landrace, recently discovered by some farmers and seed collectors, showing the same small, round and red coat seeds; it is named “True Red Cranberry Bean”, which used to be cultivated by the ancient native American tribe “Abenaki” in the northeastern areas of the United States, primarily in the region of Maine [60,61].
Alongside some similarities in the metabolomic profile, mainly due to amino acids, sugars, organic acids, nucleosides, and other miscellaneous compounds [62,63], specific metabolites also varied quantitatively among the landraces.
In detail, lactic acid, trigonelline and choline, as well as other molecules and micronutrients, highly enriched in the FDA seed aqueous extract, might play a role in FDA’s ability to stimulate the cell proliferation of colon cancer cells [64,65] as evaluated in this work. Excess lactic acid has been shown to promote tumor growth: it acts as an energy source, signaling molecule and key tumor immunosuppressive factor [66]. Trigonelline is an alkaloid formed from nicotinic acid that, even at very low concentrations, may act as a phytoestrogen able to elicit cell growth of estrogen receptor (ER)-expressing cells [67]. Since Caco-2 cells express ERβ and are responsive to the proliferative effects induced by estrogens [68], it is possible to speculate that trigonelline promotes Caco-2 cell growth by acting as an endocrine disruptor. Furthermore, it has recently been shown that, in vitro, choline not only promotes cell proliferation but is also linked to malignant transformation and cancer progression [69].
In contrast to what was observed in FDA, the low amounts of lactic acid and pipecolic acid found in the CV seed extracts may have played a suppressive role in cancer cell proliferation, causing the decrease in the number of Caco-2 cells at all the doses here tested. A recent study showed that silencing pyrroline-5-carboxylate reductase 1 (PYCR1), a biosynthetic enzyme that converts Δ1-piperidine-6-carboxylate to pipecolic acid, induced apoptosis and cell cycle arrest in prostate and hepatocellular carcinoma [70]. A similar effect could be hypothesized in colon cancer. However, some other classes of metabolites, such as phenolic compounds, generally contained in red-skinned beans may be responsible for the observed antiproliferative effects on colon cancer cells rather than lactic and pipecolic acid alone [71,72].
Other metabolites could be actively involved in the different abilities of the three common bean landraces to counteract salinity stress. Several studies reported that salinity hampers seed germination, inhibiting many seed enzymatic activities and cellular processes, directly inactivating proteins, producing reactive oxygen species (ROS) or interfering with mineral nutrition [73]. Furthermore, seed hydration, one of the crucial steps in the germination process, is inhibited by salinity-induced osmotic stress; this prevents or delays the germination process [74].
Compared to CV and FDA, effective SMR seed adaptive mechanisms seem to be able to cope with the adverse effects of salinity stress. The high amounts of citric acid and some amino acids, such as alanine, leucine and methionine, detected by the 1H–NMR spectra analysis, could play a protective role against salinity stress. Citric acid, acting as an antioxidative defense molecule, was probably involved in the recovery from ROS generated during stress conditions [75]. Free amino acids, such as alanine and leucine, in addition to serving as substrates for protein synthesis, also act as osmoprotectants under several abiotic stress conditions [76]. Methionine plays a key role in the synthesis of brassinosteroids, cytokinins and auxins to regulate/enhance plant growth, also functioning as a cofactor of antioxidants, vitamins, and polyamines [77]. Pipecolic acid acts as a critical regulator of plant immunity induced in response to biotic and abiotic stresses [78]. Thus, all these compounds might have played a role as compatible osmolytes, providing for: (i) osmotic adjustments; (ii) maintenance of cellular turgor; and/or (iii) alleviation of salt stress injury.
The SMR landrace also showed better performance than CV and FDA at the plant stage. Indeed, salt stress applied for 15 days had a negligible impact on the biomass accumulation in the roots and leaves of SMR plants, despite leading to a reduction in the leaf relative water content, an important indicator of plant water status [79]. It is argued that, under salinity stress conditions, plants decrease the hydraulic conductance of their roots to retain water and prevent its loss to salty soil. This mechanism could reduce the supply of (saline) water to the shoots, leading to reduced water potential in the SMR leaves [80].
As reported in several stress-sensitive grain legumes, including P. vulgaris [79,81,82], the growth retardation observed in CV and FDA could be attributed to the adverse effects of salinity on cell division and elongation: the excessive accumulation of salts around the root zone affects the water and nutrient uptake by the bean plantlets.
The combined results of the complex interactions among different molecular and biochemical features, such as the photosynthetic pigment content, lipid peroxidation and osmolyte accumulation (sugars and proline), generally contribute to the description of the observed diversity among landraces [83,84], but not in this case. Indeed, despite the low accumulation of sugars (and high proline) in all three landraces, the roots of SMR and FDA seemed to respond better than CV and the leaf counterpart, as demonstrated by the decrease in the amount of malondialdehyde (MDA) in this lower organ.
MDA, one of the end products of polyunsaturated fatty acid peroxidation in cells, is often used as a marker of oxidative damage [81]; on the other hand, it is known that proline, sugars, and carotenoids are all compounds that may alleviate oxidative stress damage [85].
Several studies have reported that the carbon translocation patterns from source (leaves) to sink (roots, stems, fruits, and seeds) are altered by salinity stress, leading to a consequent accumulation of sugars in the mature leaves to the detriment of the roots [86,87]. Similar results were also described in the studies conducted by Moles et al. [88], where soluble sugars were concentrated in tomato leaves to a greater extent than in the roots under salinity stress conditions.
In the leaves of all three common bean populations, salt stress induced a reduction in the ChlA/ChlB ratio and an increase in the amount of carotenoids. However, the total chlorophyll only increased in the CV and FDA leaves, while no change occurred in SMR due to the strong reduction in the ChlA content being counterbalanced by the increase in ChlB. Moreover, the proline, total sugars, and MDA content increased in the leaves of all three populations subjected to salt stress. Thus, besides the general role of the above-mentioned antioxidant molecules in alleviating oxidative stress and in osmoprotection [85], the structural reorganization in the main pigment–protein complexes may have contributed to maximizing the light harvesting and increasing the photosynthesis efficiency in SMR plants under stress conditions [89].
In some plant species, including P. vulgaris, the proline levels were higher in salt stress-sensitive cultivars compared to salt stress-tolerant examples as a consequence of disturbance in cell homeostasis, reflecting damage in the response to salt stress, thus a symptom of injury rather than an indicator of salinity resistance [47]. Furthermore, it is reported that prolonged salinity stress induces substantial proline accumulation to minimize salinity stress-related detrimental effects on plants [90]. This finding could explain the observed proline increase in all the populations, both the decreasing (CV and FDA) and unchanging (SMR) biomass accumulation, and the different ability of the CV and SMR populations to counteract mid- and long-term stress imposition, showing opposite behavior after 8 and 15 days of salt stress [47].
Taken together, the collected results led us to hypothesize the involvement/modulation of other enzymatic and non-enzymatic ROS detoxification systems that act differently in roots and leaves [91]. Although there are universal antioxidant defense mechanisms for all tissues, each organ uses the mechanisms that are most efficient for it and in harmony with its other metabolic networks, at a particular point of its age, to cope with salinity and the resulting oxidative stress [92].
Moreover, as recently demonstrated by Hernandez-Guerrero et al. [43], considering that common bean cultivars show analogous metabolomic profiles in the seeds and leaves, we can speculate an equivalent role of some detected compounds in the two organs. The high amount of citric acid, together with some free amino acids, such as alanine, leucine and methionine, could be able to counteract the salinity stress in the leaves of SMR when compared to CV and FDA and could represent climate-smart distinctive features of these dynamic landraces.

5. Conclusions

The complementary characterization approach performed in this study allows us to recognize three Apennines common bean landraces as a unique source of morphological/genetic diversity and bioactive chemical features. Although the use of neutral molecular markers, together with the analysis of genetic pool and morphological descriptors, can provide insights into the patterns and amounts of diversity found among landrace populations, they cannot be essential to translating landraces into competitive products. Conversely, NMR-based metabolomics results in a fast and reliable analytical tool to estimate similarities and differences in valuable bioactive compounds as potential resources to meet some contemporary societal challenges—plant biodiversity preservation/sustainable development under climate change and human well-being. The collected data also highlighted that plants undergo specific spatial and temporal physiological and biochemical reprogramming to adapt/balance growth and respond to stressful conditions. A mass spectrometry-based metabolomics approach should be used to decipher all the actors involved in the response of both above and below ground plant organs.
Further studies should be devoted to the investigation of the anti- and pro-tumoral mechanisms of common bean extracts in colon cancer cells, performing different typologies of assays aimed at evaluating the effects of total extracts or purified metabolites on apoptosis, senescence and autophagy processes.
Overall, this information, besides supporting the conservation strategies for this endangered locally adapted germplasm, could also act as a driving force for the development and promotion of the inland marginal areas, where these resources are generally confined.

Supplementary Materials

The following supporting information can be downloaded at https://www.mdpi.com/article/10.3390/d16040240/s1, Table S1: Primers used for ISSR and SCAR analysis; Table S2: Seed morpho-colorimetric descriptors and analysis; Figure S1: Plant material collection; Figure S2: Plants and seeds subjected to salt treatment; Figure S3: Most discriminant variables in the seed morpho-colorimetric analysis; Figure S4: 1H NMR spectra of common bean seed lipophilic extracts; Figure S5: Loadings plot of the corresponding PCA and PLS-DA computed on the NMR qualitative data; Figure S6: Variables Importance in Projection (VIPs) plot of the PLS-DA.

Author Contributions

Conceptualization and Project administration, D.T. and G.S.S.; Supervision, D.T. and M.S. (Marco Segatto); Data curation, D.T. and M.F.; Formal analysis and Investigation, M.F., A.R., V.S. and M.C.; Validation and Visualization, D.T., M.F. and M.S. (Melissa Simiele); Writing—original draft, D.T., M.F. and M.S. (Melissa Simiele); Writing—review and editing, D.T. All authors have read and agreed to the published version of the manuscript.

Funding

This research was funded by the research project “DEMETRA—Ideazione e validazione di sistemi produttivi multifunzionali e diversificati basati sull’integrazione tra produzioni vegetali ed animali nelle aree marginali dell’Italia centro-meridionale” (CUP: H38D20000110001) of the Italian Minister of Agriculture, Food and Forestry Policies and of Tourism (MiPAAF) and by the Piano Stralcio “Ricerca e Innovazione 2015–2017”—Asse “Capitale Umano”, Fondo per lo Sviluppo e la Coesione (FSC), in the research topic “Aree interne/aree marginalizzate”(DOT197K79Z, beneficiary of PhD fellowship: Martina Falcione, CUP:H59C21000240001), of the Italian Ministry of University and Research (MIUR).

Institutional Review Board Statement

Not applicable.

Data Availability Statement

The original contributions presented in the study are included in the article/supplementary material, further inquiries can be directed to the corresponding author.

Acknowledgments

The authors are grateful to Mario Di Lorenzo, director of GAL (Gruppo di Azione Locale)—Agnone (IS), Italy, for the support during the germplasm collecting activity throughout the Alto Medio Sannio Inner Area and to all the growers who kindly provided the plant material.

Conflicts of Interest

The authors declare no conflicts of interest.

References

  1. Khoury, C.K.; Brush, S.; Costich, D.E.; Curry, H.A.; de Haan, S.; Engels, J.M.M.; Guarino, L.; Hoban, S.; Mercer, K.L.; Miller, A.J.; et al. Crop genetic erosion: Understanding and responding to loss of crop diversity. New Phytol. 2022, 233, 84–118. [Google Scholar] [CrossRef]
  2. Azeez, M.A.; Adubi, A.O.; Durodola, F.A.; Azeez, M.A.; Adubi, A.O.; Durodola, F.A. Landraces and Crop Genetic Improvement. In Rediscovery of Landraces as a Resource for the Future; IntechOpen: London, UK, 2018; pp. 1–19. [Google Scholar]
  3. Marone, D.; Russo, M.A.; Mores, A.; Ficco, D.B.M.; Laidò, G.; Mastrangelo, A.M.; Borrelli, G.M. Importance of landraces in cereal breeding for stress tolerance. Plants 2021, 10, 1267. [Google Scholar] [CrossRef]
  4. Berni, R.; Cantini, C.; Romi, M.; Hausman, J.-F.; Guerriero, G.; Cai, G. Agrobiotechnology goes wild: Ancient local varieties as sources of bioactives. Int. J. Mol. Sci. 2018, 19, 2248. [Google Scholar] [CrossRef]
  5. Idrissi, O.; Piergiovanni, A.R.; Toklu, F.; Houasli, C.; Udupa, S.M.; Keyser, E.D.; Damme, P.V.; Riek, J.D. Molecular variance and population structure of lentil (Lens culinaris Medik.) landraces from Mediterranean countries as revealed by simple sequence repeat DNA markers: Implications for conservation and use. Plant Genet. Resour. 2018, 16, 249–259. [Google Scholar] [CrossRef]
  6. Pereira-Dias, L.; Vilanova, S.; Fita, A.; Prohens, J.; Rodríguez-Burruezo, A. Genetic diversity, population structure, and relationships in a collection of pepper (Capsicum spp.) landraces from the Spanish centre of diversity revealed by genotyping-by-sequencing (GBS). Hortic. Res. 2019, 6, 54. [Google Scholar] [CrossRef]
  7. Martinelli, F.; Vollheyde, A.-L.; Cebrián-Piqueras, M.A.; von Haaren, C.; Lorenzetti, E.; Barberi, P.; Loreto, F.; Piergiovanni, A.R.; Totev, V.V.; Bedini, A.; et al. LEGU-MED: Developing biodiversity-based agriculture with legume cropping systems in the Mediterranean basin. Agronomy 2022, 12, 13. [Google Scholar] [CrossRef]
  8. Maphosa, Y.; Jideani, V.A. The Role of Legumes in Human Nutrition. In Functional Food; Hueda, M.C., Ed.; IntechOpen: Rijeka, Croatia, 2017; pp. 103–121. [Google Scholar]
  9. Nadeem, M.A.; Yeken, M.Z.; Shahid, M.Q.; Habyarimana, E.; Yılmaz, H.; Alsaleh, A.; Hatipoğlu, R.; Çilesiz, Y.; Khawar, K.M.; Ludidi, N.; et al. Common bean as a potential crop for future food security: An overview of past, current and future contributions in genomics, transcriptomics, transgenics and proteomics. Biotechnol. Biotechnol. Equip. 2021, 35, 759–787. [Google Scholar] [CrossRef]
  10. Angioi, S.A.; Rau, D.; Attene, G.; Nanni, L.; Bellucci, E.; Logozzo, G.; Negri, V.; Spagnoletti Zeuli, P.L.; Papa, R. Beans in Europe: Origin and structure of the European landraces of Phaseolus vulgaris L. Theor. Appl. Genet. 2010, 121, 829–843. [Google Scholar] [CrossRef]
  11. Gill-Langarica, H.R.; Muruaga-Martínez, J.S.; Vargas-Vázquez, M.L.P.; Rosales-Serna, R.; Mayek-Pérez, N. Genetic diversity analysis of common beans based on molecular markers. Genet. Mol. Biol. 2011, 34, 595–605. [Google Scholar] [CrossRef]
  12. Bulut, M.; Wendenburg, R.; Bitocchi, E.; Bellucci, E.; Kroc, M.; Gioia, T.; Susek, K.; Papa, R.; Fernie, A.R.; Alseekh, S. A comprehensive metabolomics and lipidomics atlas for the legumes common bean, chickpea, lentil and lupin. Plant J. 2023, 116, 1152–1171. [Google Scholar] [CrossRef]
  13. Uebersax, M.A.; Cichy, K.A.; Gomez, F.E.; Porch, T.G.; Heitholt, J.; Osorno, J.M.; Kamfwa, K.; Snapp, S.S.; Bales, S. Dry beans (Phaseolus vulgaris L.) as a vital component of sustainable agriculture and food security—A review. Legume Sci. 2023, 5, e155. [Google Scholar] [CrossRef]
  14. Everwand, G.; Cass, S.; Dauber, J.; Williams, M.; Stout, J. Legume Crops and Biodiversity. In Legumes in Cropping Systems; Murphy-Bokern, D., Stoddard, F.L., Watson, C.A., Eds.; CABI: Wallingford, UK, 2017; pp. 55–69. [Google Scholar]
  15. de Koning, R.; Wils, G.E.; Kiekens, R.; De Vuyst, L.; Angenon, G. Impact of drought and salt stress on galactinol and raffinose family oligosaccharides in common bean (Phaseolus vulgaris). AoB PLANTS 2023, 15, plad038. [Google Scholar] [CrossRef]
  16. Murube, E.; Beleggia, R.; Pacetti, D.; Nartea, A.; Frascarelli, G.; Lanzavecchia, G.; Bellucci, E.; Nanni, L.; Gioia, T.; Marciello, U.; et al. Characterization of nutritional quality traits of a common bean germplasm collection. Foods 2021, 10, 1572. [Google Scholar] [CrossRef]
  17. Giuberti, G.; Tava, A.; Mennella, G.; Pecetti, L.; Masoero, F.; Sparvoli, F.; Lo Fiego, A.; Campion, B. Nutrients’ and antinutrients’ seed content in common bean (Phaseolus vulgaris L.) lines carrying mutations affecting seed composition. Agronomy 2019, 9, 317. [Google Scholar] [CrossRef]
  18. Wang, S.; Chen, L.; Yang, H.; Gu, J.; Wang, J.; Ren, F. Regular intake of white kidney beans extract (Phaseolus vulgaris L.) induces weight loss compared to placebo in obese human subjects. Food Sci. Nutr. 2020, 8, 1315–1324. [Google Scholar] [CrossRef]
  19. Ferreira, H.; Vasconcelos, M.; Gil, A.M.; Pinto, E. Benefits of pulse consumption on metabolism and health: A systematic review of randomized controlled trials. Crit. Rev. Food Sci. Nutr. 2021, 61, 85–96. [Google Scholar] [CrossRef]
  20. Food and Agriculture Organization of the United Nations (FAO). The State of Food and Agriculture 2016: Climate Change, Agriculture and Food Security—World|ReliefWeb. Available online: https://reliefweb.int/report/world/state-food-and-agriculture-2016-climate-change-agriculture-and-food-security (accessed on 10 October 2023).
  21. Martínez-Nieto, M.I.; González-Orenga, S.; Soriano, P.; Prieto-Mossi, J.; Larrea, E.; Doménech-Carbó, A.; Tofei, A.M.; Vicente, O.; Mayoral, O. Are traditional Lima Bean (Phaseolus lunatus L.) landraces valuable to cope with climate change? Effects of drought on growth and biochemical stress markers. Agronomy 2022, 12, 1715. [Google Scholar] [CrossRef]
  22. United Nations. THE 17 GOALS|Sustainable Development. Available online: https://sdgs.un.org/goals (accessed on 13 December 2023).
  23. Lee, C.E.; Downey, K.; Colby, R.S.; Freire, C.A.; Nichols, S.; Burgess, M.N.; Judy, K.J. Recognizing salinity threats in the climate crisis. Integr. Comp. Biol. 2022, 62, 441–460. [Google Scholar] [CrossRef]
  24. Atta, K.; Mondal, S.; Gorai, S.; Singh, A.P.; Kumari, A.; Ghosh, T.; Roy, A.; Hembram, S.; Gaikwad, D.J.; Mondal, S.; et al. Impacts of salinity stress on crop plants: Improving salt tolerance through genetic and molecular dissection. Front. Plant Sci. 2023, 14, 1241736. [Google Scholar] [CrossRef]
  25. Vineeth, T.V.; Krishna, G.K.; Pandesha, P.H.; Sathee, L.; Thomas, S.; James, D.; Ravikiran, K.T.; Taria, S.; John, C.; Vinaykumar, N.M.; et al. Photosynthetic machinery under salinity stress: Trepidations and adaptive mechanisms. Photosynthetica 2023, 61, 73–93. [Google Scholar] [CrossRef]
  26. Ahmadian, S.; Bayat, F. Morpho-biochemical responses to salinity tolerance in common bean (Phaseolus vulgaris L.). Afr. J. Agric. Res. 2016, 11, 1289–1298. [Google Scholar] [CrossRef]
  27. Kaymakanova, M. Effect of salinity on germination and seed physiology in bean (Phaseolus vulgaris L.). Biotechnol. Biotechnol. Equip. 2009, 23, 326–329. [Google Scholar] [CrossRef]
  28. Cokkizgin, A. Salinity stress in common bean (Phaseolus vulgaris L.) seed germination. Not. Bot. Horti Agrobot. Cluj-Napoca 2012, 40, 177–182. [Google Scholar] [CrossRef]
  29. Bourgault, M.; Madramootoo, C.A.; Webber, H.A.; Stulina, G.; Horst, M.G.; Smith, D.L. Effects of deficit irrigation and salinity stress on common bean (Phaseolus vulgaris L.) and mungbean (Vigna radiata (L.) Wilczek) grown in a controlled environment. J. Agron. Crop Sci. 2010, 196, 262–272. [Google Scholar] [CrossRef]
  30. Çirka, M.; Tunçtürk, R.; Kulaz, H.; Tunçtürk, M. Effects of salt stress on some growth parameters and biochemical changes in bean (Phaseolus vulgaris L.). Acta Sci. Pol. Hortorum Cultus 2022, 3, 53–63. [Google Scholar] [CrossRef]
  31. Al Hassan, M.; Morosan, M.; López-Gresa, M.D.P.; Prohens, J.; Vicente, O.; Boscaiu, M. Salinity-induced variation in biochemical markers provides insight into the mechanisms of salt tolerance in common (Phaseolus vulgaris) and runner (P. coccineus) beans. Int. J. Mol. Sci. 2016, 17, 1582. [Google Scholar] [CrossRef]
  32. Assimakopoulou, A.; Salmas, I.; Nifakos, K.; Kalogeropoulos, P. Effect of salt stress on three green bean (Phaseolus vulgaris L.) cultivars. Not. Bot. Horti Agrobot. Cluj-Napoca 2015, 43, 113–118. [Google Scholar] [CrossRef]
  33. Dasgan, H.; Koc, S. Evaluation of salt tolerance in common bean genotypes by ion regulation and searching for screening parameters. J. Food Agric. Environ. 2009, 77, 363–372. [Google Scholar]
  34. De Luca, D.; Cennamo, P.; Del Guacchio, E.; Di Novella, R.; Caputo, P. Conservation and genetic characterisation of common bean landraces from Cilento region (southern Italy): High differentiation in spite of low genetic diversity. Genetica 2018, 146, 29–44. [Google Scholar] [CrossRef]
  35. Catarcione, G.; Paolacci, A.R.; Alicandri, E.; Gramiccia, E.; Taviani, P.; Rea, R.; Costanza, M.T.; De Lorenzis, G.; Puccio, G.; Mercati, F.; et al. Genetic diversity and population structure of common bean (Phaseolus vulgaris L.) landraces in the Lazio Region of Italy. Plants 2023, 12, 744. [Google Scholar] [CrossRef]
  36. Agenzia per la Coesione Territoriale Strategia Nazionale Aree Interne. Available online: https://www.agenziacoesione.gov.it/strategia-nazionale-aree-interne/?lang=en (accessed on 7 October 2023).
  37. Bertini, A.; Caruso, I.; Vitolo, T. Inland areas, protected natural areas and sustainable development. Eng. Proc. 2022, 18, 20. [Google Scholar] [CrossRef]
  38. Stagnati, L.; Soffritti, G.; Martino, M.; Lanubile, A.; Desiderio, F.; Ravasio, A.; Marocco, A.; Rossi, G.; Busconi, M. Morphological and genetic characterization of local maize accessions from Emilia Romagna Region, Italy. Sustainability 2022, 14, 91. [Google Scholar] [CrossRef]
  39. Yıldız Madakbaş, S.; Halima, A.; Kelly, J. Determination of phaseolin types in common bean (Phaseolus vulgaris) varieties from Turkey. Greener J. Agric. Sci. 2014, 4, 39–45. [Google Scholar] [CrossRef]
  40. López-Pedrouso, M.; Bernal, J.; Franco, D.; Zapata, C. Evaluating two-dimensional electrophoresis profiles of the protein phaseolin as markers of genetic differentiation and seed protein quality in common bean (Phaseolus vulgaris L.). J. Agric. Food Chem. 2014, 62, 7200–7208. [Google Scholar] [CrossRef]
  41. Longobardi, F.; Innamorato, V.; Di Gioia, A.; Ventrella, A.; Lippolis, V.; Logrieco, A.F.; Catucci, L.; Agostiano, A. Geographical origin discrimination of lentils (Lens culinaris Medik.) using 1H NMR fingerprinting and multivariate statistical analyses. Food Chem. 2017, 237, 743–748. [Google Scholar] [CrossRef]
  42. Llorach, R.; Favari, C.; Alonso, D.; Garcia-Aloy, M.; Andres-Lacueva, C.; Urpi-Sarda, M. Comparative metabolite fingerprinting of legumes using LC-MS-based untargeted metabolomics. Food Res. Int. 2019, 126, 108666. [Google Scholar] [CrossRef]
  43. Hernández-Guerrero, C.J.; Villa-Ruano, N.; Zepeda-Vallejo, L.G.; Hernández-Fuentes, A.D.; Ramirez-Estrada, K.; Zamudio-Lucero, S.; Hidalgo-Martínez, D.; Becerra-Martínez, E. Bean cultivars (Phaseolus vulgaris L.) under the spotlight of NMR metabolomics. Food Res. Int. 2021, 150, 110805. [Google Scholar] [CrossRef]
  44. Mecha, E.; Erny, G.L.; Guerreiro, A.C.L.; Feliciano, R.P.; Barbosa, I.; Bento da Silva, A.; Leitão, S.T.; Veloso, M.M.; Rubiales, D.; Rodriguez-Mateos, A.; et al. Metabolomics profile responses to changing environments in a common bean (Phaseolus vulgaris L.) germplasm collection. Food Chem. 2022, 370, 131003. [Google Scholar] [CrossRef]
  45. Agenzia per la Coesione Territoriale Alto Medio Sannio. Available online: https://www.agenziacoesione.gov.it/strategia-nazionale-aree-interne/regione-molise-aree-interne/alto-medio-sannio/ (accessed on 7 November 2023).
  46. Loddo, A.; Di Ruberto, C.; Vale, A.M.P.G.; Ucchesu, M.; Soares, J.M.; Bacchetta, G. An effective and friendly tool for seed image analysis. Vis. Comput. 2023, 39, 335–352. [Google Scholar] [CrossRef]
  47. Falcione, M.; Simiele, M.; Renella, A.; Scippa, G.S.; Di Martino, P.; Trupiano, D. A multi-level approach as a powerful tool to identify and characterize some Italian autochthonous common bean (Phaseolus vulgaris L.) landraces under a changing environment. Plants 2022, 11, 2790. [Google Scholar] [CrossRef] [PubMed]
  48. Samukha, V.; Fantasma, F.; D’Urso, G.; Caprari, C.; De Felice, V.; Saviano, G.; Lauro, G.; Casapullo, A.; Chini, M.G.; Bifulco, G.; et al. NMR metabolomics and chemometrics of commercial varieties of Phaseolus vulgaris L. seeds from Italy and in vitro antioxidant and antifungal activity. Plants 2024, 13, 227. [Google Scholar] [CrossRef]
  49. Villa-Ruano, N.; Ramírez-Meraz, M.; Méndez-Aguilar, R.; Zepeda-Vallejo, L.G.; Álvarez-Bravo, A.; Pérez-Hernández, N.; Becerra-Martínez, E. 1H NMR-based metabolomics profiling of ten new races from Capsicum annuum cv. serrano produced in Mexico. Food Res. Int. 2019, 119, 785–792. [Google Scholar] [CrossRef]
  50. Sosa, L.; Llanes, A.; Reinoso, H.; Reginato, M.; Luna, V. Osmotic and specific ion effects on the germination of Prosopis strombulifera. Ann. Bot. 2005, 96, 261–267. [Google Scholar] [CrossRef] [PubMed]
  51. Kouam, E.B.; Ndo, S.M.; Mandou, M.S.; Chotangui, A.H.; Tankou, C.M. Genotypic variation in tolerance to salinity of common beans cultivated in Western Cameroon as assessed at germination and during early seedling growth. Open Agric. 2017, 2, 600–610. [Google Scholar] [CrossRef]
  52. Smart, R.E. Rapid estimates of relative water content. Plant Physiol. 1974, 53, 258–260. [Google Scholar] [CrossRef]
  53. Polzella, A.; De Zio, E.; Arena, S.; Scippa, G.; Scaloni, A.; Montagnoli, A.; Chiatante, D.; Trupiano, D. Toward an understanding of mechanisms regulating plant response to biochar application. Plant Biosyst.-Int. J. Deal. Asp. Plant Biol. 2018, 153, 163–172. [Google Scholar] [CrossRef]
  54. Carillo, P.; Gibon, Y.; Prometheus Wiki Contributors. PROTOCOL: Extraction and determination of proline. PrometheusWiki 2011, 2011, 1–5. [Google Scholar]
  55. Abdallah, M.B.; Trupiano, D.; Polzella, A.; Zio, E.D.; Sassi, M.; Scaloni, A.; Zarrouk, M.; Youssef, N.B.; Scippa, G.S. Unraveling physiological, biochemical and molecular mechanisms involved in olive (Olea europaea L. cv. Chétoui) tolerance to drought and salt stresses. J. Plant Physiol. 2018, 220, 83–95. [Google Scholar] [CrossRef] [PubMed]
  56. Hodges, D.M.; DeLong, J.M.; Forney, C.F.; Prange, R.K. Improving the thiobarbituric acid-reactive-substances assay for estimating lipid peroxidation in plant tissues containing anthocyanin and other interfering compounds. Planta 1999, 207, 604–611. [Google Scholar] [CrossRef]
  57. Pagnotta, M.A.; Fernández, J.A.; Sonnante, G.; Egea-Gilabert, C. Genetic diversity and accession structure in European Cynara cardunculus collections. PLoS ONE 2017, 12, e0178770. [Google Scholar] [CrossRef]
  58. Raggi, L.; Pacicco, L.C.; Caproni, L.; Álvarez-Muñiz, C.; Annamaa, K.; Barata, A.M.; Batir-Rusu, D.; Díez, M.J.; Heinonen, M.; Holubec, V.; et al. Analysis of landrace cultivation in Europe: A means to support in situ conservation of crop diversity. Biol. Conserv. 2022, 267, 109460. [Google Scholar] [CrossRef]
  59. De La Fuente, M.; López-Pedrouso, M.; Alonso, J.; Santalla, M.; AM, D.; Alvarez, G.; Zapata, C. In-depth characterization of the phaseolin protein diversity of common bean (Phaseolus vulgaris L.) based on two-dimensional electrophoresis and mass spectrometry. Food Technol. Biotechnol. 2012, 50, 315–325. [Google Scholar]
  60. Beancyclopedia True Red Cranberry. Available online: https://beancyclopedia.com/index.php/True_Red_Cranberry (accessed on 13 November 2023).
  61. Slow Food True Red Cranberry Bean—Arca Del Gusto. Available online: https://www.fondazioneslowfood.com/en/ark-of-taste-slow-food/true-red-cranberry-bean/ (accessed on 1 December 2023).
  62. Chávez-Mendoza, C.; Sánchez, E. Bioactive compounds from Mexican varieties of the common bean (Phaseolus vulgaris): Implications for health. Molecules 2017, 22, 1360. [Google Scholar] [CrossRef] [PubMed]
  63. Celmeli, T.; Sari, H.; Canci, H.; Sari, D.; Adak, A.; Eker, T.; Toker, C. The nutritional content of common bean (Phaseolus vulgaris L.) landraces in comparison to modern varieties. Agronomy 2018, 8, 166. [Google Scholar] [CrossRef]
  64. Doria, E.; Campion, B.; Sparvoli, F.; Tava, A.; Nielsen, E. Anti-nutrient components and metabolites with health implications in seeds of 10 common bean (Phaseolus vulgaris L. and Phaseolus lunatus L.) landraces cultivated in southern Italy. J. Food Compos. Anal. 2012, 26, 72–80. [Google Scholar] [CrossRef]
  65. Sławińska, N.; Olas, B. Selected seeds as sources of bioactive compounds with diverse biological activities. Nutrients 2023, 15, 187. [Google Scholar] [CrossRef] [PubMed]
  66. Gao, Y.; Zhou, H.; Liu, G.; Wu, J.; Yuan, Y.; Shang, A. Tumor microenvironment: Lactic acid promotes tumor development. J. Immunol. Res. 2022, 2022, 3119375. [Google Scholar] [CrossRef]
  67. Allred, K.F.; Yackley, K.M.; Vanamala, J.; Allred, C.D. Trigonelline is a novel phytoestrogen in coffee beans. J. Nutr. 2009, 139, 1833–1838. [Google Scholar] [CrossRef] [PubMed]
  68. Ye, H.; Shaw, I.C. Dietary isoflavone-induced, estrogen receptor-β-mediated proliferation of Caco-2 cells is modulated by gallic acid. Food Chem. Toxicol. Int. J. Publ. Br. Ind. Biol. Res. Assoc. 2020, 145, 111743. [Google Scholar] [CrossRef]
  69. Saito, R.d.F.; Andrade, L.N.d.S.; Bustos, S.O.; Chammas, R. Phosphatidylcholine-derived lipid mediators: The crosstalk between cancer cells and immune cells. Front. Immunol. 2022, 13, 768606. [Google Scholar] [CrossRef]
  70. Zeng, T.; Zhu, L.; Liao, M.; Zhuo, W.; Yang, S.; Wu, W.; Wang, D. Knockdown of PYCR1 inhibits cell proliferation and colony formation via cell cycle arrest and apoptosis in prostate cancer. Med. Oncol. Northwood Lond. Engl. 2017, 34, 27. [Google Scholar] [CrossRef]
  71. Yang, Q.-Q.; Farha, A.K.; Cheng, L.; Kim, G.; Zhang, T.; Corke, H. Phenolic content and in vitro antioxidant activity in common beans (Phaseolus vulgaris L.) are not directly related to anti-proliferative activity. Food Biosci. 2020, 36, 100662. [Google Scholar] [CrossRef]
  72. Martínez-Alonso, C.; Taroncher, M.; Castaldo, L.; Izzo, L.; Rodríguez-Carrasco, Y.; Ritieni, A.; Ruiz, M.-J. Effect of phenolic extract from red beans (Phaseolus vulgaris L.) on T-2 toxin-induced cytotoxicity in HepG2 cells. Foods 2022, 11, 1033. [Google Scholar] [CrossRef] [PubMed]
  73. Borsai, O.; Al Hassan, M.; Boscaiu, M.; Sestras, R.; Vicente, O. Effects of salt and drought stress on seed germination and seedling growth in Portulaca. Rom. Biotechnol. Lett. 2018, 23, 13340–13349. [Google Scholar] [CrossRef]
  74. Chartzoulakis, K.; Klapaki, G. Response of two greenhouse pepper hybrids to NaCl salinity during different growth stages. Sci. Hortic. 2000, 86, 247–260. [Google Scholar] [CrossRef]
  75. Mallhi, Z.I.; Rizwan, M.; Mansha, A.; Ali, Q.; Asim, S.; Ali, S.; Hussain, A.; Alrokayan, S.H.; Khan, H.A.; Alam, P.; et al. Citric acid enhances plant growth, photosynthesis, and phytoextraction of lead by alleviating the oxidative stress in Castor Beans. Plants 2019, 8, 525. [Google Scholar] [CrossRef]
  76. Singh, P.; Choudhary, K.K.; Chaudhary, N.; Gupta, S.; Sahu, M.; Tejaswini, B.; Sarkar, S. Salt stress resilience in plants mediated through osmolyte accumulation and its crosstalk mechanism with phytohormones. Front. Plant Sci. 2022, 13, 1006617. [Google Scholar] [CrossRef]
  77. Shahid, S.; Kausar, A.; Zahra, N.; Hafeez, M.B.; Raza, A.; Ashraf, M.Y. Methionine-induced regulation of secondary metabolites and antioxidants in maize (Zea mays L.) subjected to salinity stress. Gesunde Pflanz. 2023, 75, 1143–1155. [Google Scholar] [CrossRef]
  78. Wang, C.; Liu, R.; Lim, G.-H.; de Lorenzo, L.; Yu, K.; Zhang, K.; Hunt, A.G.; Kachroo, A.; Kachroo, P. Pipecolic acid confers systemic immunity by regulating free radicals. Sci. Adv. 2018, 4, 4509. [Google Scholar] [CrossRef]
  79. Khan, M.A.H.; Baset Mia, M.A.; Quddus, M.A.; Sarker, K.K.; Rahman, M.; Skalicky, M.; Brestic, M.; Gaber, A.; Alsuhaibani, A.M.; Hossain, A. Salinity-induced physiological changes in pea (Pisum sativum L.): Germination rate, biomass accumulation, relative water content, seedling vigor and salt tolerance index. Plants 2022, 11, 3493. [Google Scholar] [CrossRef]
  80. Negrão, S.; Schmöckel, S.M.; Tester, M. Evaluating physiological responses of plants to salinity stress. Ann. Bot. 2017, 119, 1–11. [Google Scholar] [CrossRef] [PubMed]
  81. Taïbi, K.; Taïbi, F.; Abderrahim, L.A.; Ennajah, A.; Belkhodja, M.; Mulet, J.M. Effect of salt stress on growth, chlorophyll content, lipid peroxidation and antioxidant defence systems in Phaseolus vulgaris L. S. Afr. J. Bot. 2016, 105, 306–312. [Google Scholar] [CrossRef]
  82. Sanwal, S.K.; Kumar, P.; Kesh, H.; Gupta, V.K.; Kumar, A.; Kumar, A.; Meena, B.L.; Colla, G.; Cardarelli, M.; Kumar, P. Salinity stress tolerance in potato cultivars: Evidence from physiological and biochemical traits. Plants 2022, 11, 1842. [Google Scholar] [CrossRef] [PubMed]
  83. Khan, M.; Zhang, J.; Luo, T.; Liu, J.; Ni, F.; Rizwan, M.; Fahad, S.; Hu, L. Morpho-physiological and biochemical responses of tolerant and sensitive rapeseed cultivars to drought stress during early seedling growth stage. Acta Physiol. Plant. 2019, 41, 25. [Google Scholar] [CrossRef]
  84. Sarker, U.; Oba, S. The response of salinity stress-induced A. tricolor to growth, anatomy, physiology, non-enzymatic and enzymatic antioxidants. Front. Plant Sci. 2020, 11, 559876. [Google Scholar] [CrossRef] [PubMed]
  85. Leiva-Ampuero, A.; Agurto, M.; Matus, J.T.; Hoppe, G.; Huidobro, C.; Inostroza-Blancheteau, C.; Reyes-Díaz, M.; Stange, C.; Canessa, P.; Vega, A. Salinity impairs photosynthetic capacity and enhances carotenoid-related gene expression and biosynthesis in tomato (Solanum lycopersicum L. cv. Micro-Tom). PeerJ 2020, 8, e9742. [Google Scholar] [CrossRef] [PubMed]
  86. Ma, T.; Zeng, W.; Li, Q.; Yang, X.; Wu, J.; Huang, J. Shoot and root biomass allocation of sunflower varying with soil salinity and nitrogen applications. Agron. J. 2017, 109, 2545–2555. [Google Scholar] [CrossRef]
  87. Kumar, R.; Sagar, V.; Verma, V.C.; Kumari, M.; Gujjar, R.S.; Goswami, S.K.; Kumar Jha, S.; Pandey, H.; Dubey, A.K.; Srivastava, S.; et al. Drought and salinity stresses induced physio-biochemical changes in sugarcane: An overview of tolerance mechanism and mitigating approaches. Front. Plant Sci. 2023, 14, 1225234. [Google Scholar] [CrossRef] [PubMed]
  88. Moles, T.M.; Pompeiano, A.; Huarancca Reyes, T.; Scartazza, A.; Guglielminetti, L. The efficient physiological strategy of a tomato landrace in response to short-term salinity stress. Plant Physiol. Biochem. 2016, 109, 262–272. [Google Scholar] [CrossRef]
  89. Stefanov, M.A.; Rashkov, G.D.; Yotsova, E.K.; Dobrikova, A.G.; Apostolova, E.L. Impact of salinity on the energy transfer between pigment–protein complexes in photosynthetic apparatus, functions of the oxygen-evolving complex and photochemical activities of photosystem II and photosystem I in two Paulownia lines. Int. J. Mol. Sci. 2023, 24, 3108. [Google Scholar] [CrossRef]
  90. Kavas, M.; Akça, O.E.; Akçay, U.C.; Peksel, B.; Eroğlu, S.; Öktem, H.A.; Yücel, M. Antioxidant responses of peanut (Arachis hypogaea L.) seedlings to prolonged salt-induced stress. Arch. Biol. Sci. 2015, 67, 1303–1312. [Google Scholar] [CrossRef]
  91. Bandeoğlu, E.; Eyidoğan, F.; Yücel, M.; Avni Öktem, H. Antioxidant responses of shoots and roots of lentil to NaCl-salinity stress. Plant Growth Regul. 2004, 42, 69–77. [Google Scholar] [CrossRef]
  92. AbdElgawad, H.; Zinta, G.; Hegab, M.M.; Pandey, R.; Asard, H.; Abuelsoud, W. High salinity induces different oxidative stress and antioxidant responses in maize seedlings organs. Front. Plant Sci. 2016, 7, 276. [Google Scholar] [CrossRef] [PubMed]
Figure 1. Analysis of common bean morpho-colorimetric and genetic diversity. Scatter plot of the PCA computed among three populations of common bean (Phaseolus vulgaris L.) using fourteen morpho-colorimetric features (a) and dendrogram resulting from a cluster analysis using the unweighted pair group method with arithmetic mean (UPGMA) with the Euclidean distance index (b). Scatter plot of the PCoA computed on the three bean populations, using eight inter-simple sequence repeat (ISSR) primers (c) and dendrogram resulting from UPGMA clustering (Jaccard similarity index) (d). Phaseolin (Phs) SCAR marker banding patterns. The ladder range is 200–300 base pairs (ApplyChem GmbH, Darmstadt, Germany) (e). CV: Ciliegino; SMR: San Michele Rosso; FDA: Fagiolo d’Acqua.
Diversity 16 00240 g001
Figure 2. 1H NMR metabolomic profile of common bean seed aqueous extracts. 1H and 13C chemical shift assignment (δ, ppm) of the 25 metabolites detected in the seed aqueous extract of the common bean population (a). Expanded 1H NMR spectrum of the San Michele Rosso common bean landrace from: 0.9 to 3.0 ppm (b); 3.0 to 4.5 ppm (c); 4.5 to 5.9 ppm (d); 5.9 to 7.9 ppm (e); 7.9 to 9.2 ppm (f). d: doublet, dd: double doublet; m: multiplet; s: singlet, t: triplet; tp: triple doublet.
Diversity 16 00240 g002
Figure 3. Principal Component Analysis (PCA) and Partial Least Squares Discriminant Analysis (PLS-DA) computed on NMR qualitative data of common bean aqueous seed extracts. Score plot of the PCA (a) and score plot of the PLS-DA (b). CV: Ciliegino; SMR: San Michele Rosso; FDA: Fagiolo d’Acqua.
Diversity 16 00240 g003
Figure 4. Quantification (mg·g−1DW) of metabolites in aqueous seed extracts of three common bean landraces. The most intense and distinct metabolite signals of the 1H NMR spectra have been quantified. Data are expressed as the mean ± standard error and calculated using four replicates. Student’s t-test was performed to determine significant differences (p ≤ 0.05) in the metabolite levels in the common bean populations. Mean values marked with the same letter are not statistically different. CV: Ciliegino; SMR: San Michele Rosso; FDA: Fagiolo d’Acqua.
Diversity 16 00240 g004
Figure 5. Effects of aqueous bean extract administration on cell growth in the Caco-2 cell line. Cell proliferation was assessed in Caco-2 cells treated with vehicle (DMSO, CTR) and CV (a), SMR (b) and FDA (c) aqueous extracts at the doses of 0.1 µg·mL−1, 1 µg·mL−1, 100 µg·mL−1. n = 3 independent experiments. Data represent the means ± standard deviation. Statistical analysis was carried out by using two-way ANOVA, followed by a Bonferroni post hoc test. ** p < 0.01; *** p < 0.001.
Diversity 16 00240 g005
Figure 6. Seed germination under control and salinity stress conditions. Final germination capacity reached by seeds of common bean populations on the last day (8th) of the germination test (a). Germination speed, expressed as T50, of each common bean population under control and salinity stress conditions (b). Germination capacity of Ciliegino (c), San Michele Rosso (d) and Fagiolo d’Acqua (e) under both experimental conditions. Data represent the mean (n = 10) ± standard error. Mean values, marked with the asterisk, are statistically different. Student’s t-test was applied to weigh the effects of different treatments (p ≤ 0.05). Mean values marked with the same letter are not statistically different. CV: Ciliegino; SMR: San Michele Rosso; FDA: Fagiolo d’Acqua.
Diversity 16 00240 g006
Figure 7. Morpho-physiological parameters analyzed in the three common bean landrace populations. Fresh biomass (FW; (a,b)), dry biomass (DW; (d,e)), relative water content (RWC; (g,h)) of roots and leaves and total chlorophyll content (Chl; (c)), chlorophyll A and B ratio (Chl A/Chl B; (f)) and carotenoid content (i) of leaves of the three common populations, grown under controlled and salt stress conditions, were analyzed. Data represent the mean (FW, DW and RWC n = 4; total Chl, Chl A/Chl B, carotenoids n = 3) ± standard error. A Student’s t-test was conducted to weigh the effects of the different growth conditions (p ≤ 0.05). Mean values marked with the same letter are not statistically different. CV: Ciliegino; SMR: San Michele Rosso; FDA: Fagiolo d’Acqua.
Diversity 16 00240 g007
Figure 8. Biochemical parameters analyzed in the three common bean landrace populations. Proline (a,d), total carbohydrates (b,e) and malondialdehyde (MDA; (c,f)) contents were measured in the roots and leaves of the three common populations, grown under controlled and salt stress conditions. Data represent the mean (n = 3) ± standard error. A Student’s t-test was conducted to weigh the effects of the different growth conditions (p ≤ 0.05). Mean values marked with the same letter are not statistically different. CV: Ciliegino; SMR: San Michele Rosso; FDA: Fagiolo d’Acqua.
Diversity 16 00240 g008
Disclaimer/Publisher’s Note: The statements, opinions and data contained in all publications are solely those of the individual author(s) and contributor(s) and not of MDPI and/or the editor(s). MDPI and/or the editor(s) disclaim responsibility for any injury to people or property resulting from any ideas, methods, instructions or products referred to in the content.

