Article

Climate-Change-Driven Shifts in Aegilops tauschii Species Distribution: Implications for Food Security and Ecological Conservation

1
National Center for Genetic Resources (NCGR), Agricultural and Natural Resources Research and Education Center (AREEO), Tehran 15614, Iran
2
Seed and Plant Improvement Institute, National Plant Gene Bank of Iran, Mahdasht Road, Karaj 31585, Iran
3
Natural Resources Department, Fars Agricultural and Natural Resources Research and Education Center, AREEO, Shiraz 73416, Iran
4
Department of Water Resources Engineering & Center for Advanced Middle Eastern Studies, Lund University, 22100 Lund, Sweden
*
Authors to whom correspondence should be addressed.
Diversity 2024, 16(4), 241; https://doi.org/10.3390/d16040241
Submission received: 19 February 2024 / Revised: 7 April 2024 / Accepted: 10 April 2024 / Published: 18 April 2024

Abstract

:
Climate change has diverse effects on the planet’s environment, including changes and shifts in the distribution and abundance of species. In this paper, we present a robust prediction ensemble algorithm for the current and future species distribution of Aegilops tauschii. Four modeling approaches were trained using various environmental variables (bioclimatic and soil variables) to accurately predict the species distribution for future scenarios. The results showed that GBM and RF demonstrated the most accurate predictions with an Area Under the Receiver Operating Characteristic (ROC) Curve (AUC) of 0.80 and 0.83, respectively. The results of variable importance depicted that the temperature seasonality (bio4) was the most important and effective factor in determining the habitat suitability of Ae. tauschii, followed closely by the precipitation seasonality (bioclimate 15) and the mean temperature of the warmest quarter (bio10). Then, the distribution maps of Ae. tauschii were produced under climate change scenarios for 2050 and 2070. The results showed that Ae. tauschii will lose some of its suitable habitats under climate change and that this loss will be more severe in the east part of the study area. The results of the present study have important implications for ecological conservation as they can assist in identifying critical habitats and inform conservation planning efforts. Our model provides a valuable tool for understanding the potential future distribution of Ae. tauschii and highlights the need for continuous monitoring and protection of this species.

1. Introduction

Reliable data show that the late 20th and early 21st centuries have been the warmest periods on record, with the average temperature between 1904 and 2005 increasing by 0.74 °C. Predictions indicate that the average temperature will increase by 1.8 to 4 °C between 2090 and 2099 [1]. This increase in temperature will lead to more severe weather events and changes in global rainfall patterns [2]. The impact of climate change on species will be varied, leading to alterations in the presence and abundance, extinction, alterations in phenology, and modifications in the physiological traits of species [3]. Climate change will also result in changes in the geographical distribution of plants, with species ranges shifting due to changes in temperature and humidity [4]. Each degree Celsius of temperature change will cause the Earth’s ecological zones to move about 945 km in latitude, leading to changes in species distribution and range limitations and the extinction of some species at lower elevations and latitudes [5,6]. According to climate change projections, a trend of rising temperatures has been recorded in most synoptic stations across Iran, which may be linked to the increase in atmospheric carbon dioxide levels [7]. Babaeian et al. [8] projected the impacts of climate change on Iran from 2010 to 2039 using the ECHO-G microscale model under the A1 scenario and found that precipitation will decline by 1% nationwide and the average annual temperature will rise by 0.5 °C.
The rapid development of statistical techniques has led to the growth of species distribution prediction models in ecology [9]. These models have the potential to fill knowledge gaps about species distribution by relating species occurrence data and environmental variables to predict the possible presence of species in a specific area [8]. Species distribution models are frequently used to predict the future distribution of species under climate change and land use scenarios [9], to evaluate the risk of invasive alien species [10,11,12,13,14], to prioritize conservation management [15,16], and to predict and create distribution maps for rare and endangered species [12,17,18].
The decline in genetic diversity of breeding germplasm, rising production costs, and the impact of climate change have threatened cereal productivity (e.g., wheat, rice, and maize) in recent years [19]. To meet the demands of a projected 9.2 billion people by 2050, an increase of 70% in wheat production is estimated to be required [20]. Enhancing the genetic base of breeding lines and access to new sources of diversity for improved performance is crucial in meeting the food demands of the growing population [20]. As a result, researchers are exploring alternative sources of genetic diversity, including wild Aegilops species, as potential donors of resistance and tolerance genes, as well as seed quality [21]. Analysis of the consequences of future climate change on the distribution of species is considered critical for their protection and management [22].
Aegilops tauschii is found across Iran, Turkey, Afghanistan, and China [23]. The wide morphological variations found in Ae. tauschii have resulted in the recognition of different forms or subspecies [23]. The genus Aegilops is native to the semi-arid regions of West and Central Asia, where it has evolved to withstand various biotic and abiotic stresses, as well as fluctuating climatic conditions [23,24]. Ae. tauschii, with its 2n = 2x = 14 and diploid genome (DD), is an herbaceous plant that is widely distributed across the Caucasus, Iran, Central Asia, Afghanistan, China, Pakistan, and Turkey [25,26]. The center of diversity for Ae. tauschii is located in the south of the Caspian Sea and is bordered by Turkey to the west and Afghanistan and China to the east. Additionally, Ae. tauschii can be found in Iran, primarily in the northwest, north, and northeast and at the center of the country [24]. Aegilops species are known to store a wealth of stress tolerance and adaptation genes, making them valuable sources of genetic diversity for wheat breeding programs [23,24].
It is imperative to make informed management decisions to understand the potential effects of climate change on species distribution and minimize its adverse impact on biodiversity [26]. This study aims to investigate the effects of future climate changes on the distribution of Ae. tauschii in Iran. The objectives are (i) to model the distribution of Ae. tauschii using statistical techniques and identifying suitable habitats with a high potential for their presence, (ii) to determine the key bioclimatic and soil variables impacting the distribution of Ae. tauschii, (iii) to assess the impact of climate change on the distribution of Ae. tauschii in the study area, and (iv) to determine the implications of conservation and management strategies to maintain and enhance the distribution of Ae. tauschii in Iran in the face of climate change. The results of this research could contribute to the conservation and restoration efforts of this valuable species in Iran.

2. Materials and Methods

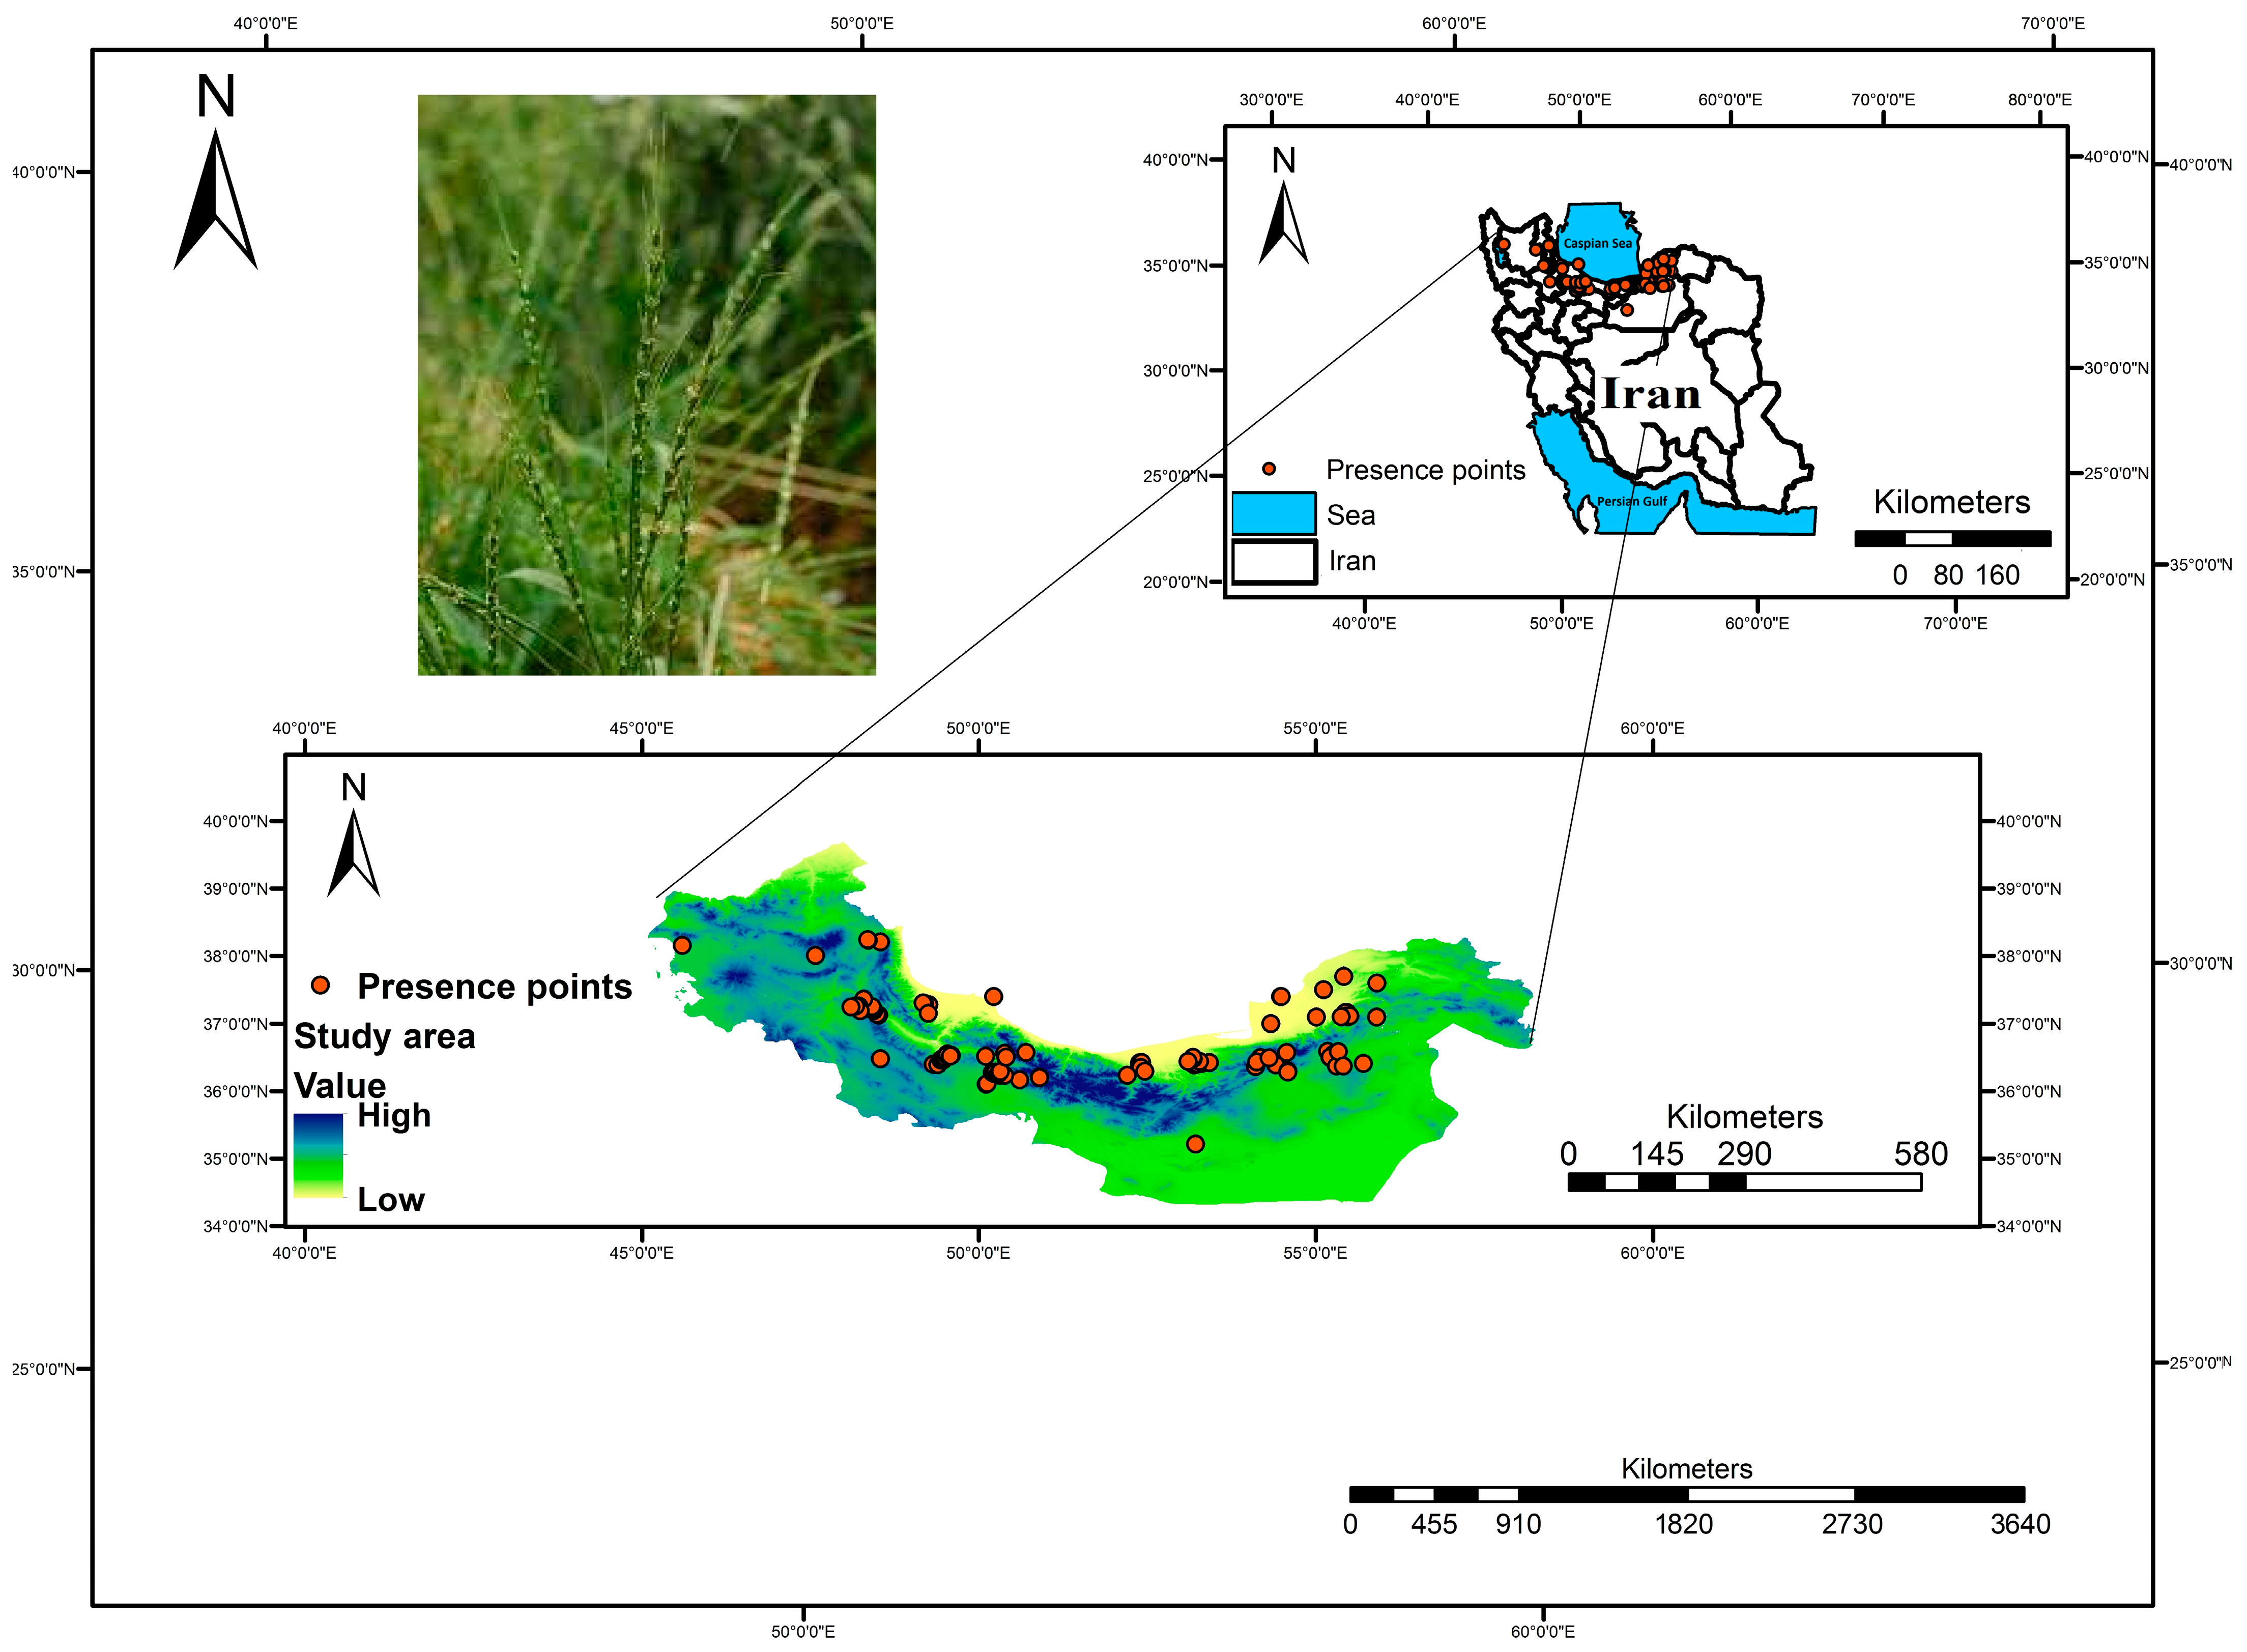
2.1. Study Area and Sampling Method

In this study, the distribution of Ae. tauschii in the provinces of Qazvin, Ardabil, East Azerbaijan, Semnan, Golestan, Gilan, and Mazandaran in Iran was determined through direct field surveys (Figure 1). The areas with a dominant presence of Ae. tauschii were identified through visits to the study area, and the geographical coordinates of these presences were recorded using GPS. A total of 122 presence points of Ae. tauschii were selected.

2.2. Environmental Variables

In the present study, to examine the impact of climate change on the distribution of Ae. tauschii, a species distribution model was developed using climate variables (www.worldclim.org accessed on 7 November 2023) [27] and soil data (Soilgrid.org) from the study area. Ensemble modeling was used to integrate species presence data and climatic and edaphic variables. Climate variables were obtained from the WorldClim site with a spatial resolution of 1 km2. The multicollinearity between independent variables was checked by calculating the variance inflation factor (VIF), and consequently, the variables with a significant impact were selected based on the VIF results. Finally, 10 variables including isothermality (bio3), temperature seasonality (bio4), mean temperature of warmest quarter (bio10), precipitation seasonality (bio15), bulk density of the fine earth fraction (bdod), a fraction of coarse fragments (cfvo), total nitrogen (N), pH, and silt were used to model the distribution of Ae. tauschii in the study area.
To project future climate scenarios, data from three General Circulation Models (GCMs) from the CMIP5 archive (IPCC 2014) were downscaled, namely BCC-CSM1-1, CCSM4, and CC-HadGEM2, under the Representative Concentration Pathways (RCPs) 2.6 and 8.5. The temporal projections for the years 2050 and 2070 were obtained from the WorldClim database [27]. The RCPs are standardized scenarios for atmospheric general circulation models that demonstrate the trend of greenhouse gas concentrations, including carbon dioxide, water vapor, nitrogen oxides, methane, and ozone, as reported in the Fifth Assessment Report (2014) of the IPCC [28]. In this study, the RCP2.6 (optimistic) and RCP8.5 (pessimistic) scenarios were used. The analysis was conducted over two periods of time: the present and the future (2050 and 2070).

2.3. Species Distribution Models and Evaluation Criteria

This study used four species distribution models to build an ensemble model for predicting suitable areas for the distribution of Ae. tauschii in Iran. The models used were the Generalized Linear Model (GLM), Generalized Boosting Model (GBM), Random Forest (RF) algorithm, and Artificial Neural Network (ANN) model.
The RF classifier is generally based on two types of parameters, i.e., the number of decision trees (Ntree) and the number of variables (Mtry). After that, RF classifiers represent through h (X,ik), k = 1, 2, … n for an input vector (X) by the combined action of tree structure. Based on tree structure classifiers, the RF algorithm can be explained as follows:
h X , i k , k = 1,2 , n
where i k are random factors, and 1, 2, … n is input vector X.
The Generalization Error (GE) of this model can be defined as follows:
G E = P x , y m g x , y < 0
where x and y are SDM environmental factors, and mg represents the margin function. The mg can be expressed as follows:
m g x , y = a v k I h k x = y m a x j i a v k I h k x = j
where I ( * ) is the indicator function.
The statistical function of GLM can be expressed as follows:
Y = Pr y = 1 = e C 0 + C 1 X 1 + + C n X n 1 + e C 0 + C 1 X 1 + + C n X n
where Y indicates a probability of events, with the logit being a link function between the occurrence (1) and non-occurrence (0). The conditioning factors are represented by X 1 X n and their coefficients by C 1 C n .
The following equation is used in boosting the classifier:
G x = s i g n m = 1 M α m G m ( x )
where G m ( x ) represents the boosting sequence of a classifier and α 1 , , α m represents the weights of the classifiers.
The ability of the model to predict was evaluated using three statistics: True Skill Statistic (TSS), Kappa, and the Area Under the Receiver Operating Characteristic (ROC) Curve (AUC). AUC values less than 0.7 indicate weak prediction ability; values between 0.7 and 0.9 indicate acceptable prediction; and values above 0.9 indicate excellent prediction ability [9]. TSS values range from +1 to −1, with values closer to +1 indicating better prediction ability and values closer to 0 or less indicating a less accurate model [22]. Kappa measures the degree of agreement between the prediction of plant species presence/absence and reality.
All models were implemented using the biomod2 package version 4.2 [29] and the R 4.1 program to determine the current range of Ae. tauschii and predict its future distribution under the RCP2.6 and RCP8.5 climate scenarios. Furthermore, 1000 random trees were used to build the Random Forest (RF) model, and the default settings of the biomod2 package were selected for other models. Background data were required for the modeling, and 1000 background points were created from the study area, excluding cells with presence points. The model was calibrated using 80% of the presence points as training data, and the remaining 20% was used as a test set to evaluate the models. Each model was run 10 times.

3. Results

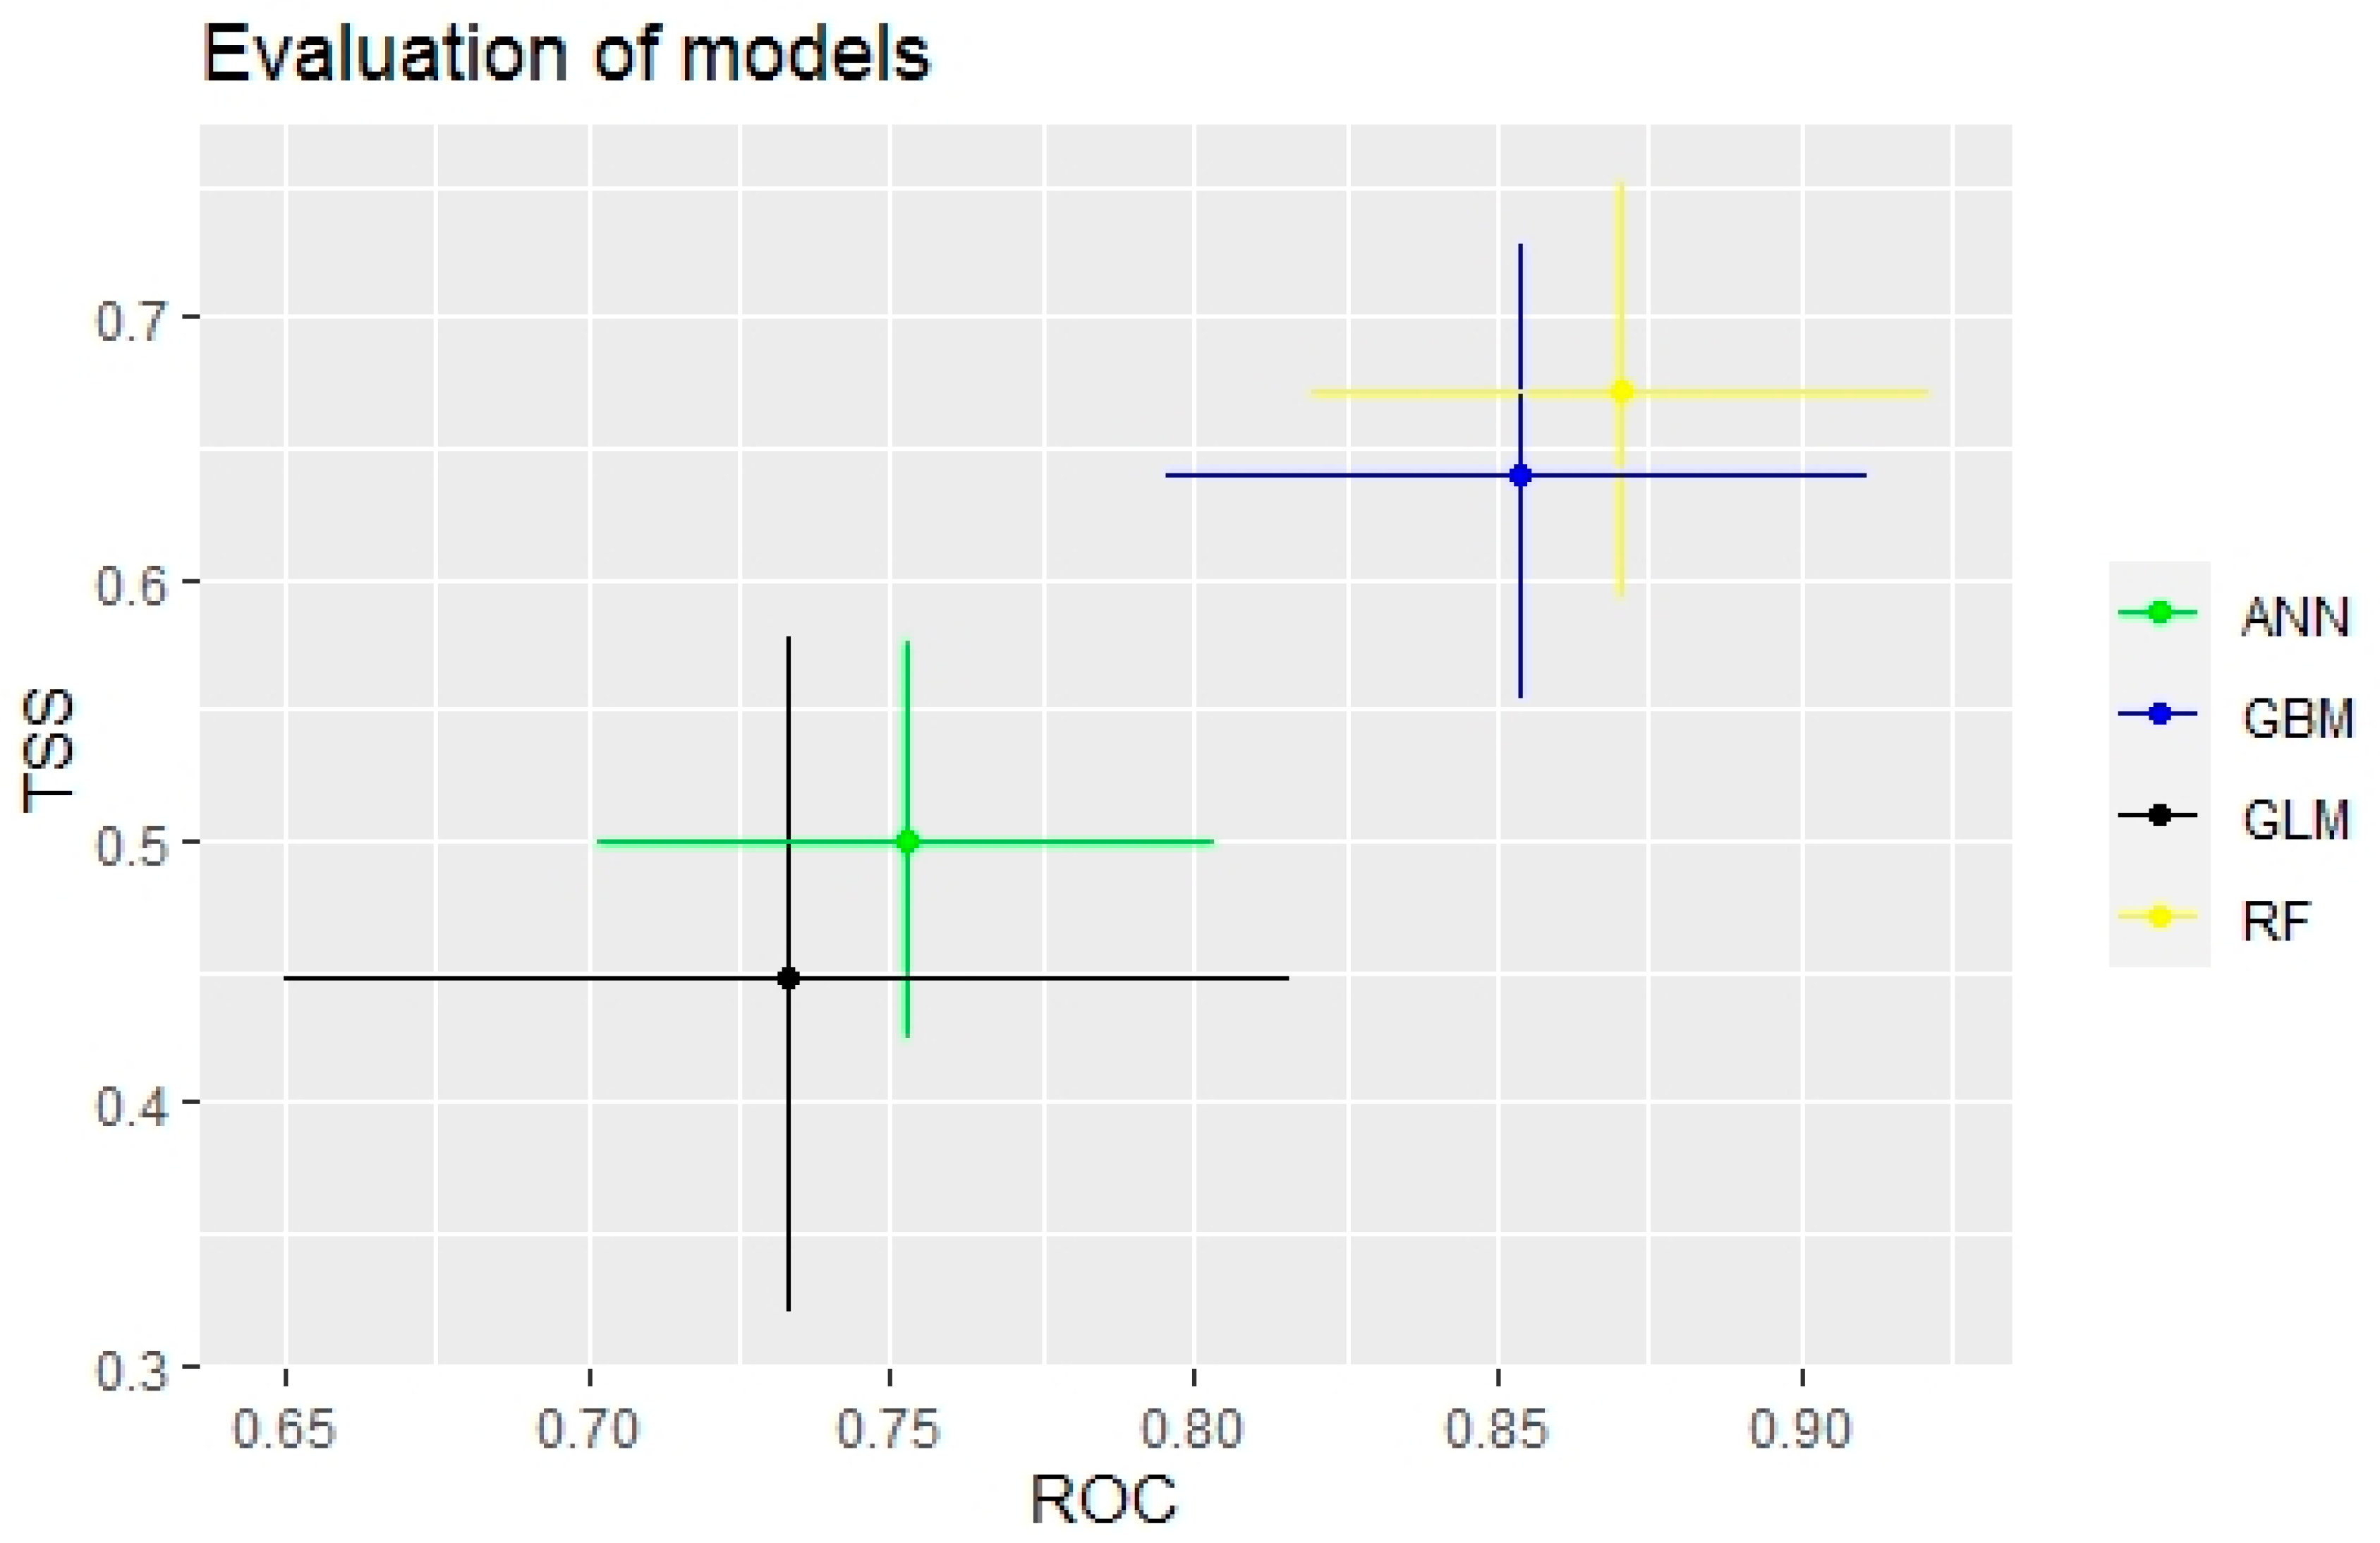
3.1. Evaluation of Species Distribution Models

The results of habitat suitability modeling, as indicated by the Kappa, TSS, and ROC accuracy indices presented in Table 1, indicate that the majority of the models employed in this study demonstrated high prediction capabilities, except the GLM and ANN models, which displayed relatively poor performance across all repetitions. In particular, the GBM and RF algorithms demonstrated the most accurate predictions, as demonstrated in Figure 2.
The Random Forest algorithm showed the highest prediction accuracy, with an average TSS value of 0.67, while the GLM method had the lowest prediction accuracy with an average TSS value of 0.45. Despite this, the overall performance of all the models was relatively poor. The ensemble model, however, showed high performance with an AUC index of 0.84, demonstrating its effectiveness in reducing model uncertainty. Table 1 summarizes the accuracy of each model as indicated by the ROC, TSS, and Kappa values.

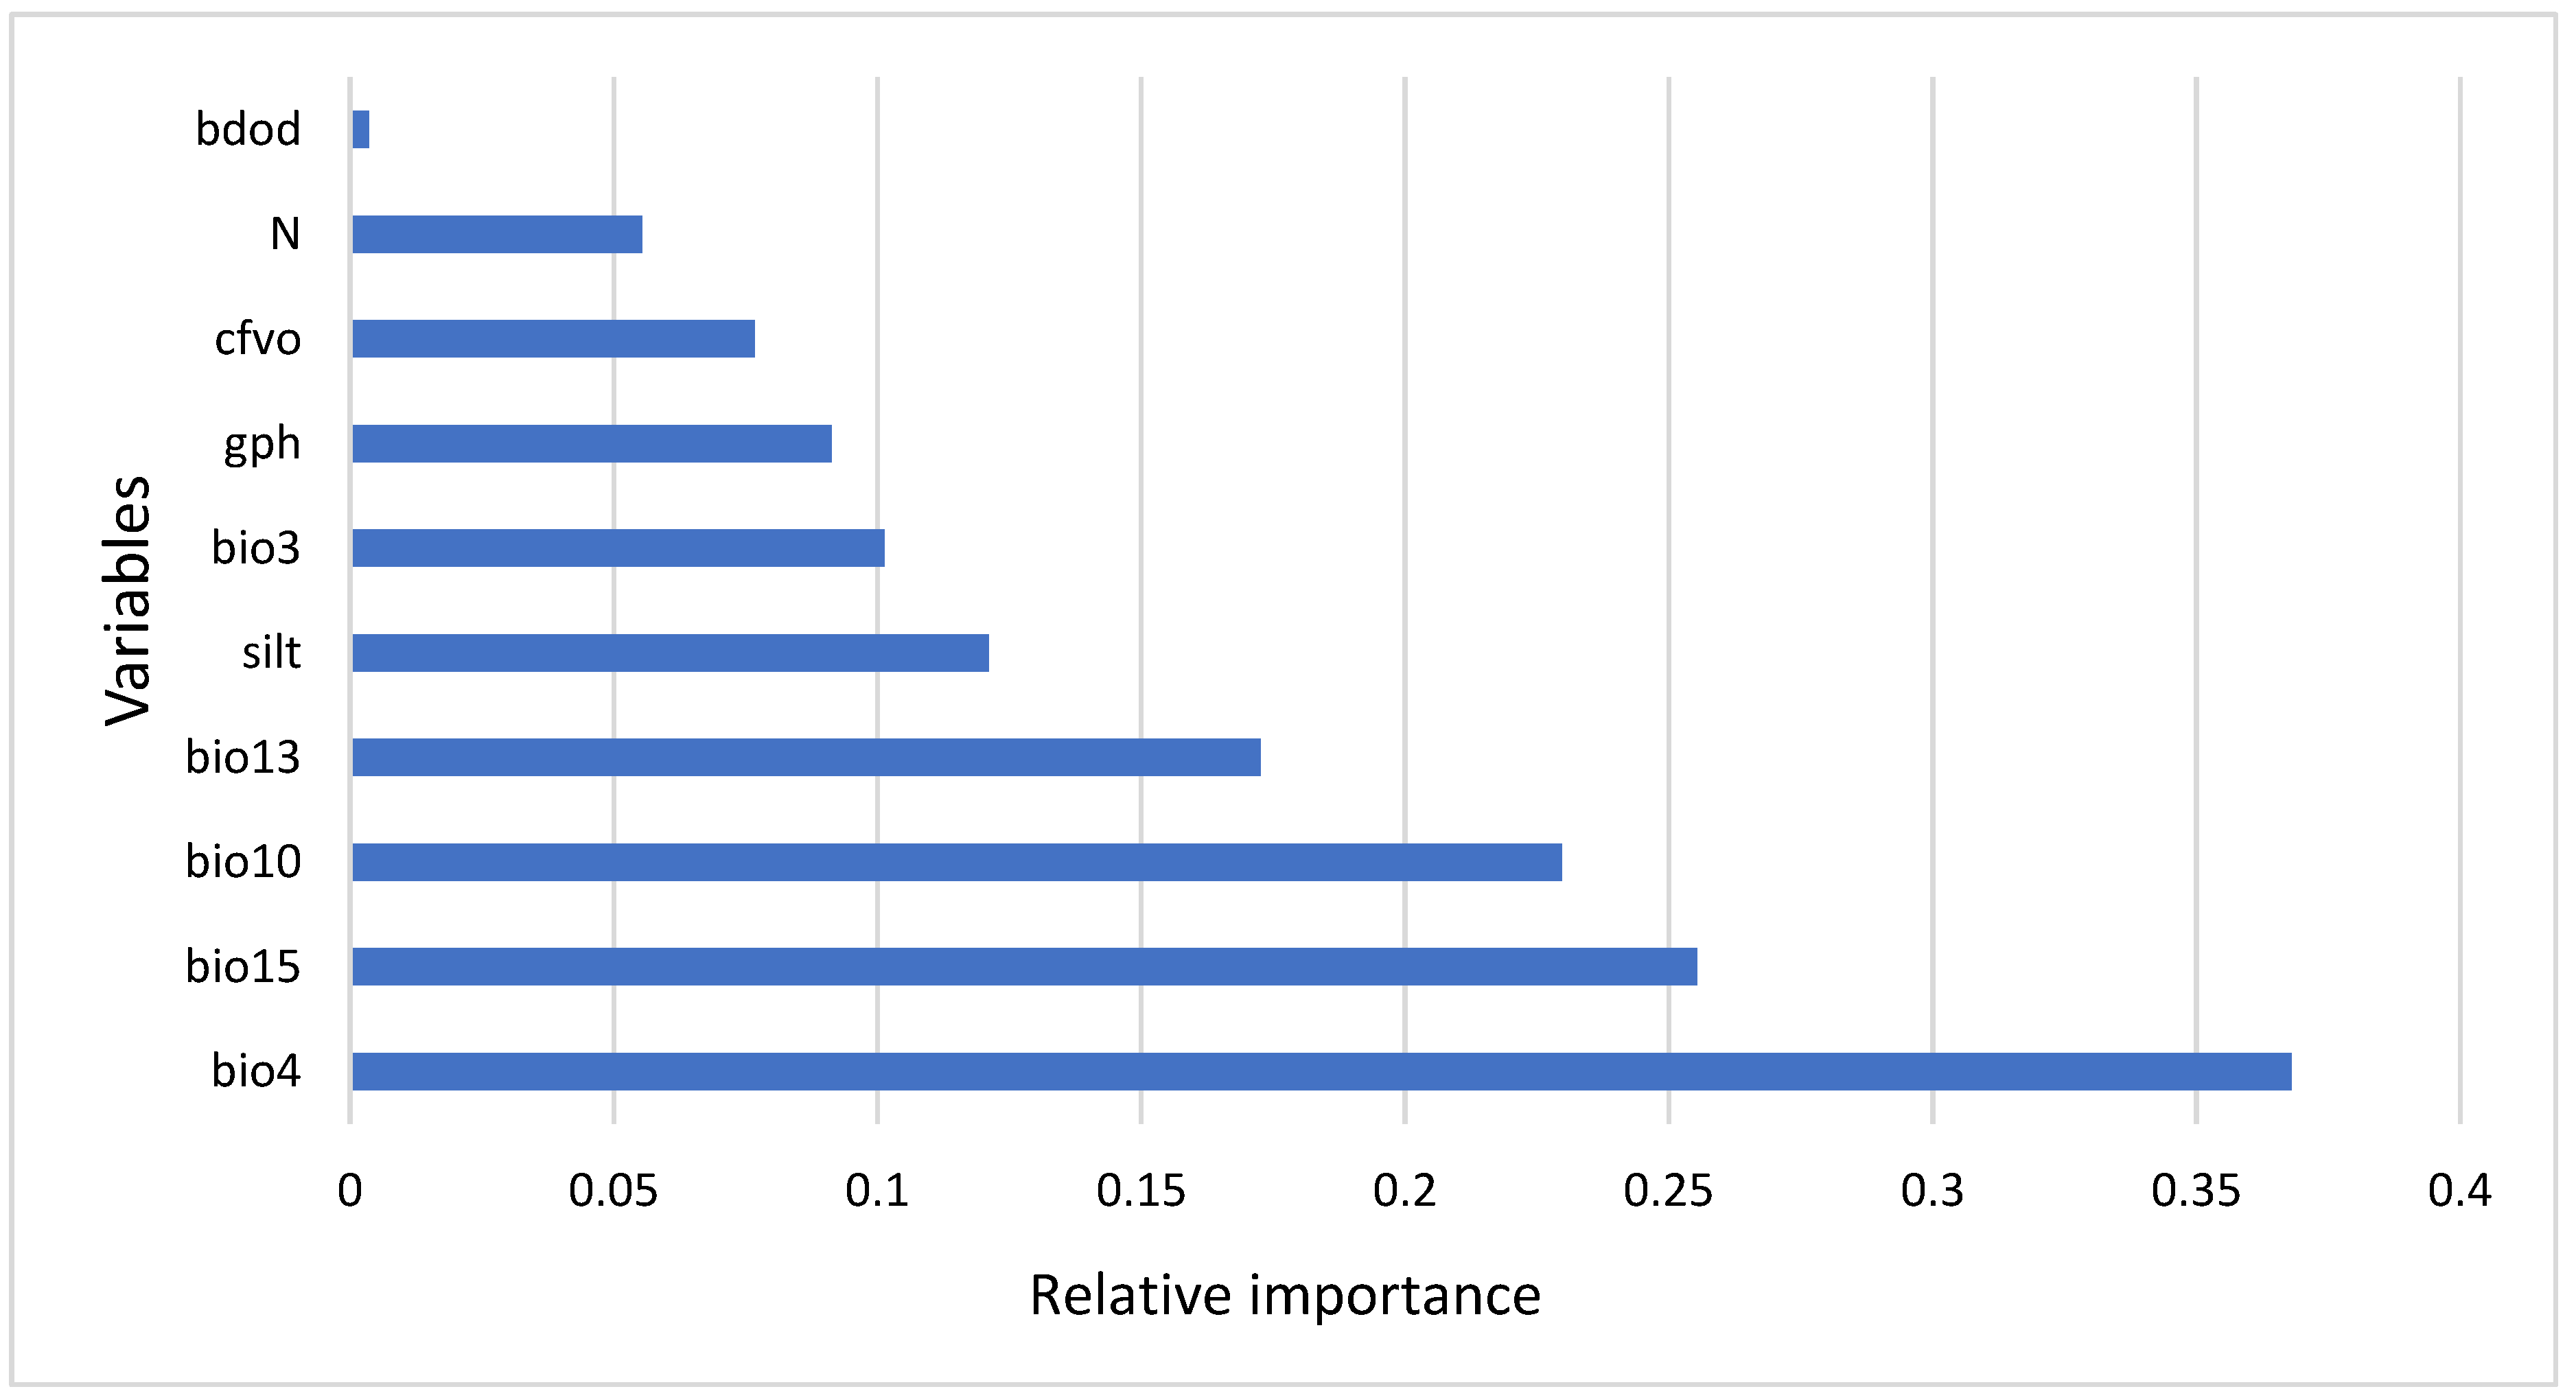
3.2. Variable Importance
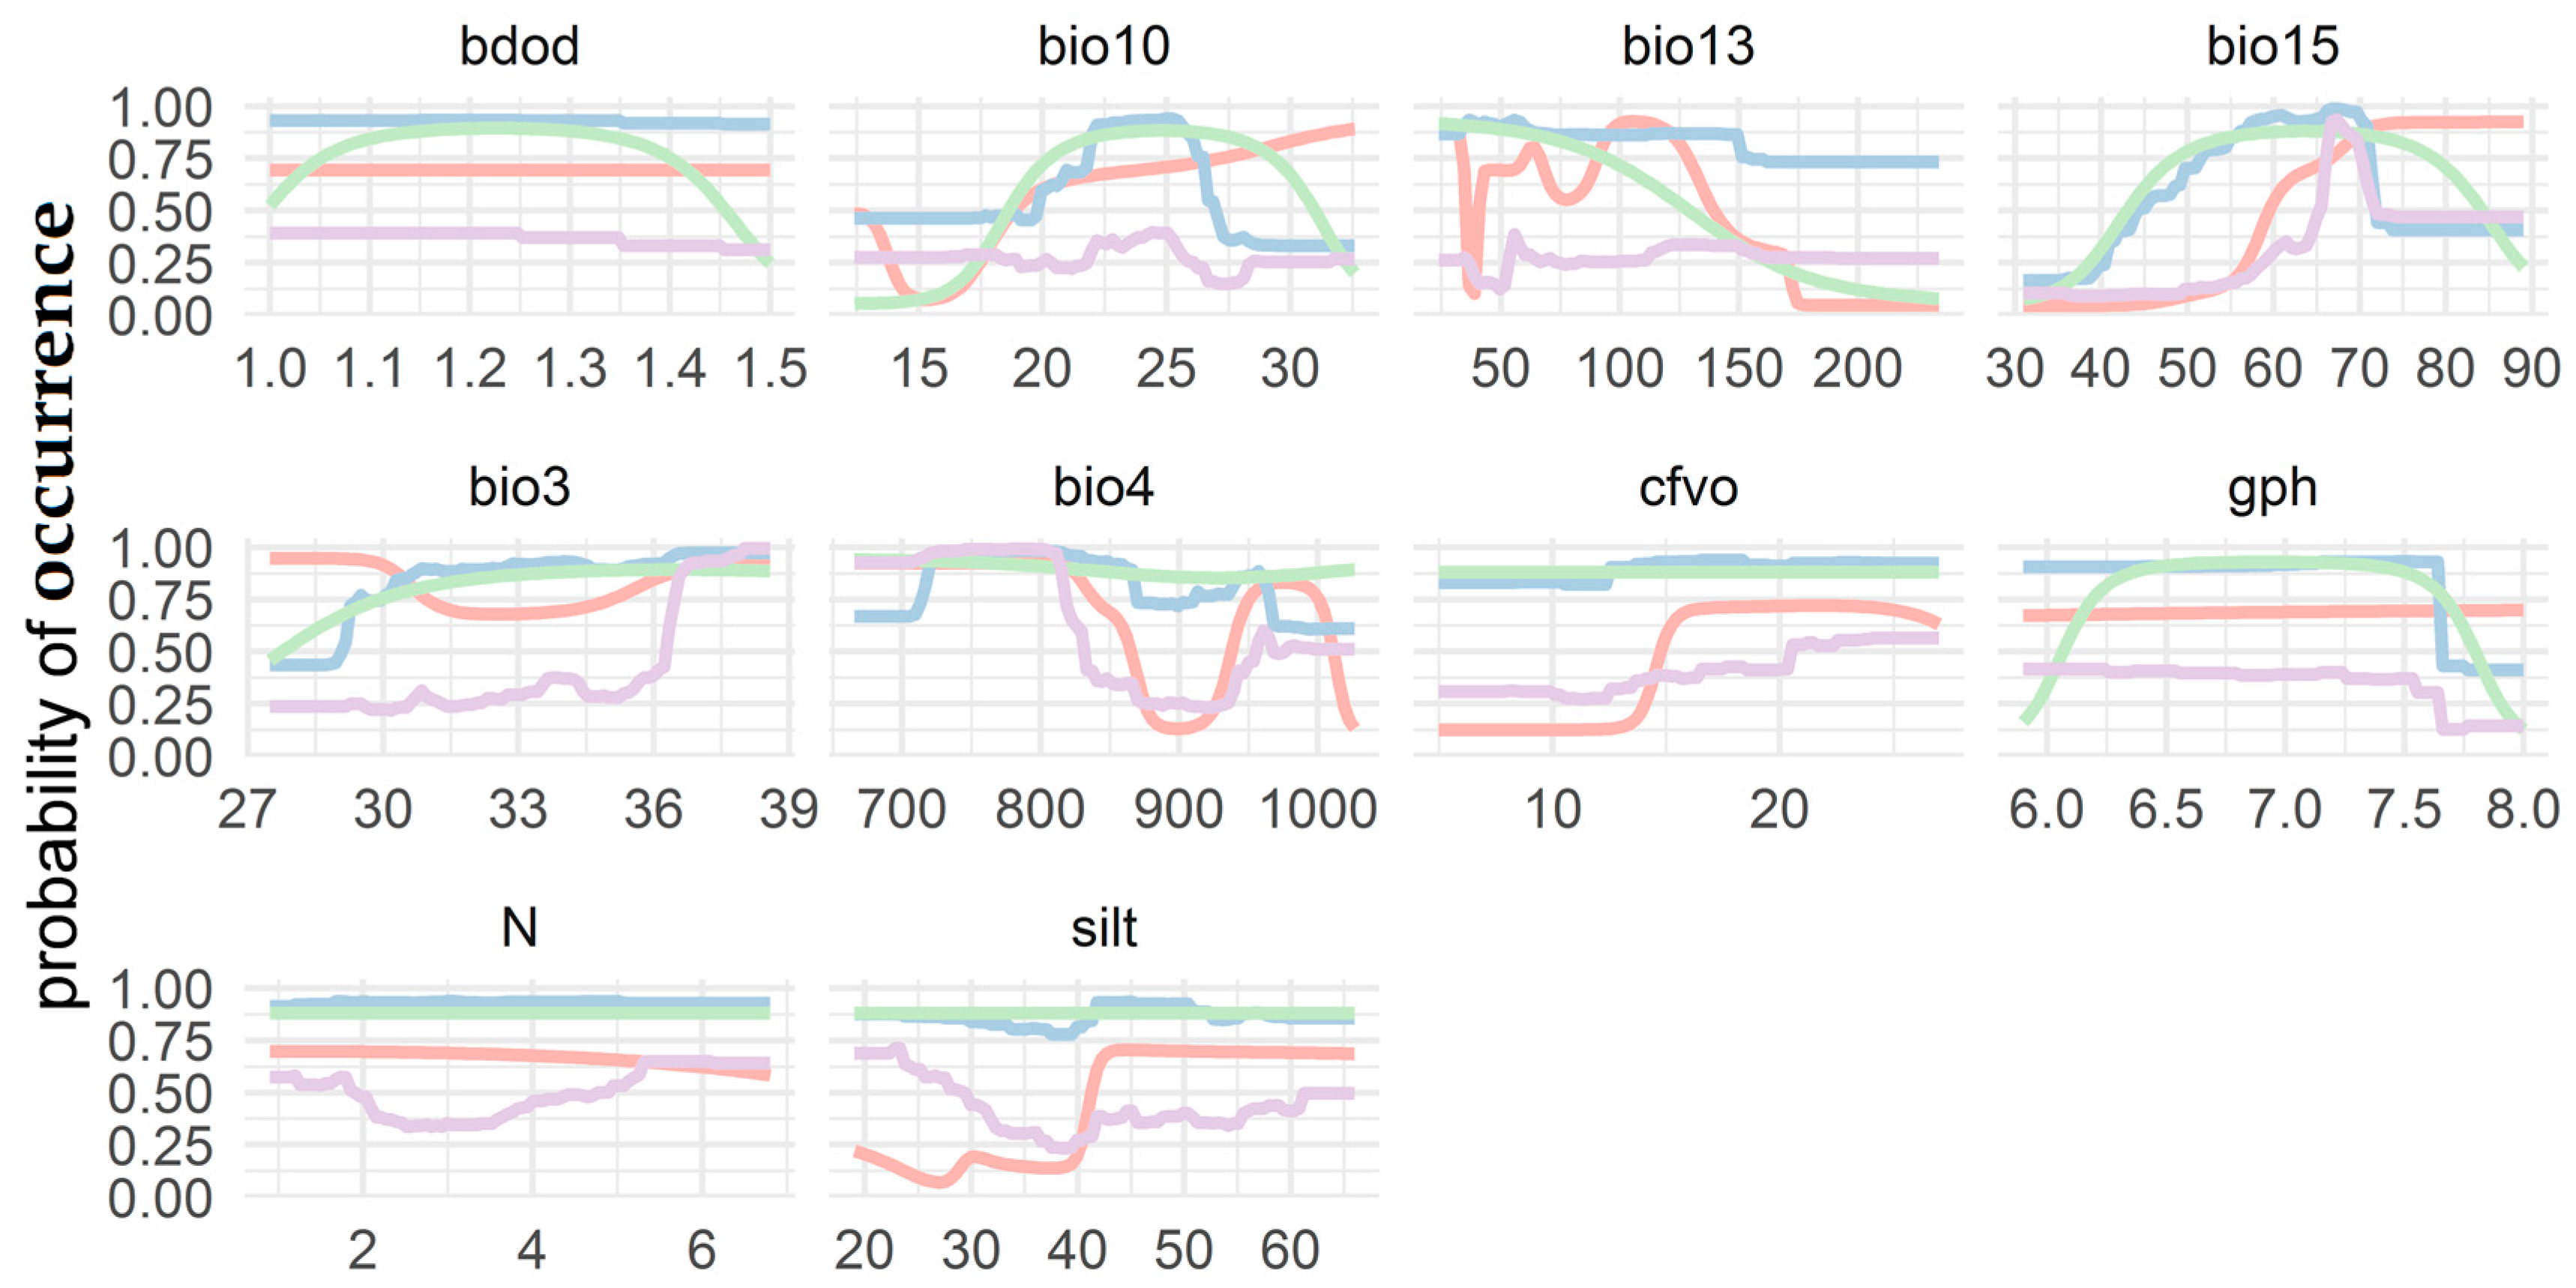
In this study, the relative importance of each variable was evaluated to determine the key parameters influencing the distribution of the studied species. Figure 3 illustrates the relative contribution of each variable to the habitat suitability modeling process. The results show that the bio4 variable was the most important and effective in determining the habitat suitability of the species, followed closely by bio15 and bio10. The bdod and nitrogen variables had a limited impact on the modeling. Other variables made the least contribution to the modeling, though this does not necessarily imply a lack of influence on species distribution.

3.3. Response Curve

The variables bio4, bio15, and bio10 are considered the most important parameters in determining the distribution of Ae. tauschii. According to the response curve of the bio4, the probability of the presence of Ae. tauschii in the limit of 9 decreases. Also, the results of the response curve of this variable show that the RF and ANN models are more indicative of this issue. Also, the results of the response curve for variable bio15 show that the probability of the presence of Ae. tauschii in the precipitation range of 70–90 mm is higher, but according to the GBM and RF model, the probability of the presence of Ae. tauschii in the range of precipitation of 70 mm and later has a decreasing trend. According to the bio10 variable response curve, the probability of the presence of Ae. tauschii is higher in the temperature range of 20–25 degrees Celsius, but the probability of the presence of Ae. tauschii decreases in the temperature range of more than 25 degrees Celsius. Based on the modeling results to determine the important and effective variables on the distribution of Ae. tauschii, the bdod variable does not have an important effect on the distribution of Ae. tauschii, and the response curve of this variable confirms the validity of the above results. The results of the response curve show that, even though according to the GLM model the probability of the presence of Ae. tauschii in the range greater than 1.4 kg·dm−3 decreases, other models do not show an increasing or decreasing trend. The results of the response curve for the total nitrogen variable show that, according to the GBM and GLM models, the probability of the presence of the species in different ranges has a constant trend, but according to the RF model, the probability of the presence of Ae. tauschii decreases in the range of 2–4 g·kg−1 and then it increases in the range of 4–6 g·kg−1; above 6 g·kg−1, it has a constant trend. Also, according to the ANN model, the probability of occurrence of Ae. tauschii decreases in response to the total nitrogen variable in the range of more than 4 g·kg−1 (Figure 4).

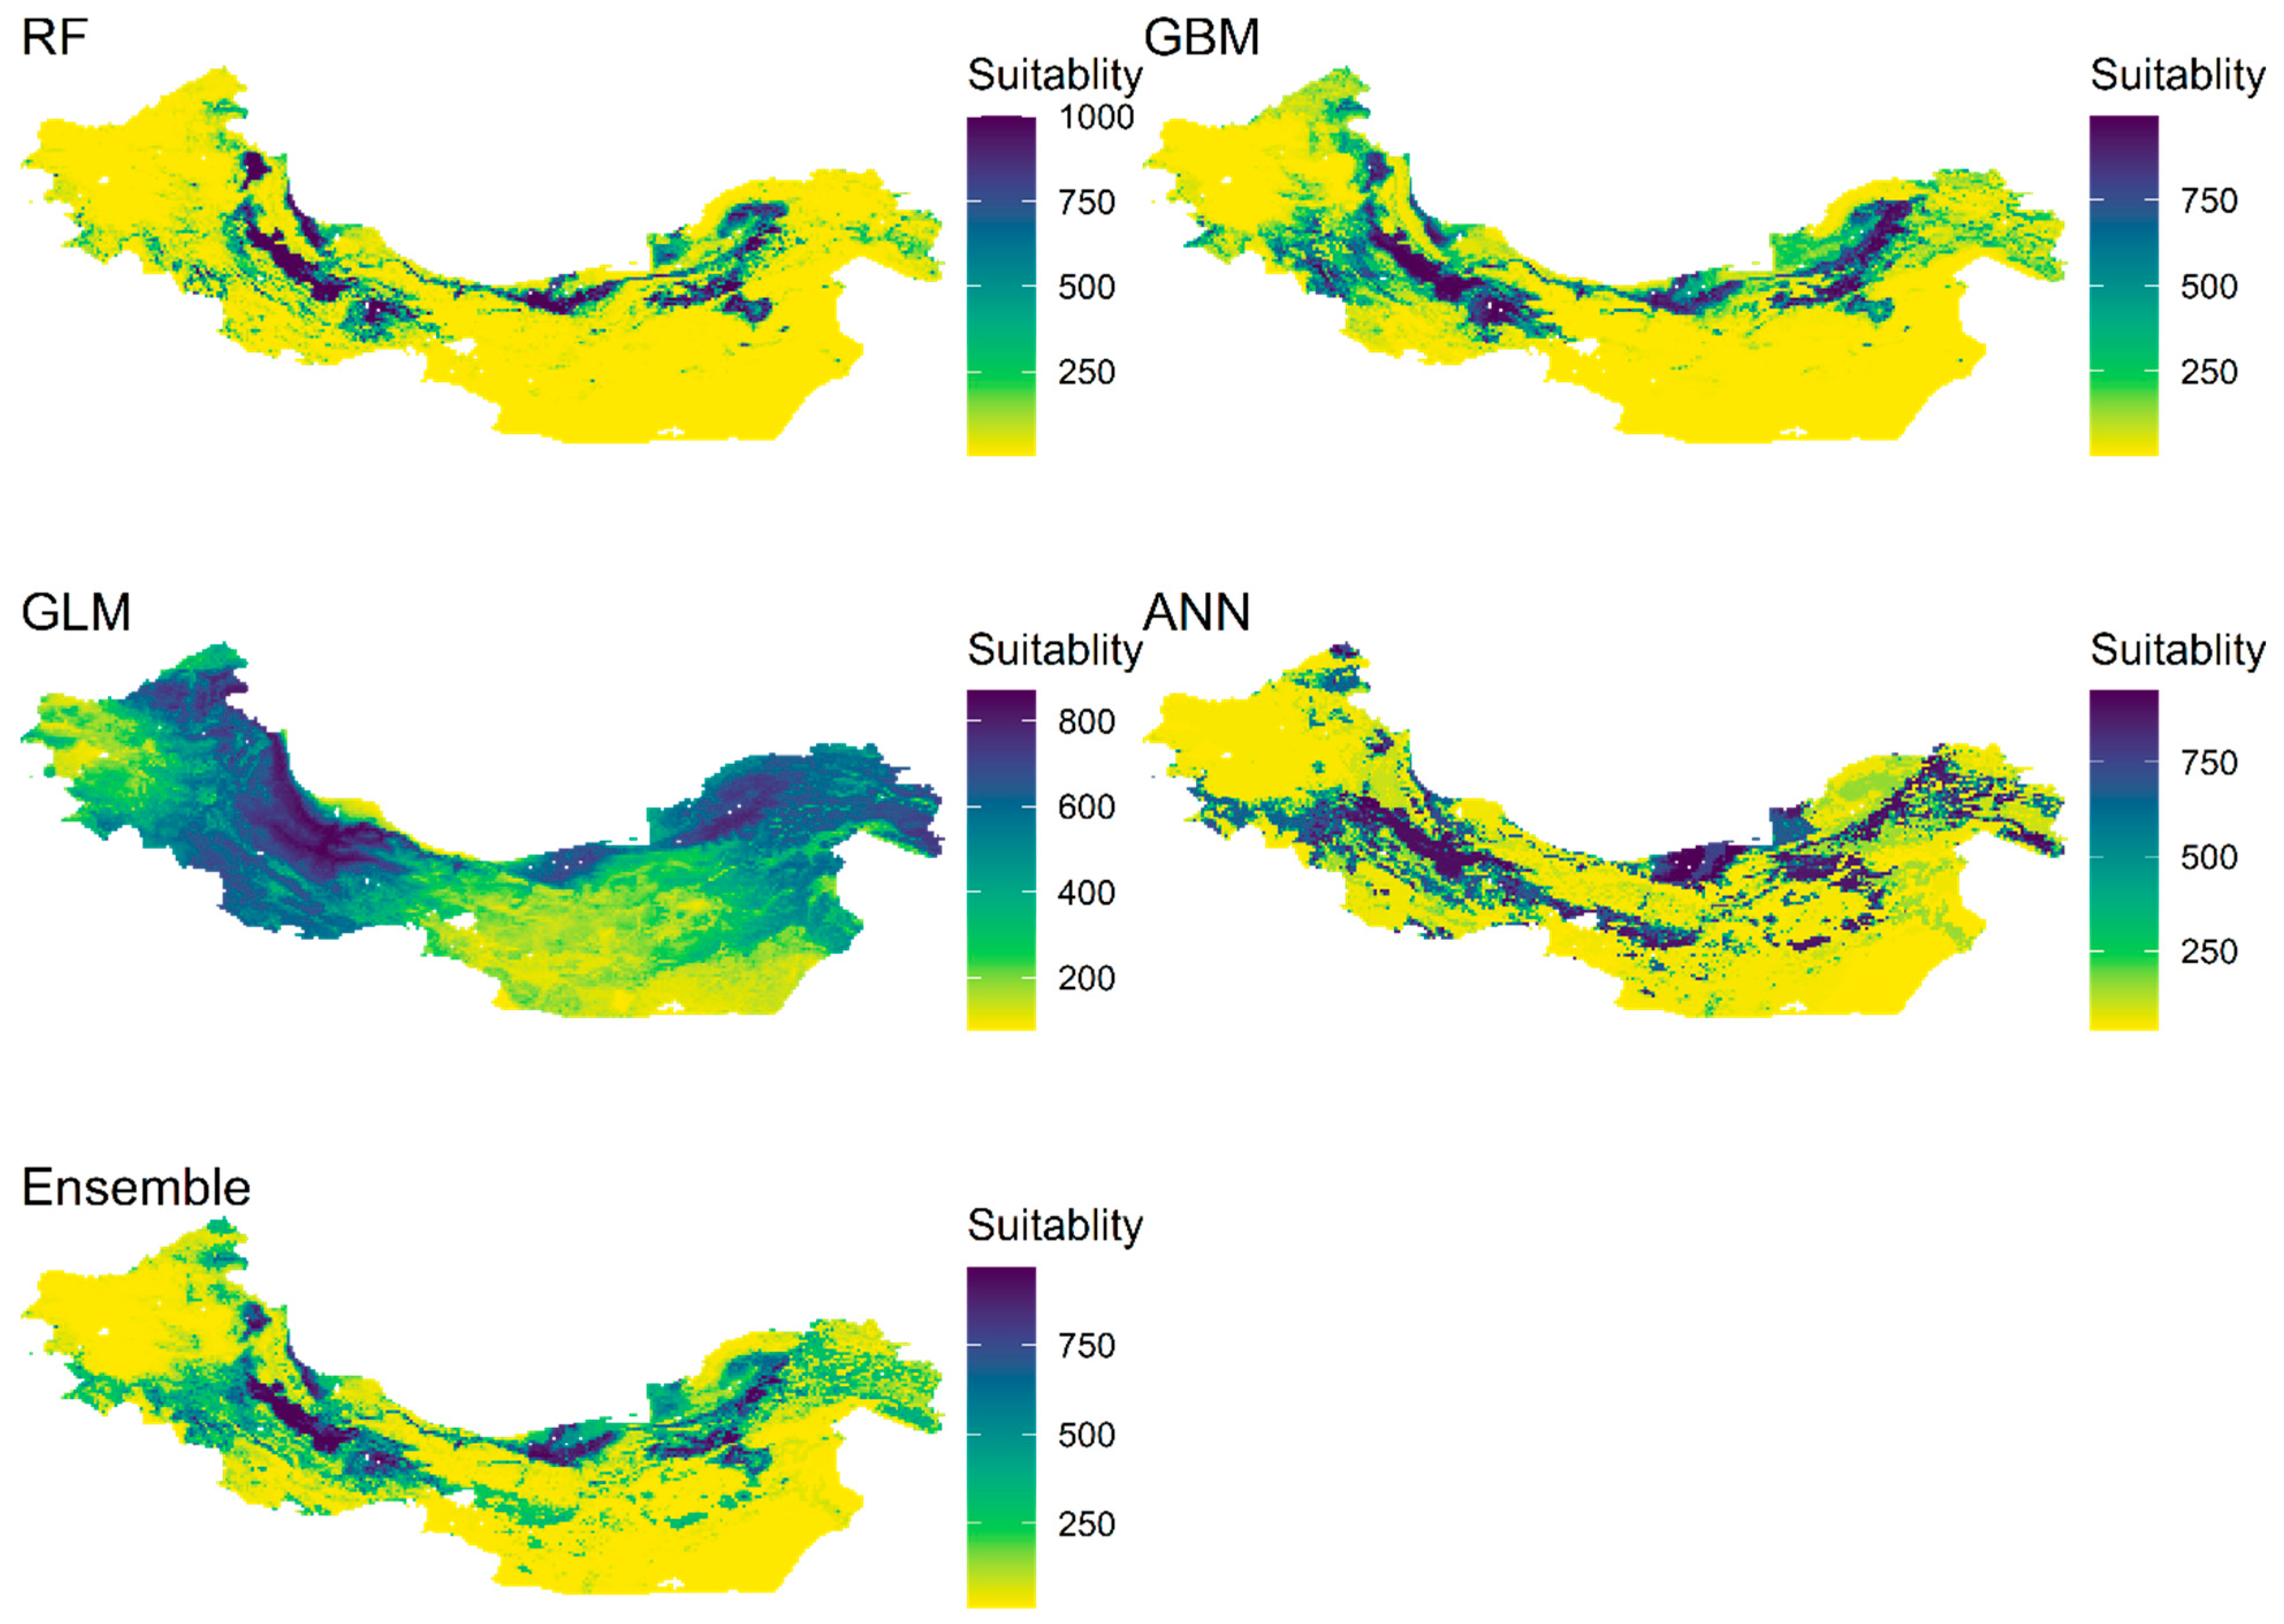
3.4. Current and Future Distribution of Ae. tauschii

The habitat suitability map of Ae. tauschii in the study area was prepared using four models in the current climatic conditions, which show the suitable areas for the presence of that species by each model. In the maps, blue indicates a higher probability of species presence, and yellow indicates a lower probability of species presence. The maps obtained from different models were different, but they overlapped a lot. Using the consensus of the results of all the models, a map of the suitable areas for the presence of the species was prepared. The map obtained from the models showed that the probability of the presence of the species is currently high toward the west of the studied area. Also, the results showed that the level of suitability of habitats in the GLM model is higher than that in other models, which may be due to the low accuracy of the model (Figure 5).
The distribution maps of Ae. tauschii were produced under climate scenarios for the years 2050 and 2070. Under all climate change scenarios, the level of suitable habitat for this species will be lost in the future, and this value will further decrease under the pessimistic scenario of RCP8.5. Also, the results showed that, with the increase in temperature due to climate change, the extent of the habitat of the studied species in the east of the studied area will decrease. It is predicted that, in 2050 and 2070, the west of the studied area will be suitable for the occurrence of the species in terms of climatic conditions (Figure 6).

3.5. Range Size of Ae. tauschii

Also, the results showed that the suitable habitats obtained for the Ae. tauschii in Iran because of climate change under the RCP2.6 and RCP8.5 climate scenarios in 2050 were equivalent to 23% and 37%, respectively. Also, this value for the year 2070 under the climate scenario RCP2.6 and RCP8.5 was equivalent to 15 and 26%, respectively. Finally, suitable habitat changes under RCP2.6 and RCP8.5 scenarios are predicted negatively. The results of the analysis of the range size of the species show that, given the conditions of climate change in 2050, under the RCP2.6 scenario, it will lose 58% of its current suitable habitats, while under the RCP8.5 scenario, this value will be 62%. Also, for the year 2070, this value is 63% for both the optimistic and the pessimistic scenarios. Examining the changes in the habitat range of this species under the influence of future climate changes and optimistic and pessimistic scenarios showed that, under the influence of the pessimistic scenario, the level of reduction of suitable habitats is higher than that in the RCP2.6 scenario (Figure 7).

4. Discussion

One of the main elements influencing how wild plant species are distributed is climate, which can have an immediate impact through physiological limitations on growth and regeneration or an indirect impact through ecological factors like competition for resources [30]. The distribution of a wide variety of species has all been significantly impacted by the relatively minor climatic changes that have occurred over the past century. Modeling studies suggest that climate change may cause widespread extinctions [31,32]. Therefore, in the present study, the current and future distribution of Ae. tauschii were investigated using different machine learning methods and environmental variables. The results showed that the GBM and RF models had high prediction capabilities, in comparison to the GLM and ANN models, which had relatively poor performance. Results demonstrated that the ensemble model showed high performance overall suggesting its ability to reduce model uncertainty.
Precipitation and temperature can play a critical role in shaping the distribution of grass species in different regions [33]. In regions with high precipitation and low temperature, grasses are often adapted to fluctuations in moisture levels, with their growth and reproduction timed to coincide with periods of high moisture availability [11]. In contrast, in regions with low precipitation, grasses may struggle to adapt to the more constant moisture levels, leading to lower productivity and reduced distribution. In the case of Ae. tauschii, it has been observed that this species is well adapted to the Mediterranean climate, which is characterized by warm, dry summers and mild, wet winters [34]. Bio10 (i.e., the mean temperature of the warmest quarter) was another important factor affecting the distribution of Ae. tauschii in Iran. In particular, the temperature of the warmest quarter can indicate the overall temperature conditions in a region and can be used to predict the suitability of the environment for plant growth and reproduction [35]. Soil texture, including the proportion of silt, can play an important role in shaping the distribution of plant species. This is because soil texture can influence the availability of water, nutrients, and other resources to plants and can affect their ability to establish and persist in different environments [36,37,38]. Studies have shown that soil texture can have a significant impact on plant growth and survival, with coarser textures, such as sand, allowing for good drainage but poor water and nutrient retention, while finer textures, such as silt, providing better water and nutrient retention but potentially limiting drainage [39]. Additionally, silt can help to reduce soil erosion, providing a more stable environment for plant growth [40]. It is important to note, however, that the low contribution of some variables to the modeling process does not necessarily mean that they do not influence species distribution. Further research is needed to fully understand the role of all variables in the habitat suitability of Ae. tauschii in Iran.
The results of this study on the range size of Ae. tauschii in Iran indicate that the species will face significant reductions in its suitable habitats due to climate change. These results highlight the negative impact of climate change on the distribution of Ae. tauschii and demonstrate the potential loss of suitable habitats for this species under climate change scenarios. There have been several studies that have explored the impacts of climate change on Aegilops [41,42,43]. Some of these studies have focused on the effects of rising temperatures and changing precipitation patterns on the distribution and diversity of Aegilops, while others have investigated the impacts of extreme weather events and changing growing conditions on the productivity and viability of these species [44,45]. Rampino et al. [46] and Pradhan et al. [47] found that extreme weather events, such as heatwaves and drought, had a negative impact on the growth and productivity of Aegilops species. Lambers et al. [48] found that increasing temperatures and changing precipitation patterns were associated with reductions in the distribution and diversity of Aegilops species in certain regions. It is important to note that the effects of climate change on Aegilops species can vary depending on the specific species and its location, as well as the magnitude and pace of climate change. Hosseini et al. [44] showed that climate change has a negative impact on the range size of Ae. Tauschii, but this effect was positive for the range size of Ae. crassa and Ae. triuncialis. However, the distribution of Ae. tauschii under climate change is also influenced by human activities such as land use changes and the introduction of non-native plant species, which can reduce its colonization success. Overall, research on the impact of climate change on Ae. tauschii suggests that the species has the potential to adapt to changing environmental conditions, but its distribution is complex and influenced by multiple factors. Future research is needed to better understand the mechanisms driving the distribution of Ae. tauschii and the implications of its changing distribution for biodiversity and crop improvement.
Wild relatives of cultivated crops are significant for enhancing crop quality, and preserving their diversity is a major concern that many worldwide initiatives and groups strive to address [49]. Aegilops species have considerably contributed to genetic advancements in the past as members of the secondary gene pool of cultivated wheat and are anticipated to continue doing so to broaden the genetic basis of wheat cultivars [44,50,51]. Therefore, it is very important that Aegilops species are effectively maintained in situ and ex situ to be available to breeders [44,52]. One of the IUCN’s criteria for assigning the endangered status of a species is a 50% reduction in its predicted range due to climate change [44,53]. For this reason, according to the results obtained in this research and the high importance of this species, it is suggested that sampling and storage of this species should be carried out in the eastern regions of the study area with multiyear plans as an emergency solution. The conservation strategies that will lead to the preservation and restoration of Ae. tauschii in the study area in the long term are as follows:
  • Protected areas and habitat restoration: Establishing and managing protected areas, as well as restoring degraded habitats, can help conserve Ae. tauschii and its habitats currently and in the future.
  • Assisted migration and translocation: Moving Ae. tauschii to new locations that are more suitable under future climatic conditions can help conserve this species.
  • In situ conservation: Maintaining populations of Ae. tauschii in its current location through methods such as controlled breeding and seed banking can help conserve this valuable species.
  • Climate-smart land use planning: Integrating climate change considerations into land use planning and management can help ensure that future land use decisions conserve and protect not only Ae. tauschii and its habitats but also other plant species in the study area.

5. Conclusions

This study utilized four machine learning algorithms to assess the potential impact of climate change on the distribution of Aegilops tauschii in Iran. Through robust prediction ensemble modeling, we found that, under future climate scenarios, Ae. tauschii is projected to experience a significant loss of suitable habitats in Iran. Notably, temperature seasonality (bio4), precipitation seasonality (bio15), and mean temperature of the warmest quarter (bio10) emerged as crucial factors influencing habitat suitability for Ae. tauschii. The models, particularly GBM and RF, demonstrated high accuracy in predicting species distribution. Our results indicate a pronounced habitat loss for Ae. tauschii, especially in the eastern region of the study area, emphasizing the vulnerability of this species to climate change. These findings underscore the pressing need for proactive measures to mitigate the adverse effects of climate change on biodiversity, emphasizing the critical importance of conserving the remaining habitats of Ae. tauschii in Iran. Our research serves as a valuable tool for informing conservation strategies and underscores the necessity for ongoing monitoring and protection efforts to safeguard this species. In conclusion, this study not only sheds light on the potential future distribution dynamics of Ae. tauschii but also underscores the broader implications for ecological conservation efforts.

Author Contributions

Conceptualization, S.M. and K.A.; methodology, K.A., A.N. and S.M.; software, K.A.; validation, M.J.A.; formal analysis, K.A. and S.M.; investigation, S.M. and M.J.A.; data curation, S.M., K.A. and M.J.A.; writing—original draft preparation, S.M., K.A., A.N. and M.J.A.; writing—review and editing, S.M., K.A. and M.JA.; visualization, K.A.; supervision. All authors have read and agreed to the published version of the manuscript.

Funding

This research received no external funding.

Institutional Review Board Statement

Not applicable.

Data Availability Statement

The original contributions presented in the study are included in the article, further inquiries can be directed to the corresponding author.

Acknowledgments

We thank the anonymous reviewers for their careful reading of our manuscript and their many insightful comments and suggestions. This research is supported by the MECW research program and the Centre for Advanced Middle Eastern Studies, Lund University.

Conflicts of Interest

The authors declare no conflict of interest.

References

  1. Solomon, S.; Qin, D.; Manning, M. Climate Change 2007—The Physical Science Basis: Working Group I Contribution to the Fourth Assessment Report of the IPCC; Cambridge University Press: Cambridge, UK, 2007; Volume 4. [Google Scholar]
  2. Diffenbaugh, N.S.; Ashfaq, M. Intensification of hot extremes in the United States. Geophys. Res. Lett. 2010, 37. [Google Scholar] [CrossRef]
  3. Bellard, C.; Bertelsmeier, C.; Leadley, P.; Thuiller, W.; Courchamp, F. Impacts of climate change on the future of biodiversity. Ecol. Lett. 2012, 15, 365–377. [Google Scholar] [CrossRef] [PubMed]
  4. Lenoir, J.; Svenning, J.C. Climate-related range shifts—A global multidimensional synthesis and new research directions. ECOGEG 2015, 38, 15–28. [Google Scholar] [CrossRef]
  5. Thuiller, W. Climate change and the ecologist. Nature 2007, 448, 550–552. [Google Scholar] [CrossRef] [PubMed]
  6. Halbritter, A.H.; Alexander, J.M.; Edwards, P.J.; Billeter, R. How comparable are species distributions along elevational and latitudinal climate gradients? Glob. Ecol. Biogeogr. 2013, 22, 1228–1237. [Google Scholar] [CrossRef]
  7. Azizi, G.H.; Roshani, M. Study of climate change on the southern coast of the Caspian Sea with the Mann-Kendall method. Phys. Geogr. 2008, 64, 13–28. [Google Scholar]
  8. Franklin, J. Moving beyond static species distribution models in support of conservation biogeography. Divers. Distrib. 2010, 16, 321–330. [Google Scholar] [CrossRef]
  9. Jones, C.C. Challenges in predicting the future distributions of invasive plant species. For. Ecol. Manag. 2012, 284, 69–77. [Google Scholar] [CrossRef]
  10. Lemke, A.; Buchholz, S.; Kowarik, I.; Starfinger, U.; von der Lippe, M. Interaction of traffic intensity and habitat features shape invasion dynamics of an invasive alien species (Ambrosia artemisiifolia) in a regional road network. NeoBiota 2021, 64, 155–175. [Google Scholar] [CrossRef]
  11. Remya, K.; Ramachandran, A.; Jayakumar, S. Predicting the current and future suitable habitat distribution of Myristica dactyloides Gaertn. using MaxEnt model in the Eastern Ghats, India. Ecol. Eng. 2015, 82, 184–188. [Google Scholar] [CrossRef]
  12. Taylor, S.; Kumar, L. Potential distribution of an invasive species under climate change scenarios using CLIMEX and soil drainage: A case study of Lantana camara L. in Queensland, Australia. J. Environ. Manag. 2013, 114, 414–422. [Google Scholar] [CrossRef] [PubMed]
  13. Vardien, W.; Richardson, D.; Foxcroft, L.; Thompson, G.; Wilson, J.; Le Roux, J. Invasion dynamics of Lantana camara L. (sensu lato) in South Africa. South Afr. J. Bot. 2012, 81, 81–94. [Google Scholar] [CrossRef]
  14. Mahmoodi, S.; Heydari, M.; Ahmadi, K.; Khwarahm, N.R.; Karami, O.; Almasieh, K.; Naderi, B.; Bernard, P.; Mosavi, A. The current and future potential geographical distribution of Nepeta crispa Willd., an endemic, rare and threatened aromatic plant of Iran: Implications for ecological conservation and restoration. Ecol. Indic. 2022, 137, 108752. [Google Scholar] [CrossRef]
  15. Mahmoodi, S.; Ahmadi, K.; Heydari, M.; Karami, O.; Esmailzadeh, O.; Heung, B. Elevational shift of endangered European yew under climate change in Hyrcanian mountain forests: Rethinking conservation-restoration strategies and management. For. Ecol. Mana. 2023, 529, 120693. [Google Scholar] [CrossRef]
  16. Ahmadi, K.; Mahmoodi, S.; Pal, S.C.; Saha, A.; Chowdhuri, I.; Nguyen, T.T.; Jarvie, S.; Szostak, M.; Socha, J.; Thai, V.N. Improving species distribution models for dominant trees in climate data-poor forests using high-resolution remote sensing. Ecol. Model. 2023, 475, 110190. [Google Scholar] [CrossRef]
  17. Ahmadi, K.; Alavi, S.J.; Amiri, G.Z.; Hosseini, S.M.; Serra-Diaz, J.M.; Svenning, J.-C. The potential impact of future climate on the distribution of European yew (Taxus baccata L.) in the Hyrcanian Forest region (Iran). Int. J. Biometeorol. 2020, 64, 1451–1462. [Google Scholar] [CrossRef] [PubMed]
  18. Rana, A.; Mandal, A.; Bandyopadhyay, S. Short jute fiber reinforced polypropylene composites: Effect of compatibiliser, impact modifier and fiber loading. Compos. Sci. Technol. 2003, 63, 801–806. [Google Scholar] [CrossRef]
  19. Neupane, D.; Adhikari, P.; Bhattarai, D.; Rana, B.; Ahmed, Z.; Sharma, U.; Adhikari, D. Does Climate Change Affect the Yield of the Top Three Cereals and Food Security in the World? Earth 2022, 3, 45–71. [Google Scholar] [CrossRef]
  20. Hovhannisyan, V.; Gould, B.W. Quantifying the structure of food demand in China: An econometric approach. Agric. Econ. 2011, 42, 1–18. [Google Scholar] [CrossRef]
  21. Rana, A.; Moradkhani, H.; Qin, Y. Understanding the joint behavior of temperature and precipitation for climate change impact studies. Theor. Appl. Clim. 2017, 129, 321–339. [Google Scholar] [CrossRef]
  22. Aghaei, M.J.; Mozafari, J.; Taleei, A.R.; Naghavi, M.R.; Omidi, M. Distribution and diversity of Aegilops tauschii in Iran. Genet. Resour. Crop. Evol. 2008, 55, 341–349. [Google Scholar] [CrossRef]
  23. Schneider, T.R. Evaluations of stressful transactions: What’s in an appraisal? Stress Health ISIS 2008, 24, 151–158. [Google Scholar] [CrossRef]
  24. Wang, J.; Luo, M.C.; Chen, Z.; You, F.M.; Wei, Y.; Zheng, Y.; Dvorak, J. Aegilops tauschii single nucleotide polymorphisms shed light on the origins of wheat D-genome genetic diversity and pinpoint the geographic origin of hexaploid wheat. New Phytol. 2013, 198, 925–937. [Google Scholar] [CrossRef] [PubMed]
  25. Van Slageren, M.W. Wild Wheats: A Monograph of Aegilops L. and Amblyopyrum (Jaub. & Spach) Eig (Poaceae); Agricultural University: Wageningen, The Netherlands, 1994. [Google Scholar]
  26. Babaeian, E.; Nagafineik, Z.; Zabolabasi, F.; Habeibei, M.; Adab, H.; Malbisei, S. Climate change assessment over Iran during 2010–2039 by using statistical downscaling of ECHO-G model. Geogr. Dev. 2009, 7, 135–152. [Google Scholar]
  27. Pressey, R.L.; Cabeza, M.; Watts, M.E.; Cowling, R.M.; Wilson, K.A. Conservation planning in a changing world. Trends Ecol. Evol. 2007, 22, 583–592. [Google Scholar] [CrossRef] [PubMed]
  28. Saeidi, H.; Rahiminejad, M.R.; Vallian, S.; Heslop-Harrison, J.S. Biodiversity of Diploid D-Genome Aegilops Tauschii Coss. in Iran Measured Using Microsatellites. Genet. Resour. Crop. Evol. 2006, 53, 1477–1484. [Google Scholar] [CrossRef]
  29. Pachauri, R.K.; Allen, M.R.; Barros, V.R.; Broome, J.; Cramer, W.; Christ, R.; Church, J.A.; Clarke, L.; Dahe, Q.; Dasgupta, P. Climate Change 2014: Synthesis Report. Contribution of Working Groups I, II and III to the Fifth Assessment Report of the Intergovernmental Panel on Climate Change; IPCC: Geneva, Switzerland, 2014. [Google Scholar]
  30. Thuiller, W.; Georges, D.; Engler, R.; Breiner, F.; Georges, M.D.; Thuiller, C.W. Package ‘biomod2’. Species distribution modeling within an ensemble forecasting framework. Ecography 2016, 32, 369–373. [Google Scholar] [CrossRef]
  31. Fick, S.E.; Hijmans, R.J. WorldClim 2: New 1-km spatial resolution climate surfaces for global land areas. Int. J. Climatol. 2017, 37, 4302–4315. [Google Scholar] [CrossRef]
  32. Jarvis, A.; Lane, A.; Hijmans, R.J. The effect of climate change on crop wild relatives. Agric. Ecosyst. Environ. 2008, 126, 13–23. [Google Scholar] [CrossRef]
  33. Thomas, C.D.; Cameron, A.; Green, R.E.; Bakkenes, M.; Beaumont, L.J.; Collingham, Y.C.; Williams, S.E. Extinction risk from climate change. Nature 2004, 427, 145–148. [Google Scholar] [CrossRef] [PubMed]
  34. Schwinning, S.; Wilsey, B.J. Mechanisms controlling biomass partitioning in grasses. Oecologia 1998, 115, 259–266. [Google Scholar]
  35. Pereira, O.A.; Gómez-García, M.Á.; Arroyo, J. Aegilops in the Iberian Peninsula: A taxonomic, phytogeographical and evolutionary approach. Plant Syst. Evol. 2012, 298, 1023–1039. [Google Scholar]
  36. Givnish, T.J. Adaptive Significance of Leaf Size and Shapes in Heteroblasty. Annu. Rev. Ecol. Evol. 2002, 33, 579–609. [Google Scholar]
  37. Chala, D.; Roos, C.; Svenning, J.C.; Zinner, D. Species-specific effects of climate change on the distribution of suitable baboon habitats–Ecological niche modeling of current and Last Glacial Maximum conditions. J. Hum. Evol. 2019, 132, 215–226. [Google Scholar] [CrossRef] [PubMed]
  38. Ghamkhar, K.; Croser, J.; Aryamanesh, N.; Campbell, M.; Kon’kova, N.; Francis, C. Camelina (Camelina sativa (L.) Crantz) as an alternative oilseed: Molecular and ecogeographic analyses. Genome 2010, 53, 558–567. [Google Scholar] [CrossRef] [PubMed]
  39. Kaul, M.; Hill, R.L.; Walthall, C. Artificial neural networks for corn and soybean yield prediction. Agric. Syst. 2005, 85, 1–18. [Google Scholar] [CrossRef]
  40. Chen, J.; Keddie, B. Soil texture effects on soil water and solute transport in an agricultural field. Eur. J. Soil Sci. 2008, 59, 567–576. [Google Scholar]
  41. Haefele, S. Soil Erosion, Soil Formation, and Soil Structure. In Agroecology; John Wiley & Sons: Hoboken, NJ, USA, 2015; pp. 1–20. [Google Scholar]
  42. Ostrowski, M.F.; Prosperi, J.M.; David, J. Potential implications of climate change on Aegilops species distribution: Sympatry of these crop wild relatives with the major European crop Triticum aestivum and conservation issues. PLoS ONE 2016, 11, e0153974. [Google Scholar] [CrossRef] [PubMed]
  43. Raza, A.; Razzaq, A.; Mehmood, S.S.; Zou, X.; Zhang, X.; Lv, Y.; Xu, J. Impact of Climate Change on Crops Adaptation and Strategies to Tackle Its Outcome: A Review. Plants 2019, 8, 34. [Google Scholar] [CrossRef] [PubMed]
  44. Hosseini, N.; Mehrabian, A.; Mostafavi, H. Modeling climate change effects on spatial distribution of wild Aegilops L. (Poaceae) toward food security management and biodiversity conservation in Iran. Integr. Environ. Assess. Manag. 2022, 18, 697–708. [Google Scholar] [CrossRef] [PubMed]
  45. Rampino, P.; Pataleo, S.; Gerardi, C.; Mita, G.; Perrotta, C. Drought stress response in wheat: Physiological and molecular analysis of resistant and sensitive genotypes. Plant, Cell Environ. 2006, 29, 2143–2152. [Google Scholar] [CrossRef] [PubMed]
  46. Suneja, Y.; Gupta, A.K.; Bains, N.S. Stress adaptive plasticity: Aegilops tauschii and Triticum dicoccoides as potential donors of drought associated morpho-physiological traits in wheat. Front. Plant Sci. 2019, 10, 211. [Google Scholar] [CrossRef] [PubMed]
  47. Pradhan, G.P.; Prasad, P.V.V.; Fritz, A.K.; Kirkham, M.B.; Gill, B.S. Response of Aegilops species to drought stress during reproductive stages of development. Funct. Plant Biol. 2011, 39, 51–59. [Google Scholar] [CrossRef] [PubMed]
  48. Lambers, H.; van den Boogaard, R.I.K.I.; Veneklaas, E.J.; Villar, R. Effects of global environmental change on carbon partitioning in vegetative plants of Triticum aestivum and closely related Aegilops species. Glob. Chang. Biol. 1995, 1, 397–406. [Google Scholar] [CrossRef]
  49. Perrino, E.V.; Wagensommer, R.P. Crop Wild Relatives (CWRs) Threatened and Endemic to Italy: Urgent Actions for Protection and Use. Biology 2022, 11, 193. [Google Scholar] [CrossRef] [PubMed]
  50. Perrino, E.V.; Wagensommer, R.P. Crop Wild Relatives (CWR) Priority in Italy: Distribution, Ecology, In Situ and Ex Situ Conservation and Expected Actions. Sustainability 2021, 13, 1682. [Google Scholar] [CrossRef]
  51. Perrino, E.V.; Wagensommer, R.P.; Medagli, P. Aegilops(Poaceae) in Italy: Taxonomy, geographical distribution, ecology, vulnerability and conservation. Syst. Biodivers. 2014, 12, 331–349. [Google Scholar] [CrossRef]
  52. Maxted, N.; White, K.; Valkoun, J.; Konopka, J.; Hargreaves, S. Towards a conservation strategy for Aegilops species. Plant Genet. Resour. Charact. Util. 2008, 6, 126–141. [Google Scholar] [CrossRef]
  53. Thuiller, W.; Lavorel, S.; Araújo, M.B.; Sykes, M.T.; Prentice, I.C. Climate change threats to plant diversity in Europe. Proc. Natl. Acad. Sci. USA 2005, 102, 8245–8250. [Google Scholar] [CrossRef] [PubMed]
Figure 1. Map of the study area and distribution of Ae. tauschii in Iran.
Diversity 16 00241 g001
Figure 2. Evaluation of modeling approaches using ROC–TSS curve.
Diversity 16 00241 g002
Figure 3. Variable importance of environmental variables in Ae. tauschii species distribution modeling in Iran. The abbreviations of the environmental variables are as follows: bdod: bulk density of the fine earth fraction, cfvo: a fraction of coarse fragments, N: total nitrogen, gph: pH, bio3: isothermality, bio4: temperature seasonality, bio10: mean temperature of warmest quarter, bio13: precipitation of wettest month, bio15: precipitation seasonality.
Diversity 16 00241 g003
Figure 4. Response curves of Ae. tauschii produced by species distribution models. The abbreviations of the environmental variables are as follows: bdod: bulk density of the fine earth fraction, cfvo: a fraction of coarse fragments, N: total nitrogen, gph: pH, bio3: isothermality, bio4: temperature seasonality, bio10: mean temperature of warmest quarter, bio13: precipitation of wettest month, bio15: precipitation seasonality.
Diversity 16 00241 g004
Figure 5. Current distribution map of Ae. tauschii predicted by ensemble model in the study area.
Diversity 16 00241 g005
Figure 6. Species distribution of Ae. tauschii in the study area under climate change scenarios in 2050 and 2070.
Diversity 16 00241 g006
Figure 7. Range size of Ae. tauschii distribution under different climate change scenarios for 2050 and 2070 in the study area.
Diversity 16 00241 g007
Table 1. Accuracy of the model obtained from ROC, TSS, and Kappa values for species distribution models.
Evaluation CriteriaSpecies Distribution Models
RFGBMGLMANN
TSS0.550.5450.1650.395
ROC0.820.8030.5620.689
Kappa0.5320.4980.1190.289
Disclaimer/Publisher’s Note: The statements, opinions and data contained in all publications are solely those of the individual author(s) and contributor(s) and not of MDPI and/or the editor(s). MDPI and/or the editor(s) disclaim responsibility for any injury to people or property resulting from any ideas, methods, instructions or products referred to in the content.

