2.3.1. Health Risk Assessment Model
Health risk assessment is identified as the processes to estimate events probability and probable degree of adverse health effects over a specific period [
19]. Risk level of environmental pollutants to human beings depends on the body’s exposure dose to the pollutants and toxicity of pollutants. There are two main pathways for human exposure to trace elements in water: ingestion and dermal absorption, ignoring the exposure via inhalation [
3,
20,
21]. The exposure dose can be calculated by Equations (1) and (2) [
22,
23].
where ADD
ing (μg/(kg·day)) represents the exposure dose through ingestion, in this study, the ingestion mainly refers to the intake through water from Honghu Lake; C
w is the mean concentration of trace element in water (μg/L); IR is the intake rate of water, including direct drinking rate and indirect drinking rate (L/day); EF is the exposure frequency to pollutants (day/year); ED is the exposure duration, and it means the length of time over which contact with the contaminant lasts (year); BW represents the body weight (kg); AT is the average time (day). For carcinogenic risk, AT is the average life expectancy of people; for non-carcinogenic risk, AT is equal to ED×365 [
23].
where ADD
derm (μg/(kg·day)) represents the exposure dose through dermal absorption; SA is the exposure area of skin (cm
2); K
p is the dermal permeability coefficient of pollutants in water (cm/h), in this study, 0.001 cm/h for Cu, Cd and As, 0.0001 cm/h for Pb, 0.002 cm/h for Cr, and 0.0006 cm/h for Zn [
3,
20]; and ET is the exposure time (h/day), in this study, ET is 0.6 h/day [
3]. For the meanings of C
w, EF, ED, BW, and AT, please refer to Equation (1).
The health risks caused by environmental pollutants can be divided into carcinogenic risk and non-carcinogenic risks according to the properties. Non-carcinogenic risk takes hazard quotient (HQ) as the measure of risk assessment. As shown in Equation (3) [
23], HQ is the ratio of daily exposure dose to the reference dose. If synergy and antagonism between different pollutants are not considered, integrated non-carcinogenic risk which represented by hazard index (HI) is the sum of HQs caused by various pollutants through different pathways [
24]. HI > 1 means a certain degree of adverse effects on human health; HI ≤ 1 indicates no harm [
23,
25].
where HQ
i is the hazard quotient of trace elements through ingestion or dermal absorption, dimensionless; ADD
i (μg/(kg·day)) is the daily exposure dose of non-carcinogenic pollutants; RfD (μg/(kg·day)) is the reference dose of pollutants;
i is the pathways of exposure;
n is the kinds of trace elements; HI is the hazard index, which is the sum of HQs of the studied trace elements from all the applicable pathways, in this study, and the pathways include ingestion and dermal absorption.
Carcinogenic risk is the product of daily exposure dose and cancer slope factor, which is shown in Equation (5). Under the assumption that there is no antagonism and synergism between pollutants, the integrated carcinogenic risk can also be identified as the sum of carcinogenic risks exposure by various pollutants via different pathways. USEPA believes that carcinogenic risk value of human being is acceptable within 1 × 10
−4 [
26], while the maximum acceptable risk value recommended by International Commission on Radiological Protection (ICRP) is 5 × 10
−5 [
27]. The significant difference between the two evaluation standards may mislead the decision makers in their final judgment. Furthermore, it should be noted that there is currently no official and uniform standard of acceptable risk value in China and many developing countries, which may lead to uncertainty and incomparability among different decision-makers. Therefore, risk classification was carried out in this study in order to make the evaluation results clearer and more intelligible. Risk levels were rated as 7 levels based on the Delphi method, assessment criteria of USEPA and ICRP, as well as existing research (
Table 1) [
28,
29,
30,
31].
where CR
i is the carcinogenic risk of trace elements through ingestion or dermal absorption, dimensionless; ADD
i (μg/(kg·day)) is the daily exposure dose of carcinogenic pollutants; CSF
i (kg·day/μg) is the cancer slope factor of carcinogenic pollutants; CR is the sum of CR
i; for
n and
i, please refer to Equation (4).
2.3.2. Exposure Parameters Selection Based on Triangular Fuzzy Numbers
Health risk assessment is one of the significant methods to evaluate the risk of environmental pollution on human beings. However, in practical application, due to the complexity of environmental system and limitations of people’s cognitive level, there are always a large amount of uncertainties in health risk assessment, including parameter uncertainty, scenario uncertainty, and model uncertainty [
32]. Triangular fuzzy numbers were introduced into health risk assessment to reduce and quantify parameter uncertainties.
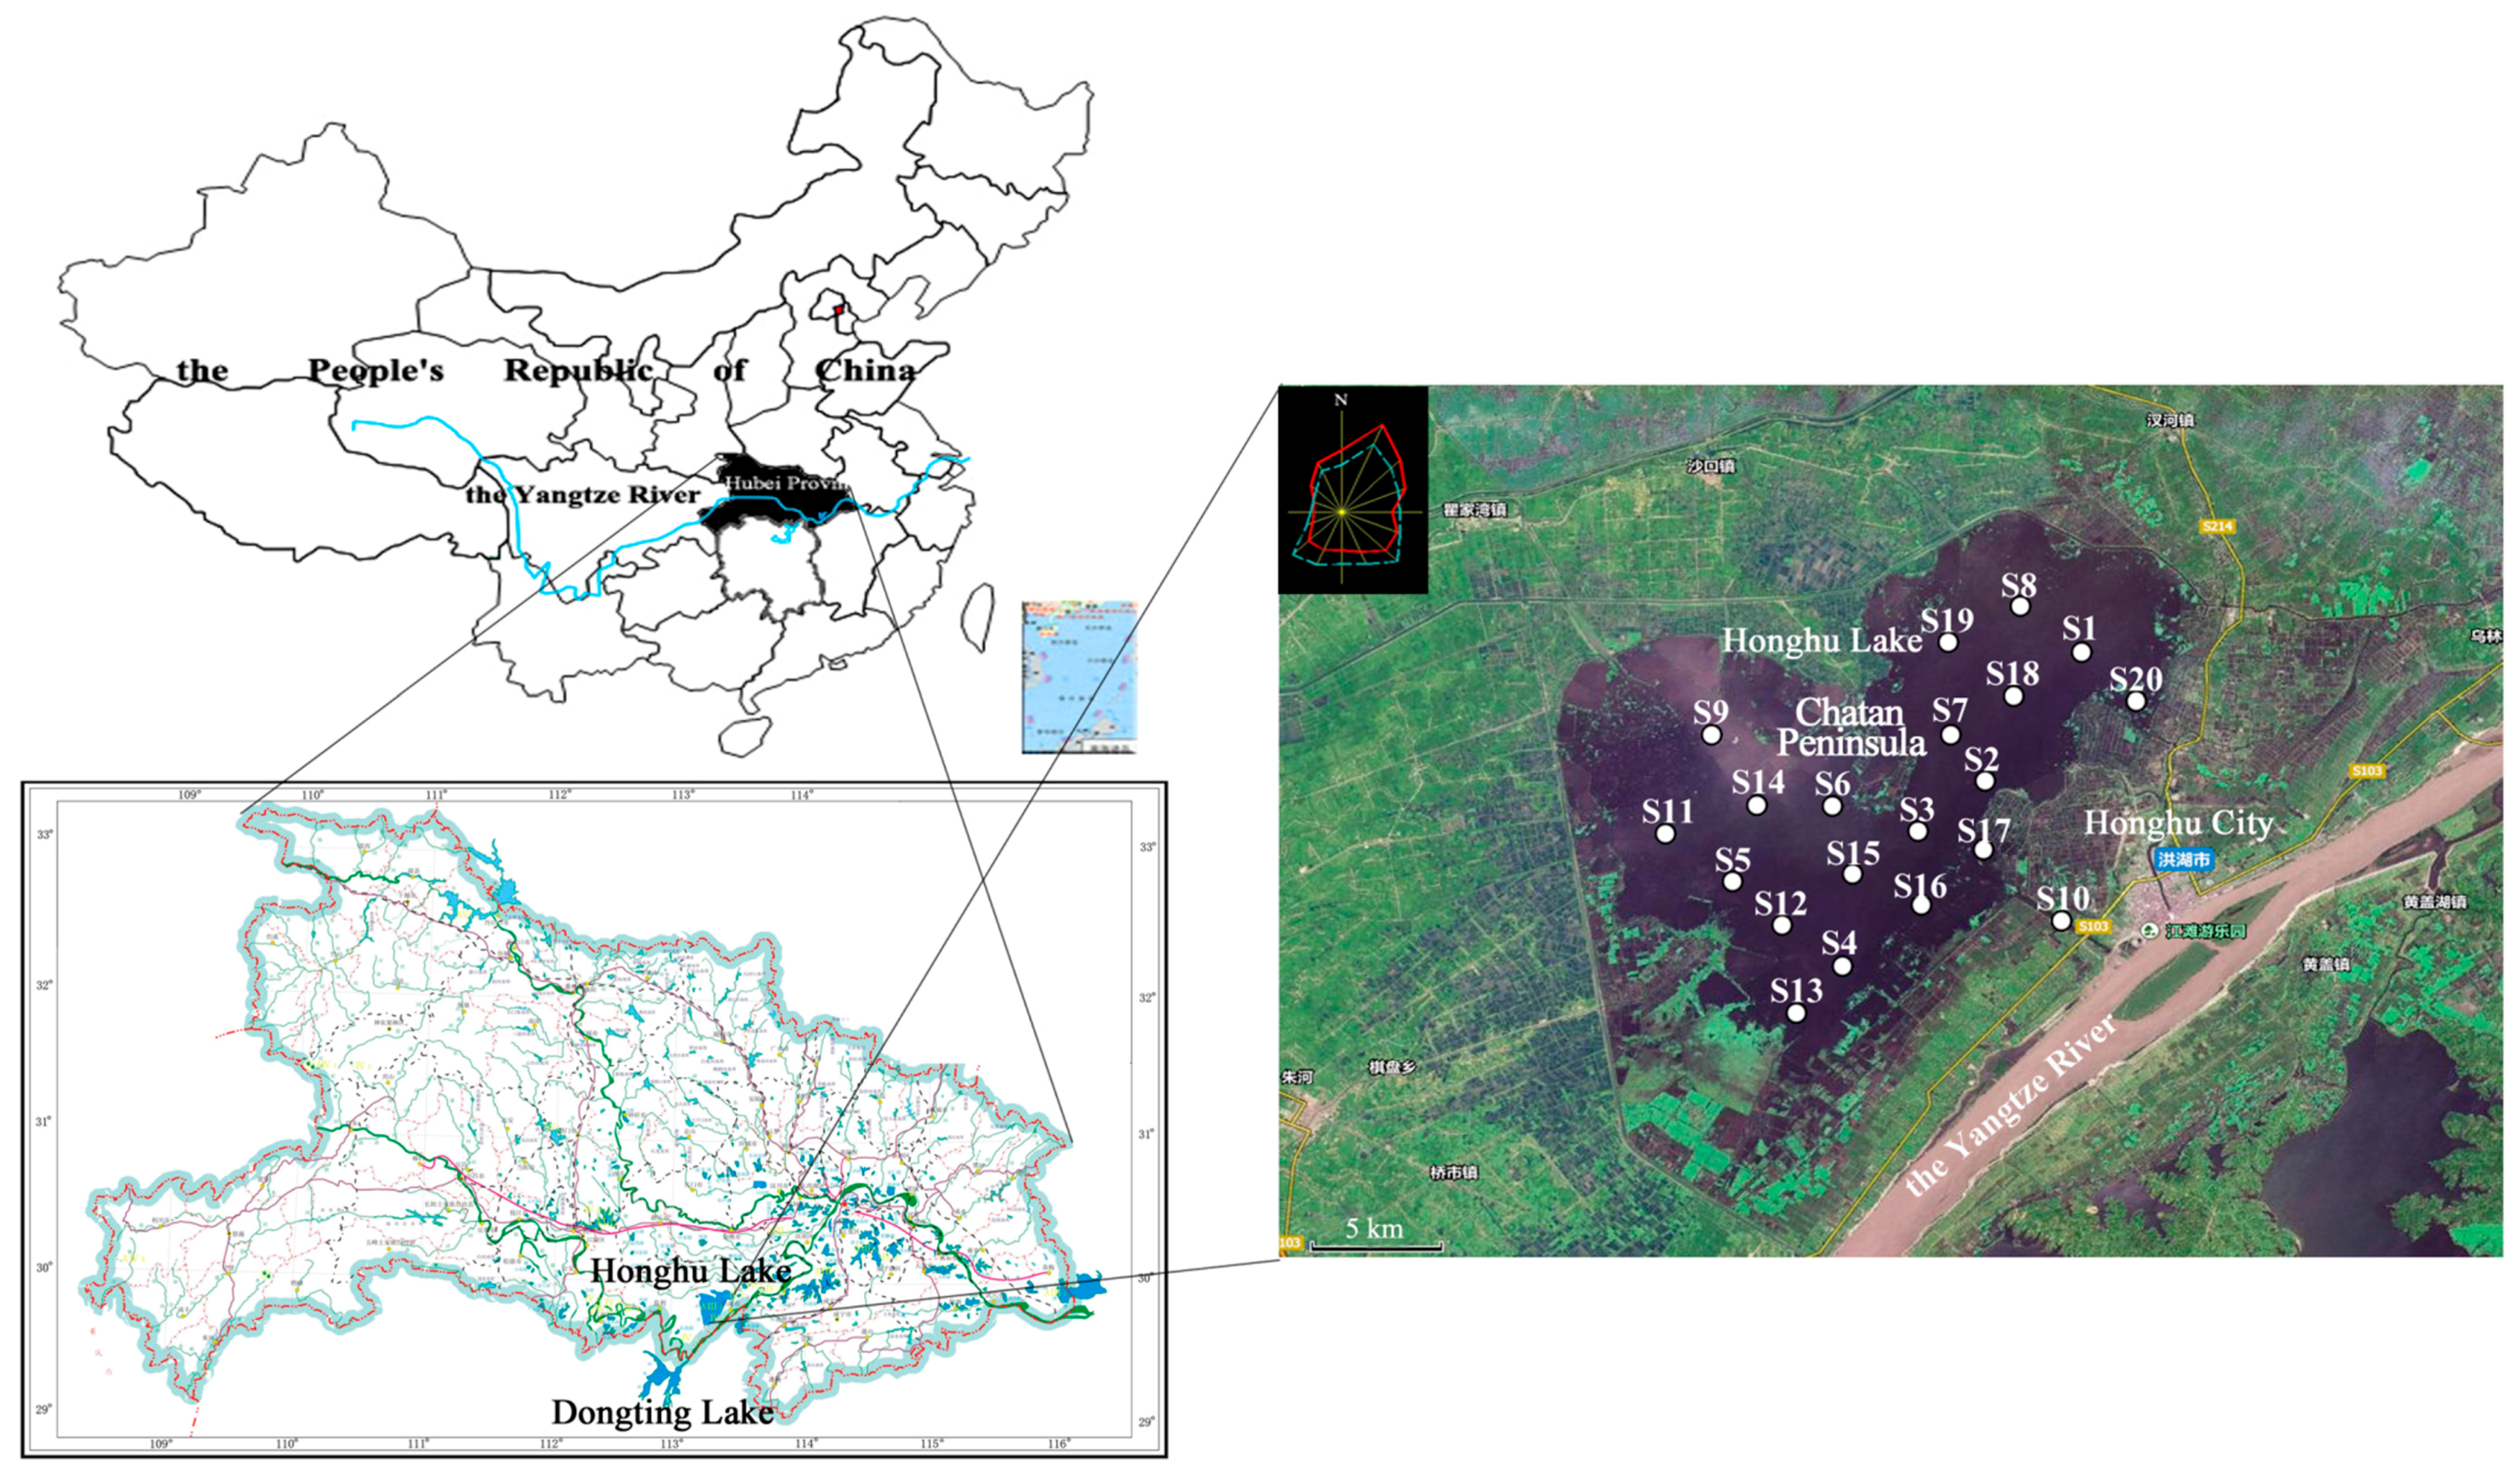
The main research objects in this study were inhabitants around Honghu Lake. Honghu Lake is surrounded by countryside, with the Chatan Peninsula in the center of the lake. Some surrounding farmers and fishermen on the Chatan Peninsula take preliminarily preprocessed water from Honghu Lake as domestic water and drinking water, especially fishermen, who are closely related to Honghu Lake, and drink and use water from it. Sampling time of surface water was determined during August 2016 for a screening-level assessment to preliminarily identify the risk priority pollutants and control areas. There are great individual and regional differences in human exposure characteristic to pollutants. Thus, exposure parameter selection should synthetically consider regional characteristics, occupational features, season and gender. On the basis of considering various factors, the exposure parameters are no longer single constants. Therefore, triangular fuzzy numbers are applied on selection of exposure parameters accordingly, combining with α-cut, and transform the exposure parameters involved into intervals for health risk assessment.
There are differences among different individuals in the selection of exposure parameters, and these parameters tend to obey the Gauss distribution or the approximate Gauss distribution. Triangular fuzzy numbers can approximately fit the Gauss distribution. Triangular fuzzy numbers have good applicability to deal with data which is lack of insufficient information or accuracy. It synthetically considers several factors in parameter selection, and describes the randomness and fuzziness of the parameters by the membership function, defined as follows: Assuming that there is a fuzzy number
à in the real number R, define a membership function [
33]:
Then
à is described as triangular fuzzy numbers, and recorded as
à = (
a1,
a2,
a3), where
a1,
a2,
a3 are the minimum value, the most possible value, and the maximum value, respectively (
a1 ≤
a2 ≤
a3). According to mathematical statistics methods and numerical analysis principle [
34], the choosing method of
a1,
a2,
a3 is as follows:
a1 picks the larger value after comparing the minimum value and (Mean − 2SD) of the data;
a2 is the statistical expectation of the data, which reflects overall size feature of the random variables. The commonly-used statistics of statistical expectation include the arithmetic mean, geometric mean and median, and the final selection depends on the distribution characteristics of the random variables;
a3 picks the smaller value after comparing the maximum value and (Mean + 2SD) of the data.
The membership degree of triangular fuzzy numbers represents the reliability of each data point in the interval of the minimum possible value and maximum possible value. Different confidence reliabilities α (0 < α < 1) correspond to different intervals. This means when
Ãα = {x|μ
Ã(x) > α, x ∈ X}, and
Ãα is an α–cut of
Ã, which represents the data set with reliability not less than α, then
Ãα = [
asα,
abα] = [α(
a2 −
a1) + a
1, −α(
a3 −
a2) +
a3] [
35]. In general, when α ≥ 0.9, the interval obtained is of high reliability, which is more conducive for managers to control the risk [
36].
Finally, the health risk level posed by trace elements is identified by membership function calculation based on
Table 1. Assuming that there is an interval of risk [CR
1, CR
2], then the membership degree of [CR
1, CR
2] in [CR
1*, CR
2*] can be quantified as [
33]:
where A(λ) represents the membership degree of [CR
1, CR
2] in [CR
1*, CR
2*]; “| |” represents the geometric length of intervals; “∩” represents taking the intersection of two intervals; and [CR
1*, CR
2*] represents the Grade λ of the risk ranks, λ = 1, 2, 3, …, 7.
In this study, the selection of exposure parameters mainly referred to “Exposure Factors Handbook of Chinese Population (Adult volume)” issued by Chinese Ministry of Environmental Protection. Based on a comprehensive consideration of region, occupation, season, gender, and actual situation of local fishermen, the values of IR, BW, and SA were determined, and the triangular fuzzy numbers were taken as IR = (0.46, 1.98, 3.5) L/day, BW = (52.28, 1.5, 72.63) kg, SA = (1.5, 1.68, 1.85) m
2, respectively [
37,
38].
Exposure duration (ED) is defined as “length of time over which contact with the contaminant lasts” by USEPA [
39]. In “Guidelines for Exposure Assessment” posed by USEPA, the recommended value of exposure duration for adults is 30 years, which is mainly considering occupational exposure. Since then, the value of ED in many studies referred to the recommended value of USEPA. However, some scholars proposed that if the human exposure to pollutants started from birth and occurred every day, the life expectancy should be selected as the exposure duration [
40]. Honghu Lake, the study area of this research, is not only an aquaculture area, but also a national nature reserve. Therefore, the evaluation objects include inhabitants surrounding the lake, residents on Chatan peninsula, and managers of the reserve. Obviously, the exposure duration of different objects has wide differences. Considering the recommended value of USEPA and the actual situation in Honghu Lake, the interval of ED was selected as (30, AT) years.
The carcinogenic and non-carcinogenic risks of trace elements were different in the values of average time (AT) when calculating the exposure dose. For non-carcinogenic risk, the average time is equal to the exposure duration, i.e., AT = ED × 365; but for carcinogenic risk, the risk exists in the entire life of the exposure objects, so average time is the average life expectancy of people. In this study, AT referred to the average life expectancy of residents in Hubei Province [
37], and the triangular fuzzy numbers of average life was AT = (24,271, 26,678, 29,085) days.
The triangular fuzzy numbers of exposure parameters were transformed into intervals with Equation (7) (
Table 2).

 ,
, 


