Abstract
Prediction of a battery’s health in data centers plays a significant role in Battery Management Systems (BMS). Data centers use thousands of batteries, and their lifespan ultimately decreases over time. Predicting battery’s degradation status is very critical, even before the first failure is encountered during its discharge cycle, which also turns out to be a very difficult task in real life. Therefore, a framework to improve Auto-Regressive Integrated Moving Average (ARIMA) accuracy for forecasting battery’s health with clustered predictors is proposed. Clustering approaches, such as Dynamic Time Warping (DTW) or k-shape-based, are beneficial to find patterns in data sets with multiple time series. The aspect of large number of batteries in a data center is used to cluster the voltage patterns, which are further utilized to improve the accuracy of the ARIMA model. Our proposed work shows that the forecasting accuracy of the ARIMA model is significantly improved by applying the results of the clustered predictor for batteries in a real data center. This paper presents the actual historical data of 40 batteries of the large-scale data center for one whole year to validate the effectiveness of the proposed methodology.
1. Introduction
Uninterrupted power source (UPS) batteries are an integral part of any data center, which ensure the stable performance of the data center during transitional fail-over mechanisms between power grids and diesel generators [1]. Data centers require steady power for smooth performance, which is thus managed by the UPS batteries. UPS is installed between the main power grid and the servers [2]. Since the electricity bill of a data center constitutes a significant portion of its overall operational costs, data centers are now major consumers of electrical energy [3]. In 2013, data centers in U.S.A. consumed 91 billion kilowatt-hours of electricity, and this was expected to continue to rise over the years [4]. In 2017, nearly 8 million data centers required an astronomical 416.2 terawatt-hours of electricity [5,6]. Even a single faulty battery in a pack could cause millions of dollars of damage to the equipment used in the data centers during transition. The layout of the data center’s design is illustrated in Figure 1.
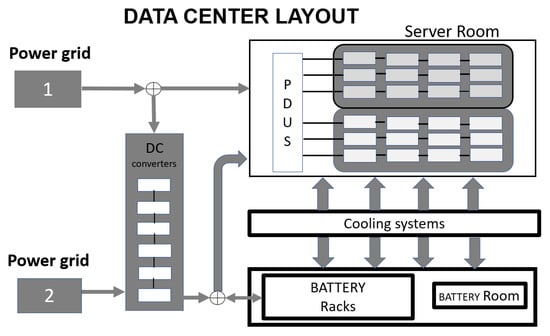
Figure 1.
Data center layout. PDUS = Power Distribution Units.
Despite the increasing improvements in battery manufacturing and storage technology [7], health estimation of batteries in data centers is still a challenge. Not surprisingly, many studies have been conducted to develop battery life prediction of the battery packs, such as voltage fault diagnosis, charge regimes, and state of health (SOH) estimation. Severson et al. [8] demonstrated a data-driven model to predict the battery life cycle with voltage curves of 124 batteries before degradation. Tang et al. [9] predicted the battery voltage with the model-based extreme learning machine for electric vehicles. L. Jiang et al. [10] employed the Taguchi method to search an optimal charging pattern for 5-stage constant-current charging strategy and improved the lithium-ion battery charging efficiency by 0.6–0.9%. D. Sidorov et al. [11] presented a review of battery energy storage and an example of battery modeling for renewable energy applications and demonstrated an adaptive approach to solve the load leveling problem with storage. Hu et al. [12] employed advanced sparse Bayesian predictive modeling (SBPM) methodology to capture the underlying correspondence between capacity loss and sample entropy. Sample entropy of short voltages displayed an effective variable of capacity loss. You et al. [13] proposed a data-driven approach to trace battery SOH by using data, such as current, voltage, and temperature, as well as historical distributions. Song et al. [14] proposed a data-driven hybrid remaining useful life estimation approach by fussing the IND-AR (Iterative nonlinear degradation autoregressive model) and empirical model via the state-space model in RPF (Regularized particle filter) for spacecraft lithium-ion batteries. Zhou et al. [15] combined Empirical Mode Decomposition (EMD) and Auto-Regressive Integrated Moving Average (ARIMA) models for the prediction of lithium-ion batteries’ Remaining Useful Life (RUL) in the Battery Management System (BMS), which is used in electric vehicles. Chen et al. [16] proposed a hybrid approach by combining Variational Mode Decomposition (VMD) de-noising technique, ARIMA, and GM (Gray Model) (1,1) models for battery RUL prediction.
The ARIMA model has been one of the most widely used models in time-series forecasting [17,18,19]. Kavasseri et al. [20] examines the use of fractional-ARIMA or f-ARIMA models to forecast wind speeds on the day-ahead (24 h) and two-day-ahead (48 h) horizons. A hybridization of Artificial Neural Network (ANN) and the ARIMA model is proposed by Khashei et al. [21] to overcome the mentioned limitation of ANNs and yield a more accurate forecasting model than traditional hybrid ARIMA-ANNs models. The annual energy consumption in Iran is forecasted by using three patterns of ARIMA–ANFIS model by Barak et al [22].
ARIMA is used in forecasting social, economic, engineering, foreign exchange, and stock problems. It predicts future values of a time series using a linear combination of its past values and a series of errors [23,24,25,26,27]. Since batteries in the data center are always on charging mode, the deep discharge is a rare occurrence for batteries and their distinctive internal chemistry causes different behaviors like stationary or stochastic for each battery. In addition, failure data is not available in real life which makes it a challenge to accurately predict the battery status before its first failure. For this paper, we developed a cluster-assisted ARIMA model framework to improve the accurate prediction of battery voltage. Clustered patterns are utilized as external regressors to improve the accuracy of the ARIMA model and provide a more accurate indication of battery status in the future. Clustering in machine learning is the grouping of a similar set of data points. This aspect is used to group the patterns of batteries within the data center and improve the forecasting model instead of predicting thousands of batteries individually. Clustering algorithms, like Dynamic Time Warping (DTW), hierarchical, fuzzy, k-shape, and TADPole all have unique functionality for grouping similar data points, and the features selected by clustering improve the model forecasting accuracy [28,29,30]. The proposed cluster-assisted forecasting results are compared with actual battery data and without clustered ARIMA forecasting.
The rest of the paper is organized as follows: Section 2 describes the features of the data center and data set used for the study. Section 3 describes data preprocessing and explain the methodology by introducing the algorithms for cluster consistency and clustered ARIMA forecasting. Section 4 shows the steps to implement the proposed clustered forecasting method. Section 5 demonstrates the battery cluster consistency detection results and cluster-assisted ARIMA forecasting, as well as discusses the effectiveness of the method by comparing the results with actual data and without the cluster-assisted forecasting ARIMA model. Section 6 concludes this work.
2. Overview of the Data Set
In this paper, data is collected from a large-scale social media company located in China. One year of data is used for research with 470,226 data points and a sampling interval time of 1 min. This data set includes the variables of data center’s main power, transmission units, battery units, cooling systems, and DC (Direct Current) load values. Data set variables are shown in Table 1.

Table 1.
Data center’s data set with all 470,226 feature instances.
Our objective is to develop a scalable clustering framework to improve the forecasting accuracy of the ARIMA model for battery voltages in data centers. Voltage measurement of individual batteries is a common practice in data centers whereas other parameters like current and charging regimes are also collectively measured from a group of batteries. Voltage is utilized in the simplest of BMS of small vehicles to large scale data centers. Our data has voltage from 40 batteries; and battery aging features are selected from domain knowledge of batteries [8].
3. Methodology
Figure 2 shows the flowchart of the proposed method and the steps of the proposed method are given as follows:
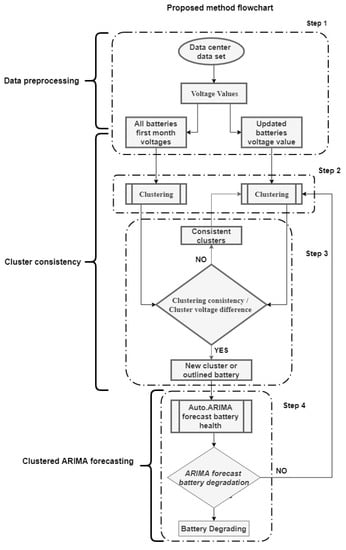
Figure 2.
Proposed method flowchart.
- Data Preprocessing
- Step 1: First, separate the battery voltage data from the data set. Extract the historic values of first-month battery voltages and keep updating the real-time voltage values.
- Cluster Consistency
- Step 2: Carry out clustering analysis on first month data and real time updated data set and proceed to the step 3.
- Step 3: Match the clustering results of first month and updated month data for cluster consistency. If cluster members are different in first and updated month clusters, then go to the next step.
- Clustered ARIMA Forecasting
- Step 4: Fit an ARIMA model using the cluster members as external predictors to forecast the battery’s voltage status, and if a cluster has only 1 member, then fit an ARIMA model without the external predictor. If the forecasted voltage has a declining trend, then the battery health is dropping comparative to its first-month’s cluster members.
3.1. Data Preprocessing
Data cleaning is the first step in the data preprocessing step by identifying the missing values and correcting the raw data for analysis. See Section 2 for multiple features of the data set. Battery voltage data is utilized to forecast battery health with the assumption that all the batteries are new and equally healthy. Data centers keep batteries in a safe and controlled environment, and all the batteries would show identical behavior and over fitted prediction models if short intervals are selected considering batteries do not fail in their early months. Our analysis suggests that discharge events occur sometimes once in a few months and sometimes twice a month. In order to analyze the effect of these events in a consistent manner, we used one year of data and divided it by 12 to update the data on each iteration on monthly basis. The first month’s data was extracted from the data set and used as a standard for comparing clustering and voltage status with real-time updated data. See Section 4.1.
3.2. Cluster Consistency
We now present our proposed cluster based predictor configuration Algorithm 1 for batteries in a data center. The approach to update the clustered predictor for forecasting on monthly basis is presented in this algorithm. For a detailed description of the k-shape-based and DTW clustering algorithm, see Appendix A.1 and Appendix A.2.
| Algorithm 1: Configuration Algorithm for Cluster Based Predictor. |
 |
Clustering algorithms accept the battery voltage data set, , as the first-month historic voltage data set and as the latest and updated voltage data set, where is the time, and is the total number of batteries. is the set of batteries when clustering is applied in the first month. is the set of batteries when clustering is applied in the latest month. is the set of inconsistent batteries’ cluster which is a result of a comparison between clustering sets of latest month and first month . If is not equal to ∅, it is an inconsistent or outlined battery cluster. and are the first and latest month clusters’ mean voltage sets, respectively. These sets also represent cluster voltage status comparative to other clusters. The difference between and gives us . If is not equal to ∅, cluster voltage status changes.
3.3. Clustered ARIMA Forecasting
Algorithm 2 is proposed to improve the ARIMA accuracy by utilizing clustering results as external regressors to forecast battery health. ARIMA models are the integration of Auto-regressive (AR) models and Moving Average models. ARIMA models are good for forecasting stationary time-series data [31]. Input sets are either or . Extracting a battery element from the set, , makes a new set . Extracting another element from from the remaining elements results in R, where R is the set of predictors used to forecast the battery element in . Then, fit an ARIMA model with R predictors to forecast . is the battery’s forecasted voltage values.
| Algorithm 2: Clustered ARIMA Forecasting. |
 |
4. Software Implementation
4.1. Cluster Consistency Detection
Import the time-series data transformed into CSV format in the data preprocessing step for R programming. Dtwclust package is used for time series clustering in R. For clustering batteries, data frame should be converted into a matrix by (as.matrix) function. Visualize the clustering results using Plot function. Repeat this process every month until an inconsistent cluster is detected and then perform clustered ARIMA forecasting (see Section 4.2). An overview of the clustering inconsistency detection procedure is shown in Figure 3.
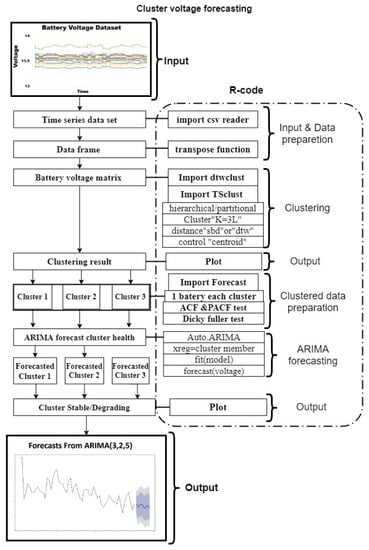
Figure 3.
Battery cluster inconsistency and battery degradation forecast method.
4.2. Implementing Clustered ARIMA Forecasting
The objective of this procedure is to improve the forecasting accuracy of ARIMA model by utilizing cluster members as an external regressor. An overview of the method is shown in Figure 3. Import “Forecast” package in R. Select a battery from the inconsistent cluster to forecast. Perform ACF (Auto Correlation Function), PACF (Partial Auto Correlation Function), and Dickey-Fuller test to check the data stationarity. Use auto.ARIMA function to build the fitting model for the selected battery. Select cluster predictors for “Xreg” function in the fitting model; if the cluster contains only one battery, then “Xreg” function is not required. Use the “forecast” function to forecast the battery voltage. If the declining trend is shown, the cluster is degrading, and if the trend is stable, then the battery will be stable in the future, as well.
5. Result and Discussion
5.1. Data Center Battery Setup
Forty VRLA batteries were installed in a room, with 20 batteries in each rack with an average voltage level between 13 and 14 V. Voltage data was collected in the BMS of the data center. There were four discharge cycles and three power surges during one year of battery life in the data center, as shown in Figure 4.
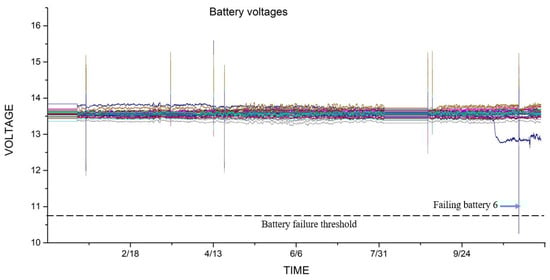
Figure 4.
One year battery voltages in data center.
5.2. Battery Voltage Time Series Clustering
Table 2 shows the Silhouette index test values, which were used to select number of clusters when clustering is applied on the batteries (see Figure 5). Figure 6 shows consistent cluster members from the first eight months. Inconsistent cluster is shown in Figure 7 after nine months. Battery 6 is now separated by battery 36 and 39, which was originally in the same cluster from the first month. Implementing DTW clustering and k-shape-based clustering on similar data resulted in different cluster members, which can be seen in Figure 8 and Figure 9.
Table 2.
Silhouette index test for cluster number selection.
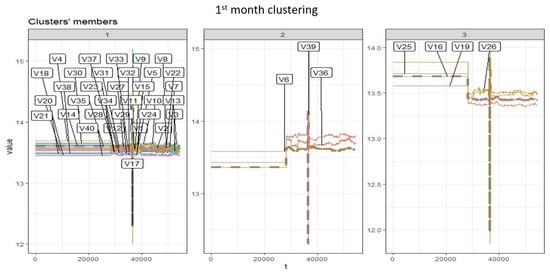
Figure 5.
K-shape-based 1st month clusters.
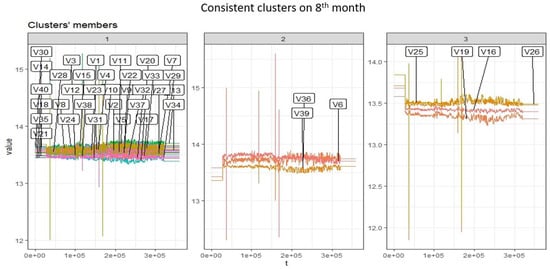
Figure 6.
Consistent clusters after eight months.
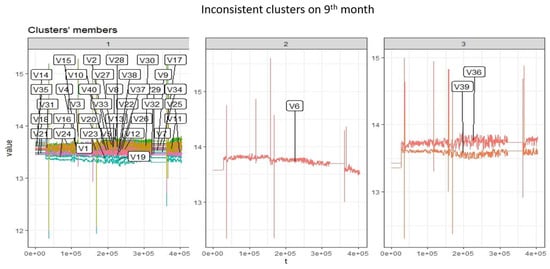
Figure 7.
Cluster inconsistency encounter after nine months.
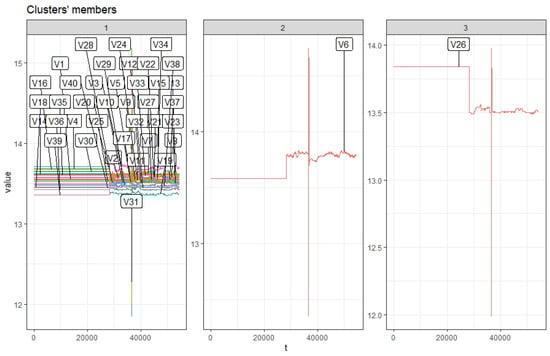
Figure 8.
Dynamic Time Warping (DTW) clustering 1st month clusters.
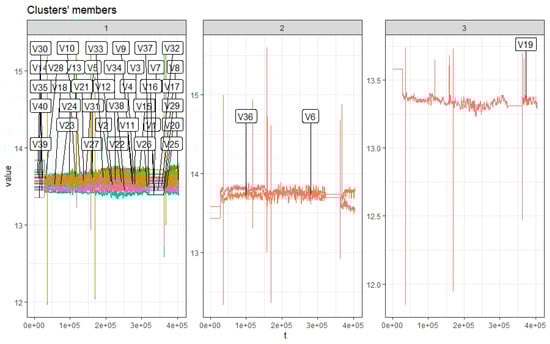
Figure 9.
DTW clustering after nine months.
This change in cluster consistency is an indication of a change in battery voltage behavior. Utilizing this new information as a starting point to predict the battery health from each cluster, an improved accuracy forecasting model is discussed in Section 5.3.
5.3. ARIMA Forecasting
The proposed clustered ARIMA approach was evaluated by comparing actual voltage with predictors (k-shape-based clustered predictors), Single predictors (without clustering), Total predictors (complete data), and predictors (DTW clustered predictors). The metrics used are Root Mean Square Error (RMSE), Mean Average Error (MAE), and Mean Average Percentage Error (MAPE). One battery from each cluster, such as Battery 6, Battery 15, Battery 19, and Battery 36, was selected for demonstration. The cluster inconsistency was detected in the 9th month, thus transforming the data of 9th month for the forecasting model. ACF and PACF for the transformed data are shown in Figure 10. Table 3 shows the augmented Dickey-Fuller test of the selected batteries. Batteries were selected from different clusters, and each battery showed different voltage behavior, which would require a different fitting model for each battery. The forecast package used the (auto.ARIMA) function to automatically select the best-fitted model by comparing with the other models. AIC (Akaike information criterion) and BIC (Bayesian information criterion) are both penalized-likelihood criteria that were used for fit criteria [32]. Table 4 and Table 5 show the AIC and BIC values of the best-fitted model on the batteries for the Total, Single, , and predictors scenario.
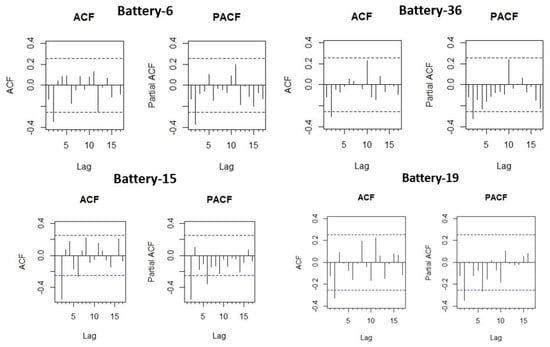
Figure 10.
Auto-correlation and partial correlation of the selected battery data.
Table 3.
The augmented Dickey-Fuller.
Table 4.
Fitted models AIC and BICvalues.
Table 5.
Fitted models AIC and BIC values with Dynamic Time Warping (DTW) Clustering.
Battery 6 (cluster 2) is a single member in cluster 2, and it has zero external predictor in the cluster at the point of cluster inconsistency detection by k-shape clustering. This makes battery 6 (cluster 2) a special case because predictor and Single predictor case is equal for battery 6. Prediction results of battery 6 with Single/ predictor have better accuracy than Total predictor. This argument is further verified for Battery 15 (cluster 1) and Battery 36 (cluster 3) with the metrics comparison of the predictor, Single predictor, and Total predictor in Table 6. Battery 15 (cluster 1), Battery 36 (cluster 2), and Battery 19 (cluster 3) are the chosen batteries from clustering. Table 7 shows the metrics comparison of the predictor, Single predictor, and Total predictor. ARIMA accuracy is improved when implemented with DTW and k-shape-based clustering. Results show that k-shape-based clustered ARIMA model has better accuracy than DTW.
Table 6.
Auto-Regressive Integrated Moving Average (ARIMA) performance comparison of k-shape-based Clustered predictor (), Single predictor (S), and Total predictor (T). RMSE = Root Mean Square Error; MAE = Mean Average Error; MAPE = Mean Average Percentage Error.
Table 7.
ARIMA performance comparison of Dynamic Time Warping (DTW) Clustered predictor (), Single predictor (S), and Total predictor (T).
Comparison of voltage forecast of Battery 6, Battery 15, Battery 19, and Battery 36 with actual voltage, predictor, Single predictor, predictor, and Total predictor is shown in Figure 11, Figure 12, Figure 13 and Figure 14, respectively. Battery 6 is a single member of k-shape-based cluster 2, so it is compared with predictor, Total predictor, and actual voltage in Figure 11. Battery 19 is the only member of Dynamic Time Warping (DWT) cluster 3, so it is compared with predictor, Total predictor, and actual voltage values in Figure 13. It is evident from Figure 6 and Figure 7 and these figures that the predictor model is a better fit for the battery voltage data.
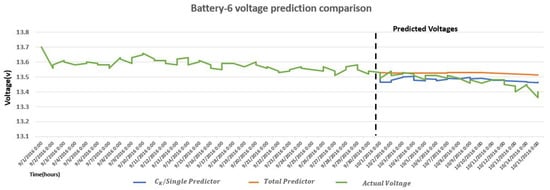
Figure 11.
Comparison of measured and ARIMA forecasted voltage with Clustered (Single) predictor of Battery 6.
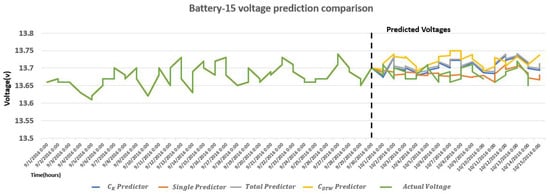
Figure 12.
Comparison of measured and ARIMA forecasted voltage with , Single, Total, and predictor of Battery 15 from cluster 1.
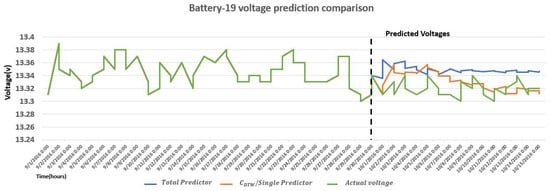
Figure 13.
Comparison of measured and ARIMA forecasted voltage with Total predictor of Battery 19.
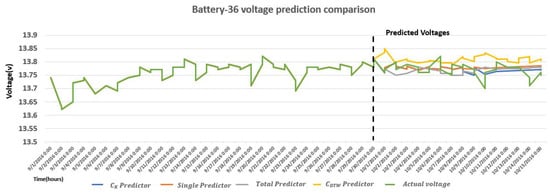
Figure 14.
Comparison of measured and ARIMA forecasted voltage with , Single, Total, and predictor of Battery 36.
5.4. Effectiveness of Clustered ARIMA Approach
Identifying a battery with a declining voltage is difficult in the data center, as can be seen in Figure 4. Voltage equalization depends on the voltage threshold levels, which is not a better solution for batteries in the data center because it causes false alarms during charge and discharge cycles, and, since the batteries are always on a charging mode, any flaw cannot be observed until it is too late, whereas weak batteries fail when there is a discharge cycle due to power supply failure. As battery 6 failed only in the battery discharging event caused by the power failure, Figure 15 shows that it resumes its voltage status from where it left off when charging recommences. Our proposed clustered ARIMA framework predicts the battery voltage and provides an estimate of battery status in the future with improved accuracy. Similarly, one-year actual resistance values of Battery 6, 15, 19, and 36 verify the predicted results in Figure 16.
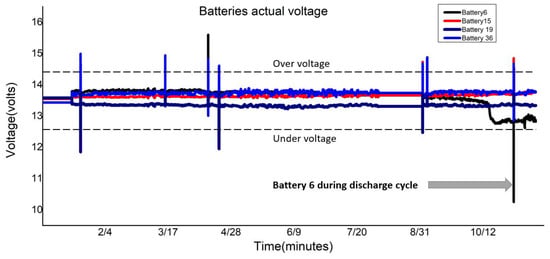
Figure 15.
One-year actual voltage value, voltage drop in Battery 6, as well as stable voltages for Battery 15, 19, and 36, validate the proposed method.
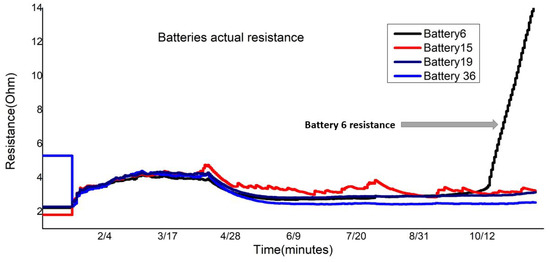
Figure 16.
One-year actual resistance value, resistance rise in Battery 6, as well as Stable Resistance for Battery 15, 19, and 36, validate the proposed method.
6. Conclusions
Considering that the prediction model has a significant impact on a forecasting battery’s degradation status, in order to improve the ARIMA model forecasting accuracy, a clustered ARIMA forecasting framework was proposed, with the 40 batteries in the data center. Cluster-assisted results can significantly improve the ARIMA forecasting accuracy compared with the Single predictor and Total data predictors. It was observed that the k-shape-based clustering assisted results are more accurate compared to Dynamic Time Warping (DTW) clustering. A few challenges with our data-driven technique implications are the cleaning and preparation of data set, loss of data, and missing values that have to be addressed to apply the proposed method.
Author Contributions
S.N.H. designed the algorithm and wrote the manuscript. X.L. helped to correct the paper. Q.Z. supervised and revised the findings of this work. All authors have read and agreed to the published version of the manuscript.
Funding
This work received supports from National Key Research and Development Project of China under Grant 2017YFC0704100 and Grant 2016YFB0901900, in part by the National Natural Science Foundation of China under Grant 61425027, Tencent Inc., and in part by the 111 International Collaboration Program of China under Grant BP2018006, and BNRist Program (BNR2019TD01009).
Conflicts of Interest
Declare conflicts of interest or state “The authors declare no conflict of interest.” Authors must identify and declare any personal circumstances or interest that may be perceived as inappropriately influencing the representation or interpretation of reported research results. Any role of the funders in the design of the study; in the collection, analyses or interpretation of data; in the writing of the manuscript, or in the decision to publish the results must be declared in this section. If there is no role, please state “The funders had no role in the design of the study; in the collection, analyses, or interpretation of data; in the writing of the manuscript, or in the decision to publish the results”.
Abbreviations
The following abbreviations are used in this manuscript:
| UPS | Uninterrupted power source |
| T-predictor | Total predictors |
| S-predictor | Single predictors |
| -predictor | k-shape-based clustered predictors |
| -predictor | Dynamic Time Warping clustered predictors |
| SBD | Shape-based |
| HVDC | High Voltage Direct Current |
| PDU | Power Distribution Units |
| AC | Air Condition |
Appendix A
Appendix A.1.
k-shape clustering is an iterative refinement algorithm to isolate each cluster with keeping the shapes of time-series data. In k-shape, cross-correlation measures are implemented to calculate the centroid of all clusters, and then update the members of each cluster [30], where is the cross-correlation sequence between and , and is the Rayleigh quotient see Equation (A1).
Appendix A.2.
Several methods have been proposed to cluster time series. All approaches generally modify existing algorithms, either by replacing the default distance measures with a version that is more suitable for comparing time series as shown in Equation (A2). Dynamic Time Warping (DTW) is general and, hence, suitable for almost every domain. A warping path , with , is a contiguous set of matrix elements that defines a mapping between and under several constraints [30].
References
- Urgaonkar, R.; Urgaonkar, B.; Neely, M.J.; Sivasubramaniam, A. Optimal power cost management using stored energy in data centers. In Proceedings of the ACM SIGMETRICS Joint International Conference on Measurement and Modeling of Computer Systems, San Jose, CA, USA, 7–11 June 2011; pp. 221–232. [Google Scholar]
- Dayarathna, M.; Wen, Y.; Fan, R. Data center energy consumption modeling A survey. IEEE Commun. Surv. Tutori. 2015, 18, 732–794. [Google Scholar] [CrossRef]
- Ferreira, J.; Callou, G.; Maciel, P. A power load distribution algorithm to optimize data center electrical flow. Energies 2013, 6, 3422–3443. [Google Scholar] [CrossRef]
- Ferreira, J.; Callou, G.; Tutsch, D.; Maciel, P. PLDAD-An Algorihm to Reduce Data Center Energy Consumption. Energies 2018, 11, 2821. [Google Scholar] [CrossRef]
- Callou, G.; Ferreira, J.; Maciel, P.; Tutsch, D.; Souza, R. An integrated modeling approach to evaluate and optimize data center sustainability, dependability and cost. Energies 2014, 7, 238–277. [Google Scholar] [CrossRef]
- Wu, Q.; Deng, Q.; Ganesh, L.; Hsu, C.H.; Jin, Y.; Kumar, S.; Li, B.; Meza, J.; Song, Y.J. Dynamo: Facebook’s data center-wide power management system. ACM SIGARCH Comput. Archit. News. 2016, 44, 469–480. [Google Scholar] [CrossRef]
- Hosseini, S.; Farhadi, K.; Banisaeid, S. Improving particle size of BaSO4 with a unique glycerol base method and its impact on the negative active material of the lead-acid battery. J. Energy Storage 2019, 21, 139–148. [Google Scholar] [CrossRef]
- Severson, K.A.; Attia, P.M.; Jin, N.; Perkins, N.; Jiang, B.; Yang, Z.; Chen, M.H.; Aykol, M.; Herring, P.K.; Fraggedakis, D.; et al. Data-driven prediction of battery cycle life before capacity degradation. Nat. Energy 2019, 5, 383–391. [Google Scholar] [CrossRef]
- Tang, X.; Yao, K.; Liu, B.; Hu, W.; Gao, F. Long-term battery voltage, power, and surface temperature prediction using a model-based extreme learning machine. Energies 2018, 11, 86. [Google Scholar] [CrossRef]
- Jiang, L.; Li, Y.; Huang, Y.; Yu, J.; Qiao, X.; Wang, Y.; Huang, C.; Cao, Y. Optimization of multi-stage constant current charging pattern based on Taguchi method for Li-Ion battery. Appl. Energy 2020, 259, 114148. [Google Scholar] [CrossRef]
- Sidorov, D.N.; Muftahov, I.R.; Tomin, N.; Karamov, D.N.; Panasetsky, D.A.; Dreglea, A.; Liu, F.; Foley, A. A dynamic analysis of energy storage with renewable and diesel generation using Volterra equations. IEEE Trans. Ind. Inf. 2019. [Google Scholar] [CrossRef]
- Hu, X.; Jiang, J.; Cao, D.; Egardt, B. Battery health prognosis for electric vehicles using sample entropy and sparse Bayesian predictive modeling. IEEE Trans. Ind. Electron. 2015, 63, 2645–2656. [Google Scholar] [CrossRef]
- You, G.W.; Park, S.; Oh, D. Real-time state-of-health estimation for electric vehicle batteries: A data-driven approach. Appl. Energy 2016, 176, 92–103. [Google Scholar] [CrossRef]
- Song, Y.; Liu, D.; Yang, C.; Peng, Y. Data-driven hybrid remaining useful life estimation approach for spacecraft lithium-ion battery. Microelectron. Reliab. 2017, 142–153. [Google Scholar] [CrossRef]
- Zhou, Y.; Huang, M. Lithium-ion batteries remaining useful life prediction based on a mixture of empirical mode decomposition and ARIMA model. Microelectron. Reliab. 2016, 65, 265–273. [Google Scholar] [CrossRef]
- Chen, L.; Xu, L.; Zhou, Y. Novel approach for lithium-ion battery on-line remaining useful life prediction based on permutation entropy. Energies 2018, 11, 820. [Google Scholar] [CrossRef]
- Box, G.E.; Jenkins, G.M.; Reinsel, G.C.; Ljung, G.M. Time Series Analysis, Forecasting and Control-Segunda Edição; Wiley: Hoboken, NJ, USA, 1976. [Google Scholar]
- Eymen, A.; Köylü, Ü. Seasonal trend analysis and ARIMA modeling of relative humidity and wind speed time series around Yamula Dam. Meteorol. Atmos. Phys. 2019, 131, 601–612. [Google Scholar] [CrossRef]
- Matyjaszek, M.; Fernández, P.R.; Krzemień, A.; Wodarski, K.; Valverde, G.F. Forecasting coking coal prices by means of ARIMA models and neural networks, considering the transgenic time series theory. Resour. Policy 2019, 61, 283–292. [Google Scholar] [CrossRef]
- Kavasseri, R.G.; Seetharaman, K. Day-ahead wind speed forecasting using f-ARIMA models. Renew. Energy 2009, 34, 1388–1393. [Google Scholar] [CrossRef]
- Khashei, M.; Bijari, M. A novel hybridization of artificial neural networks and ARIMA models for time series forecasting. Appl. Soft Comput. 2011, 34, 2664–2675. [Google Scholar] [CrossRef]
- Barak, S.; Sadegh, S.S. Forecasting energy consumption using ensemble ARIMA-ANFIS hybrid algorithm. Int. J. Electr. Power Energy Syst. 2016, 82, 92–104. [Google Scholar] [CrossRef]
- Tseng, F.M.; Tzeng, G.H.; Yu, H.C.; Yuan, B.J. Fuzzy ARIMA model for forecasting the foreign exchange market. Fuzzy Sets Syst. 2001, 11, 9–19. [Google Scholar] [CrossRef]
- Zhang, G.P. Time series forecasting using a hybrid ARIMA and neural network model. Neurocomputing 2003, 1, 159–175. [Google Scholar] [CrossRef]
- Ma, T.; Antoniou, C.; Toledo, T. Hybrid machine learning algorithm and statistical time series model for network-wide traffic forecast. Transp. Res Part C Emerg. Technol. 2020, 111, 352–372. [Google Scholar] [CrossRef]
- Alsharif, M.H.; Younes, M.K.; Kim, J. Time series ARIMA model for prediction of daily and monthly average global solar radiation: The case study of Seoul, South Korea. Symmetry 2019, 11, 240. [Google Scholar] [CrossRef]
- Onoh, J.O.; Eze, G.P. Stock Market Performance of Firms in the Nigerian Petroleum Sector Using the ARIMA Model Approach. World J. Finance Investm. Res. 2019, 4, 1–9. [Google Scholar]
- Yang, J.; Ning, C.; Deb, C.; Zhang, F.; Cheong, D.; Lee, S.E.; Sekhar, C.; Tham, K.W. k-Shape clustering algorithm for building energy usage patterns analysis and forecasting model accuracy improvement. Energy Build. 2017, 1, 27–37. [Google Scholar] [CrossRef]
- Shahzadeh, A.; Khosravi, A.; Nahavandi, S. Improving load forecast accuracy by clustering consumers using smart meter data. In Proceedings of the 2015 International Joint Conference on Neural Networks (IJCNN), Killarney, Ireland, 12–16 July 2015; pp. 1–7. [Google Scholar]
- Paparrizos, J.; Gravano, L. k-shape: Efficient and accurate clustering of time series. In Proceedings of the 2015 ACM SIGMOD International Conference on Management of Data, Melbourne, VC, Australia, 31 May–4 June 2015; pp. 1855–1870. [Google Scholar]
- Wang, H.; Huang, J.; Zhou, H.; Zhao, L.; Yuan, Y. An Integrated Variational Mode Decomposition and ARIMA Model to Forecast Air Temperature. Sustainability 2019, 11, 4018. [Google Scholar] [CrossRef]
- Burnham, K.P.; Anderson, D.R. Multimodel inference: Understanding AIC and BIC in model selection. Soc. Methods Res. 2004, 33, 261–304. [Google Scholar] [CrossRef]
© 2020 by the authors. Licensee MDPI, Basel, Switzerland. This article is an open access article distributed under the terms and conditions of the Creative Commons Attribution (CC BY) license (http://creativecommons.org/licenses/by/4.0/).