1. Introduction
The Lake Tahoe basin is located along the California and Nevada border at the western extreme of the Great Basin between the Carson and Sierra Nevada mountain ranges. Parent materials are of both granitic and volcanic origin [
1]. The Basin itself represents a complex ecosystem and consists of 64 individual sub-watersheds with 63 tributaries that discharge directly to the lake [
2]. Drainage area is approximately 812 km
2, of which private to public ownership is approximately 1:10. Average annual precipitation across the Basin is about 81 cm yr
−1 (Tahoe Integrated Information Management Systems
http:/www.tiims.org/Content/BasinTopics/meteorology/default.asp), and occurs principally as winter snow and summer rainfall from often intense thunderstorms.
Within the Tahoe basin lies Lake Tahoe (1898 m elevation), a natural resource recognized nationally and internationally for its beauty and ecological significance. However, like many of the world’s undeveloped environments, Lake Tahoe also has been affected by cultural eutrophication. Once classified as ultra-oligotrophic [
3], its trophic level has been reported to be slowly progressing towards meso-oligotrophic status [
4]. The concomitant long-term trend toward decreased water clarity (~0.25 to 0.33 m yr
−1) is now well documented in the literature, and has been linked to increased loadings of nitrogen (N), phosphorus (P), and fine sediments [
5,
6,
7,
8,
9,
10]. Aquatic biomass production data now suggest a progressive shift from N and P co-limitation to that of a predominantly P-limited system.
The specific sources of nutrient and sediment loading to Lake Tahoe, although varied, are generally related to anthropogenic enhanced atmospheric deposition, overland flow surface runoff, and/or subsurface transport and discharge. If we are to arrest continued deterioration of the lake’s famed water clarity, it is imperative that in addition to the current emphasis on urban sources of water pollution we also strive to better understand the interdependence among watershed nutrient cycling, groundwater and streamflow, overland flow surface runoff, precipitation (type, intensity, duration), atmospheric deposition, wildfire and anthropogenic manipulations such as biomass management [
11,
12,
13,
14,
15,
16,
17,
18,
19,
20,
21,
22].
The purpose of this synthesis paper is to focus on historic and current biomass conditions in the watersheds of the Lake Tahoe basin relative to their potential impacts on nutrient (N and P) related discharge water quality. In so doing, our objectives are to address: (1) a reconstruction (model estimated) of historic litter and nutrient pools compared to current conditions; (2) the effects of wildfire; (3) the effects of mechanical harvest and controlled burns; and (4) the corresponding biomass management implications.
2. Historic and Current Setting
Prior to the 20th century, wildfire was a natural part of Sierran ecosystems, with an estimated mean fire return interval ranging from 10–25 years [
23,
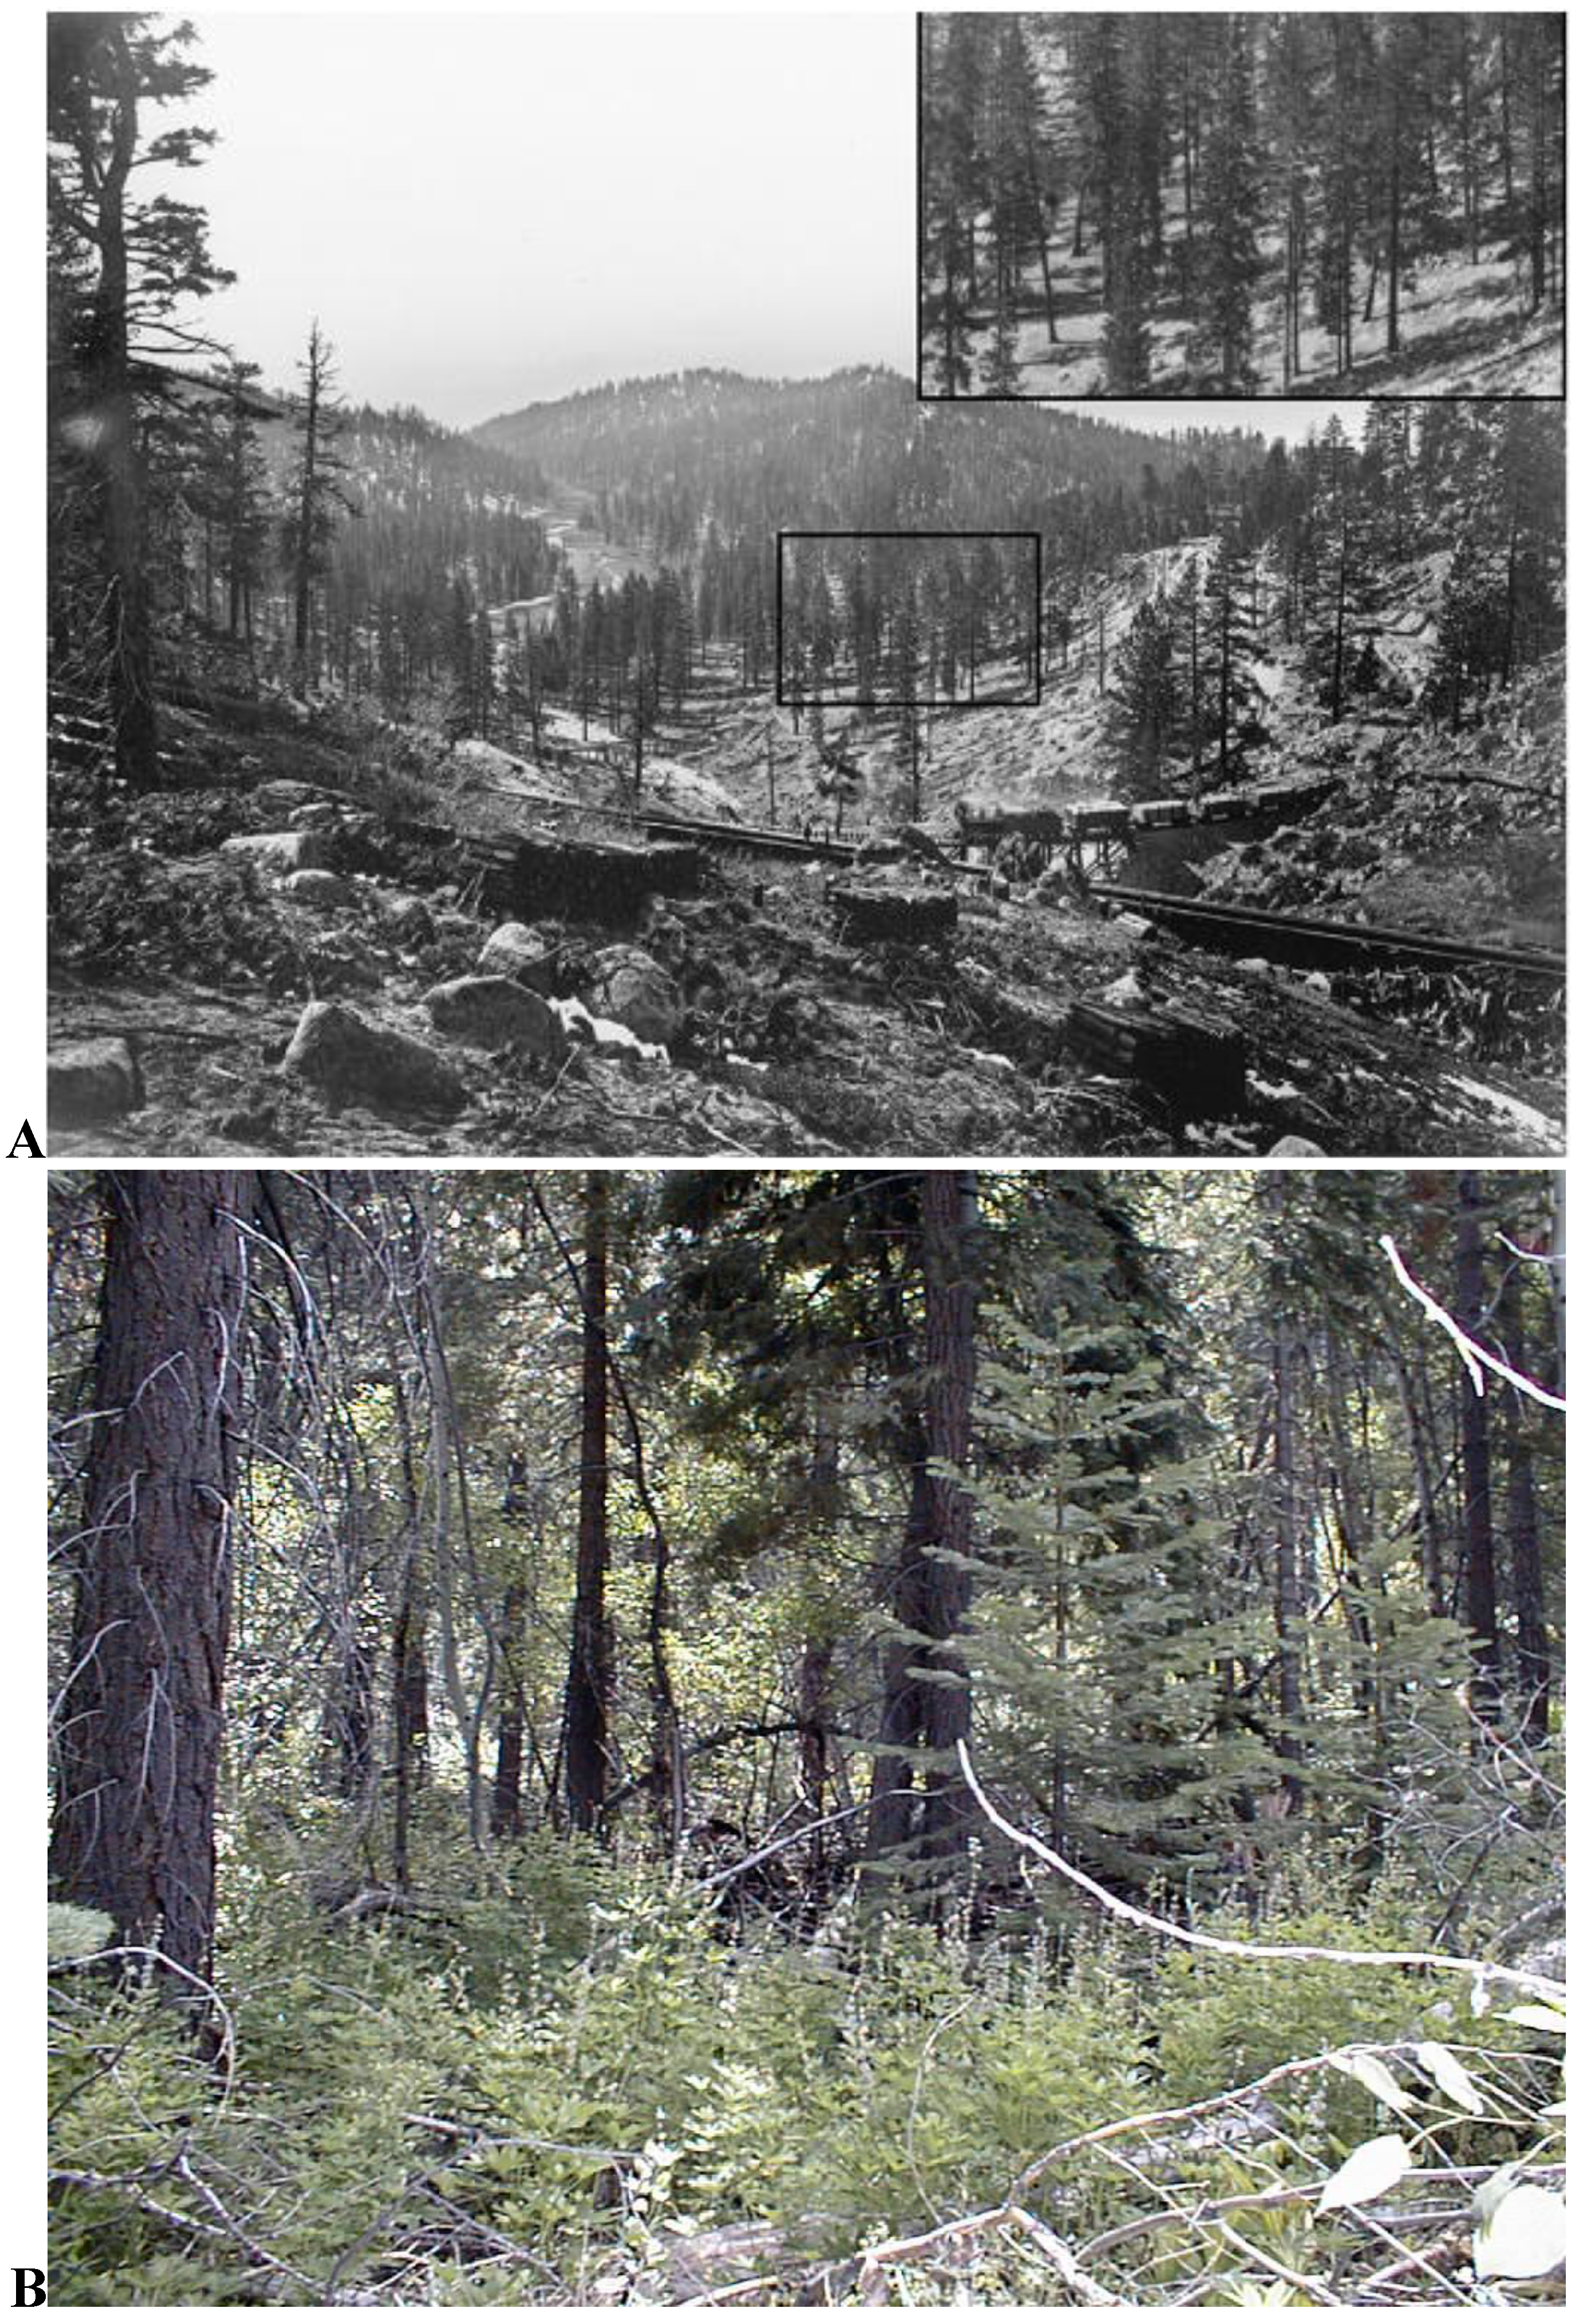
24] in lower-elevation Jeffrey pine and mixed conifer forests. When compared to contemporary conditions, these pre-settlement forests were less dense, structurally more diverse, and consisted of larger trees with less ladder fuels, sparse understory, and much reduced dead and decaying downed timber (
Figure 1) [
24,
25,
26].
Figure 1.
(A) Historic forest conditions depicting open tree stands with sparse understory (reprinted from [
24]; (B) Current conditions of closed canopy and heavy understory.
Figure 1.
(A) Historic forest conditions depicting open tree stands with sparse understory (reprinted from [
24]; (B) Current conditions of closed canopy and heavy understory.
Numerous anthropogenic activities have impacted Sierra Nevada watersheds over the last century and a half, causing significant alterations in ecosystem structure and composition. Clear-cut logging, livestock grazing, settlement, residential and commercial development, recreation, and fire suppression have induced changes in cover and age structure, including the loss of primary forest. Franklin and Fites-Kaufman [
27] report that forest areas of old growth characteristics now occupy less than 16% of their previous range. Other studies place the number at less than 5% over the Sierra Nevada as a whole [
23,
28].
Forest vegetation in the Lake Tahoe Basin now consists of Jeffrey pine (Pinus jeffreyi Grev. and Balf.), white fir (Abies concolor var. lowiana [Gord.] Lemm.), California red fir (Abies magnifica A. Murr.), ponderosa pine (Pinus ponderosa Dougl. ex Laws.), quaking aspen (Populus tremuloides Michx.), and substantially lesser amounts of sugar pine (Pinus lambertiana Dougl.), lodgepole pine (Pinus contorta var. murrayana Dougl. ex Loud.), and incense-cedar (Calocedrus decurrens Torr.). Understory vegetation varies dramatically across the basin, but typically consists of Sierra chinquapin (Castanopsis sempervirens [Kell.] Dudl.), currant (Ribes spp.), squaw carpet (Ceanothus prostratus Benth.), whitethorn (Ceanothus cordulatus Kell.), pine mat and green leaf manzanita (Arctostaphylos nevadensis Gray. and Arctostaphylos patula Greene), tobacco brush (Ceanothus velutinus Dougl. ex Hook.), creeping snowberry (Symphoricarpos mollis Nutt.) and bitterbrush (Purshia tridentata [Pursh.] DC).
Perhaps the greatest historic human impact on forest structure has been clear-cut logging associated with the Comstock Era coupled with subsequent restricted harvesting and fire suppression strategies implemented in the early 20th century. As a result, there has been a gradual shift away from pine towards a fir dominated forest. Pre-settlement forest reconstructions suggest a nearly equal ratio of white fir to Jeffrey pine at moderate elevations throughout the basin, with a corresponding tree density of 296 to 395 per hectare [
29]. Conversely, lower elevation forests have quadrupled in tree density, and are now typified by 50% less Jeffrey pine and a corresponding two- to three-fold increase in white fir and incense cedar [
29]. Although current mixed conifer forests exhibit little change in species composition from historical representation, stand densities have doubled, with corresponding increases in disease, insect infestations, parasitism, tree mortality, and downed timber [
30,
31,
32,
33,
34].
Incidental to the decline in general forest health, Sierra Nevada forests have now accumulated a very thick organic (O) horizon, and no longer exhibit the low contents (kg ha
−1) of N and P in the soil and plant biomass that are typical of pine-dominated forest ecosystems characterized by low-severity fire regimes [
35,
36,
37]. Current conditions tend to sequester nutrients into the organic biomass, both living and dead, leading to the buildup of large nutrient pools of N and P in the vegetation and forest floor. At the same time large forest floor N and P pools may also contribute to increases in inorganic N and P pools in the summer dry O horizon [
38,
39,
40,
41]. Accumulating water soluble nutrients may leach into the soil or discharge from the area of by way of overland flow surface runoff and/or litter interflow [
21,
37]. Hence, the buildup of fuels in the understory has not only increased the potential for stand replacing wildfires, but has also resulted in the accumulation of much thicker, nutrient-rich organic residues. This excess accumulation of organic residues has apparently shifted the equilibrium such that the annual amount of internal nutrient cycling has increased, causing the organic mass to release more available nutrients into runoff and percolating solutions [
21,
37]. Although it is uncertain as to whether or not this nutrient laden runoff makes it into tributary water flow, the potential clearly exists [
21].
3. Model Estimated Historic Nutrient Pools and Comparison to Current Conditions
Although historic conditions of vegetation structure are increasingly used to guide forest management planning for the Tahoe basin, the models applied generally do not include nutrient dynamics in the context of a historic reference condition because no data are available. Thus, reference conditions for nutrient cycling have been difficult to derive from forest simulation models. To address this information gap, we have estimated historical forest floor N and P contents using the LANDIS-II model, a spatially explicit and stochastic simulation model of landscape dynamics [
42] that incorporates a novel nutrient cycling module. The LANDIS-II model applies key ecosystem processes, including succession, productivity, harvesting, fire, and other disturbances, on a raster map over large spatial and temporal scales. Succession occurs along different trajectories in accordance with disturbance events, seed availability, species’ life history traits, and site conditions. LANDIS-II and the biomass and harvest modules are described in detail elsewhere [
42,
43,
44,
45].
The nutrient cycling module tracks biogeochemical processes for carbon, nitrogen, and phosphorus in response to species composition, productivity, climate, and fire and provides a feedback to species composition and productivity through N fixation, N and P uptake, and effects of N availability on establishment. Nutrient pools include living and dead biomass, organic and mineral soils, and charcoal as well as N and P deposition and N leachate. The model adds mass and nutrients to the forest floor through litterfall and mortality, and removes mass through decomposition and fire-induced combustion and mineralization. Fire can also indirectly affect forest floor mass and nutrient contents through changes in species composition and biomass.
Our approach was to characterize the Lake Tahoe basin as a grid of 80,844 1-ha sites that were classified as one of 11 potential natural vegetation (PNV) types based on reconstructions of historic vegetation composition, existing vegetation, and species-specific habitat modeling [
50]. These PNV types are assumed to have homogenous soil characteristics, topography, and climate and are associated with soil conditions (initial soil nutrient contents, soil organic matter decomposition rates, rock weathering rates, and annual actual evapotranspiration, which affects litter decomposition rates), species establishment and productivity (probabilities of establishment, maximum biomass, and maximum annual primary productivity for each species), and fire regimes (fire rotation, size distribution, and severity). Soil conditions were parameterized from Natural Resource Conservation Service datasets and literature for Lake Tahoe and the surrounding area, species establishments were parameterized using the LINKAGES gap model [
46] and productivities using PnET-II [
47] after Scheller and Mladenoff [
48], and fire regimes were parameterized from the biophysical settings developed for LANDFIRE [
49]. We evaluated modeled fine litter and soil C, N, and P contents and concentrations for chaparral- and Jeffrey pine-dominated sites by direct comparison with field samples collected in 2006. ANOVA with vegetation type and data source found no significant differences between modeled and measured values (p > 0.05). Although we modeled the entire Lake Tahoe Basin, only the results for Jeffrey pine, mixed conifer, and chaparral PNVs are presented here to characterize potential discharge water quality because they include 61.6% of land in the basin and exhibited substantial variability in response to fire and harvest.
In order to project historic forest floor nutrient loads, we simulated historical fire regimes for the entire basin (
Table 1) for 1,500 years to allow the model to calibrate, and used the last 500 years of model results for our assessment. We then simulated the historical Comstock clear-cut that focused on lower elevation forests and pine species and simultaneously initiated 130 years of fire exclusion from the landscape to characterize the effects of fire suppression to the present. Using our simulation results, we then randomly sampled litter N and P contents from 100 sites in each PNV type, and performed repeated measures ANOVA in S-Plus 7.0 (Insightful Corp) to determine the significance of the direct effects of fire suppression and the interaction between fire suppression and PNV type. We used site as a random effect, PNV type as a fixed effect between subjects, and fire regime (historical fire or fire suppression) as a fixed effect within each subject.
Table 1.
Historical fire regimes as parameterized to approximate historic fire rotation and severities reported in the literature [
24,
75,
76].
Table 1.
Historical fire regimes as parameterized to approximate historic fire rotation and severities reported in the literature [24,75,76].
| PNV | Max Size | Mean Size | Min. Size | Ignition Probability | Fire Rotation | Ave. Fire Severity |
|---|
| | ---------ha------- | --yr-- | |
|---|
| Jeffrey pine | 10,000 | 180 | 1 | 0.0075 | 10 | Low |
| Mixed conifer | 8,000 | 180 | 1 | 0.0142 | 15 | Low-mixed |
| Chaparral | 800 | 60 | 1 | 0.002 | 49 | High |
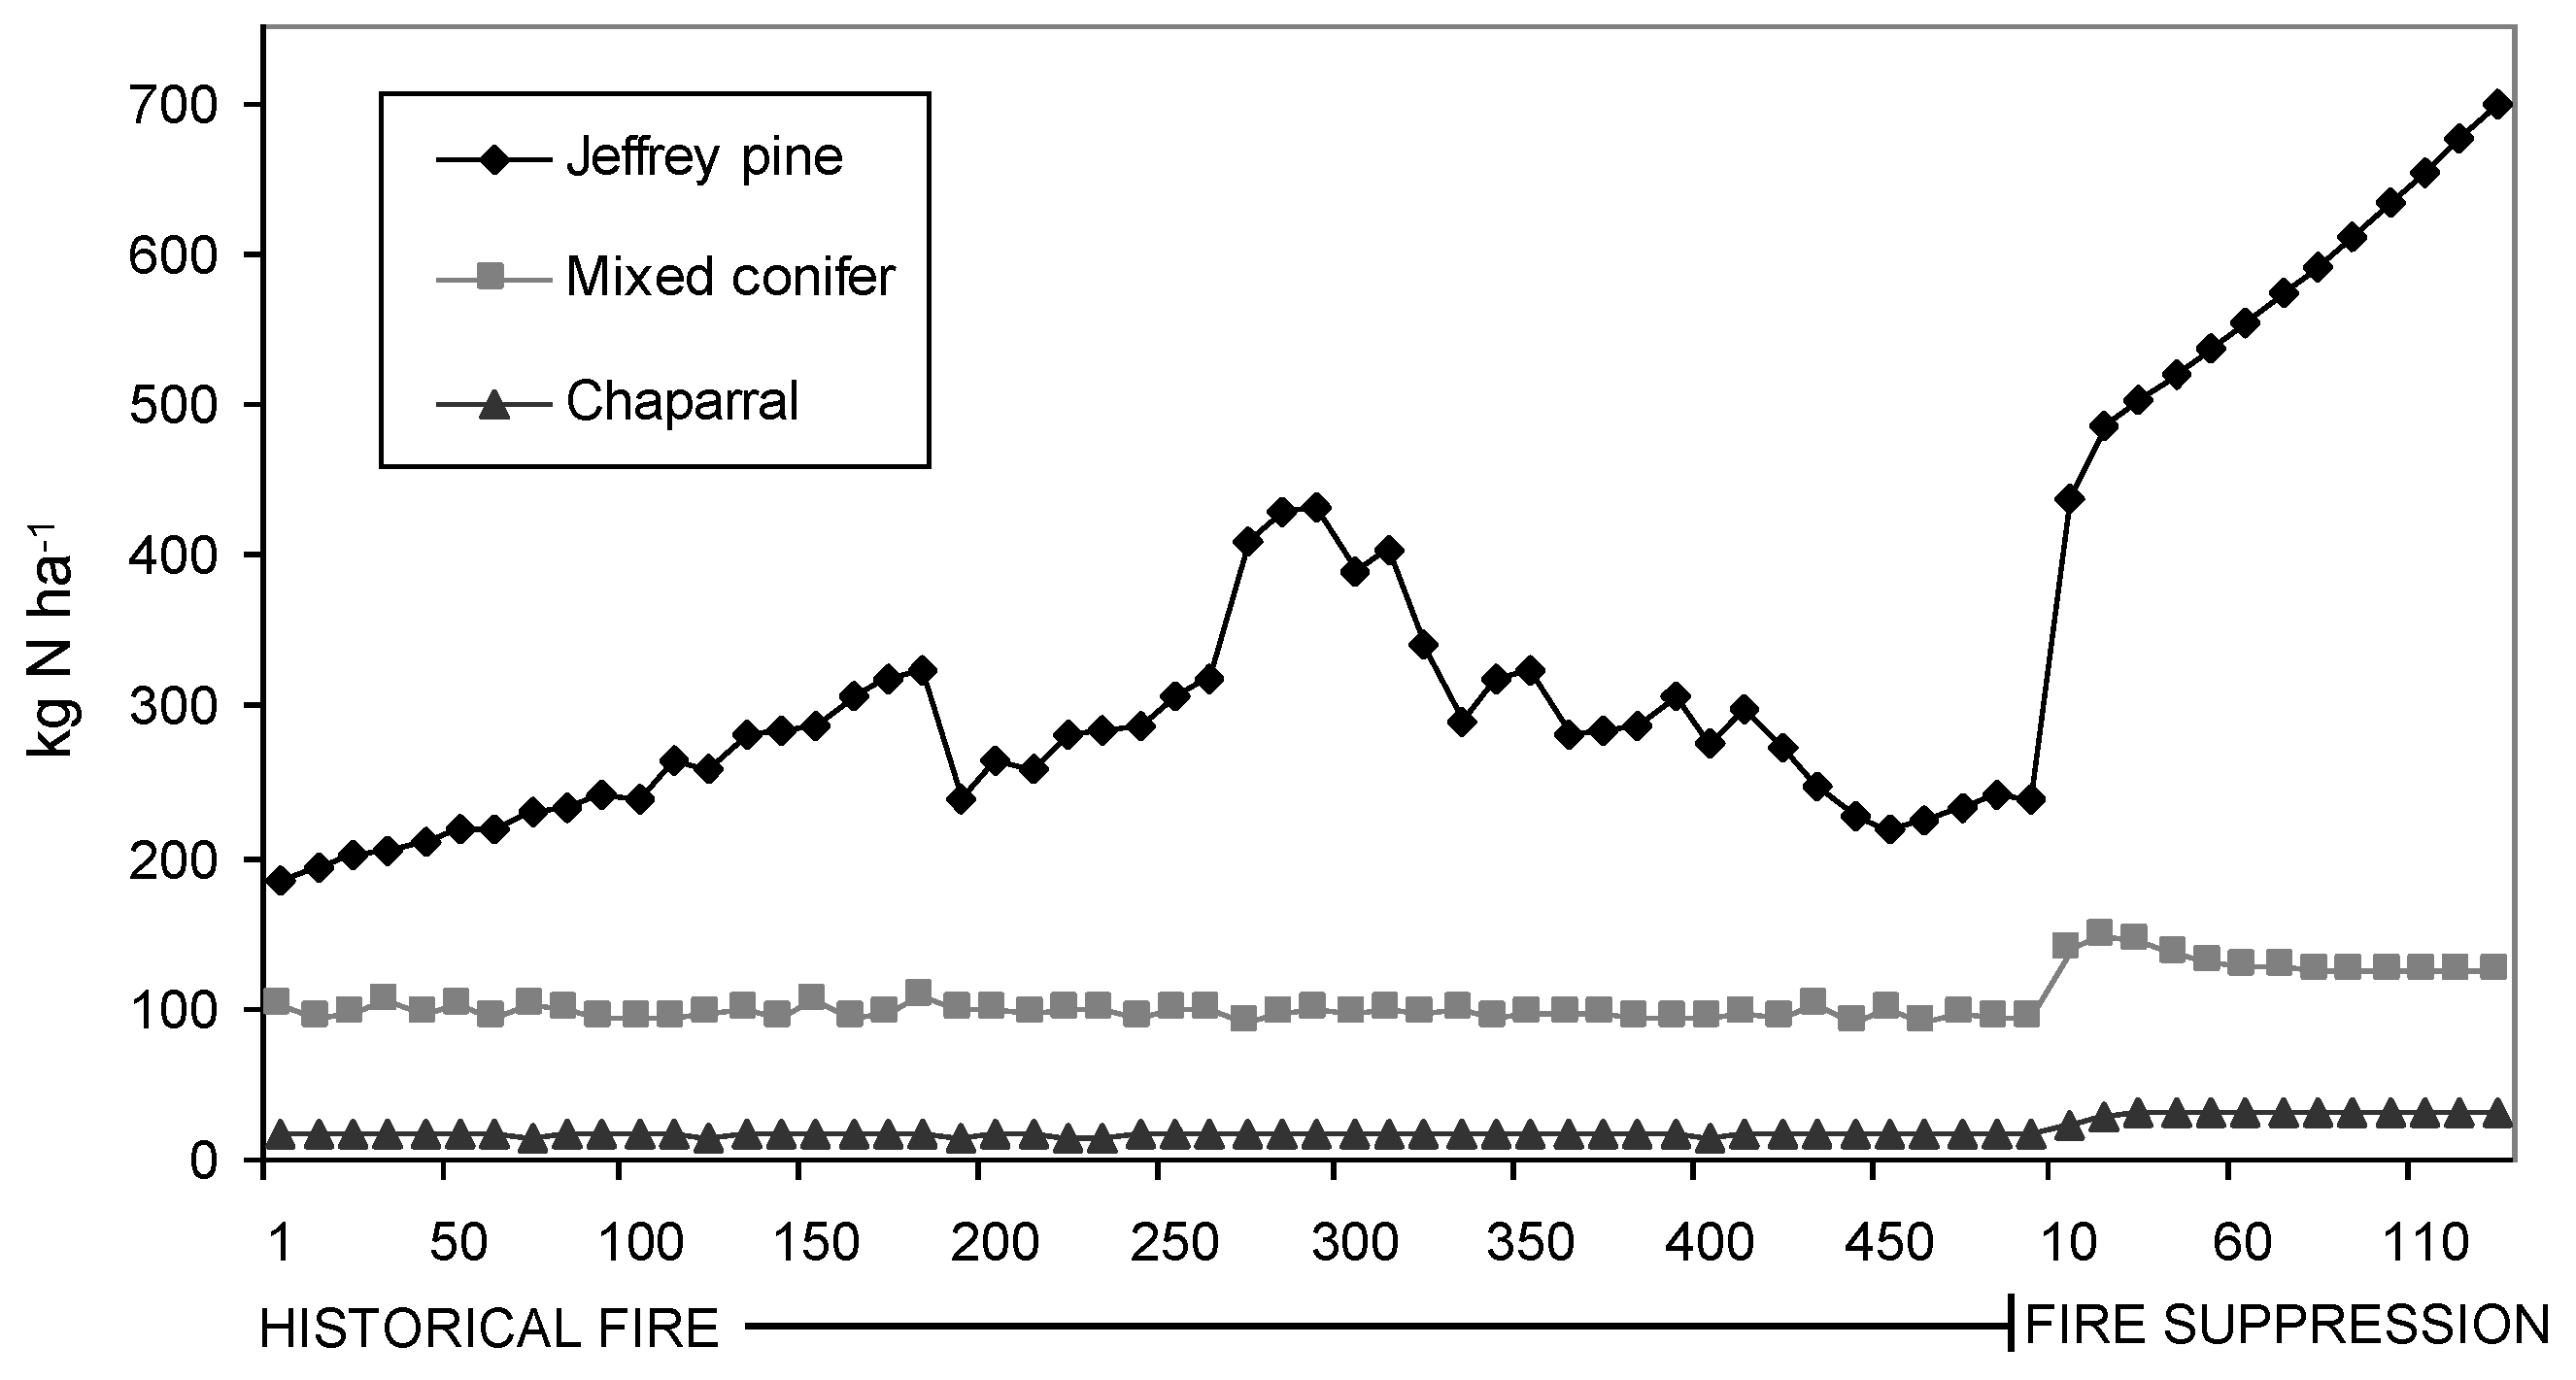
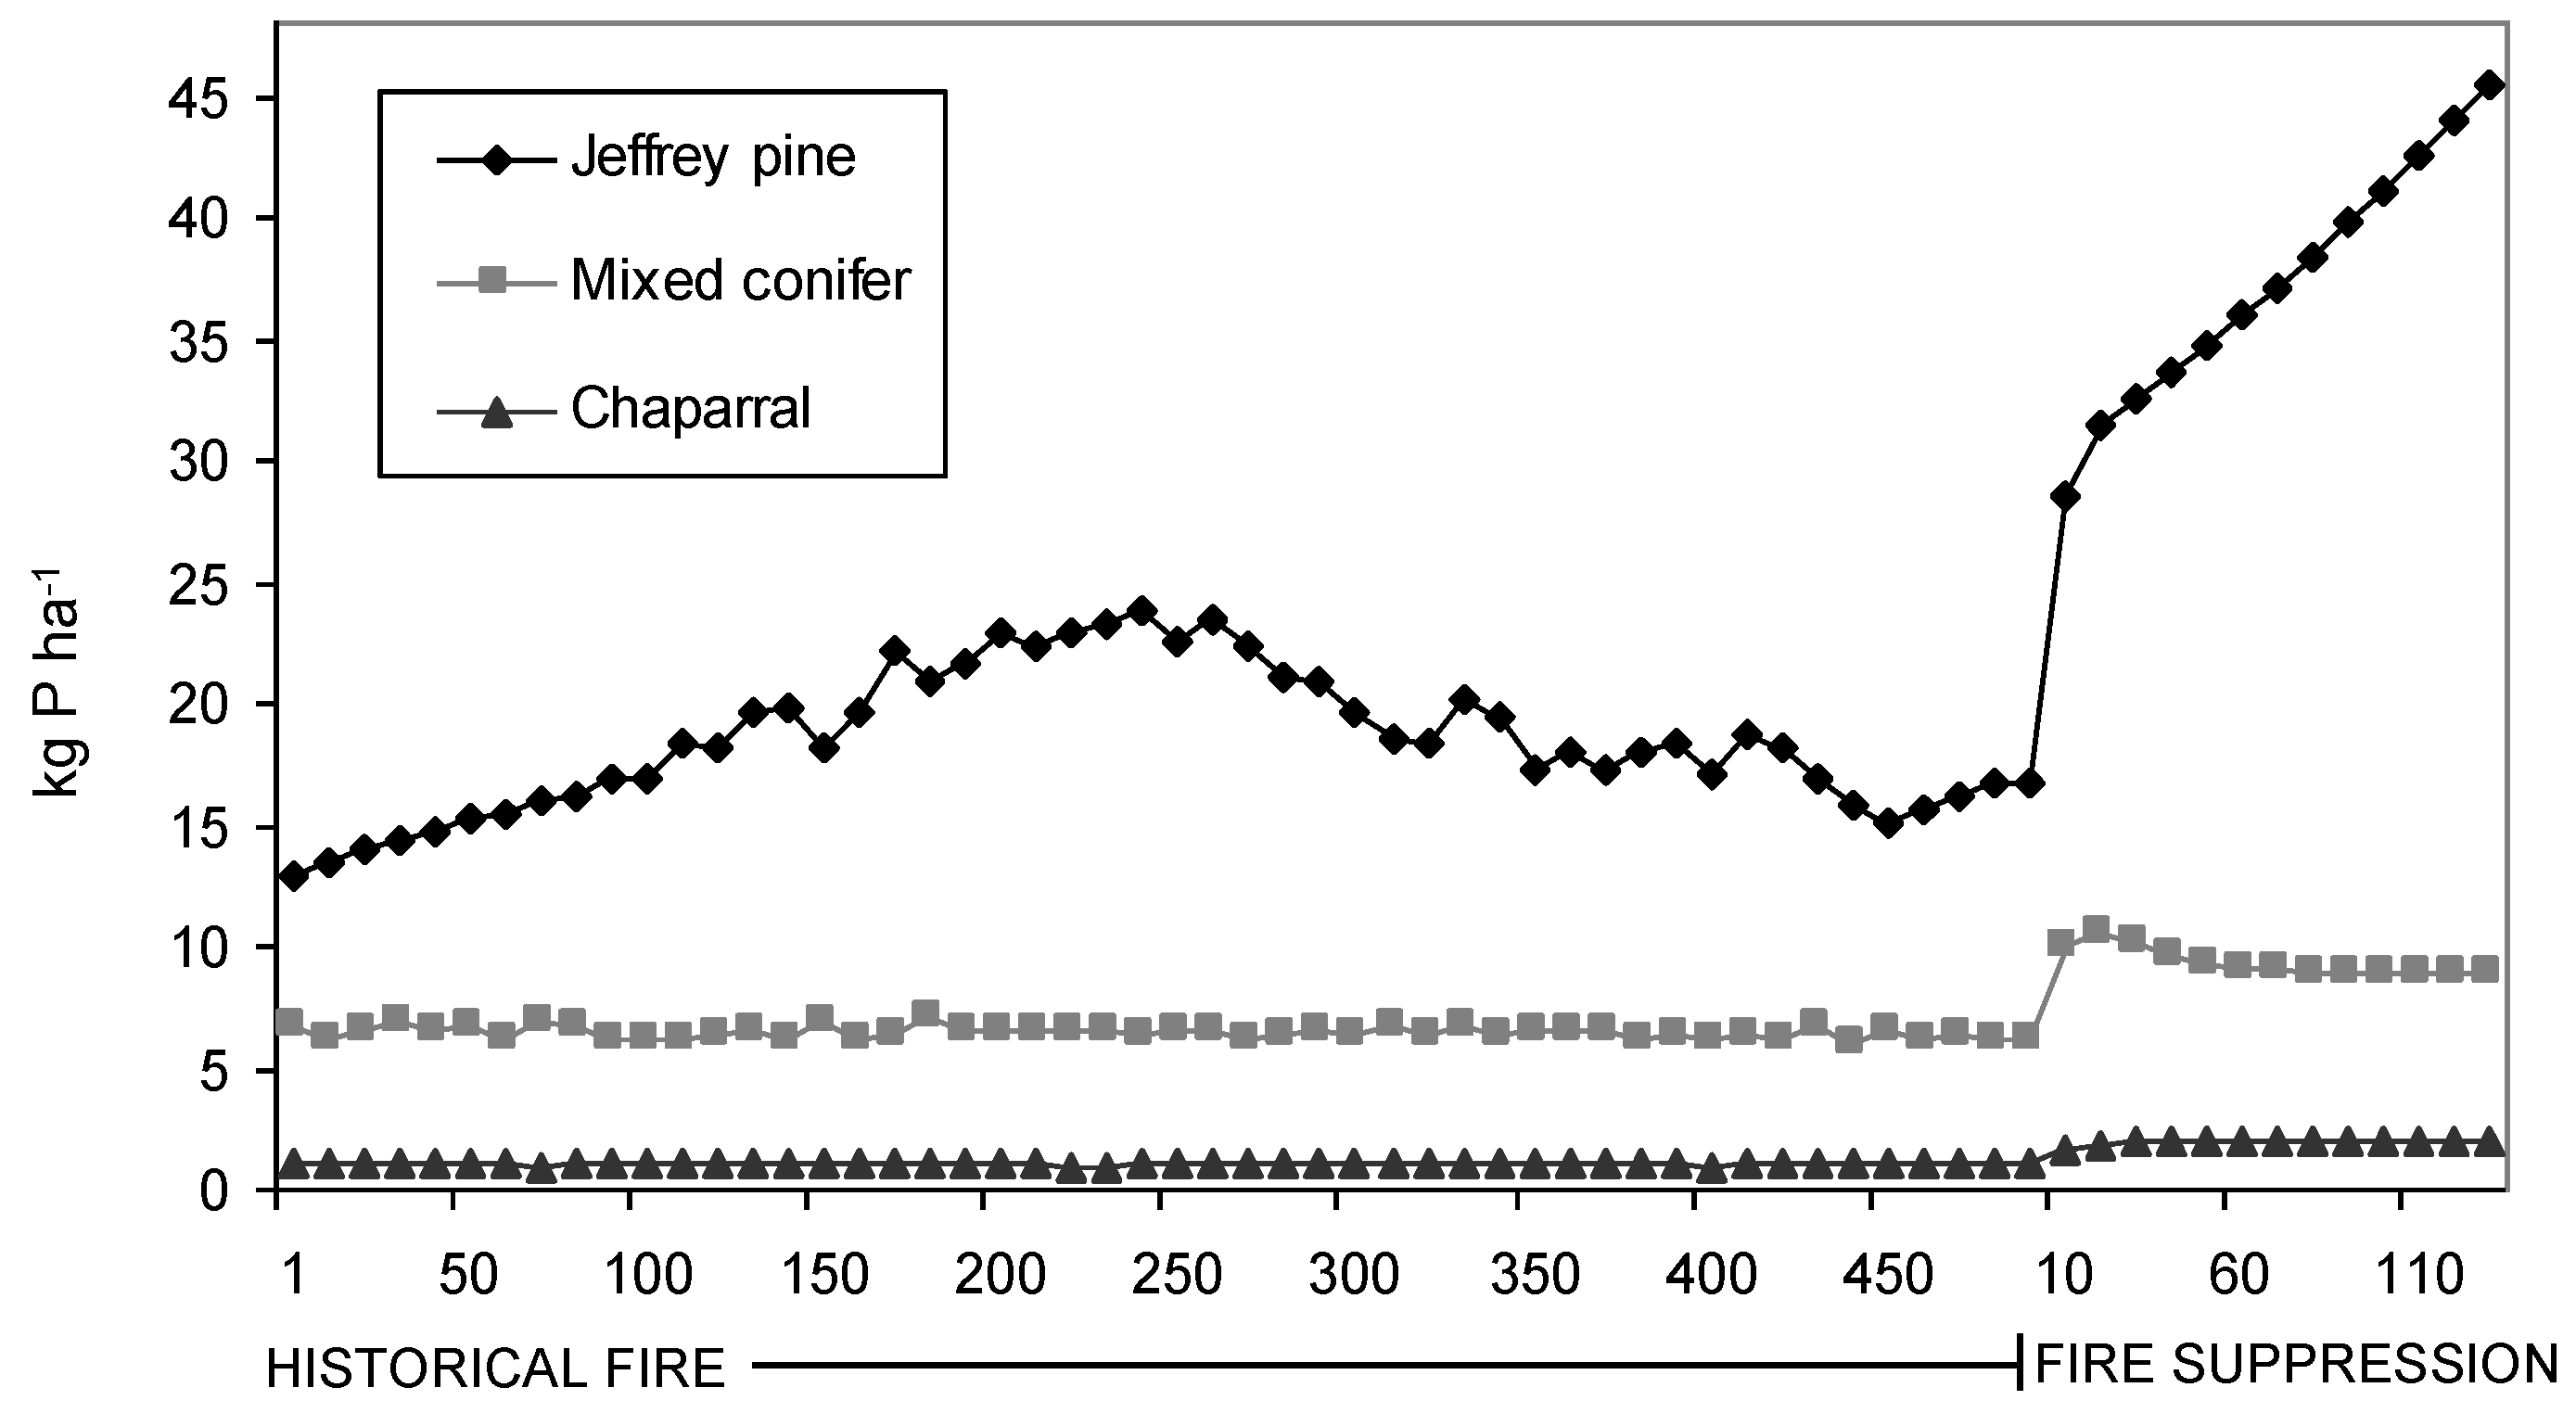
Simulated litter N and P contents were found to be significantly (p < 0.001) different between PNV types and under the two fire regimes after controlling for the effect of site (
Table 2). Modeled litter N increased from 272.96 ± 2.11 kg N ha
−1 (Mean ± SE) to 564.41 ± 11.04 kg N ha
−1 for Jeffrey pine, 102.09 ± 5.83 kg N ha
−1 to 145.60 ± 8.42 kg N ha
−1 for mixed conifer, and 10.01 ± 0.66 kg N ha
−1 to 28.79 ± 0.33 kg N ha
−1 for chaparral. Likewise, modeled litter P increased from 18.94 ± 0.46 kg N ha
−1 (Mean ± SE) to 44.73 ± 1.03 kg N ha
−1 for Jeffrey pine, 6.23 ± 0.39 kg N ha
−1 to 8.96 ± 0.581 kg N ha
−1 for mixed conifer, and 0.97 ± 0.14 kg N ha
−1 to 1.69 ± 0.13 kg N ha
−1 for chaparral. The significant interaction of PNV type and fire regime indicates that the PNV groups had dissimilar responses to the change in fire regime (
Figure 2 and
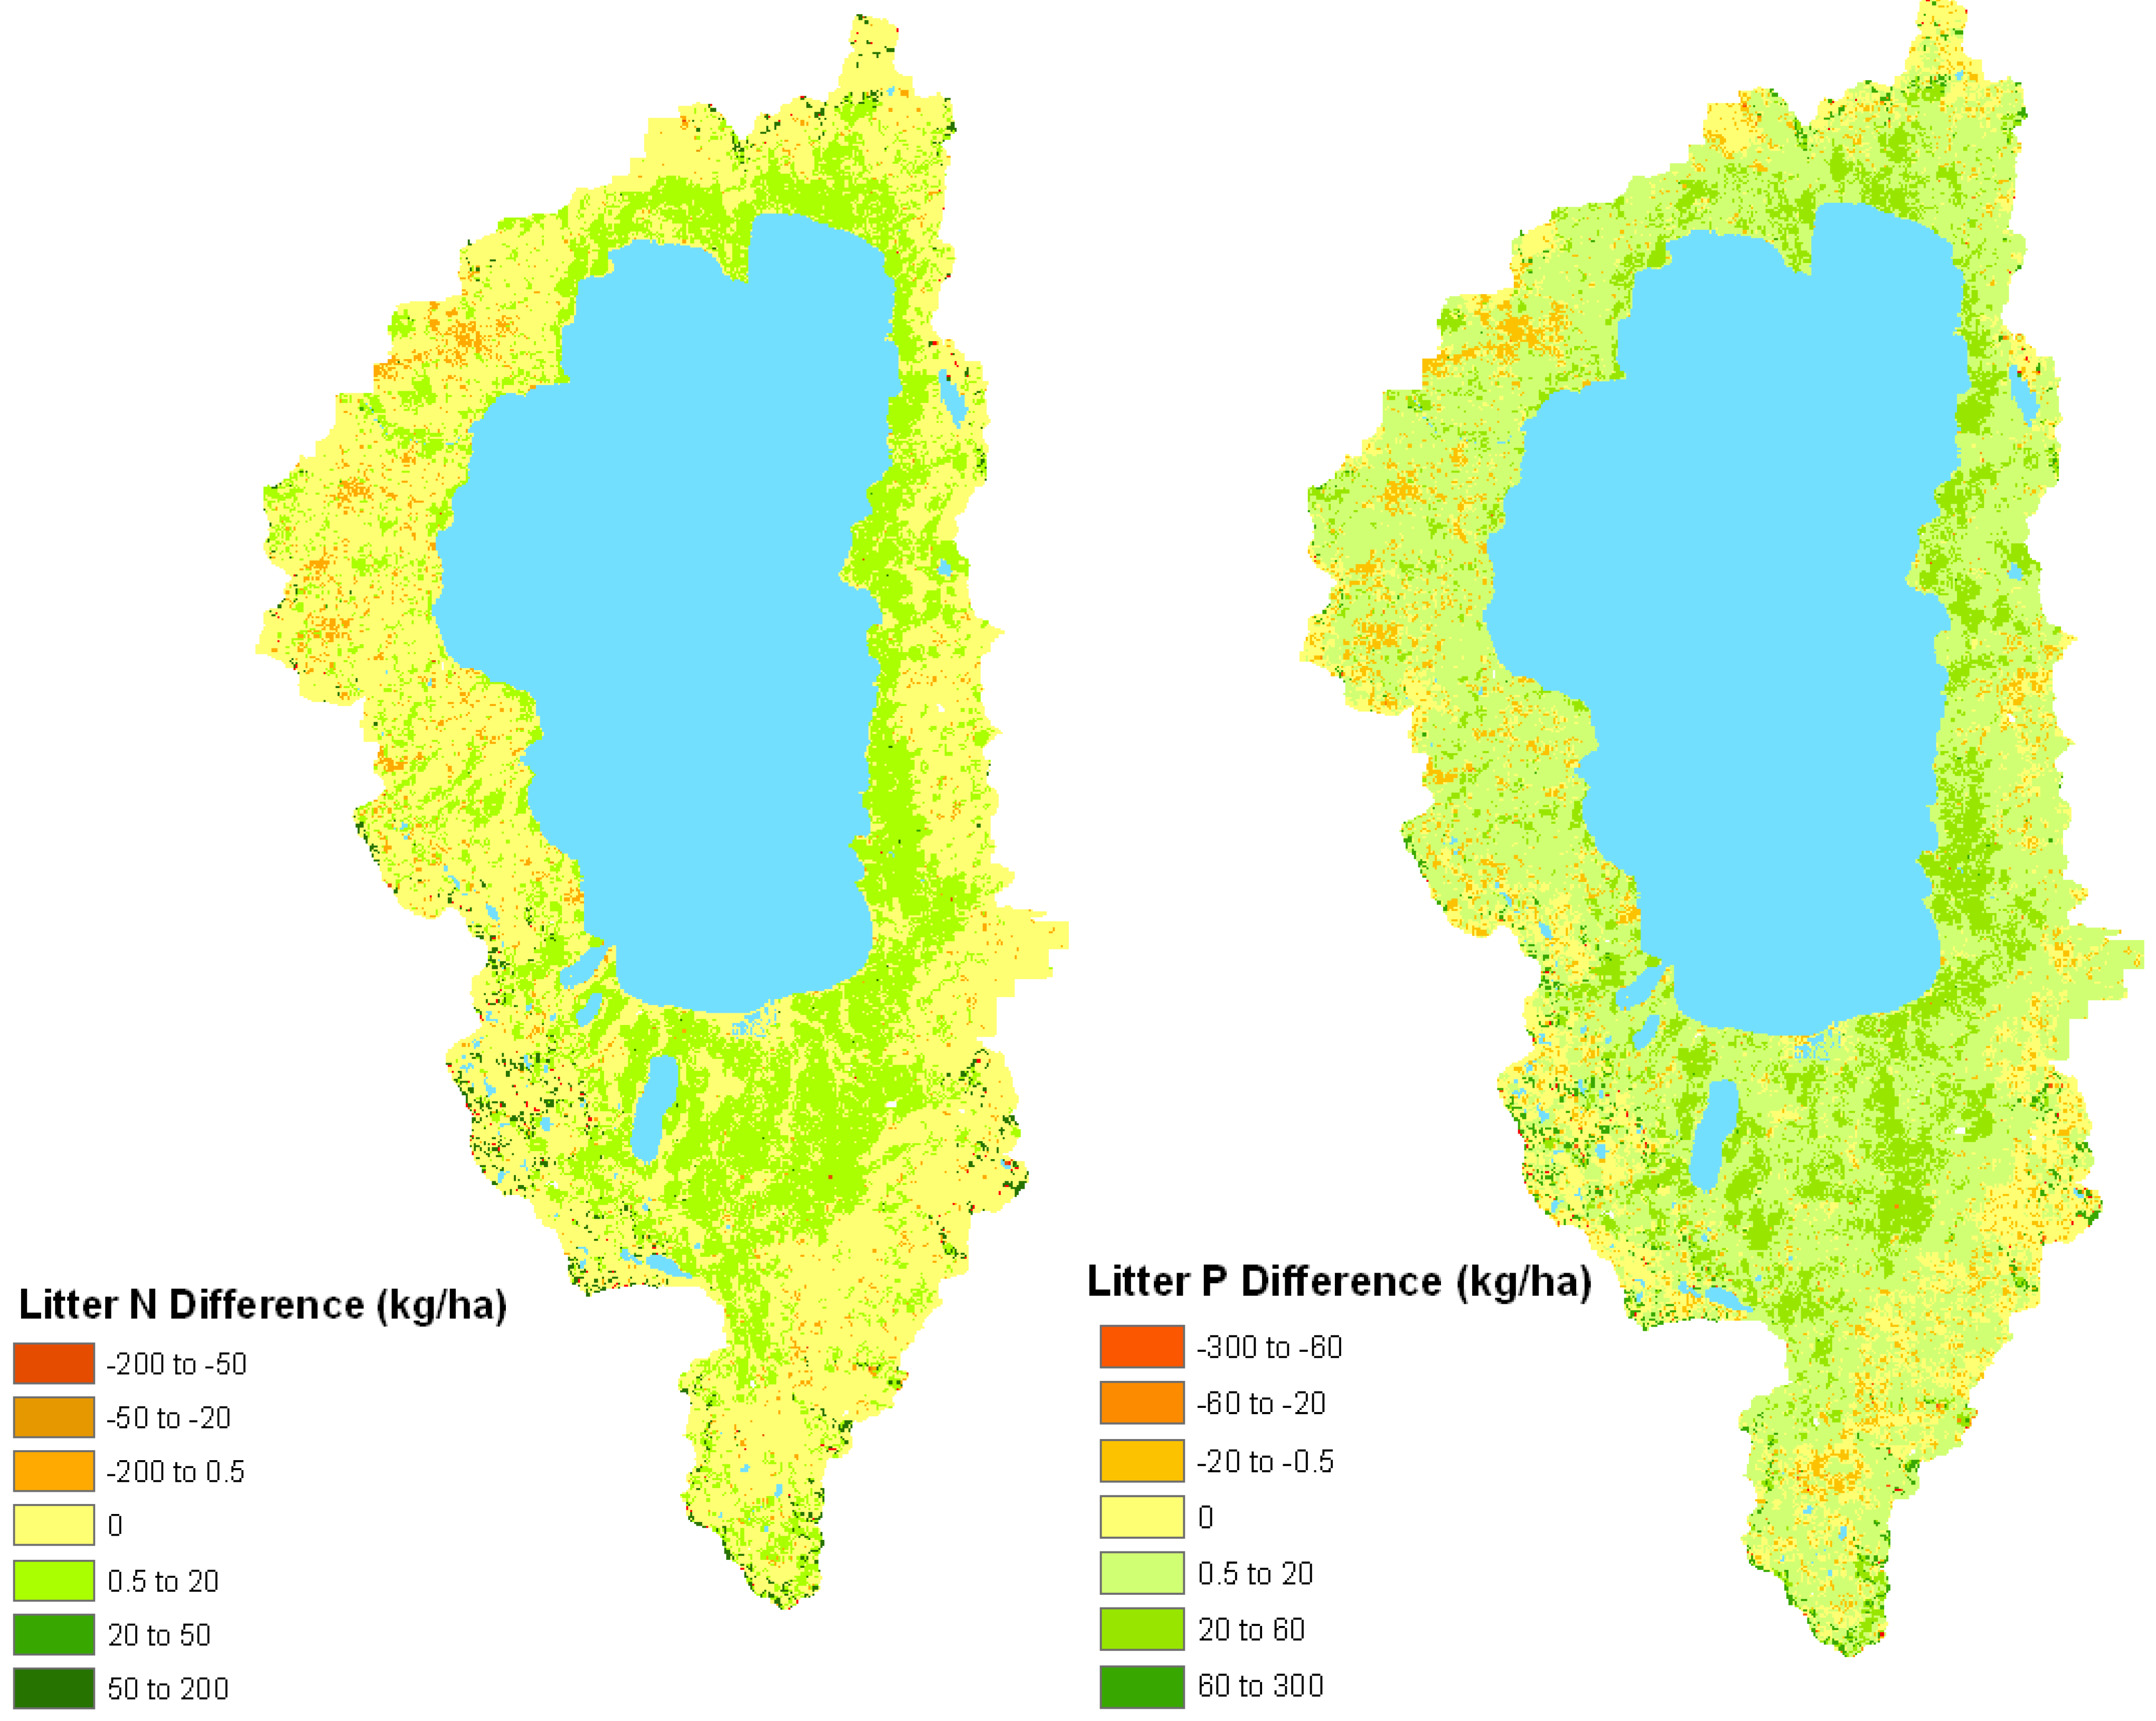
Figure 3), likely due to relative deviations from their historical fire rotation intervals. The simulated overall change (kg ha
−1) in litter total N and total P between the historical fire regime and under conditions of fire suppression is illustrated in
Figure 4.
Table 2.
Simulated litter N and P (means ± SE) for each potential natural vegetation type under conditions of historical fire regime and fire suppression.
Table 2.
Simulated litter N and P (means ± SE) for each potential natural vegetation type under conditions of historical fire regime and fire suppression.
| | | Litter N | % | Litter P | % |
|---|
| | | kg ha−1 | Incr. | kg ha−1 | Incr. |
|---|
| Jeffrey pine | Historical Fire | 272.96 ± 6.83 | 106.8 | 18.95 ± 0.46 | 135.51 |
| Fire Suppression | 564.41 ± 11.04 | 44.54 ± 1.04 |
| Mixed conifer | Historical Fire | 102.09 ± 5.83 | 42.6 | 6.23 ± 0.39 | 43.9 |
| Fire Suppression | 145.60 ± 8.42 | 8.96 ± 0.58 |
| Chaparral | Historical Fire | 10.01 ± 0.66 | 187.6 | 0.97 ± 0.14 | 74.9 |
| Fire Suppression | 28.79 ± 0.49 | 1.69 ± 0.13 |
Figure 2.
Average modeled litter N contents for each PNV type for 500 years of historical fire and 130 years of fire suppression.
Figure 2.
Average modeled litter N contents for each PNV type for 500 years of historical fire and 130 years of fire suppression.
Figure 3.
Average modeled litter P contents for each PNV type for 500 years of historical fire and 130 years of fire suppression.
Figure 3.
Average modeled litter P contents for each PNV type for 500 years of historical fire and 130 years of fire suppression.
Figure 4.
Model-estimated change (kg ha−1) in litter total N (left) and total P (right) between the historical fire regime and under conditions of fire suppression in the Lake Tahoe Basin.
Figure 4.
Model-estimated change (kg ha−1) in litter total N (left) and total P (right) between the historical fire regime and under conditions of fire suppression in the Lake Tahoe Basin.
Similar to forest composition and structure, modeled estimates indicate litter nutrient contents also have changed significantly in response to fire suppression. Because litter decomposition is slow in these forests, fire likely was a significant source of nutrient losses in comparison to decomposition and leaching [
51,
52]. Although litter N and P both responded significantly to the presence or absence of fire, the difference in magnitude of their response is apparently mediated by the vegetation and fire regime for each PNV type. For example, variance partitioning of model litter N showed that fire explained 23% of the variance for Jeffrey pine, 21% for mixed conifer, and 14% for chaparral. These data suggest that under a pre-logging fire regime, the kind and amount of nutrient (N and P) pools associated with the surface biomass in Tahoe basin forests were much more limited compared to their present day counterparts, and that the equilibrium has indeed shifted towards a more nutrient-rich upper watershed ecosystem [
21,
37]. As such, it makes sense to infer that historical discharge water quality from watersheds in the Tahoe basin was comparatively more nutrient depleted, helping to facilitate the ultra-oligotrophic status of Lake Tahoe under pre-settlement, pre-logging, and pre-fire suppression conditions.
This premise is supported by the recent research of Miller
et al. [
21] who detected nutrient rich overland/litter interflow runoff taking place at the interface between heavy surface accumulations of O-horizon materials and the underlying mineral soil surface. Although measured peak concentrations for NH
4-N, NO
3-N, and PO
4-P in the runoff were much higher (87.2 mg N L
−1, 95.4 mg N L
−1, and 24.4 mg P L
−1, respectively), mean concentrations over the collection period were consistently greater than those previously reported in any natural discharge waters from Tahoe Basin watershed ecosystems (
Table 3). Their data indicate that the nutrient ions present in the overland/litter interflow runoff must be derived from the now well-developed surface organic layers in fire-suppressed forests.
Table 3.
Mean cumulative overland/litter interflow runoff 1 and concentrations of inorganic N and P from Dec 2001 through Jul 2003 from study plots near Truckee, CA and South Shore Lake Tahoe, NV.
Table 3.
Mean cumulative overland/litter interflow runoff 1 and concentrations of inorganic N and P from Dec 2001 through Jul 2003 from study plots near Truckee, CA and South Shore Lake Tahoe, NV.
| | Mean Runoff | Nutrient Parameter |
|---|
| | NH4-N | NO3-N | PO4-P |
|---|
| | L | ---------------- mg L−1 --------------- |
|---|
| Truckee, CA |
| Mean | 24.99 | 6.98 | 3.72 | 0.75 |
| Standard Deviation | 16.86 | 9.7 | 2.53 | 1.01 |
| South Shore, NV |
| Mean | 43.52 | 1.51 | 1.39 | 0.34 |
| Standard Deviation | 22.93 | 2.44 | 0.92 | 0.33 |
4. Effects of Wildfire
In 2001, we initiated an investigation employing sixteen 0.04 ha study plots at a south shore Lake Tahoe watershed near Stateline, NV. After collecting baseline data, a wildfire (Gondola Wildfire) in July 2002 burned 9 of our 16 previously established study plots. Although this completely altered the original study design, it allowed us to implement a pre- and post- burn sampling scheme along with those of adjacent unburned controls.
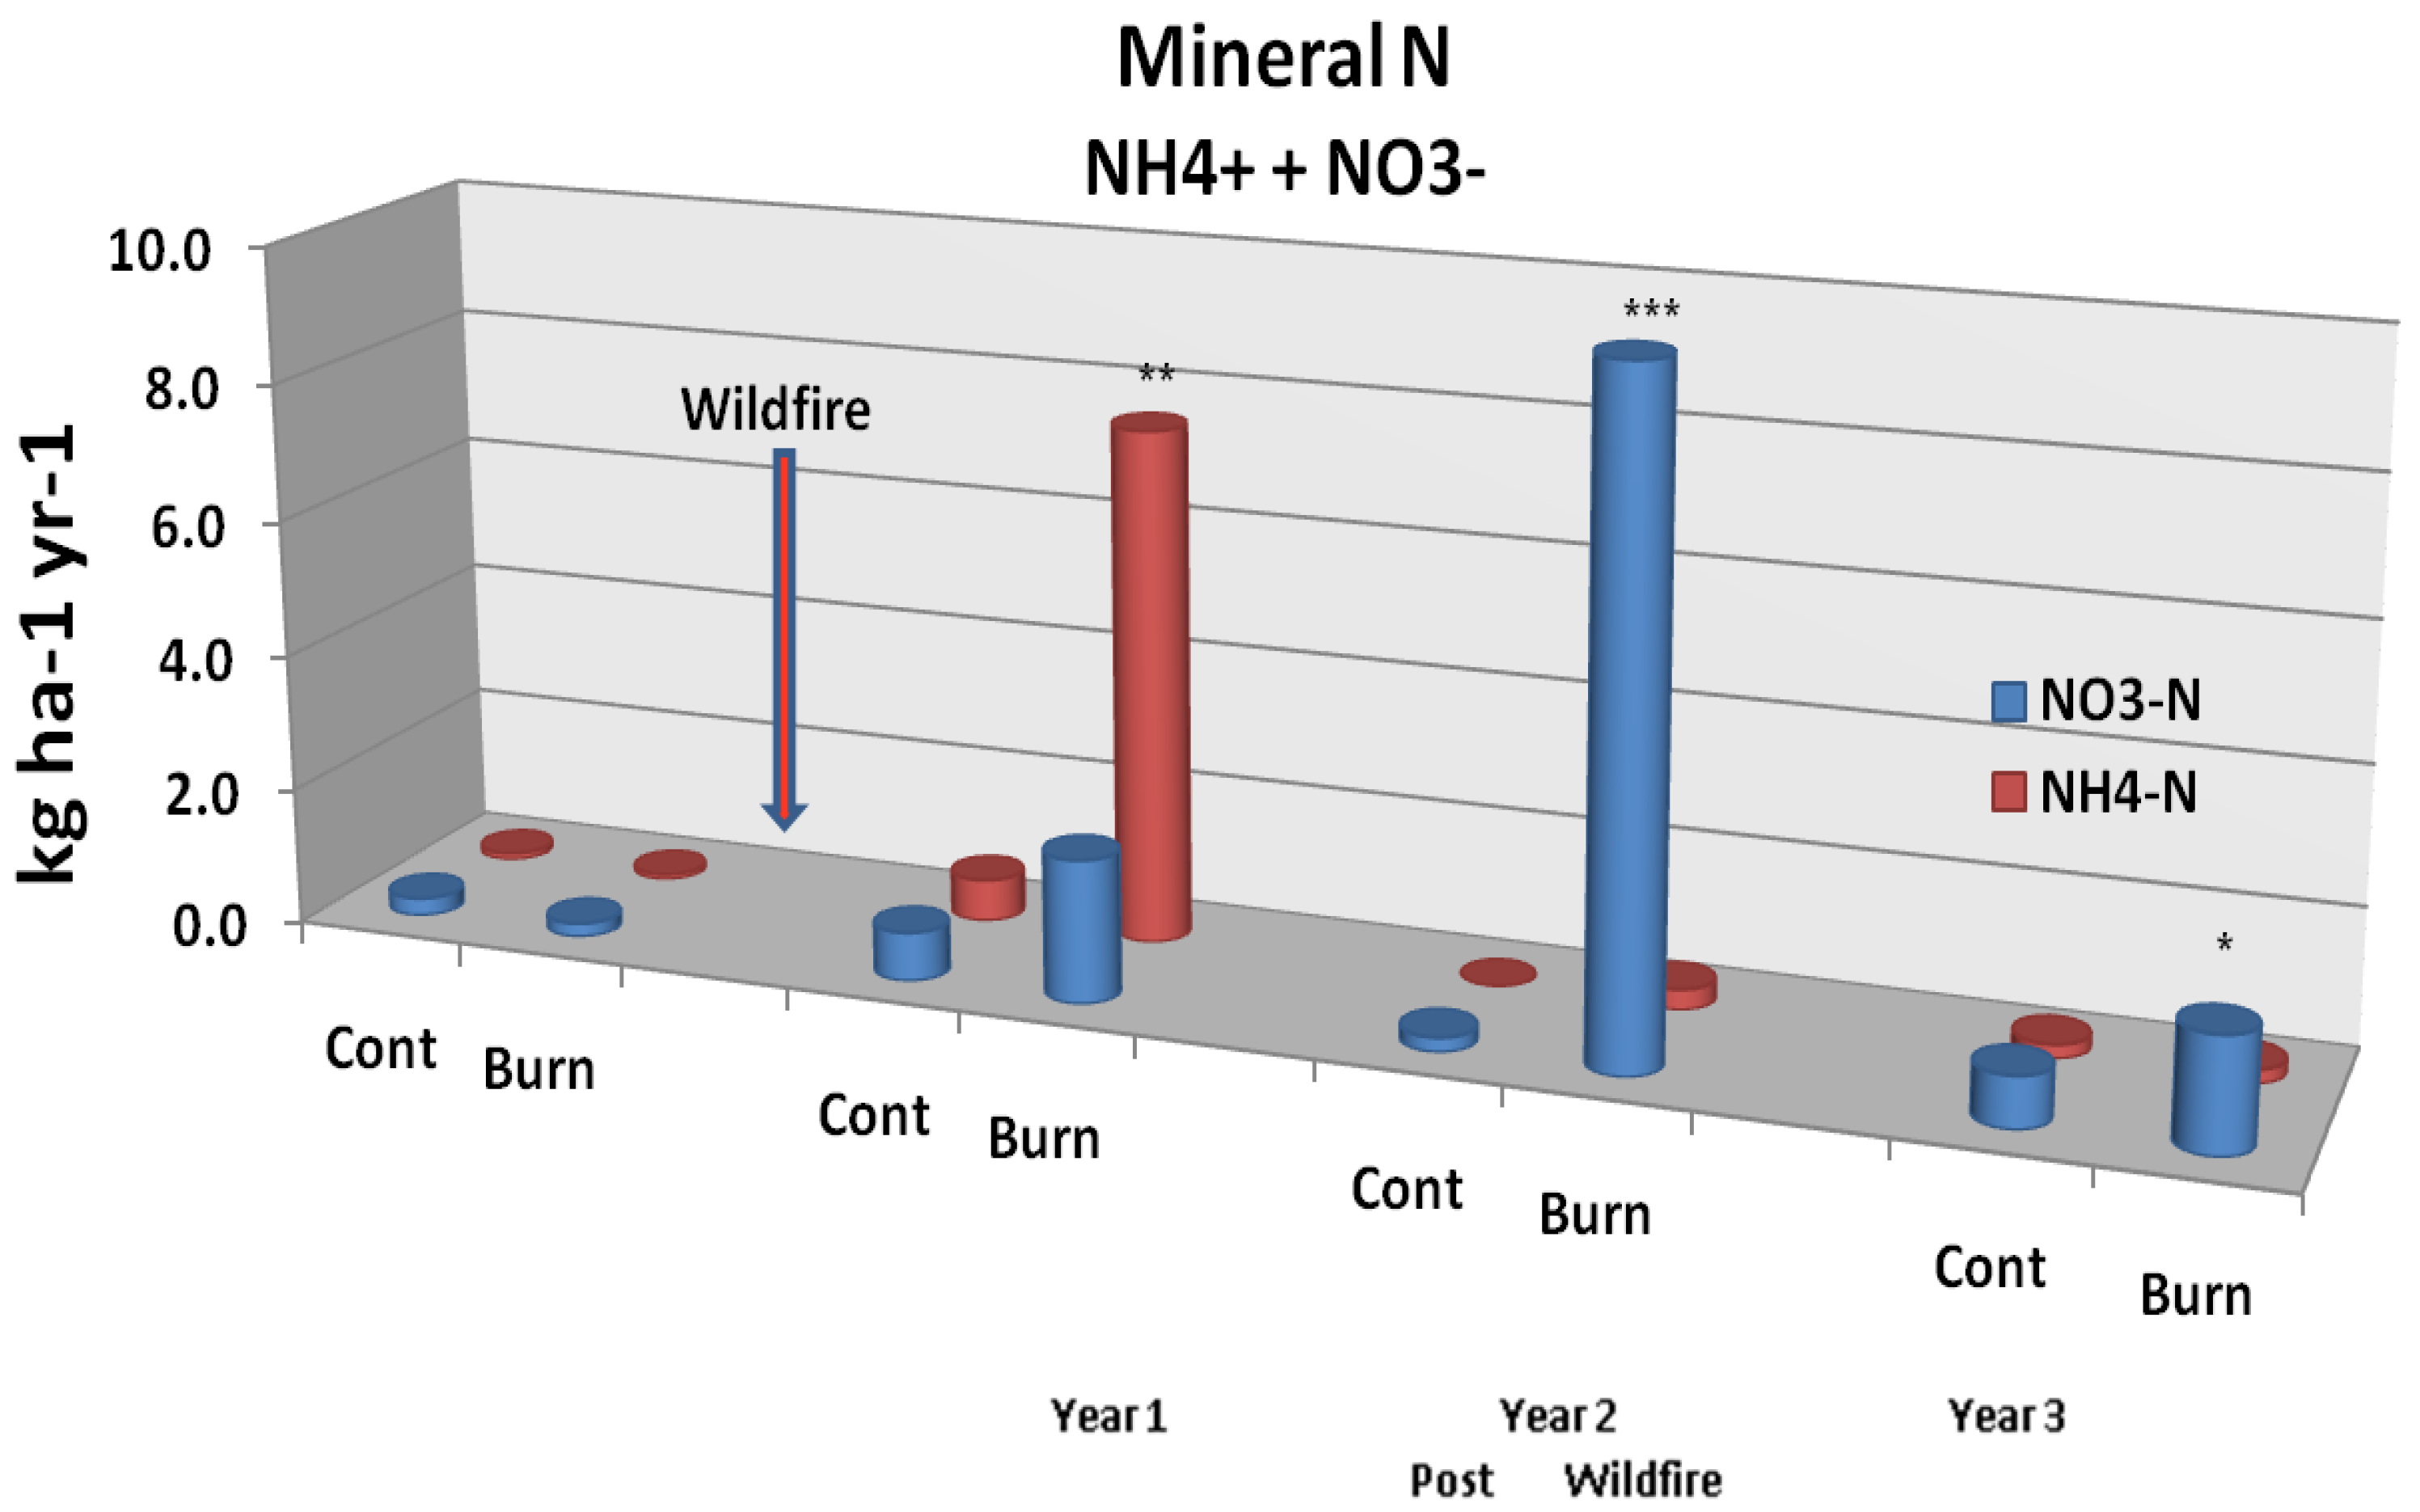
Wildfire was found to induce an immediate mobilization of inorganic N and P [
53]. Although small compared to volatilization losses, N leaching fluxes (
Figure 5A) from resin lysimeter measurements demonstrated significant (p < 0.05) increases 2 years post fire, with a shift from NH
4+ to NO
3− (nitrite + nitrate) N between post burn years 1 and 2 [
53,
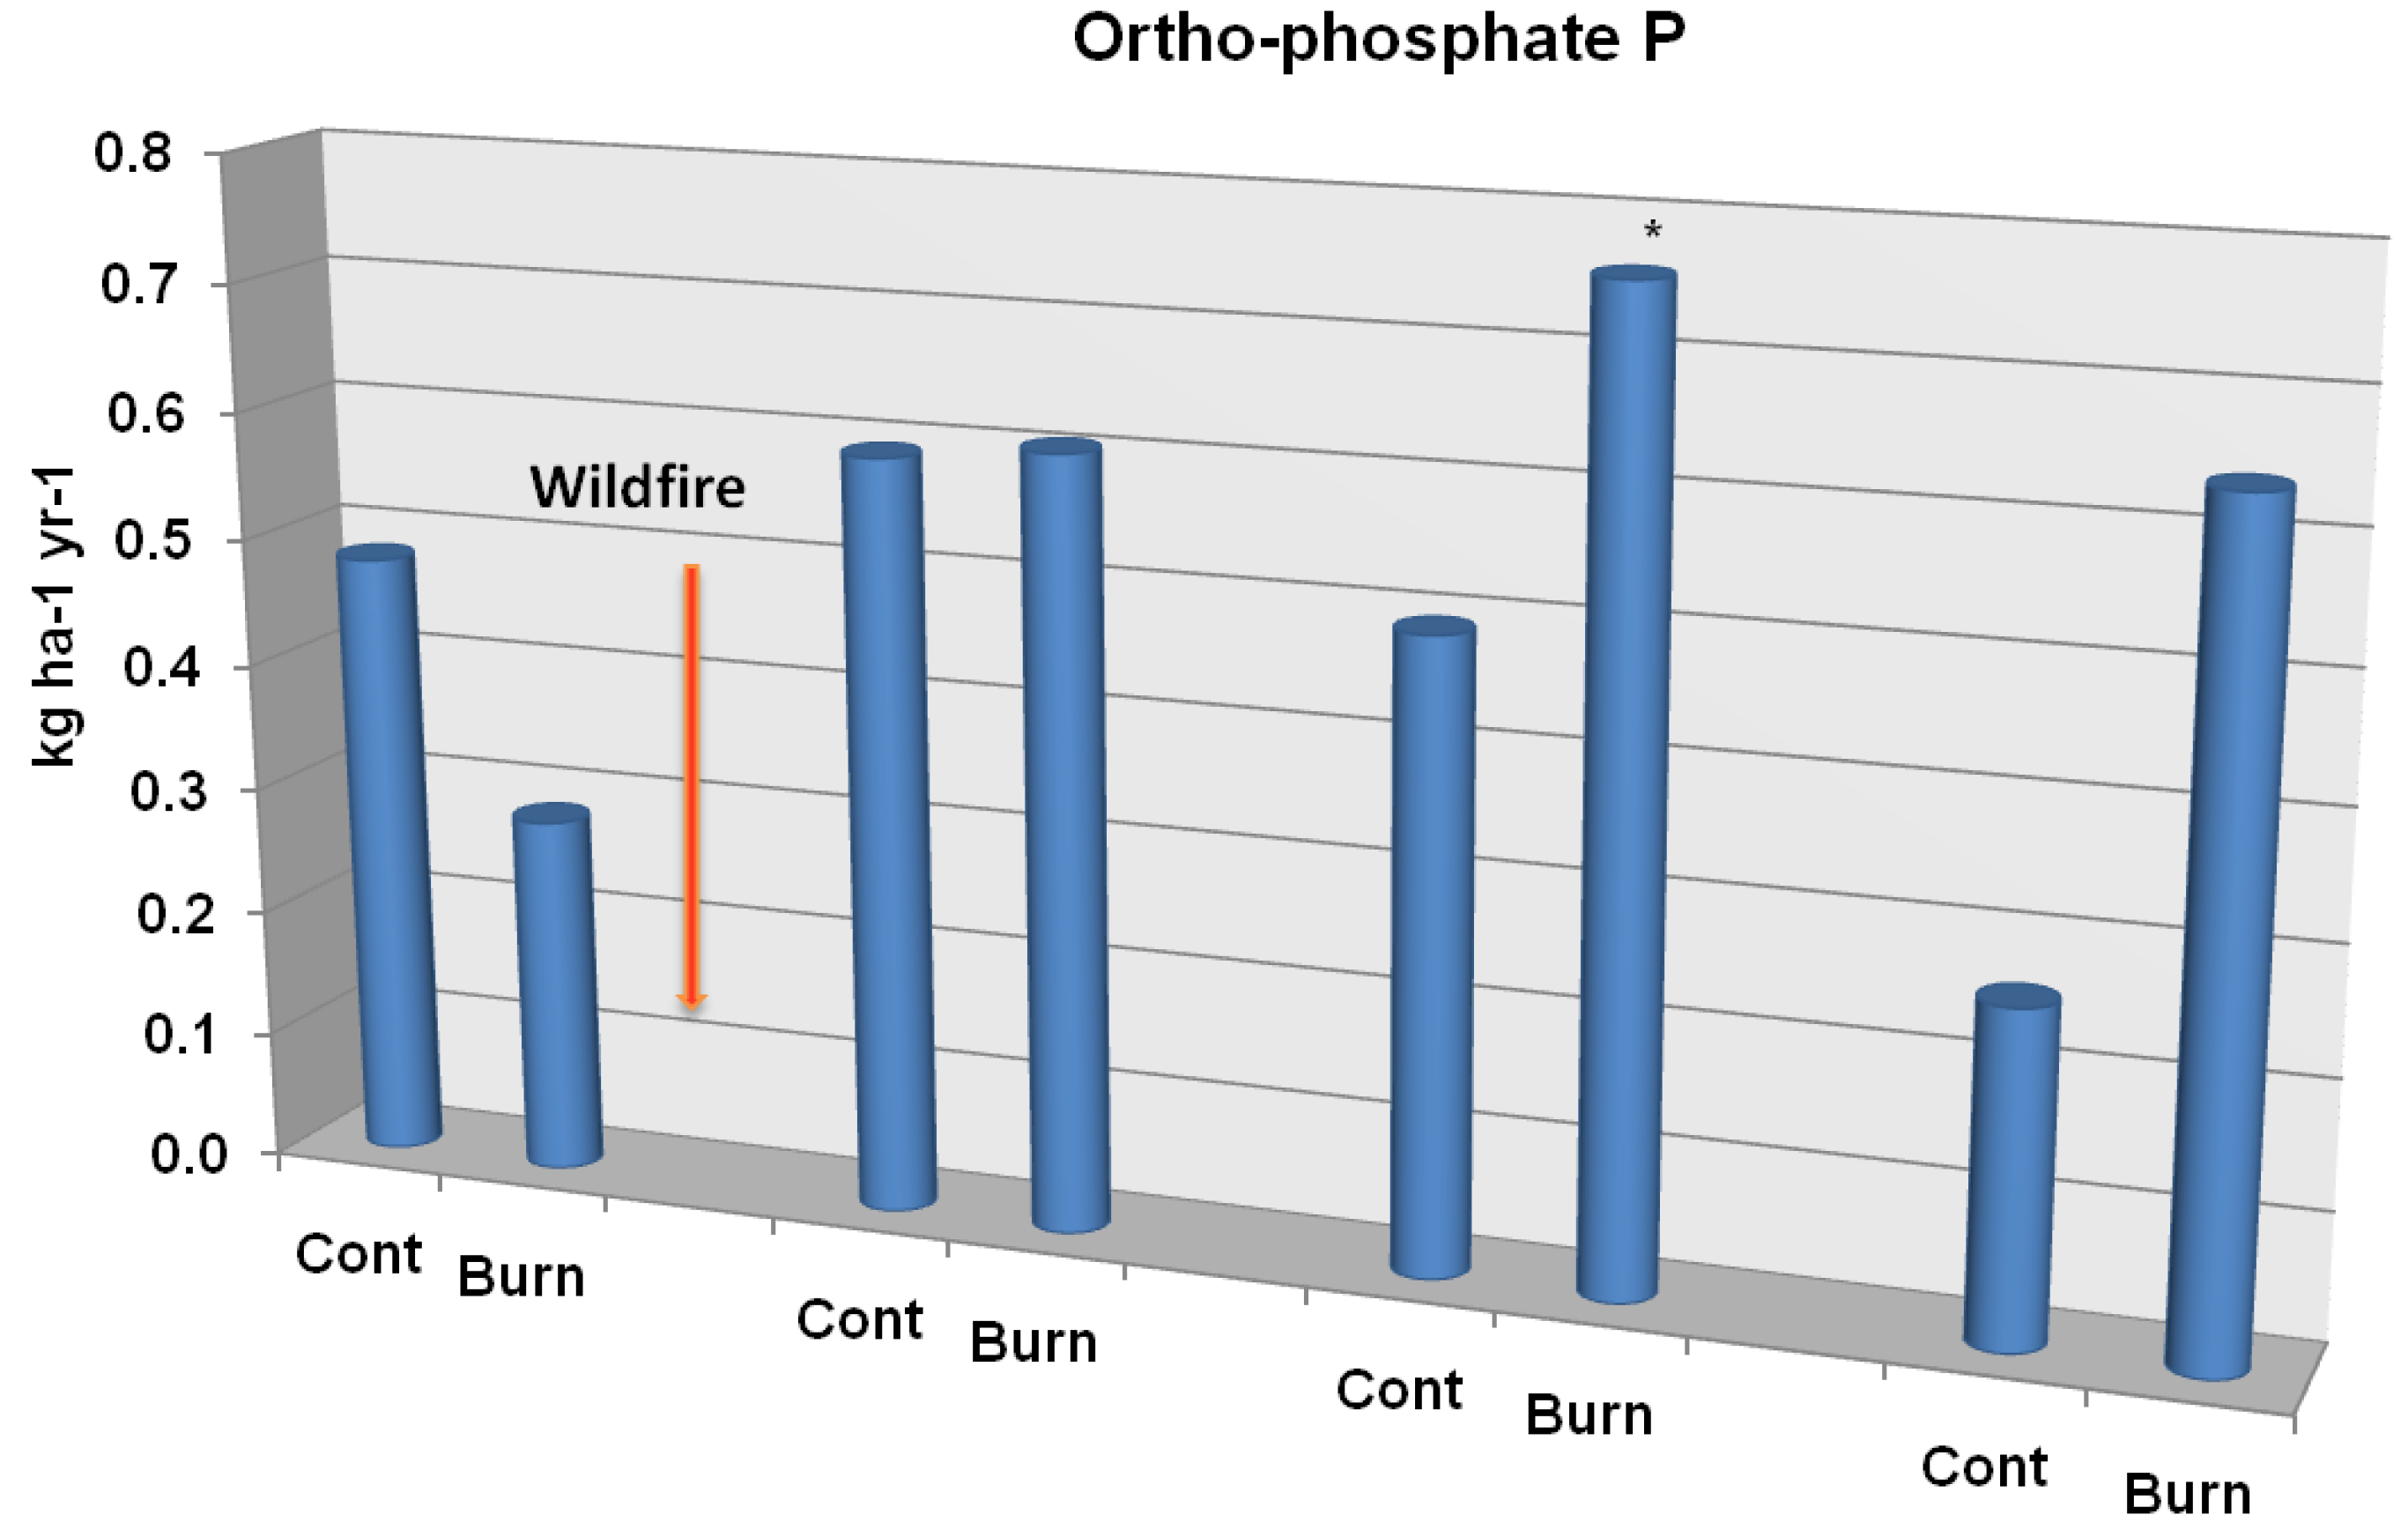
54] and a sharp decline in year 3. On the other hand, P leaching fluxes (
Figure 5B) showed no immediate change post burn, but a significant (p < 0.10) increase in post burn year 2. This latter effect appeared to continue during post burn year 3, but due to the high variability among data, significance was lost. Soil solution chemistry was also obtained from suction lysimeter samples [
53,
54]. There was a significant (p < 0.05) increase in soil solution NH
4+concentration (from 0 to ~170 µmol L
−1) immediately following the wildfire. This was followed by a rapid decline in NH
4+ concentration with a corresponding increase in soil solution NO
3− (to ~350 µmol L
−1) similar to that observed for the resin lysimeters. Nitrogen in the inorganic form of ammonium (NH
4+) usually increases following fire due to the fact that it is a direct product of partial organic matter combustion and denaturing of proteins in soils. A pulse of NO
3− can soon appear however due to the subsequent nitrification of NH
4+. There was also an increase in soil solution PO
43− following the wildfire. Although the increase was less dramatic (from ~2 µmol L
−1 to ~4.5 µmol L
−1) it appeared more persistent over time. Phosphorous, unlike N, is volatized only at very high temperatures (774–777 °C). During a fire, non-volatilized phosphorous is typically converted from organic form to orthophosphate. Thus, an enrichment in soil solution available phosphorous is often (but not always) observed after a fire event.
Figure 5A.
Mineral N soil leaching flux from unburned controls and study plots burned by wildfire. Significant differences are noted as p < 0.10 (*), p < 0.05 (**), or p < 0.01 (***). Adapted from [
54].
Figure 5A.
Mineral N soil leaching flux from unburned controls and study plots burned by wildfire. Significant differences are noted as p < 0.10 (*), p < 0.05 (**), or p < 0.01 (***). Adapted from [
54].
Figure 5B.
Ortho-phosphate P soil leaching flux from unburned controls and study plots burned by wildfire. Significant differences are noted as p < 0.10 (*), p < 0.05 (**), or p < 0.01 (***). Adapted from [
54].
Figure 5B.
Ortho-phosphate P soil leaching flux from unburned controls and study plots burned by wildfire. Significant differences are noted as p < 0.10 (*), p < 0.05 (**), or p < 0.01 (***). Adapted from [
54].
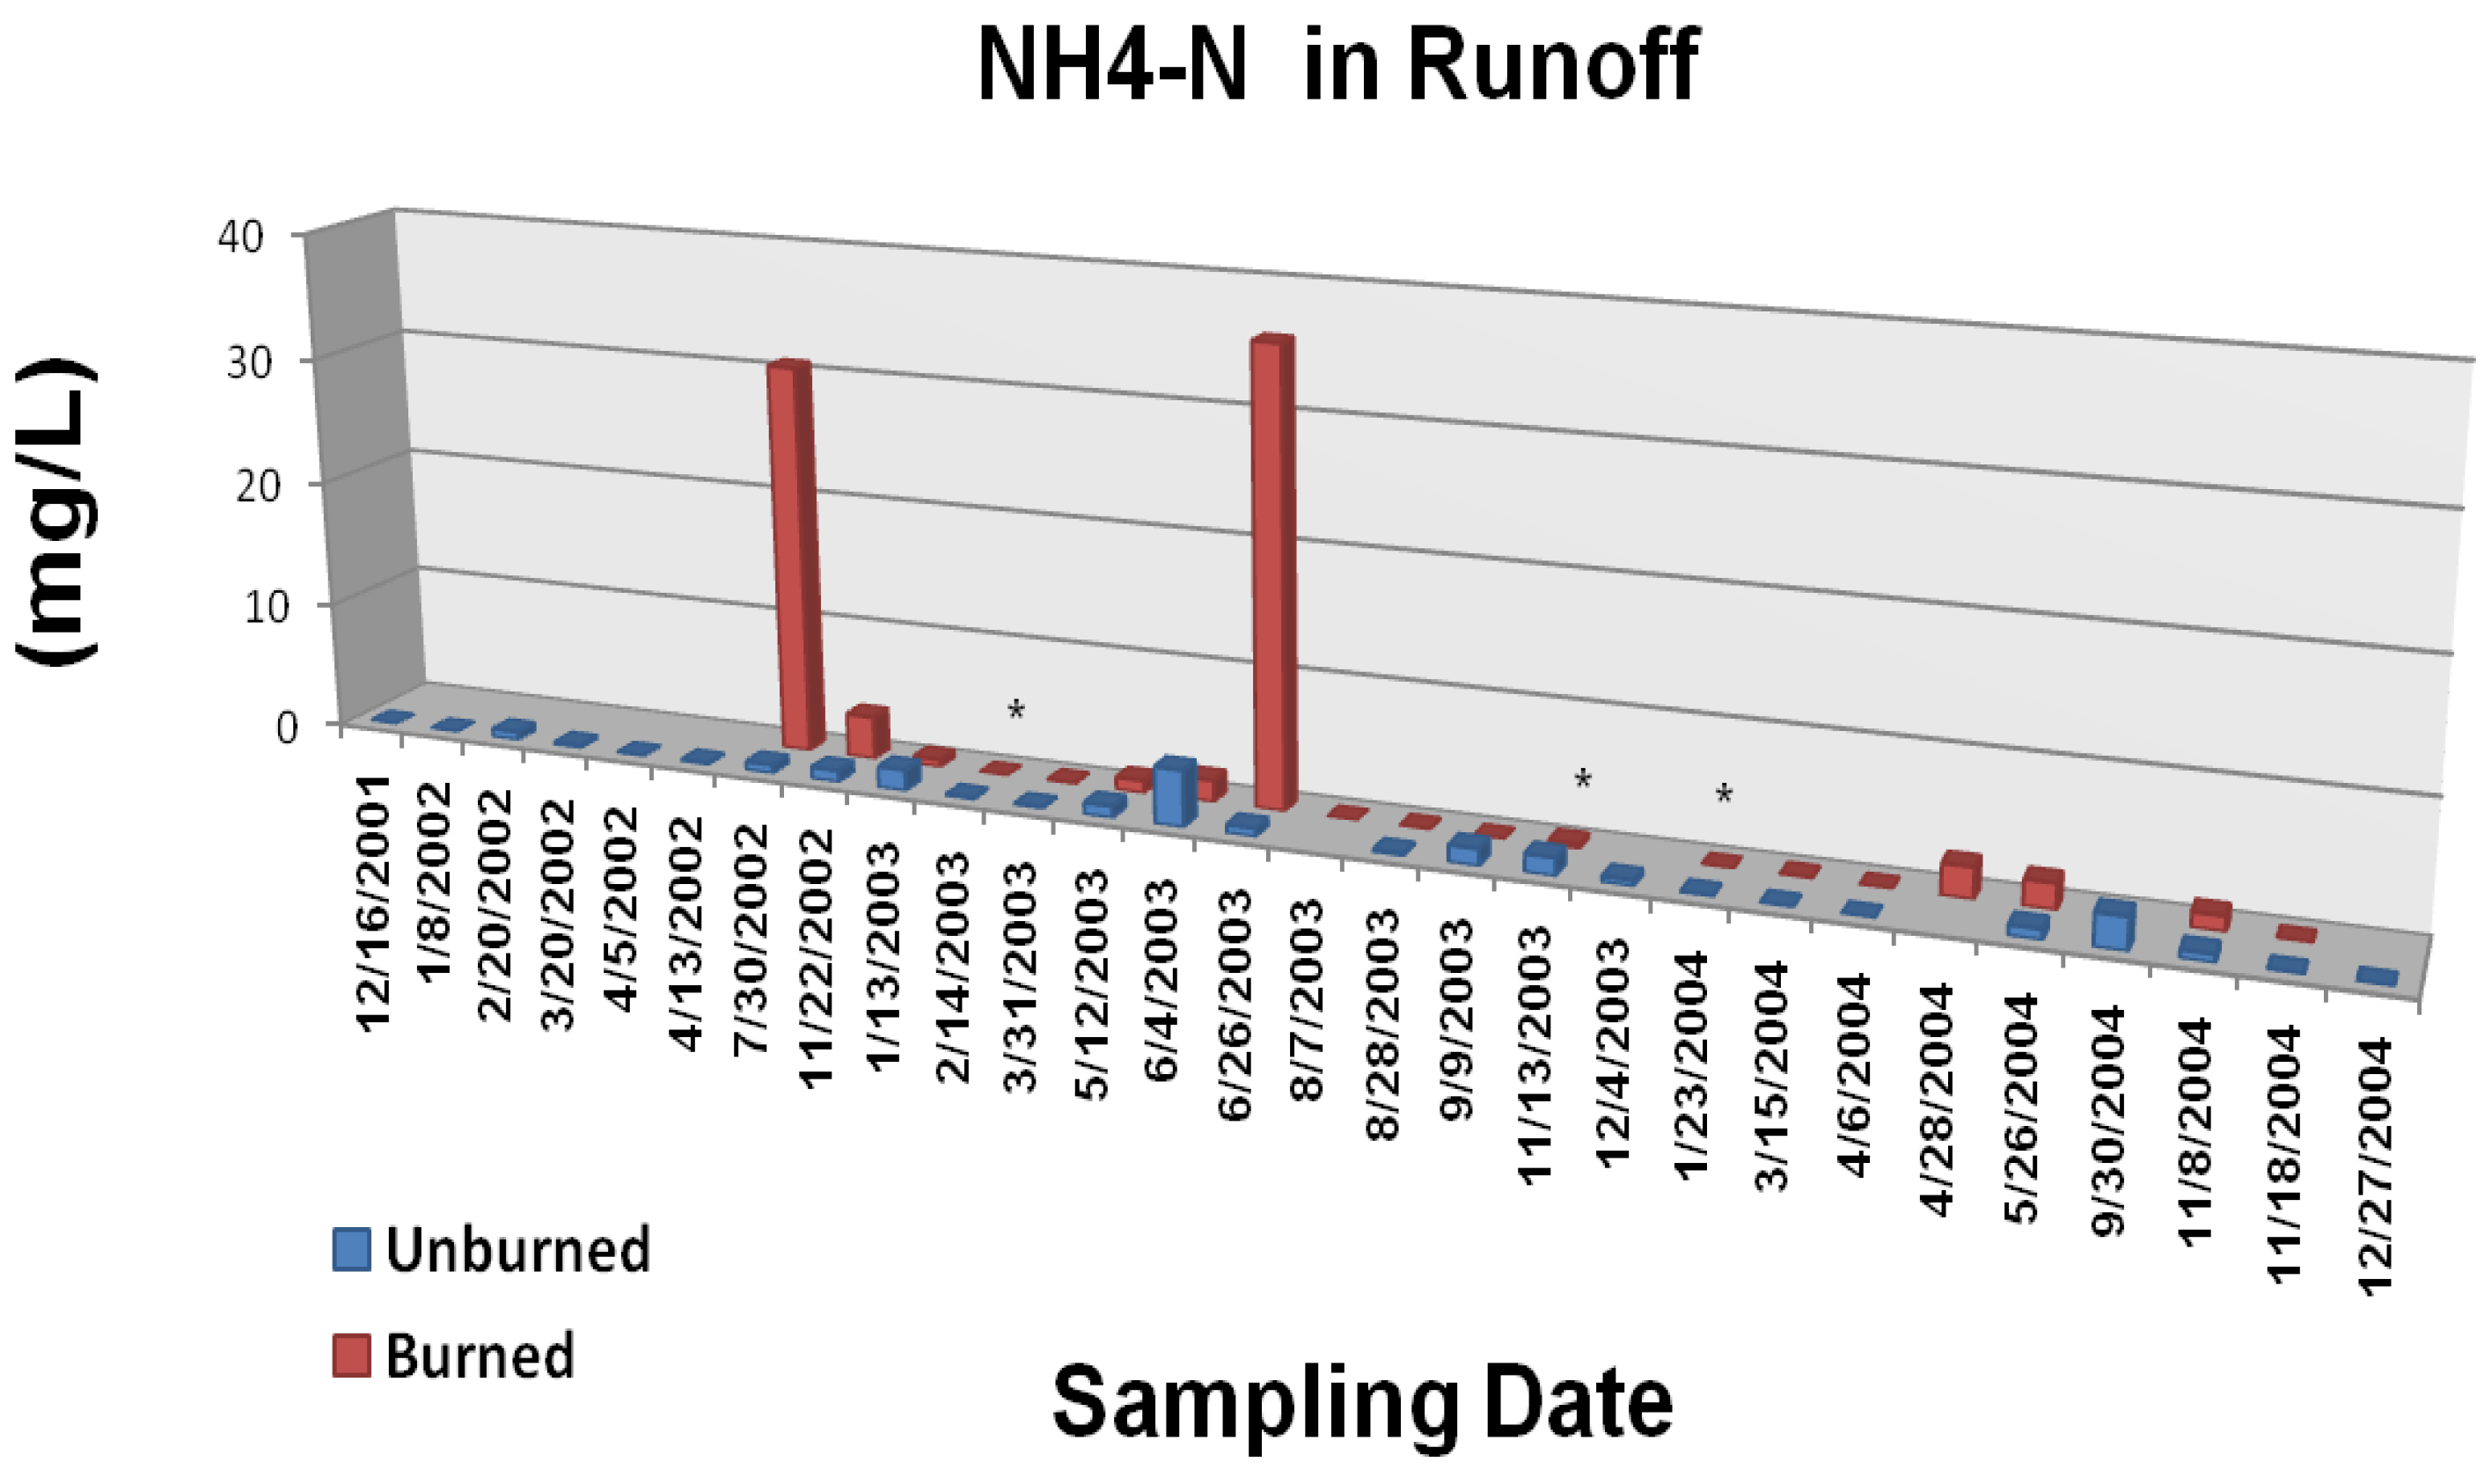
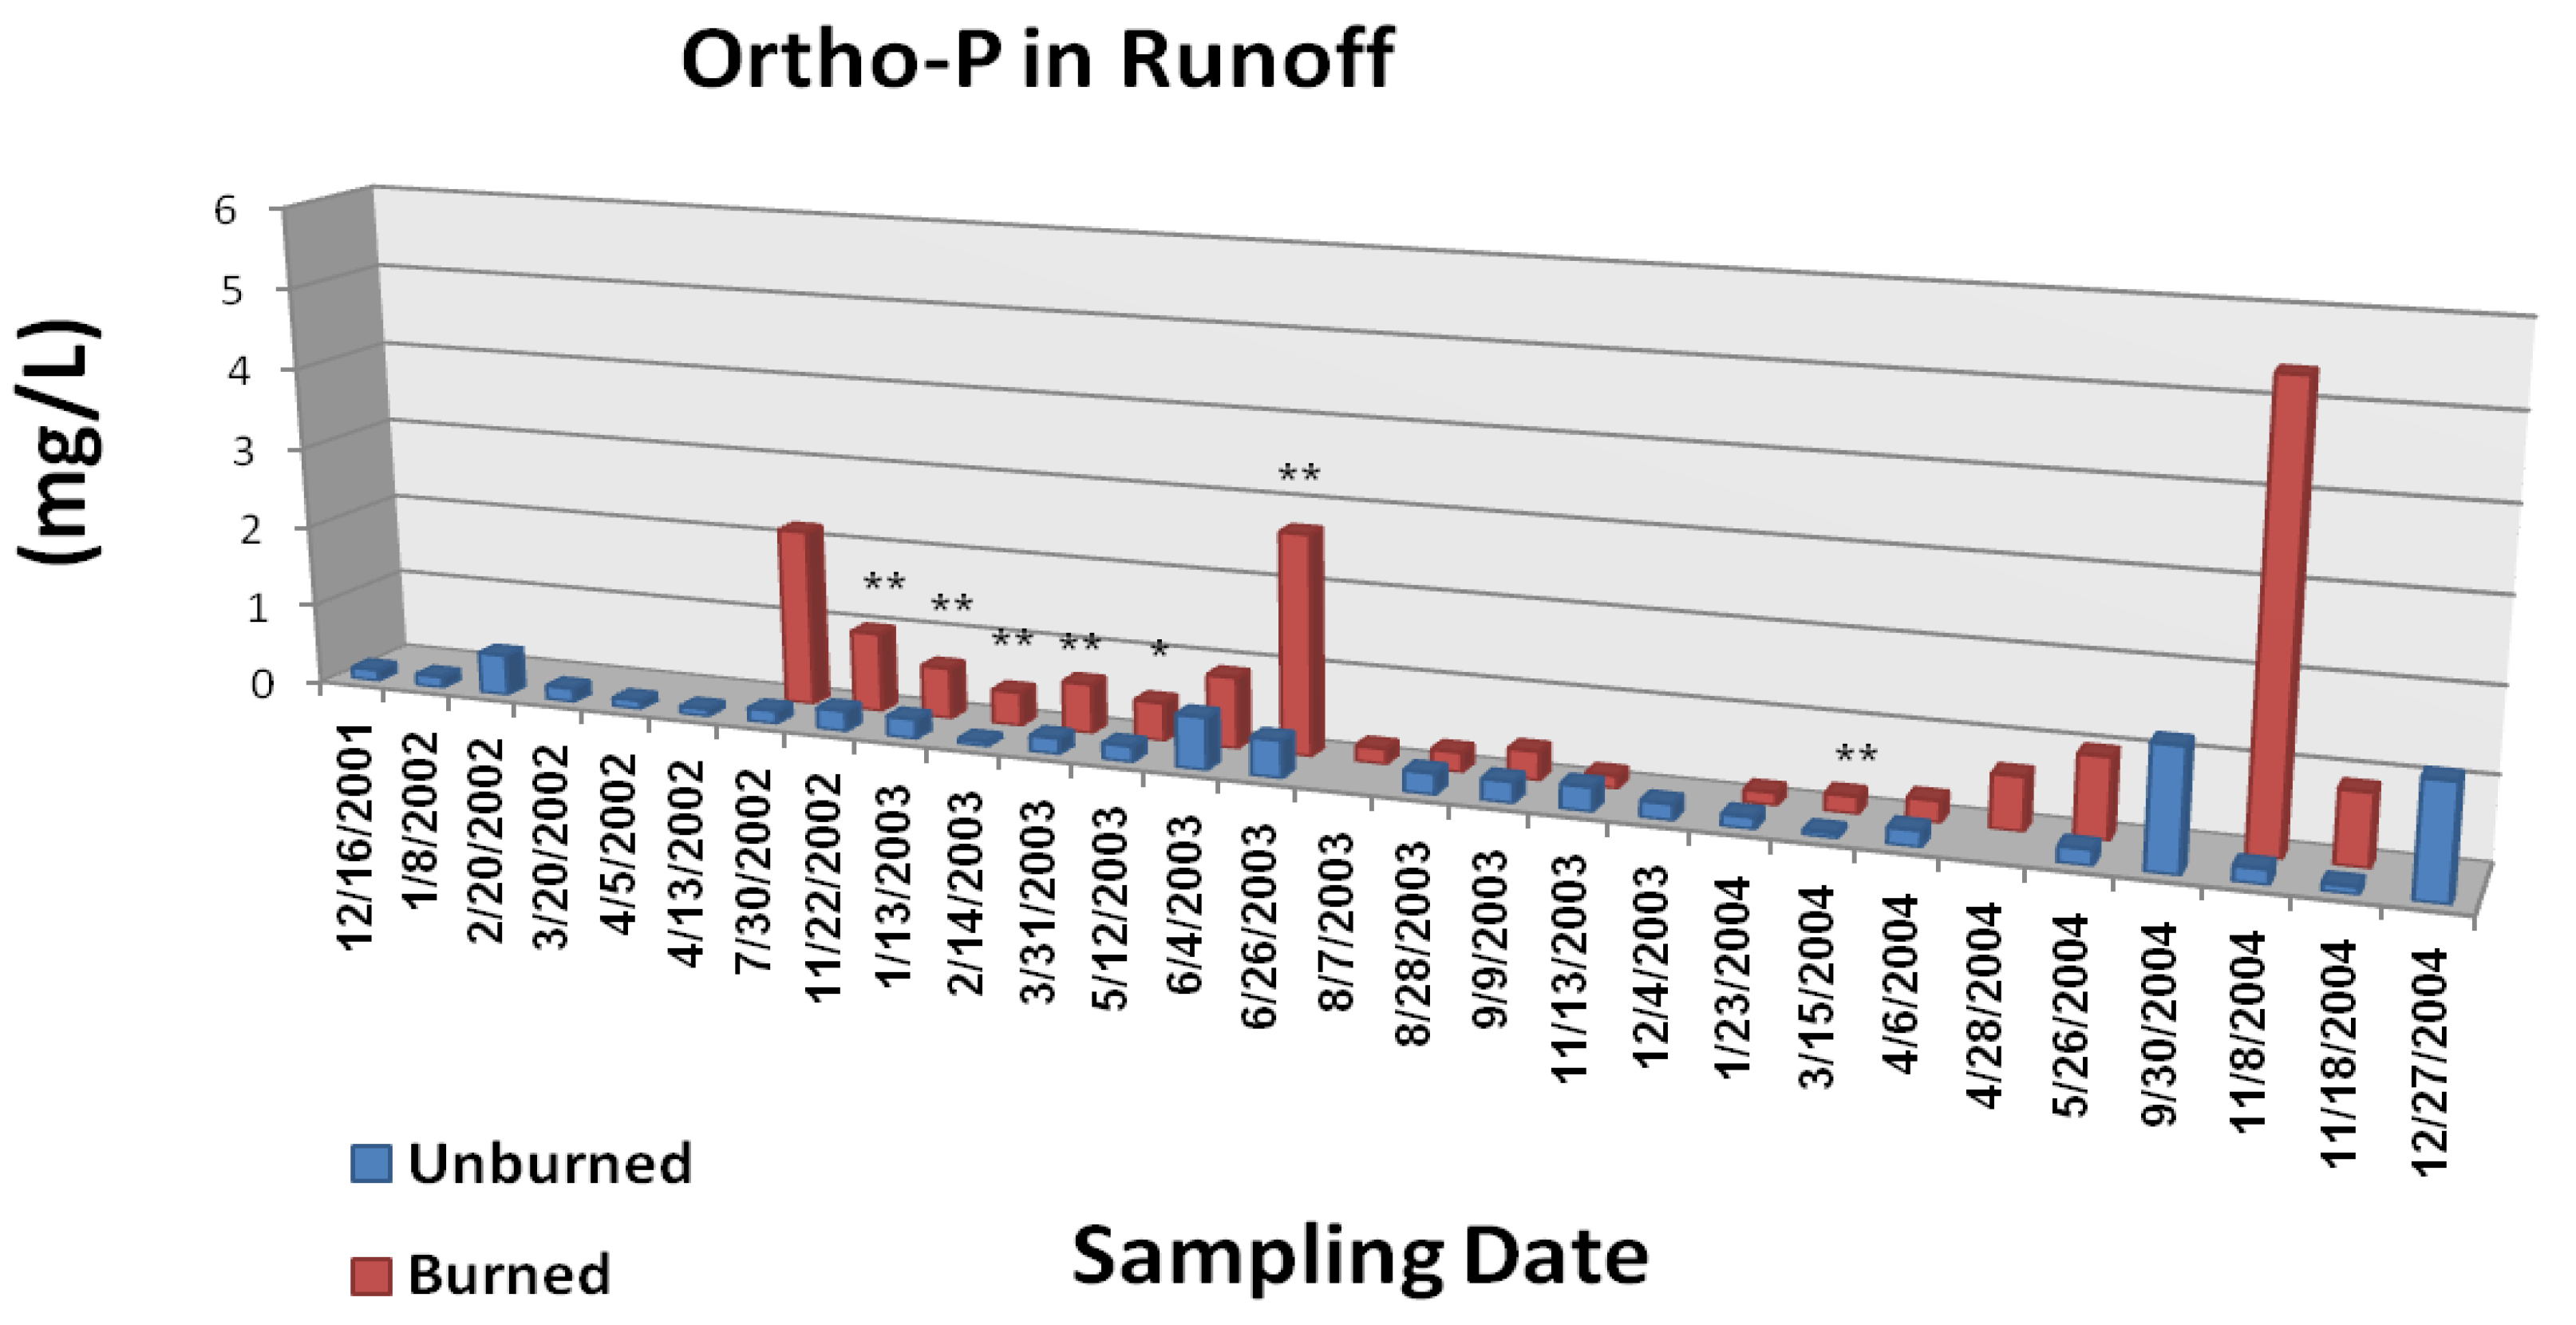
The Gondola fire also increased the frequency and magnitude of elevated nutrient concentrations in overland/litter interflow runoff (
Figure 6A,
Figure 6B, and
Figure 6C; from [
22]). Although the data were quite variable, concentrations of NH
4-N, NO
3-N, and PO
4-P were generally greater from the burned study plots during the first year following the wildfire. The most consistently significant effect (p < 0.05) was on runoff concentrations of PO
4-P. Measured parameter concentrations for both N and P were two to three orders of magnitude greater than those typically reported for Tahoe basin tributaries and Lake Tahoe itself [
20,
21]. Furthermore, compared to the typical discharge concentrations reported in
Table 3 characterizing current baseline conditions, overland/litter interflow runoff concentrations of N and P after the wildfire were notably much greater. Collectively, we infer that wildfire effects on soil solution and overland/litter flow runoff mineral N (NH
4-N, NO
3-N) were relatively short-lived (2 years), whereas the longevity effects on PO
4-P are less defined and more uncertain.
5. Effects of Mechanical Harvest and Controlled Burns
Mechanical harvest and/or controlled fire are increasingly viewed by resource managers as effective means of fuels reduction, and have become popular management strategies in the Sierra Nevada [
20,
55,
56,
57]. Mechanical harvest typically involves one of two approaches. The first approach employs the use of a cut-to-length system that processes standing trees into marketable logs, and then moves them to a landing where they are then reloaded for transport. A by-product of this method is the accumulation of heavy slash mats from de-limbing and topping functions. The second approach involves whole tree harvesting; wherein the trees are felled and skidded to a landing area for further processing [
58]. Because of the potential for adverse impacts due to land surface disturbance, controlled fire is often considered as a viable, more ecosystem friendly (
i.e., the simulation of natural fire regimes) substitute [
26,
59,
60,
61]. Although both practices are now commonly applied in coniferous forest ecosystems on the eastern slope of the Sierra Nevada and the Lake Tahoe basin, little is known about how they impact local nutrient cycling, the overland/litter interflow component of the water balance, or water quality.
Figure 6A.
Mean ammonium N concentrations in overland/litter interflow runoff from unburned and wildfire burned study plots. The Gondola wildfire occurred 3 July, 2002. Significant differences are noted as p < 0.10 (*), p < 0.05 (**), or p < 0.01 (***). Adapted from [
22].
Figure 6A.
Mean ammonium N concentrations in overland/litter interflow runoff from unburned and wildfire burned study plots. The Gondola wildfire occurred 3 July, 2002. Significant differences are noted as p < 0.10 (*), p < 0.05 (**), or p < 0.01 (***). Adapted from [
22].
Figure 6B.
Mean nitrate N concentrations in overland/litter interflow runoff from unburned and wildfire burned study plots. The Gondola wildfire occurred July 3, 2002. Significant differences are noted as p <0.10 (*), p <0.05 (**), or p <0.01 (***). Adapted from [
22].
Figure 6B.
Mean nitrate N concentrations in overland/litter interflow runoff from unburned and wildfire burned study plots. The Gondola wildfire occurred July 3, 2002. Significant differences are noted as p <0.10 (*), p <0.05 (**), or p <0.01 (***). Adapted from [
22].
Figure 6C.
Mean ortho-phosphate P concentrations in overland/litter interflow runoff from unburned and wildfire burned study plots. The Gondola wildfire occurred July 3, 2002. Significant differences are noted as p < 0.10 (*), p < 0.05 (**), or p < 0.01 (***). Adapted from [
22].
Figure 6C.
Mean ortho-phosphate P concentrations in overland/litter interflow runoff from unburned and wildfire burned study plots. The Gondola wildfire occurred July 3, 2002. Significant differences are noted as p < 0.10 (*), p < 0.05 (**), or p < 0.01 (***). Adapted from [
22].
In a study near Truckee, California, just outside of the Tahoe basin, Murphy
et al. [
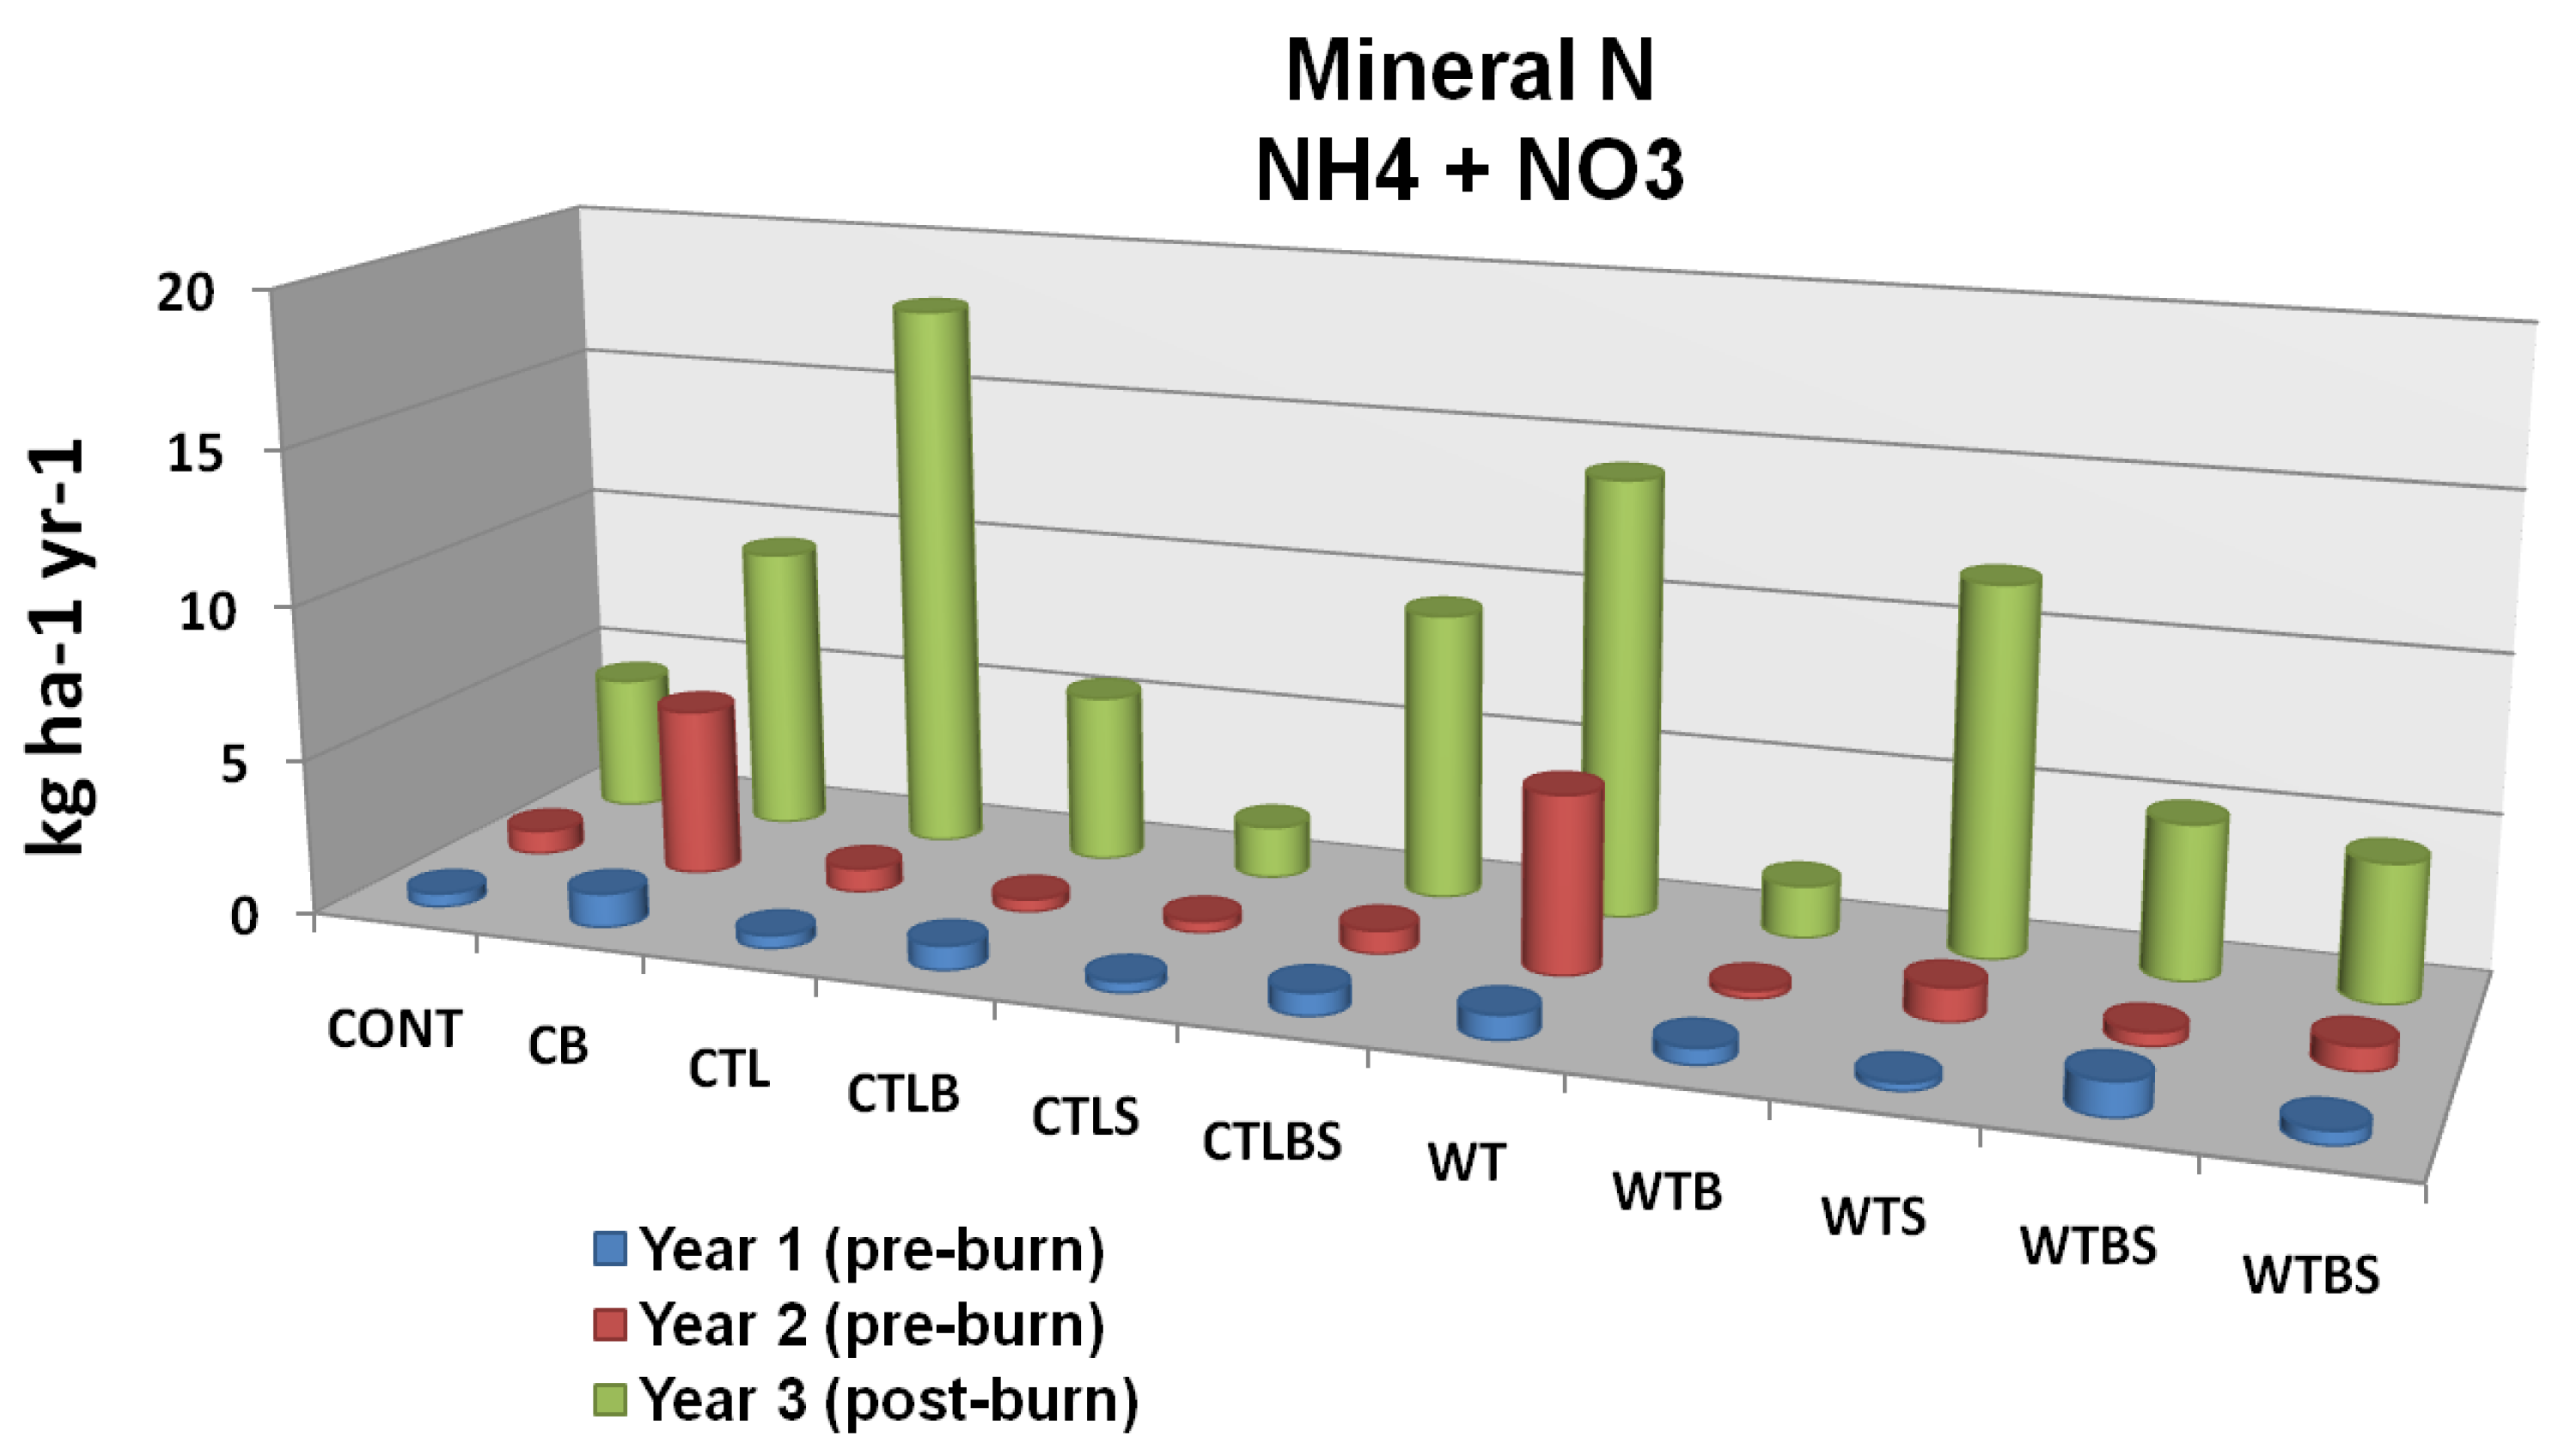
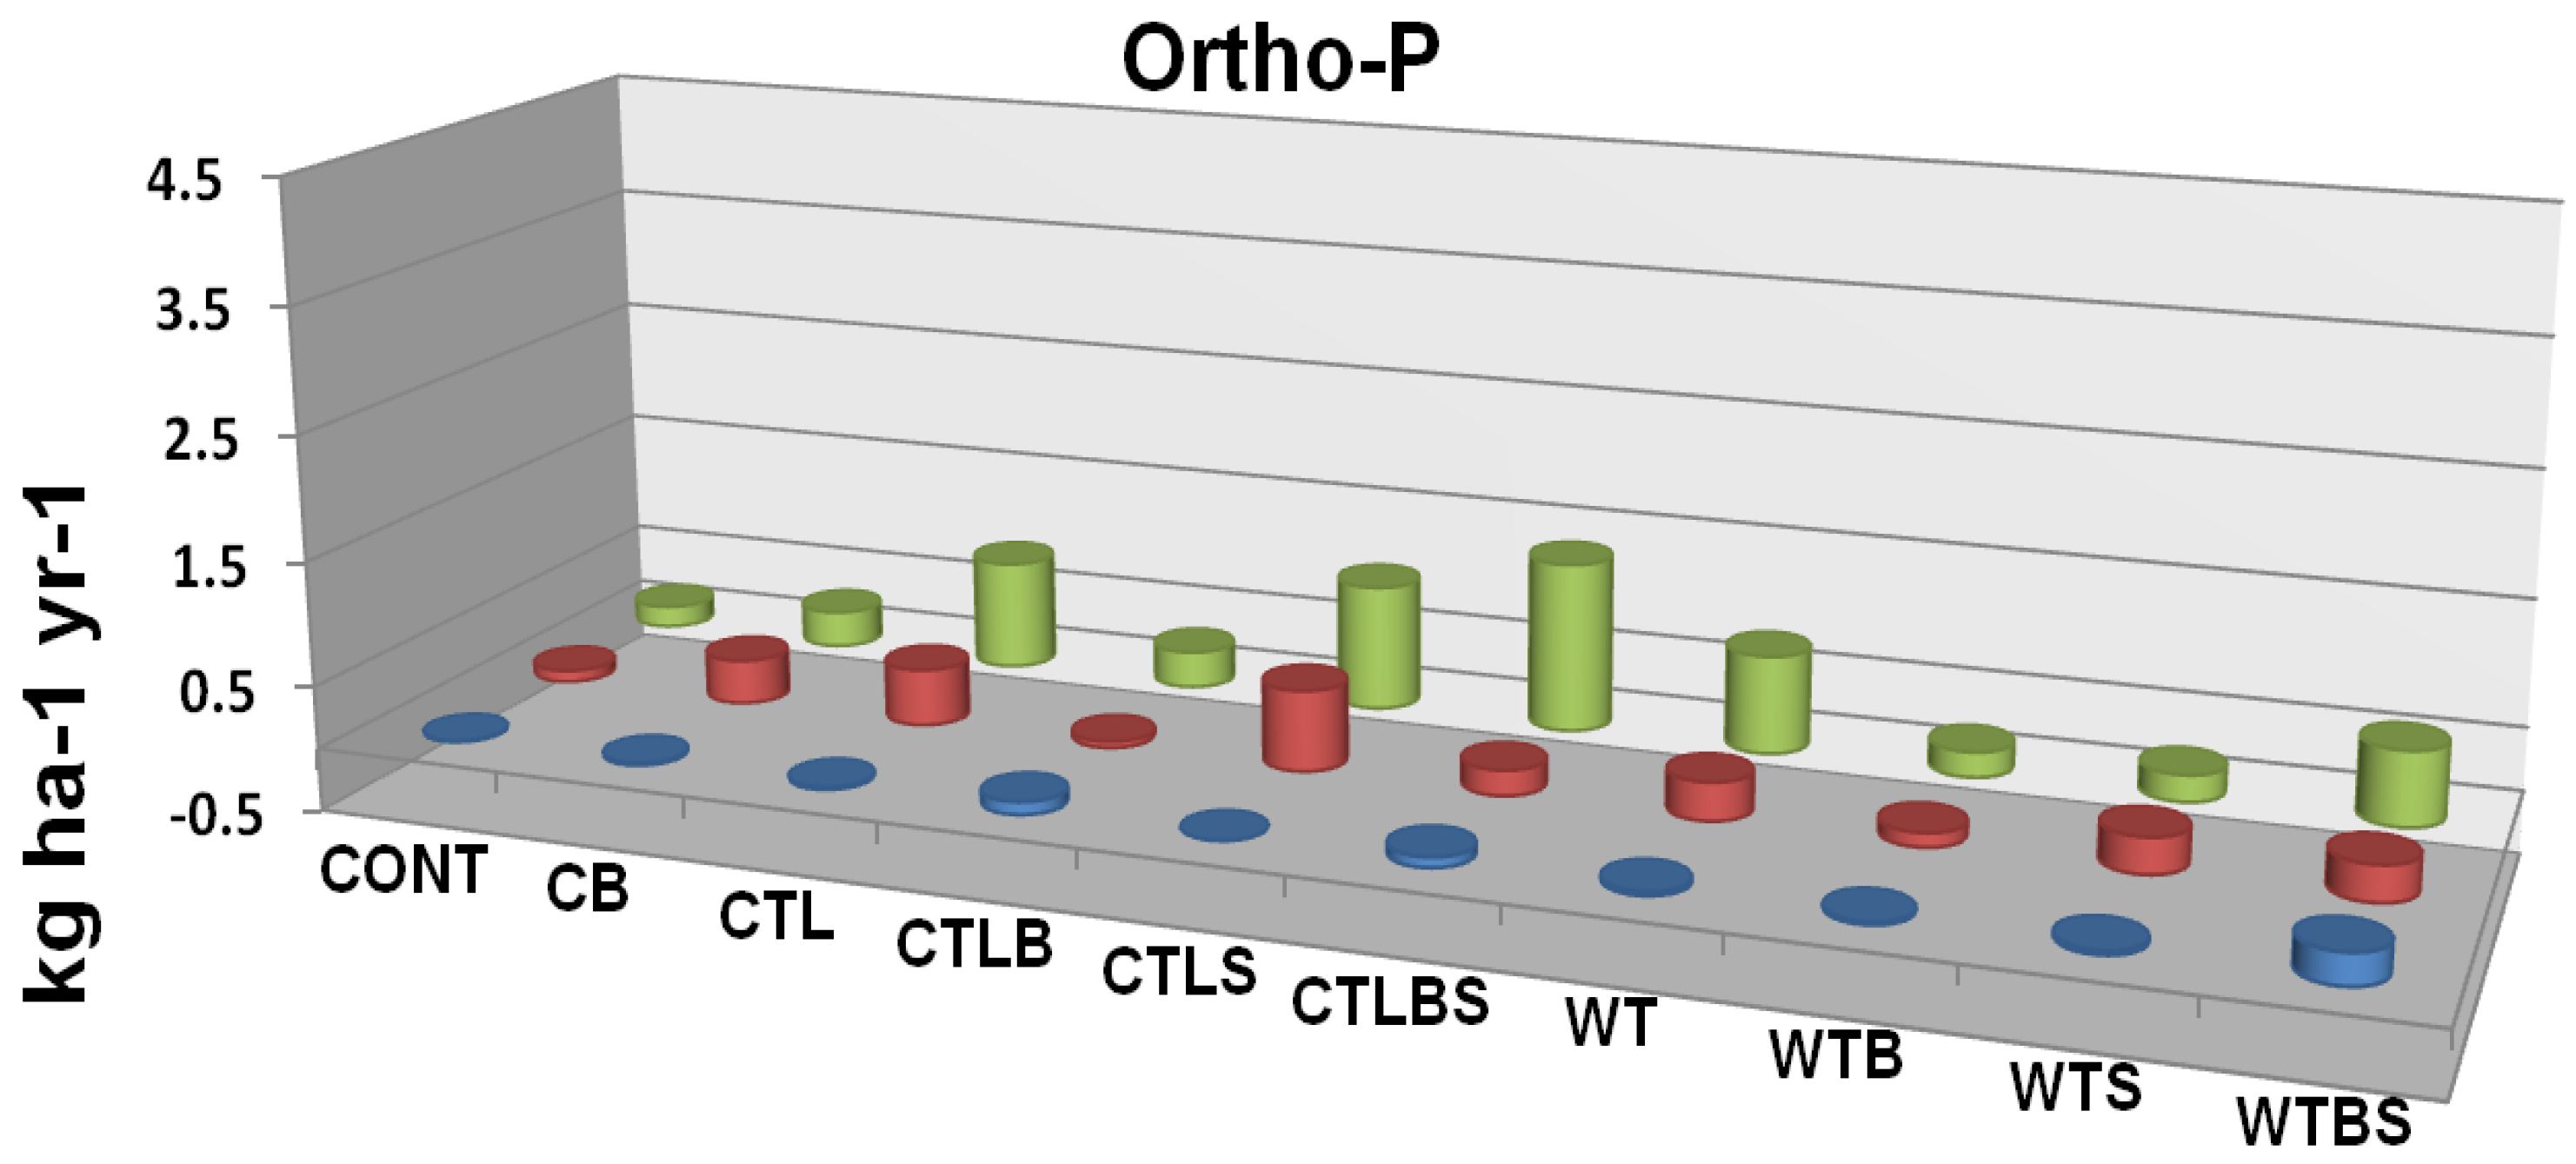
62] compared the effects of three harvest (no harvest, cut-to-length, whole tree) and two burn (unburned, burned) treatments on forest floor and soil nutrients. Although some trends were apparent, neither mechanical treatment nor controlled burning had a significant effect on cumulative leaching (resin lysimeters) or soil solution (suction lysimeters) inorganic N and P (
Figure 7A and
Figure 7B) [
62]. In a related study on Lake Tahoe’s north shore, Loupe
et al. [
63] compared the effects of biomass reduction using cut-to-length mechanical harvest, followed by chipping mastication and controlled burning on overland/litter interflow runoff and discharge water quality. Runoff volume, season, and year were identified as important parameters significantly influencing discharge nutrient concentrations and loads. Discharge concentrations of inorganic N and P from the various treatments were less than or equal to the unburned un-harvested controls, but were greater for inorganic S. Data analysis also showed treatment effect to be a strong predictor of increased discharge loads of NO
3-N and SO
4, but only a weak predictor for PO
4-P (
Table 4) in that harvest and/or burning tended to weakly affect nutrient mobilization and discharge in overland/litter interflow surface runoff. Of particular interest, is that the contributions of treatment to discharge loads of NO
3-N and SO
4 were clearly greater for the unburned harvested and burned un-harvested treatments, where on average each contributed about 0.17 ± 0.05 mg more of N and S on a per sample basis (0.17 mg 1,000 cm
−2 = 0.017 kg ha
−1 equivalent) than did either the combined burned and harvest treatment, or the unburned un-harvested controls.
Figure 7A.
Mineral N leaching flux as related to two forms of mechanical harvest (cut to length and whole tree) two burn treatments and their interaction. Cont = Control Unburned, CB = Control Burn, CTL = Cut to Length Unburned, CTLB = Cut to Length Burned, CTLS = Cut to Length Slash Pile Unburned, CTLBS = Cut to Length Burned Slash Piles, WT = Whole Tree Unburned, WTB = Whole Tree Burned, WTS = Whole Tree Skid Trail Unburned, WTBS = Whole Tree Burned Skid Trail. Although no significant differences were identified there is an apparent trend in response to fire. Adapted from [
62].
Figure 7B.
Ortho-phosphate P leaching flux as related to two forms of mechanical harvest (cut to length and whole tree) two burn treatments and their interaction. Cont = Control Unburned, CB = Control Burn, CTL = Cut to Length Unburned, CTLB = Cut to Length Burned, CTLS = Cut to Length Slash Pile Unburned, CTLBS = Cut to Length Burned Slash Piles, WT = Whole Tree Unburned, WTB = Whole Tree Burned, WTS = Whole Tree Skid Trail Unburned, WTBS= Whole Tree Burned Skid Trail. Although no significant differences were identified there is an apparent trend in response to fire. Adapted from [
62].
Table 4.
Comparison of average estimates for nutrient load contributions (95% confidence) per runoff sample as affected by treatment. Load in mg per 1,000 cm
2 = 0.1 kg ha
−1 equivalent [
63].
Table 4.
Comparison of average estimates for nutrient load contributions (95% confidence) per runoff sample as affected by treatment. Load in mg per 1,000 cm2 = 0.1 kg ha−1 equivalent [63].
| | Model Estimated Contributions to Overland/Litter Interflow Runoff Load |
|---|
| | NO3-N | SO4-S | PO4-P |
|---|
| | ----------------mg 1,000 cm−2------------ |
|---|
| Unburned Un-Harvested | 0.05 ± 0.05 | 0.24 ± 0.20 | 0.02 ± 0.01 |
| Unburned Harvested | 0.22 ± 0.04 | 0.49 ± 0.17 | 0.01 ± 0.01 |
| Burned Un-Harvested | 0.23 ± 0.06 | 0.63 ± 0.25 | 0.01 ± 0.02 |
| Burned Harvested | 0.06 ± 0.07 | 0.11 ± 0.28 | 0.01 ± 0.02 |
6. Management Implications
Fire has a two-fold effect on nutrients in the forest soil ecosystem through volatilization and mineralization. For example, most N contained in materials that burn is lost to the atmosphere via volatilization at relatively low temperatures; thus, fire (either wildfire or controlled fire) causes net losses of N from the terrestrial ecosystem that, over time, can be important because N is often a growth limiting nutrient for vegetation [
52]. In this context, it is important to note that N losses from repeated controlled burns designed to suppress understory vegetation can equal or exceed those in a wildfire over time [
52], and this may be of concern in terms of long-term forest nutrition especially in view of the fact that regularly controlled fire precludes the rejuvenation of N fixing vegetation. However, if post-fire N fixing vegetation is allowed to re-establish it can more than replace lost N over about two decades [
64]. In contrast, P volatilization does not take place except at very high burn temperature. Soil heating and partial combustion of the forest floor normally causes the degradation of amino acids, proteins, and organo-phosphate complexes that result in an increase (sometimes quite substantial) in soil ammonium and phosphate [
36]. This is basically equivalent to a dose of fertilizer, and often contributes to the lush growth of herbaceous vegetation following a fire. This same effect tends to increase the frequency and magnitude of elevated nutrient discharge concentrations in leachate and runoff during the first season following a wildfire event [
22,
54]. It is apparent that at least some of these labile nutrients are transported off-site during precipitation or snowmelt [
65], thus enhancing the nutrient loading of adjacent tributaries and their discharge into Lake Tahoe. Although wildfire has been shown to cause dramatic increases in labile nutrient mobilization [
22,
53,
54], effects of similar magnitude on soil and soil solution nutrient flux have not been identified for controlled burns [
62,
63].
The shift from low-intensity fire to stand-replacing wildfire, therefore, has the potential to substantially impact many aspects of ecosystem ecology. Unfortunately, since wildfires have no pre-fire plan, pre-treatment and suitable control sites for quantitative comparisons are rare, and information on the comparative effects of wildfire on soil organic matter, nutrient cycling, and biological response is scarce. Although obtaining sound data from the effects of controlled fire is far more practical, the results may not apply to the effects of wildfire. Information gaps thus remain concerning post-wildfire vegetation recruitment, as well as long-term succession and ecological impacts. A comprehensive assessment of the effects of both wildfire and controlled fire and post-fire vegetation on long-term nutrient budgets is needed to better understand fire and its role in soil ecology, plant growth, and nutrient discharge.
From a management perspective, the current question is whether it is better to continue with fire suppression management strategies and risk a potential wildfire or to embark on a fuels reduction program with the objective of achieving a more frequently disturbed, open forest containing reduced nutrient pools in litter and soil organic horizons. To address this issue, we must attempt to define the existing and pre-existing nutrient pool conditions and their respective transport potential. If we define one end member as the pre-fire suppression historic fire regime era and the other as the aftermath of a present day wildfire, somewhere along this continuum is where we are today given the current fuels status and the effects of fuels reduction strategies such as mechanical harvesting and/or controlled fire. Our task then, is to somehow characterize the potential discharge water quality associated with each scenario.
To approach this, we first considered the effects of wildfire on runoff water quality (
Figure 6A,
Figure 6B, and
Figure 6C) at the Gondola study site near State Line, NV, along the south shore of Lake Tahoe. From Miller
et al. [
22] we computed the mean annual discharge load for mineral N (NH
4+-N plus NO
3−-N) and ortho-P contained in overland/litter interflow runoff by combining measured runoff volumes with the respective nutrient concentrations and summing over the first year following the wildfire (2 July 2002 through 7 August 2003). Loupe
et al. [
63] later reported that each runoff collection appeared to be generated from an approximate area of 1,000 cm
2. Using their information we were thus able to convert the respective loads to kg ha
−1yr
−1 (1 mg/1,000 cm
2 = 0.1 kg ha
−1). Comparative N and P loads from unburned and burned overland/litter interflow runoff collections are presented in
Table 5. The annual discharge loads for mineral N and ortho-P were approximately double following the wildfire (approx. 7 kg ha
−1yr
−1 vs. 14 kg ha
−1yr
−1 for mineral N and 1 kg ha
−1yr
−1 vs. 2 kg ha
−1yr
−1 for ortho-P, respectively).
We next considered the reported effects of mechanical harvest and controlled burning on overland/litter interflow runoff water quality from a study site at North Shore Lake Tahoe [
63]. The effects of four treatments (un-harvested and unburned, harvested and burned, harvested and unburned, and un-harvested and burned) on discharge loads of mineral N and ortho-P were determined in a similar manner (
i.e., mg yr
−1collector
−1 pre- and post-treatment were converted to kg ha
−1yr
−1). Overall, the computed discharge loads were much lower compared to the Gondola site. This could be due to a number of factors such as location (north
vs. south shore), soil parent materials (volcanic
vs. granitic), and vegetation (mixed-conifer
vs. Jeffrey pine). Nonetheless, a similar comparative assessment among treatments was possible. Overland/litter interflow runoff discharge loads from control treatments (un-harvested and unburned current conditions) were about 0.25 kg ha
−1yr
−1 and 0.20 kg ha
−1yr
−1 for mineral N and ortho-P, respectively (
Table 5). Mechanical harvest coupled with burning shows no effect on discharge loads of ortho-P, but an increase for mineral N (0.25 kg ha
−1yr
−1 vs. 1.0 kg ha
−1yr
−1 pre- and post-treatment respectively). Both of the other treatments (harvested and unburned, and un-harvested and burned) depicted a greater impact on discharge loads for both mineral N and ortho-P. Why the effect of combined treatments was comparatively less is uncertain, but may have been related to burn temperatures (
i.e., the harvested chipping residues left on the surface would have burned hotter causing greater volatilization of the mineral N) and ortho-P sorption onto newly exposed iron and aluminum silicate or oxide surfaces associated with the volcanic parent materials.
Table 5.
Comparison of estimated historic overland/litter interflow runoff nutrient loading with current conditions and as affected by wildfire [
22] and mechanical harvest/controlled fire [
63].
Table 5.
Comparison of estimated historic overland/litter interflow runoff nutrient loading with current conditions and as affected by wildfire [22] and mechanical harvest/controlled fire [63].
| | | Pre-Wildfire | | Post-Wildfire | | | |
|---|
| Location and Treatment | Estimated 1 Historic | | Unburned | | Unburned | | Burned | | | |
|---|
| Treatment | Mineral N | Ortho-P | Mineral N | Ortho-P | Mineral N | Ortho-P | Mineral N | Ortho-P | | |
|---|
| ---------- kg ha−1 yr−1 ----------- |
|---|
| Gondola Wildfire | 1.8 | 0.2 | 8.4 | 1 | 5.1 | 0.8 | 14.4 | 2.1 | | |
|---|
| 1 Estimated based on measured 93,200 kg ha−1 current litter mass and a model estimated litter mass of 25,320 kg ha−1 under the historic fire regime. |
| | | | | | Treatment | | | |
| | | Un-harvested | | Burned | | Harvested | | Unharvested |
| Location and | Estimated 2 Historic | | Unburned | | Harvested | | Unburned | | Burned |
| Treatment | Mineral N | Ortho-P | Mineral N | Ortho-P | Mineral N | Ortho-P | Mineral N | Ortho-P | Mineral N | Ortho-P |
| ---------- kg ha−1 yr−1 ----------- |
| North Shore | 0.06 | 0.05 | | | | | | | | |
| Mechanical and Controlled Burn | |
| Pre-Treatment | | | 0.2 | 0.1 | 0.2 | 0.1 | 0.4 | 0.4 | 0.8 | 0.3 |
| Post-Treatment | | | 0.3 | 0.3 | 1 | 0.2 | 2.8 | 0.3 | 2.8 | 0.5 |
| 2 Estimated based on measured 69,263 ka ha−1 current litter mass and a model estimated litter mass of 17,372 kg ha−1 under the historic fire regime. |
Estimating the nutrient discharge loads under historic conditions (
Table 5) is certainly much more speculative and must be interpreted with caution. We applied a litter mass ratio approach to the measured nutrient discharge load from the control plots (current conditions) at both study sites. Loupe
et al. [
37] reported a litter mass of 93,200 kg ha
−1 at the Gondola wildfire location, and unpublished data from the North Shore location indicated a current condition litter mass of 69,263 kg ha
−1. From the LANDIS-II model application previously discussed we were able to generate a model estimated litter mass for each location given a more historical fire regime. Model estimated values were 25,320 kg ha
−1 and 17,372 kg ha
−1 for Gondola (Jeffrey pine) and North Shore (mixed-conifer), respectively. Using the current conditions discharge loads from
Table 5 and presuming them to be generated from the respective current litter mass, we simply applied a linear extrapolation relative to the historic litter mass to estimate the historic overland/litter interflow runoff discharge loads of mineral N and ortho-P from both study sites. These are lower compared to current conditions and conceptually make sense.
7. Summary
Pre-settlement ecosystems in the upper watersheds of the Lake Tahoe Basin are estimated to have been typified by much smaller N and P nutrient pools in the biomass compared to their present day counterparts. Historical discharge/recharge water quality thus was likely comparatively more nutrient depleted, helping to facilitate the ultra-oligotrophic status of Lake Tahoe. Conversely, fire suppression has resulted in the decline of forest health, accumulation of extremely high fuel loads, thickened O horizons, and the increased risk of catastrophic wildfires [
36,
38,
71,
72].
An accumulating forest floor similar to that present in the eastern Sierra Nevada today sequesters nutrients and leads to the build-up of large nutrient pools in the biomass that provides for long term nutrient availability to surface waters [
21,
37,
39,
73]. Although the litter mass is a major sink for total nutrients, the mineralized nutrient content increases proportionately, thereby increasing the potential for discharge and transport through either leaching or by way of surface runoff or litter interflow. Alternatively, stand and forest floor replacing wildfire appears to cause a large magnitude nutrient mobilization [
22,
45,
74], resulting in a nutrient shock to discharge water quality (
Table 5). For this reason, mechanical harvest and controlled burning have become popular management strategies in the Sierra Nevada [
20,
55,
56,
57]; albeit little is known about how they impact overland/litter interflow discharge water quality.
The most ecologically significant long-term effects of controlled fire appear to be the loss of C and N from the forest floor. Although the application again appears to have an initial impact on overland/litter interflow nutrient loading (
Table 5), the effects over time are as yet unknown. Over the longer term, however, we believe controlled burning in conjunction with mechanical harvest may potentially improve runoff water quality by reducing N and P litter mass pools and improving the overall health of forest ecosystems without the danger of a stand replacing wildfire.
Finally, it would be remiss to neglect the ecosystem implications associated with climate change. Predictions for the next century include a 3°C rise in global temperatures and increasing global evaporation and precipitation, much of which is predicted to occur at northern latitudes [
59]. Predictions for changes in precipitation quantity and intensity are quite variable for the Sierra Nevada. One possible scenario is that precipitation events will increase in intensity leading to large scale flooding. Another is that the Lake Tahoe area will be subject to overall warmer temperatures and more evaporation/evapotranspiration, while increased precipitation will be more common further to the north outside of the basin [
66]. There is general agreement, however, that with warmer temperatures snow elevation levels will be higher. Current snow levels in the area typically range from above 5,000 feet during winter months. It is estimated that for every 1 °C rise in temperature, the snow level will rise approximately 500 ft [
66]. Since the Tahoe basin is located in the range of average snow levels, higher snow levels may mean less total snow pack for the Lake Tahoe region.
Climate change will most certainly influence the cycling of nutrients and productivity of forest ecosystems. Changes in N and P availability and transport are of special interest both because of water quality considerations, and also because they are typically limiting nutrients in terrestrial and aquatic ecosystems. The eastern Sierra Nevada and Lake Tahoe region are characterized by spatially and temporally uncoupled nutrient cycles that are created and driven by climatic conditions, and therefore will be strongly affected by climate change. Temporal uncoupling of the N and P cycles frequently occurs during snowmelt, where the release of N and P from snowpack, decomposing litter, and soil does not coincide with the period of maximum vegetation uptake. Furthermore, in most snow-dominated systems, the majority of nutrient release occurs during the early parts of snowmelt; albeit Johnson
et al. [
67] have found exactly the opposite in the Little Valley area of the eastern Sierra Nevada where the majority of nutrient release occurs during the later stages of snowmelt. The fate of these forest ecosystems in a changing climate will have a direct impact on forest health, fire hazard, biomass mitigation strategies, and water quality. A better understanding of changing nutrient cycles in these systems will assist forest managers in preparing defensible management plans and allow them to make predictions about the responses of these systems to natural (e.g., fire, insect attack, drought) and anthropogenic (air pollution, harvesting, climate change) perturbations.
In summary, further research on soils and nutrient cycles in undeveloped forests should be conducted whenever possible, and sites should be established to measure nutrient cycling, including inputs, such as plant-soil fluxes through litterfall, crownwash, and root turnover as well as losses from erosion, leaching, runoff, wind, or fire. In addition, high priority should be given to research that focuses on sites where a suitable control portion is available, especially if event (e.g., pre-wildfire or pre-treatment) data is available. The fate of these forest ecosystems in a changing climate will have a direct impact on forest health, fire hazard, biomass mitigation strategies, and water quality.
