Abstract
Plants produce above- and below-ground biomass. However, our understanding of both production and decomposition of below-ground biomass is poor, largely because of the difficulties of accessing roots. Below-ground organic matter decomposition studies are scant and especially rare in the tropics. In this study, we used a litter bag experiment to quantify the mass loss and nutrient dynamics of decomposing twigs and small roots from an arbuscular mycorrhizal fungal associated tree, Parashorea chinensis Wang Hsie, in a tropical rain forest in Southwest China. Overall, twig litter decomposed 1.9 times faster than small roots (decay rate (k) twig = 0.255, root = 0.134). The difference in decomposition rates can be explained by a difference in phosphorus (P) concentration, availability, and use by decomposers or carbon quality. Twigs and small roots showed an increase in nitrogen concentration, with final concentrations still higher than initial levels. This suggests nitrogen transfer from the surrounding environment into decomposing twigs and small roots. Both carbon and nitrogen dynamics were significantly predicted by mass loss and showed a negative and positive relationship, respectively. Our study results imply that small roots carbon and nitrogen increase the resident time in the soil. Therefore, a better understanding of the carbon cycle requires a better understanding of the mechanisms governing below-ground biomass decomposition.
1. Introduction
Litter production and decomposition represent the principle pathways of carbon and nutrient cycling in terrestrial ecosystems. However, these pathways are much better understood for the above-ground organs, as compared to below-ground ones [1]. This is mostly due to difficulties related to accessing and sampling below-ground litter materials [2,3]. Consequently, this has led to derivation of climate models and carbon cycle model parameters mainly based on studies of above-ground biomass [4]. This drawback impedes the accuracy and predictive power of such models. Nevertheless, from studies on above-ground litter materials, we know that decomposition is controlled by both abiotic and biotic factors [5,6].
While the main drivers of decomposition vary with respect to the litter types across biomes and among organs, litter quality is consistently one of the most important factors controlling litter decomposition [4]. A cross continental meta-analysis found that the C:N ratio, Ca, and lignin:N ratio were the most important determinants of root litter decomposition [7,8]. For example, Sun and colleagues recently showed that there was a contrast in the main quality traits that govern the decomposition of leaf litter and fine roots. Whereas lignin:N, C:N ratio, Mg, N, and Mn content were important determinants of leaf litter decomposition, none of these traits explained the decomposition of fine roots [9]. Meanwhile, a recent study found condensed tannins were a critical determinant of fine root decomposition [10]. On the other hand, for twig decomposition, recent research showed that C and P were important drivers of twig decomposition, with C exhibiting a negative relationship and P showing a positive one [11]. When compared to root decomposition, of the few studies that exist, beech twigs (Fagus sylvatica L.) were found to decompose faster than roots in a temperate forest. Slow decomposition of root was attributed to the inhibition of lignin decomposition by certain N compounds that block the activation of the ligninolytic enzyme. The blockage of this enzyme favors the formation of N rich humus at the expense of lignin degradation.
Studies often report the initial chemical composition of decomposing litter, including those on roots and twigs. However, studies rarely monitor the dynamics of nutrients during the course of decomposition [12]. Initial litter chemistry also depends on the size of the component plant organs, and litter size is negatively associated with decomposition rates [13]. This is partially due to the positive relationship between size and concentrations of recalcitrant constituents [12,14]. Relatively few studies have investigated the decomposition of different plant organs while controlling for litter size.
Different organs are specific with regards to the function they perform, which in turn controls their chemistry [15]. Twigs and small roots are the second most, and the most, distal parts of a tree, respectively. Twigs serve to mechanically support the leaves and act as a storage organ for nutrients and carbon. These are often reabsorbed by plants during leaf senescence and also allocated to the developing fruits during reproduction [16], whereas fine roots are responsible for water and nutrient absorption at the plant soil interface [17]. After the senescence of organs, organs exhibit specific signature in decomposition rates with an increased rate in the following order: coarse branches < twigs < leaves. Such a specific signature is mainly attributed to individual organ quality [11]. Some reports indicate that twigs decompose slowly as compared to coarse woody debris, and the presence of bark in twigs generally inhibits decomposition. Despite the large number of studies on the decomposition of terrestrial woody debris, relatively few have considered twig decomposition [3,11,15,18]. Moreover, there are a large number of studies on single organs or tissues, but far fewer on comparisons among organs (leaf vs. root, leaf vs. stem, stem vs. root, etc.). For example, even though small roots (first order roots, especially fine roots) exhibit short life spans, they have longer carbon residence times than larger diameter roots, at least in the temperate and sub-tropical biomes [19] with a handful of studies in the tropics [1,20,21]. However, the mechanisms underlying the slow decomposition of small roots are poorly understood [22].
To date, four potential hypotheses have been proposed that attempt to explain the mechanism behind slow small root decomposition. The first hypothesis, or mycorrhizal hypothesis, stipulates that small roots are protected by chitin formed by ectomycorrhizal (EM) fungi which impedes decomposition [23]. The second hypothesis, called the “C quality” hypothesis, states that regardless of whether trees are colonized by EM or arbuscular mycorrhizal (AM) fungi, tree roots harbor a higher proportion of insoluble or nonhydrolyzable components (e.g., suberin, tannins, and lignin) leading to slow decomposition. The third hypothesis concerns N concentration, the so-called “N inhibition” hypothesis, and posits that the high N content of fine roots combines with acid insoluble C to induce the formation of recalcitrant constituents [19]. Finally, the fourth hypothesis, attempts to reconcile the previous three, by suggesting that the fungal association determines the mechanism, and is called the “myco-quality” hypothesis [4]. The above hypotheses are derived from the existing work on small root decomposition which is largely restricted to temperate and subtropical species [9,11]. However, there is a need to understand whether these hypotheses remain valid across biomes and therefore can be generalized [4].
In this study, we tested only one of those hypotheses, the carbon hypothesis, through a standard litter bag study to investigate the decomposition of twigs and small roots (<5 mm in diameter (2–5 mm for twigs and 1–5 mm for small roots)) in a tropical tree. We standardized the size (<5 mm in diameter) of litter materials and aimed to elucidate (i) the decomposition patterns of small roots and twigs of Parashorea chinensis Wang Hsie, a tropical AM tree, (ii) the nutrient dynamics of these two litter materials, and (iii) the possible reasons causing any contrasting patterns of twig and root decomposition.
2. Materials and Methods
2.1. Study Site
This study was conducted at the Parashorea chinensis forest national park in Mengla county, Xishuangbanna, Yunnan Province, China (21°37′39″ N, 101°35′24″ E; 650 m above sea level) (Figure 1). The slope and aspect of the study site are 20–25° and SW15°, respectively. The climatic conditions of this forest are typical monsoonal conditions. According to the long term data of the Mengla meteorological station situated approximately 20 km from the study site, the 40-year mean annual temperature was 21.3 °C (ranging from a minimum of 15.8 °C in January to a maximum of 25.6 °C in June). Annual mean precipitation is 1511 mm and on average 85% of this precipitation occurs during the rainy season from May to October. Latosol soils are dominant at this research site and have an average pH of around 5.5. The soil organic matter in the top 10 cm layer comprises ~2.91% whereas for the subsequent layer (10–25 cm) it is around 2.01%. The dominant vegetation type is lowland tropical rain forest, Parashorea chinensis forest, which is a type of mono-dominant rain forest [24,25]. Such forest is rich in plant species and shows a complex forest canopy structure. Details of the plant species composition and community characteristics of the forest was described in detail by Zhu [24].
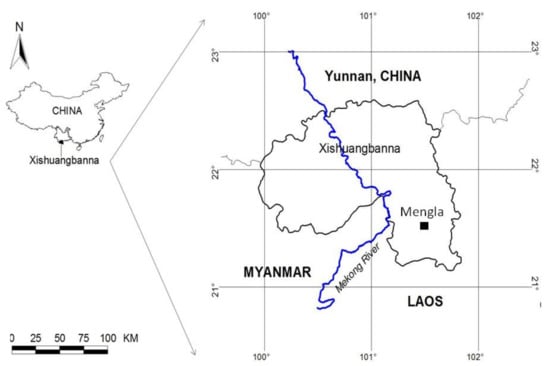
Figure 1.
Study site location.
2.2. Litter Materials and Litter Bag Preparation
In 2003, we uprooted five recently felled (within a week informed by park regular guards) individuals of Parashorea chinensis, and partitioned the biomass of these trees into the above- and below-ground fractions and by organ, in order to investigate decomposition of above vs. below-ground biomass. To monitor litter decomposition of twigs (2–5 mm in diameter) and small roots (1–5 mm in diameter). A threshold of 2 mm in diameter is usually recommended to partition roots in different groups (0 < fine roots size ≤ 2 mm, 2 mm < small/medium size ≤ 5 mm, 5 mm < coarse roots size ≤ 10 mm, and larger ≥ 10 mm) [1]. We used nylon litter bags, sized 20 cm by 30 cm, for twigs (length = 10 cm) with 1 mm mesh size (50 g fresh litter per bag) and 20 cm by 15 cm with a mesh size 0.5 mm for root (10 g fresh litter per bag). Such mesh sizes, while allowing meso- and micro-fauna to enter the litter bags, excludes macro-invertebrates including, for example, termites [26]. The different sizes and mesh size of the bags could potentially affect the rate of decomposition, which we discuss in the discussion section [27]. We established a small common garden litter bed 100 m × 50 m in size. Litter bags for twigs were incubated on the forest floor while those for root decomposition were buried at 20 cm in the soil. Litter bags were placed at 5 m intervals. We employed 5 replicates per harvest time and had 12 harvest times (90, 181, 273, 360, 457, 545, 639, 731, 821, 912, 1004, 1093 days incubation). Therefore, in total, 120 litter bags (5 replicates × 2 sample type (small root and twig) × 12 harvesting times) were used. Additional litter material was used to calculate moisture content and dry weight of the initial materials. Twig litter bags were filled with, on average, 33.7 ± 0.002 g (mean ± SE, n = 60), while fine root litter bags were filled with 7.62 ± 0.002 g (mean ± SE, n = 60). At harvesting, there was no evidence that termites entered any of the litter bags. At each collection, five replicates of each litter material were retrieved from the forest floor and removed from soil in the case of root litter bags, and transported in Ziploc plastic bags to the laboratory. Upon arrival in the laboratory, every litter bag was gently cleaned to remove any soil and herbs or grass roots, and the remaining material in the litter bag was gently washed with tap water before transferring it to a paper envelope. Litter material was oven dried at 105 °C to constant mass. Measurements of mass were made at 0.01 g precision with an electronic balance.
2.3. Chemical Analysis
At the initial installation of the litter bags, extra materials of each litter type were used after filling litter bags in the laboratory to determine water content. Afterwards, these were ground into powder before chemical analysis. Likewise, at each harvest the litter material remaining in the litter bags was dried at 105 °C to constant mass and analyzed for chemical content. For these analyses, materials from replicates of the same litter type were pooled together to form a composite sample to reduce the costs of the chemical analysis. Analyzing the chemical content at each harvest time enables monitoring of the dynamics of nutrients during the decomposition process. Total carbon (C), nitrogen (N), phosphorus (P), potassium (K), Calcium (Ca), and magnesium (Mg) contents were determined using standard methods. Briefly, C and N were quantified with a Vario Max CN element analyzer (Elementar Analsensysteme GmbH, Langenselbold, Germany). For P and K, samples were mixed with HCl and digested with HNO3-HClO4 and measurements were made using an inductively coupled plasma (ICP) atomic emission spectrometer (iCAP 6300, IRIS Advantage, E R, Thermo Fisher Scientific, Waltham, MA, USA). For Ca and Mg, samples were prior digested with both H2O2 and concentrated HNO3 and afterwards their Ca and Mg concentrations were measured by a Thermal Jarell ICP (Scientific Instrument Services, Inc., Ringoes, NJ, USA).
2.4. Data Analysis
All the statistical analyses were done using R version 3.4.3 (R-Foundation for statistical computing, Vienna, Austria) [28]. We used a single negative exponential model with the decay constant rate k [29]. Though we acknowledge the issues related to the use of such a model, we believe the small size of the litter material involved in our current experiment fully supports its use [30]. For computing the decay rate constant for both fine roots and twigs, we used the following equation [31]:
where Mt represents dry mass at harvest time, t is the number of days of incubation, Mo is the dry mass at time zero, 365.25 converts days to years, and k is the decay rate constant (per year). We computed k by employing a non-linear least squared (nls) regression using the function nls implemented in the “nlme” package [18,32]. We calculated percentage mass loss for each bag at each harvest. We used a generalized least squares (function gls in the “nlme” package) to model the percent mass loss (logit transformed) [33] from twigs and small roots. We used litter type as a factor. We employed the argument variance identity (varIdent) function to allow variances to change with regards to sample type (twig and small root). We performed a principal component analysis (PCA) with the function prcomp after scaling all the chemical elements to determine the chemical elements that explain most of the variation in the concentrations of chemical elements across samples. PCA is an ordination method that consists of reducing multivariate data onto a few uncorrelated key axes, called principal components. Each principal component is in a sense a linear combination of all of variables from the original data, but with each original variable contributing to a certain amount of variation in the data explained by the components. Principal components are uncorrelated with each other however; they summarize the variation in the original data. Variables in the original data usually come with different ranges and perhaps different units, therefore it is necessary to standardize these variables prior to performing a PCA analysis. For doing so, we used the function scale. Scaling performs a standardization of data by computing standardized values which are generated by subtracting from the original variable value the sample mean, and subsequently dividing the resulted difference by the sample standard deviation. As such, scaling helps to compare variables that were not in the same units and/or same range. We also used linear modeling with the function lm to assess the relationship between carbon and nitrogen concentrations and percentage mass loss. In order to monitor the dynamics of C and N through decomposition, we computed the fraction of initial C and N remaining [3,22].
3. Results
3.1. Decomposition Dynamics and Decay Rate
By the end of the experiment, the percentage mass loss for twigs and small roots was on average 97% ± 0.98% (94.2–99.1%) and 82.2% ± 4.65% (80.7–89.6%), respectively. Overall, twig litter decomposed 1.9 times faster than small root litter (decay rate twig = 0.26 vs. root = 0.13) (Table 1, Figure 2). However, the variation in small root decomposition was larger than that for twig decomposition.

Table 1.
Comparison of percentage of mass loss (logit transformed) from twigs and small roots of Parashorea chinensis Wang Hsie during decomposition monitored in a tropical rain forest in Mengla county, Xishuangbanna, China over a period of 1093 days. Percentage mass loss (logit transformed) was modeled as function of incubation time (number of days), sample type (twigs and small root), and two-way interaction. The intercept includes the baseline level of sample type (twig).
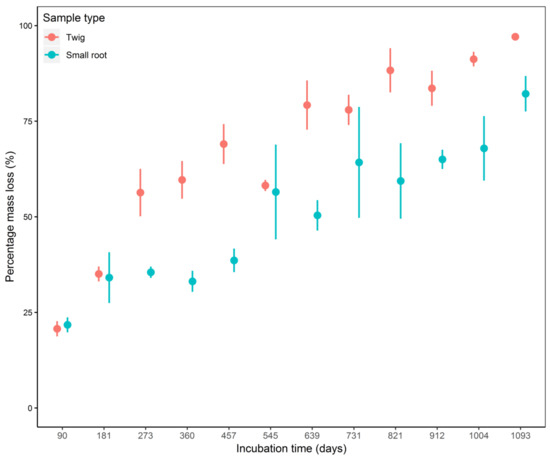
Figure 2.
Percentage mass loss for twig and small root litter of Parashorea chinesnsis Wang Hsie litter monitored through a litter bag experiment for 1093 days in Mengla county, Xishuangbanna, China. Red = twigs; blue = small root. Dots represent the mean for samples collected at each harvest and error bars represent the standard errors (n = 5).
3.2. Initial Chemistry and Nutrient Dynamics during Decomposition
The initial concentrations of N, P, K, Ca, and Mg were higher in twigs than in fine roots (Table 2), and C concentration and C:N ratio were lower in twigs than in small roots. Looking at the chemical dynamics through the decomposition process, the magnitude of C, P, and K loss was higher in twigs than in small roots, and the magnitude of the relative increase in N and Mg was higher in twigs than in small roots. In both materials the C:N ratio declined up to 1004 days incubation and thereafter started to increase (Table 2).
Table 2.
Initial chemistry and chemical dynamics in twigs and small roots from Parashorea Chinensis Wang Hsie litter monitored during the course of decomposition (for 1093 days) in Mengla county, Xishuangbanna, China. Values are laboratory duplicate averages.
For the principal component analysis (PCA), we found that the first two axes combined explained almost all (91.49% with first axis: PCA1 explaining 61.56% vs. second axis: PCA2 29.93%) the variation in the litter chemistry dynamics, as measured from the initial litter through to the end of the decomposition process (Table 2, Figure 3). On the first axis, C, N, Mg, and Ca contributed most to the chemical concentrations variation explained by this axis, likewise, P and K contributed most to the variation explained by the second PCA axis. Twigs chemical elements concentration dynamics were equally much varied on both PCA axes, while those of the roots were much varied on the first PCA axis with much less variation on the second axis. C, Ca, N, Mg, P, and K were the most important elements in explaining variation chemistry among the litter materials through time.
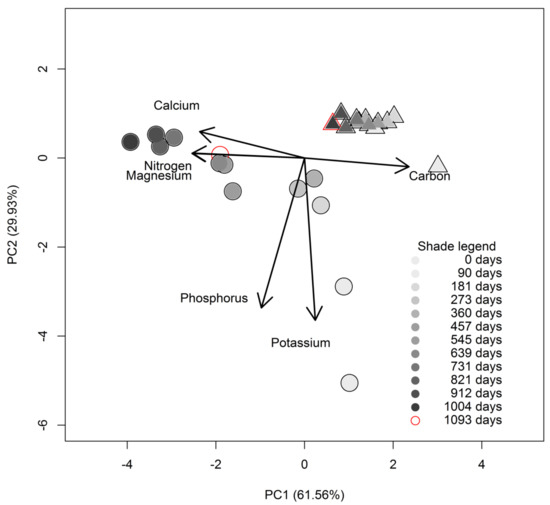
Figure 3.
Principal components analysis (PCA) of the chemical contents of twig (circle symbol) and small root (triangle symbol) litter from Parashorea chinensis Wang Hsie through the decomposition process. The degree of shading indicates how long the materials have been incubated. The lightest grey represents the starting point (0 days), the darkest grey the second last point (1004 days), and the empty symbol the last collection (after 1093 days incubation). Materials were incubated in a common litter-bed on the rain forest floor at Mengla county, Xishuangbanna, China. Note that the contribution of magnesium and nitrogen in explaining the variation of nutrients concentration during decomposition is the same so their respective arrows are overlapping. Also due to overlapping, we use red color to show the last collection point.
The C concentration dynamics of decomposing twigs and small roots were similar during decomposition. However, the decline in C concentration was more pronounced in twigs than in small roots. By the end of the experiment, twigs had lost 25% compared to 21.5% for roots of the initial fraction (Figure 4). With regard to N, there was a marked increase in N concentration through the decomposition process. There was three phases in N dynamics for roots: Increase phase (0 to 360 days), stabilization phase (360 to 731 days), and second increase phase (731 to 1093 days). For twigs, two phases were distinguishable: Increase phase (0 to 912 days) and decrease phase (912 to 1093 days). From 360 days until 912 days incubation, the rate was more pronounced in twigs than in small roots. However, soon after this point (912 days), the N concentration declined sharply in twigs and was stable for small roots. At the end of the monitoring period, the N concentration in both materials reached more or less the same level but was still 193% and 194% of initial levels for twigs and small roots, respectively (Figure 4).
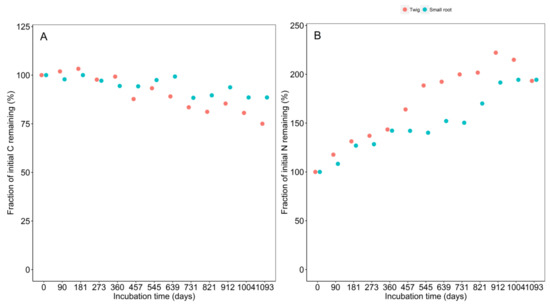
Figure 4.
Temporal dynamics in (A) the concentration of carbon (C) and (B) nitrogen (N) in litter materials of Parashorea chinensis Wang Hsie monitored for 1093 days in Mengla county, Xishuangbanna, China. Twig = red; small root = blue. Dots represent pooled analyses of replicates (n = 5) harvested at each point in time.
3.3. Relationship between Decomposition and C and N Concentrations Dynamics
An increase in percentage mass loss is inversely linked to C concentration, with a given mass loss inducing a more substantial decrease in C in the twigs than in small roots. Conversely, N concentration is positively associated to percentage mass loss. Again as decomposition proceeds, the increase in N concentration is higher in twigs than in roots (Figure 5).
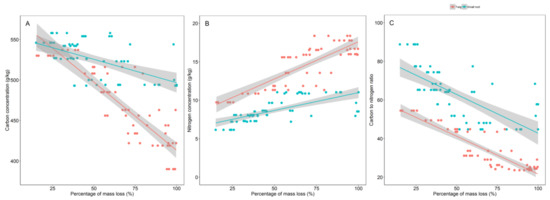
Figure 5.
Relationship between percentage mass loss and (A) carbon concentration, (B) nitrogen concentration, and (C) carbon to nitrogen ratio for twigs (red dots) and small roots (blue dots) of Parashorea chinensis Wang Hsie over 1093 days in Mengla county, Xishuangbanna, China. Dots represent mass loss from each litter bag but chemical concentrations were analyzed from pool samples (n = 5) of the litter bags harvested at each point in time.
4. Discussion
In the present study, we set up a standard litter bag experiment to examine the patterns of twig and fine root decomposition in an AM tree, Parashorea chinensis Wang Hsie, in a tropical rain forest in SW China. We also monitored nutrient concentration dynamics in the decomposing litter over a three-year period. We found that twigs decomposed faster than small roots and that C and N concentration had a negative and positive relationship, respectively, with percentage mass loss regardless to the litter substrate.
4.1. Decomposition Dynamics and Decay Rate
Twigs decomposed faster than small roots in our study and the percentage mass loss at the end of the experiment was 97% (k = 0.26) and 82% (k = 0.13), respectively. This finding is consistent with some other reports from temperate biomes [3,11,15] and from tropical biomes [1,20]. However, this does not corroborate with the finding from Garrett et al. (2012), where roots decomposed faster than stems and branches (roots and branches size > 10 mm, these were large in size compared to ours). In terms of decay rates for roots, our values were much less than the ones reported for Hopea roots in Thailand (dry evergreen forest), which had a k between 0.55 and 1.27 (2 mm < roots size ≤ 5 mm) [21], and in India (0.58–1.16) (1 mm < roots size ≤ 10 mm) [1]. However, this latter study used larger root diameters. Similarly for twigs, our measured decay rate was less than previously reported for branches in India (0.55–0.66) [1]. Among the previous studies, to our knowledge, only one study controlled for the size (diameter) of litter material, and they found that across the three different sizes they used, roots decomposed slower than twigs [3]. The difference in the decomposition rate of twigs and roots might arise for several reasons. First, it could be related to the contrasting use of P by decomposers. Indeed, the initial concentration of P in twigs is ~6 fold higher than that of roots. By the end of the experiment, the magnitude of the difference was only 2 fold, with the P concentration in roots relatively unchanged through the decomposition process. It has been suggested that the availability of P potentially limits decomposition, especially root decomposition [20].
Second, although there was initially more carbon in small root litter, this carbon seems to be poorer in quality or unavailable, perhaps because this carbon includes some from the root’s AM fungi which is usually poor in quality. This supports the “C quality” hypothesis in explaining why small roots decompose much slower than twigs [19]. Also, it is possible that the structure of the decomposing material affects the rate of decomposition, but such mechanisms are not well understood at the moment. Third, slower decomposition of roots compared to twigs might be due to inhibition of saprophytes by mycorrhizal fungi [4]. Moreover, Beidler and Pritchard argued that a protein named glomalin, a hydrophobic constituent of AM fungi, might cause slower decomposition of small roots [23]. Fourth, the higher concentration of N in twigs compared to small roots is also a potential explanation. Indeed, previous studies suggest that the higher the initial N concentration, the faster the decomposition [26].
As mentioned in the methods section, the difference in mesh size we used could have direct and also indirect effects on decomposition rates [27]. Whereas the twigs, which were incubated in litter bags with a mesh size of 1 mm, our root litter was incubated in bags with 0.5 mm mesh. However, the fraction of meso-fauna that could enter a 1 mm mesh bag, but not a 0.5 mm bag, is quite small and does not include any functional groups that are considered important in the decomposition of woody materials. Termites are the most important decomposers of woody material, among macro- and meso-faunal components, in sub-and tropical forests and there was no evidence that termites entered the bags. Hence, it seems unlikely that the differences found in decomposition rates between twigs and small roots were an effect of differences in fauna consumption generated by the difference in litter bag mesh size. Although this is not the first time different mesh sizes have been used to compare the decomposition of different organs (see [11,15]), in the future care should be taken to standardize litter bags when the intention is to compare decomposition rates among organs. Likewise, a complete treatment is needed to fully make claim about possible factors/mechanisms behind the differences found in the decomposition of twigs and small roots. Our study used a relative standardization of substrate size (≤5 mm in diameter) due to the scarcity of dead litter and our intentional avoidance of mixing dead substrate with living substrate as mixing would have yielded confusing results. Confusing results could rise simply if an individual type of substrate is governed by opposing decomposition drivers (drivers of living substrate opposite or different from those of naturally dead substrate). Indeed, previous studies showed a ~30% resorption of N to occur before roots senescence [23] and references therein. Finally, we acknowledge that having incubated the twigs at the forest floor and small roots 20 cm deep in the soil could have resulted in some differences in decomposition rates due to differences in microclimate. However, knowing that the use of litter bags is itself already a disturbance caused to roots by separating them from their rhizosphere soil realm [34], and also because we intended to mimic nature settings, we had made a compromise of burying root litter bags within the soil at 20 cm depth where these roots are likely to be formed, lived, dead, and decomposed. This suggests that there are still methodical challenges to tackle in roots decomposition ecology.
4.2. Initial Chemistry and Nutrients Dynamics during Decomposition
Higher initial N in roots compared to other plant organs is commonly reported [1,35]. However, we found the opposite in our study with the initial nitrogen concentration of fine roots being lower than that of twigs in Parashorea chinensis. Lower N in small roots may indicate a strong limiting factor for decomposers [22]. However, there was an increase in N concentrations in both materials up to 1004 days incubation. N concentration after 36 months incubation for beech and ash was in the range of 150–225% of the initial levels for twigs and 90–125% for small roots [3]. In our experiment it was around 180% of initial levels in both materials. These dynamics in N concentration through the decomposition process reflect nitrogen translocation from the surrounding environment into the decomposing materials. Other authors have found that N levels revert to the initial level after three years of monitoring [36].
Conversely, small roots showed higher concentrations of C than that of twigs. Lalnunzira and Tripathi found a consistently higher C concentration in branches (>10 mm in diameter) than in small roots in Indian tropical, successional forests, which varied in age from five years to mature forest [1]. The difference between their findings and ours may reflect the difference in the size of litter materials. Our twigs were 5 mm diameter, whereas the branches they studied were over 10 mm diameter. In our study, the value of the initial C:N ratio was 98 for roots and 63 for twigs. Theoretically, a C:N ratio higher than 75 results in slow decomposition due to a higher content of recalcitrant constituents, such as lignin and tannin [7]. This may partly explain the difference in decomposition rates observed between small roots and twigs. Our value for root was higher than that reported for forests in India, where the value ranged from 38 to 68, but twigs were of a similar value to that for branches (10 mm diameter) in the Indian study (62–64) [1]. In both materials, the C:N ratio continuously declined through the decomposition process up to 1004 days incubation, as has been found in other studies [26], but thereafter the C:N ratio increased.
Finally, it was interesting to see the potential importance of Ca and Mg in explaining the variation in nutrient dynamics in both small root and twigs. These two elements constitute micro-nutrients and belong to actually the second major axis of plant chemical variation [37]. Ca is known to intervene in enhancing Nitrogen transfer by fungi while Mg represents an essential element in invertebrates’ diet. In lack of lignin, for example, cell walls always contain much pectin which is soluble in water and harbors substantial amount of Ca. Mg concentration on the other hand is related to epidermal cells. Thus both Ca and Mg are considered cell structural elements. Moreover, cell walls friction is positively linked to concentration of Ca and Mg during both decomposition [38] and digestibility [37]. Therefore substrates with higher Ca and Mg tend to have soluble cell walls, soft tissues and easily decomposable and digestible. Our results reflect the important role of these elements in decomposition and corroborate with previous studies [37,38].
4.3. Relationship between Decomposition and C and N Dynamics
We found that C concentration was negatively correlated with percentage mass loss, whereas N concentration was positively correlated with percentage mass loss. There was also a significant effect of material type. Twigs showed the most pronounced decline and increase, respectively. A study of Pinus radiata D. Don decomposition in New Zealand found that C concentration did not vary with mass loss, but N concentration increased with percentage mass loss [39]. While studying the dynamics of carbon in roots and branches (size of branches and roots were > 10 mm, larger size than ours) these authors did not find any significant difference among organs, but there was an overall decline in C concentration during decomposition. The dampened C dynamics in small root in our study may reflect differences in the way C is immobilized compared to coarse roots. Another study from a temperate biome also observed a rapid accumulation of N in twigs compared to small roots [3]. However, some studies have not found a monotonic relationship between N dynamics and mass loss. Instead, they found an increase in N concentration up to a peak after 6 months, and thereafter a decline [1]. One study even found a consistent decline in N concentration with mass loss [20].
5. Conclusions
We monitored the decomposition of twigs and small roots over three years for a tropical AM tree. We found that twigs decomposed faster than small roots, although initial C concentration was higher in small roots. Both materials showed an increase in N concentration which did not revert to initial levels even after three years incubation. Whereas the C concentration of litter materials decreased throughout the monitoring period, with a more pronounced decrease in twigs. The difference in P use, as well as potential poor quality of C in roots may explain the differences found in the decomposition rates of fine roots and twigs. Percentage mass loss significantly predicted the dynamics of both C and N concentration throughout the course of decomposition. Our finding supports the “C quality” hypothesis and also points to the importance of Ca and Mg in driving the decomposition of organic materials. Further study is needed to confirm these findings among other tree species in tropical biomes and will help to generalize our current understanding of root decomposition, as well that of other neglected organs. A greater understanding of below and above of biomass turnover is needed to improve our current models of C and nutrient cycling.
Author Contributions
Conceptualization, J.-W.T.; methodology, J.-W.T. and X.-T.L.; formal analysis, G.G.O.D., Y.Q.J. and R.D.H.; investigation, J.-W.T.; resources, J.-W.T.; writing—original draft preparation, G.G.O.D.; writing—review and editing, G.G.O.D., R.D.H., X.-T.L. and J.-W.T.; project administration, J.-W.T.; funding acquisition, J.-W.T.
Funding
This research was funded by the National Natural Science Foundation of China (NSFC), grant numbers 39800024, 30370247, 3181101433, 31470546, and the APC was funded by 39800024.
Acknowledgments
The authors would like to acknowledge the support from the Field Station program of CERN; the Biogeochemistry Laboratory of the Xishuangbanna Tropical Botanical Garden for elemental analysis, the following National Natural Science Foundation of China (NSFC) grants 39800024, 30370247 to JT, 3181101433 to G.D., and 31470546 to R.H. The authors express their gratitude to Yun Lu and De-Fu Chen for helping with field work and material preparation in the laboratory, as well as to the guest editor. G.D. would like to recognize the great financial support from the Bureau of International Cooperation, CAS-President International Fellowship Initiative (PIFI) 2019 #2019FYB0001 and 2017PC0035, China postdoc foundation grant #2017M613021, and to thank Chen Lulu for her words of encouragement.
Conflicts of Interest
The authors declare no conflicts of interest. The funders had no role in the design of the study; in the collection, analyses, or interpretation of data; in the writing of the manuscript, and in the decision to publish the results.
References
- Lalnunzira, C.; Tripathi, S.K. Leaf and root production, decomposition and carbon and nitrogen fluxes during stand development in tropical moist forests, north-east India. Soil Res. 2018, 56, 306–317. [Google Scholar] [CrossRef]
- Ma, Z.; Guo, D.; Xu, X.; Lu, M.; Bardgett, R.D.; Eissenstat, D.M.; McCormack, M.L.; Hedin, L.O. Evolutionary history resolves global organization of root functional traits. Nature 2018, 555, 94–97. [Google Scholar] [CrossRef]
- Scheu, S.; Schauermann, J. Decomposition of roots and twigs: Effects of wood type (beech and ash), diameter, site of exposure and macrofauna exclusion. Plant Soil 1994, 163, 13–24. [Google Scholar] [CrossRef]
- Beidler, K.V.; Pritchard, S.G. Maintaining connectivity: Understanding the role of root order and mycelial networks in fine root decomposition of woody plants. Plant Soil 2017, 420, 19–36. [Google Scholar] [CrossRef]
- Cornwell, W.K.; Cornelissen, J.H.C.; Amatangelo, K.; Dorrepaal, E.; Eviner, V.T.; Godoy, O.; Hobbie, S.E.; Hoorens, B.; Kurokawa, H.; Pérez-Harguindeguy, N.; et al. Plant species traits are the predominant control on litter decomposition rates within biomes worldwide. Ecol. Lett. 2008, 11, 1065–1071. [Google Scholar] [CrossRef]
- Cornelissen, J.H.C.; Sass-Klaassen, U.; Poorter, L.; van Geffen, K.; van Logtestijn, R.S.P.; van Hal, J.; Goudzwaard, L.; Sterck, F.J.; Klaassen, R.K.W.M.; Freschet, G.T.; et al. Controls on coarse wood decay in temperate tree species: Birth of the LOGLIFE experiment. Ambio 2012, 41 (Suppl. 3), 231–245. [Google Scholar] [CrossRef] [PubMed]
- Silver, W.L.; Miya, R.K. Global patterns in root decomposition: Comparisons of climate and litter quality effects. Oecologia 2001, 129, 407–419. [Google Scholar] [CrossRef]
- Luo, D.; Cheng, R.; Shi, Z.; Wang, W. Decomposition of leaves and fine roots in three subtropical plantations in China affected by litter substrate quality and soil microbial community. Forests 2017, 8, 412. [Google Scholar] [CrossRef]
- Sun, T.; Hobbie, S.E.; Berg, B.; Zhang, H.; Wang, Q.; Wang, Z.; Hättenschwiler, S. Contrasting dynamics and trait controls in first-order root compared with leaf litter decomposition. Proc. Natl. Acad. Sci. USA 2018, 115, 10392–10397. [Google Scholar] [CrossRef] [PubMed]
- Dong, L.; Mao, Z.; Sun, T. Condensed tannin effects on decomposition of very fine roots among temperate tree species. Soil Biol. Biochem. 2016, 103, 489–492. [Google Scholar] [CrossRef]
- Zuo, J.; Hefting, M.M.; Berg, M.P.; van Logtestijn, R.S.P.; van Hal, J.; Goudzwaard, L.; Liu, J.C.; Sass-Klaassen, U.; Sterck, F.J.; Poorter, L.; et al. Is there a tree economics spectrum of decomposability? Soil Biol. Biochem. 2018, 119, 135–142. [Google Scholar] [CrossRef]
- Berg, B.; Mcclaugherty, C. Plant Litter: Decomposition, Humus Formation, Carbon Sequestration, 3rd ed.; Springer: Berlin/Heidelberg, Germany; New York, NY, USA; Dordrecht, The Netherlands; London, UK, 2014; ISBN 9783642388200. [Google Scholar]
- Van Geffen, K.G.; Poorter, L.; Sass-Klaassen, U.; van Logtestijn, R.S.P.; Cornelissen, J.H.C. The trait contribution to wood decomposition rates of 15 Neotropical tree species. Ecology 2010, 91, 3686–3697. [Google Scholar] [CrossRef]
- Harmon, M.E.M.; Franklin, J.F.J.; Swanson, F.J.; Sollins, P.; Gregory, S.V.; Lattin, J.D.; Anderson, N.H.; Cline, S.P.; Aumen, N.G.; Sedell, J.R.; et al. Ecology of coarse woody debris in temperate ecosystems. Adv. Ecol. Res. 1986, 15, 133–302. [Google Scholar]
- Freschet, G.T.; Aerts, R.; Cornelissen, J.H.C. A plant economics spectrum of litter decomposability. Funct. Ecol. 2012, 26, 56–65. [Google Scholar] [CrossRef]
- Ichie, T.; Igarashi, S.; Yoshida, S.; Kenzo, T.; Masaki, T.; Tayasu, I. Are stored carbohydrates necessary for seed production in temperate deciduous trees? J. Ecol. 2013, 101, 525–531. [Google Scholar] [CrossRef]
- Eissenstat, D.M.; Wells, C.E.; Yanai, R.D.; Whitbeck, J.L. Building roots in a changing environment: Implications for root longevity. New Phytol. 2000, 147, 33–42. [Google Scholar] [CrossRef]
- Dossa, G.G.O.; Schaefer, D.; Zhang, J.-L.; Tao, J.-P.; Cao, K.-F.; Corlett, R.T.; Cunningham, A.B.; Xu, J.-C.; Cornelissen, J.H.C.; Harrison, R.D. The cover uncovered: Bark control over wood decomposition. J. Ecol. 2018, 106, 2147–2160. [Google Scholar] [CrossRef]
- Fan, P.; Guo, D. Slow decomposition of lower order roots: A key mechanism of root carbon and nutrient retention in the soil. Oecologia 2010, 163, 509–515. [Google Scholar] [CrossRef]
- Bloomfield, J.; Vogt, K.A.; Vogt, D.J. Decay rate and substrate quality of fine roots and foliage of two tropical tree species in the Luquillo Experimental Forest, Puerto Rico. Plant Soil 1993, 233–245. [Google Scholar] [CrossRef]
- Fujimaki, R.; Takeda, H.; Wiwatiwitaya, D. Fine root decomposition in tropical dry evergreen and dry deciduous forests in Thailand. J. For. Res. 2008, 13, 338–346. [Google Scholar] [CrossRef]
- Xiong, Y.; Fan, P.; Fu, S.; Zeng, H.; Guo, D. Slow decomposition and limited nitrogen release by lower order roots in eight Chinese temperate and subtropical trees. Plant Soil 2013, 363, 19–31. [Google Scholar] [CrossRef]
- Adam Langley, J.; Chapman, S.; Hungate, B.A. Ectomycorrhizal colonization slows root decomposition: The post-mortem fungal legacy. Ecol. Lett. 2006, 9, 955–959. [Google Scholar] [CrossRef] [PubMed]
- Zhu, H. Research of community ecology on Shorea chinensis forest in Xishuangbanna. Acta Bot. Yunnanica 1992, 14, 237–258, (Chinese with English abstract). [Google Scholar]
- Cao, M.; Zhang, J.-H. Tree species diversity of tropical forest vegetation in Xishuangbanna, SW China. Biodivers. Conserv. 1997, 6, 995–1006. [Google Scholar] [CrossRef]
- Swift, M.J.; Heal, O.W.; Anderson, J.M. Decomposition in Terrestrial Ecosystems; University of California Press: Berkeley, CA, USA, 1979. [Google Scholar]
- Bradford, M.A.; Tordoff, G.M.; Eggers, T.; Jones, T.H.; John, E.; Newington, J.E. Microbiota, Fauna, and Mesh Size Interactions in Litter Decomposition in litter fauna, and mesh size interactions decomposition. Oikos 2002, 99, 317–323. [Google Scholar] [CrossRef]
- R Foundation for Statistical Computing R: A Language and Environment for Statistical Computing; R Foundation for Statistical Computing: Vienna, Austria, 2018; ISBN 3900051070.
- Olson, J.S. Energy Storage and the Balance of Producers and Decomposers in Ecological Systems. Ecology 1963, 44, 322–331. [Google Scholar] [CrossRef]
- Cornwell, W.K.; Weedon, J.T. Decomposition trajectories of diverse litter types: A model selection analysis. Methods Ecol. Evol. 2014, 5, 173–182. [Google Scholar] [CrossRef]
- Oberle, B.; Covey, K.R.; Dunham, K.M.; Hernandez, E.J.; Walton, M.L.; Young, D.F.; Zanne, A.E. Dissecting the Effects of Diameter on Wood Decay Emphasizes the Importance of Cross-Stem Conductivity in Fraxinus americana. Ecosystems 2018, 21, 85–97. [Google Scholar] [CrossRef]
- Pinheiro, J.; Bates, D.; Debroy, S.; Sarkar, D.; Team, R.D.C. nlme: Linear and Nonlinear Mixed Effects Models; R Package Version 3.1-101; R Foundation for Statistical Computing: Vienna, Austria, 2013. [Google Scholar]
- Warton, D.I.; Hui, F.K.C. The arcsine is asinine: The analysis of proportions in ecology. Ecology 2011, 92, 3–10. [Google Scholar] [CrossRef] [PubMed]
- Dornbush, M.E.; Isenhart, T.M.; Raich, J.W. Quantitying fine-root decomposition: An alternative to burried litterbags. Ecology 2002, 83, 2985–2990. [Google Scholar] [CrossRef]
- Berg, B.; Mcclaugherty, C. Decomposition of Fine Root and Woody Litter. In Plant Litter; Springer: Berlin, Heidelberg, 2008. [Google Scholar]
- Goebel, M.; Hobbie, S.E.; Bulaj, B.; Zadworny, M.; Archibald, D.D.; Oleksyn, J.; Reich, P.B.; Eissenstat, D.M. Decomposition of the finest root branching orders: Linking belowground dynamics to fine-root function and structure. Ecol. Monogr. 2011, 81, 89–102. [Google Scholar] [CrossRef]
- Mladkova, P.; Mladek, J.; Hejduk, S.; Hejcman, M.; Pakeman, R.J. Calcium plus magnesium indicates digestibility: The significance of the second major axis of plant chemical variation for ecological processes. Ecol. Lett. 2018, 21, 885–895. [Google Scholar] [CrossRef]
- García-Palacios, P.; Mckie, B.G.; Handa, I.T.; Frainer, A.; Hättenschwiler, S. The importance of litter traits and decomposers for litter decomposition: A comparison of aquatic and terrestrial ecosystems within and across biomes. Funct. Ecol. 2015, 30, 819–829. [Google Scholar] [CrossRef]
- Garrett, L.G.; Kimberley, M.O.; Oliver, G.R.; Pearce, S.H.; Beets, P.N. Decomposition of coarse woody roots and branches in managed Pinus radiata plantations in New Zealand—A time series approach. For. Ecol. Manag. 2012, 269, 116–123. [Google Scholar] [CrossRef]
© 2019 by the authors. Licensee MDPI, Basel, Switzerland. This article is an open access article distributed under the terms and conditions of the Creative Commons Attribution (CC BY) license (http://creativecommons.org/licenses/by/4.0/).