
Comparative Analysis of Machine Learning-Based Predictive Models for Fine Dead Fuel Moisture of Subtropical Forest in China
1
Key Laboratory of Poyang Lake Wetland and Watershed Research, Ministry of Education, Jiangxi Normal University, Nanchang 330022, China
2
Key Laboratory of Natural Disaster Monitoring, Early Warning and Assessment of Jiangxi Province, Jiangxi Normal University, Nanchang 330022, China
3
School of Geography and Environment, Jiangxi Normal University, Nanchang 330022, China
*
Author to whom correspondence should be addressed.
Forests 2024, 15(5), 736; https://doi.org/10.3390/f15050736
Submission received: 22 March 2024
/
Revised: 16 April 2024
/
Accepted: 21 April 2024
/
Published: 23 April 2024
(This article belongs to the Special Issue Forest Disturbance and Management)
Abstract
:The moisture content of fine dead surface fuel in forests is a crucial metric for assessing its combustibility and plays a pivotal role in the early warning, occurrence, and spread of forest fires. Accurate prediction of the moisture content of fine dead fuel on the forest surface is a critical challenge in forest fire management. Previous research on fine surface fuel moisture content has been mainly focused on coniferous forests in cold temperate zones, but there has been less attention given to understanding the fuel moisture dynamics in subtropical forests, which limits the development of regional forest fire warning models. Here, we consider the coupled influence of multiple meteorological, terrain, forest stand, and other characteristic factors on the fine dead fuel moisture content within the subtropical evergreen broadleaved forest region of southern China. The ability of five machine learning algorithms to predict the moisture content of fine dead fuel on the forest surface is assessed, and the key factors affecting the model accuracy are identified. Results show that when a single meteorological factor is used as a forecasting model, its forecasting accuracy is less than that of the combined model with multiple characteristic factors. However, the prediction accuracy of the model is improved after the addition of forest stand factors and terrain factors. The model prediction ability is the best for the combination of all feature factors including meteorology, forest stand, and terrain. The overall prediction accuracy of the model is ordered as follows: random forest > extreme gradient boosting > support vector machine > stepwise linear regression > k-nearest neighbor. Canopy density in forest stand factors, slope position and altitude in terrain factors, and average relative air humidity and light intensity in the previous 15 days are the key meteorological factors affecting the prediction accuracy of fuel moisture content. Our results provide scientific guidance and support for understanding the variability of forest surface fuel moisture content and improved regional forest fire warnings.
1. Introduction
Uncontrolled forest fires can seriously damage or even destroy the structure and function of forest ecosystems, and they also pose a threat to the safety of human life and property [1]. In recent years, with the warming of climate and the intensification of human activities, forest fires have become more frequent worldwide [2,3,4,5]. For example, Canada suffered an unprecedented forest fire in 2023, with more than 6000 individual fires recorded over an area of more than 170,000 square kilometers [6]. When the moisture content of fine dead surface fuel (including dead leaves, thin branches, dead grass, needles, etc.) is low, the fuel becomes relatively dry with a lower ignition point, thereby increasing susceptibility to forest fire. The moisture content directly affects the ignition potential and behavior of forest fires; hence, it serves as a core reference index of regional forest fire warnings. For example, the surface fine fuel moisture content is an essential parameter within forest fire warning systems implemented in Canada and the United States [7,8].
There are many methods to predict the moisture content of fine dead forest surface, including equilibrium moisture content, remote sensing estimation, meteorological element regression, and the process model. The equilibrium moisture content method combines the advantages of both the physical process and the statistical model, incorporating only air temperature and relative air humidity as environmental factors. However, its key parameters need to be obtained through experiments, which is greatly affected by the environment and requires extensive work in large-scale application [9,10,11]. The remote sensing estimation method is suitable for the prediction of fuel moisture content in forest canopies. But remote sensing has limited observation ability under the forest canopy, so its prediction accuracy is low [12,13]. The meteorological element regression method is simple in design, but it is limited by the physical and chemical properties of the fuel itself and the study area, and the spatio-temporal extrapolation effect is usually poor [14,15]. The process model is based on physical descriptions, which is difficult to apply in practice because of its complexity [16,17].
Machine learning algorithms can describe complex nonlinear relationships between independent variables and dependent variables, and can be considered both process models and statistical models. Such methods have found extensive recent application in many fields, including fuel moisture content prediction [18,19]. Fan et al. analyzed the dynamic changes and driving factors of typical dead surface fuel moisture content in the cold temperate zone of northeast China and compared the performance of machine learning algorithms with traditional equilibrium moisture content prediction models [14]. Miller et al. estimated the surface fuel moisture content of the continental United States by establishing a temporal convolutional network [20]. Capps et al. estimated the fuel moisture content in California by establishing a random forest model [21]. Typical models used for predicting fuel moisture content include random forest (RF), support vector machine (SVM), extreme gradient boosting (XGB), k-nearest neighbor (KNN), and stepwise linear regression (StepLm). Each of these models have their own advantages and disadvantages in parameter input and algorithm operation. For example, the linear regression method is simple and easy to explain and has high computational efficiency. It works well when there is a linear relationship between features and targets. However, it is unable to deal with nonlinear relationships, is sensitive to outliers, and needs to meet linear regression assumptions [15,19]. Random forest uses decision trees to reduce the overfitting risk of regression, can handle high-dimensional data and large-scale features, and provides feature importance assessment. However, some interpretability is lost, and it is difficult to adjust the model parameters [15]. Support vector machines can deal with nonlinear problems and can adapt to different types of data by selecting appropriate kernel functions. However, for complex nonlinear relationships, it may be necessary to select appropriate kernel functions and parameters, and the computational complexity is high, especially for large data sets [22]. Most previous approaches only use a single model, and there are relatively less studies that comprehensively compare multiple machine learning algorithms; thus, how different machine learning models differ in the prediction of fuel moisture content is unknown.
Prediction models of fuel moisture content based on meteorological factors have been previously established [23]. However, the moisture content of fine dead fuel is easily affected by many non-meteorological factors such as terrain and forest stand, and these may have indirect or direct interactions. For example, topographic features (slope gradient, aspect, slope position, and altitude) affect the moisture content of fine dead fuel by controlling the light, air temperature, precipitation, and heat conditions in the forest [24,25]. Forest stand factors (canopy density, tree height, diameter at breast height, etc.) can indirectly affect the moisture content of fine dead fuel by affecting the structure of the forest ecosystem [26,27]. In addition, there are local environmental differences in forests due to the differences in terrain and vegetation. Even under the same meteorological conditions (air temperature, relative air humidity, wind speed and illumination intensity, etc.) in different vegetation and terrain conditions, the impact on the moisture content is different. The influence of meteorological factors on the fuel moisture content is typically at a time lag [18,28]. Therefore, better fuel moisture content prediction models can be constructed by considering the coupled impact of meteorological, terrain, and forest stand factors.
The bulk of previous research on fuel moisture content focuses on cold temperate coniferous forests and Mediterranean climate forest areas [14,15,29]. The subtropical zone, which accounts for 11% of the global forest area [30], is one of hardest hit by forest fires [31]. Subtropical forest fires in China, the United States, Australia, and other countries have become more frequent in recent years [1,32,33], with annual forest losses of about 3.9 million hectares, accounting for about 18% of the world total forest loss [34]. China accounts for 21.7% of the global subtropical forest area, and about 84% of forest fires in China occur in subtropical regions [31].
Here, we consider the Gannan area of southern China, which has significant subtropical forest coverage, and a variety of machine learning algorithms are used to construct prediction models of fine dead fuel moisture content. Our approach involves:
(1) Employing a variety of machine learning algorithms including the stepwise linear regression method (StepLm), random forest (RF), k-nearest neighbor (KNN), support vector machine (SVM), and extreme gradient boosting (XGB) to explore the ability of different machine learning algorithms to predict the fine dead fuel moisture content on the surface of Pinus massoniana forests.
(2) Construction of different feature factor combination Schemes to compare the effects of different parameters on the prediction of fine dead surface fuel moisture content.
(3) Evaluating the relative importance of variables in each machine learning algorithm and analyzing the contribution rate of variables for each fuel moisture content prediction model.
2. Materials and Methods
2.1. Study Area
Our research domain in the south of Jiangxi Province, China (Gannan region), is located in N, E, with a total area of 39,379.6 square kilometers (Figure 1). The study area belongs to the subtropical monsoon humid climate, characterized by four distinct seasons, an average annual air temperature of 19.3 °C, and an average annual precipitation of 1568.8 mm. Over the past 20 years (2003–2023), there has been a decrease in average annual precipitation and an increase in temperatures, leading to drier meteorological conditions from 2021 to 2023 within the timeframe of this study (Figures S1 and S2 of Supplementary Materials). The terrain is mainly mountainous and hilly, with an average altitude of 300–500 m. The population density in the Gannan region is as high as 227 people per square kilometer, and the road network is well developed.
Gannan is one of the typical distribution areas of subtropical evergreen broad-leaved forest, and the forest coverage rate is 76.2%. The main vegetation types are Pinus massoniana, Cumninghamia lanceolata, Schima superba, Liquidambar formosana and Phyllostachys heterocycla. Coniferous forests account for 64.2% of the total forest volume, and broad-leaved forests account for 28.5% of the total forest volume [35].
Pinus massoniana is a large area of artificial coniferous forest planted in subtropical areas of China, with an area of about 9280 square kilometers, accounting for 36% of the total area of regional forests [36]. Pinus massoniana has low foliar moisture content and high pine oil content, making it highly susceptible to forest fires. Once a fire occurs, it easily and quickly spreads, forming large fires which can be extremely difficult to control. Pinus massoniana fires in the Gannan area account for 32.7% of the total number of forest fires.
2.2. Data Acquisition
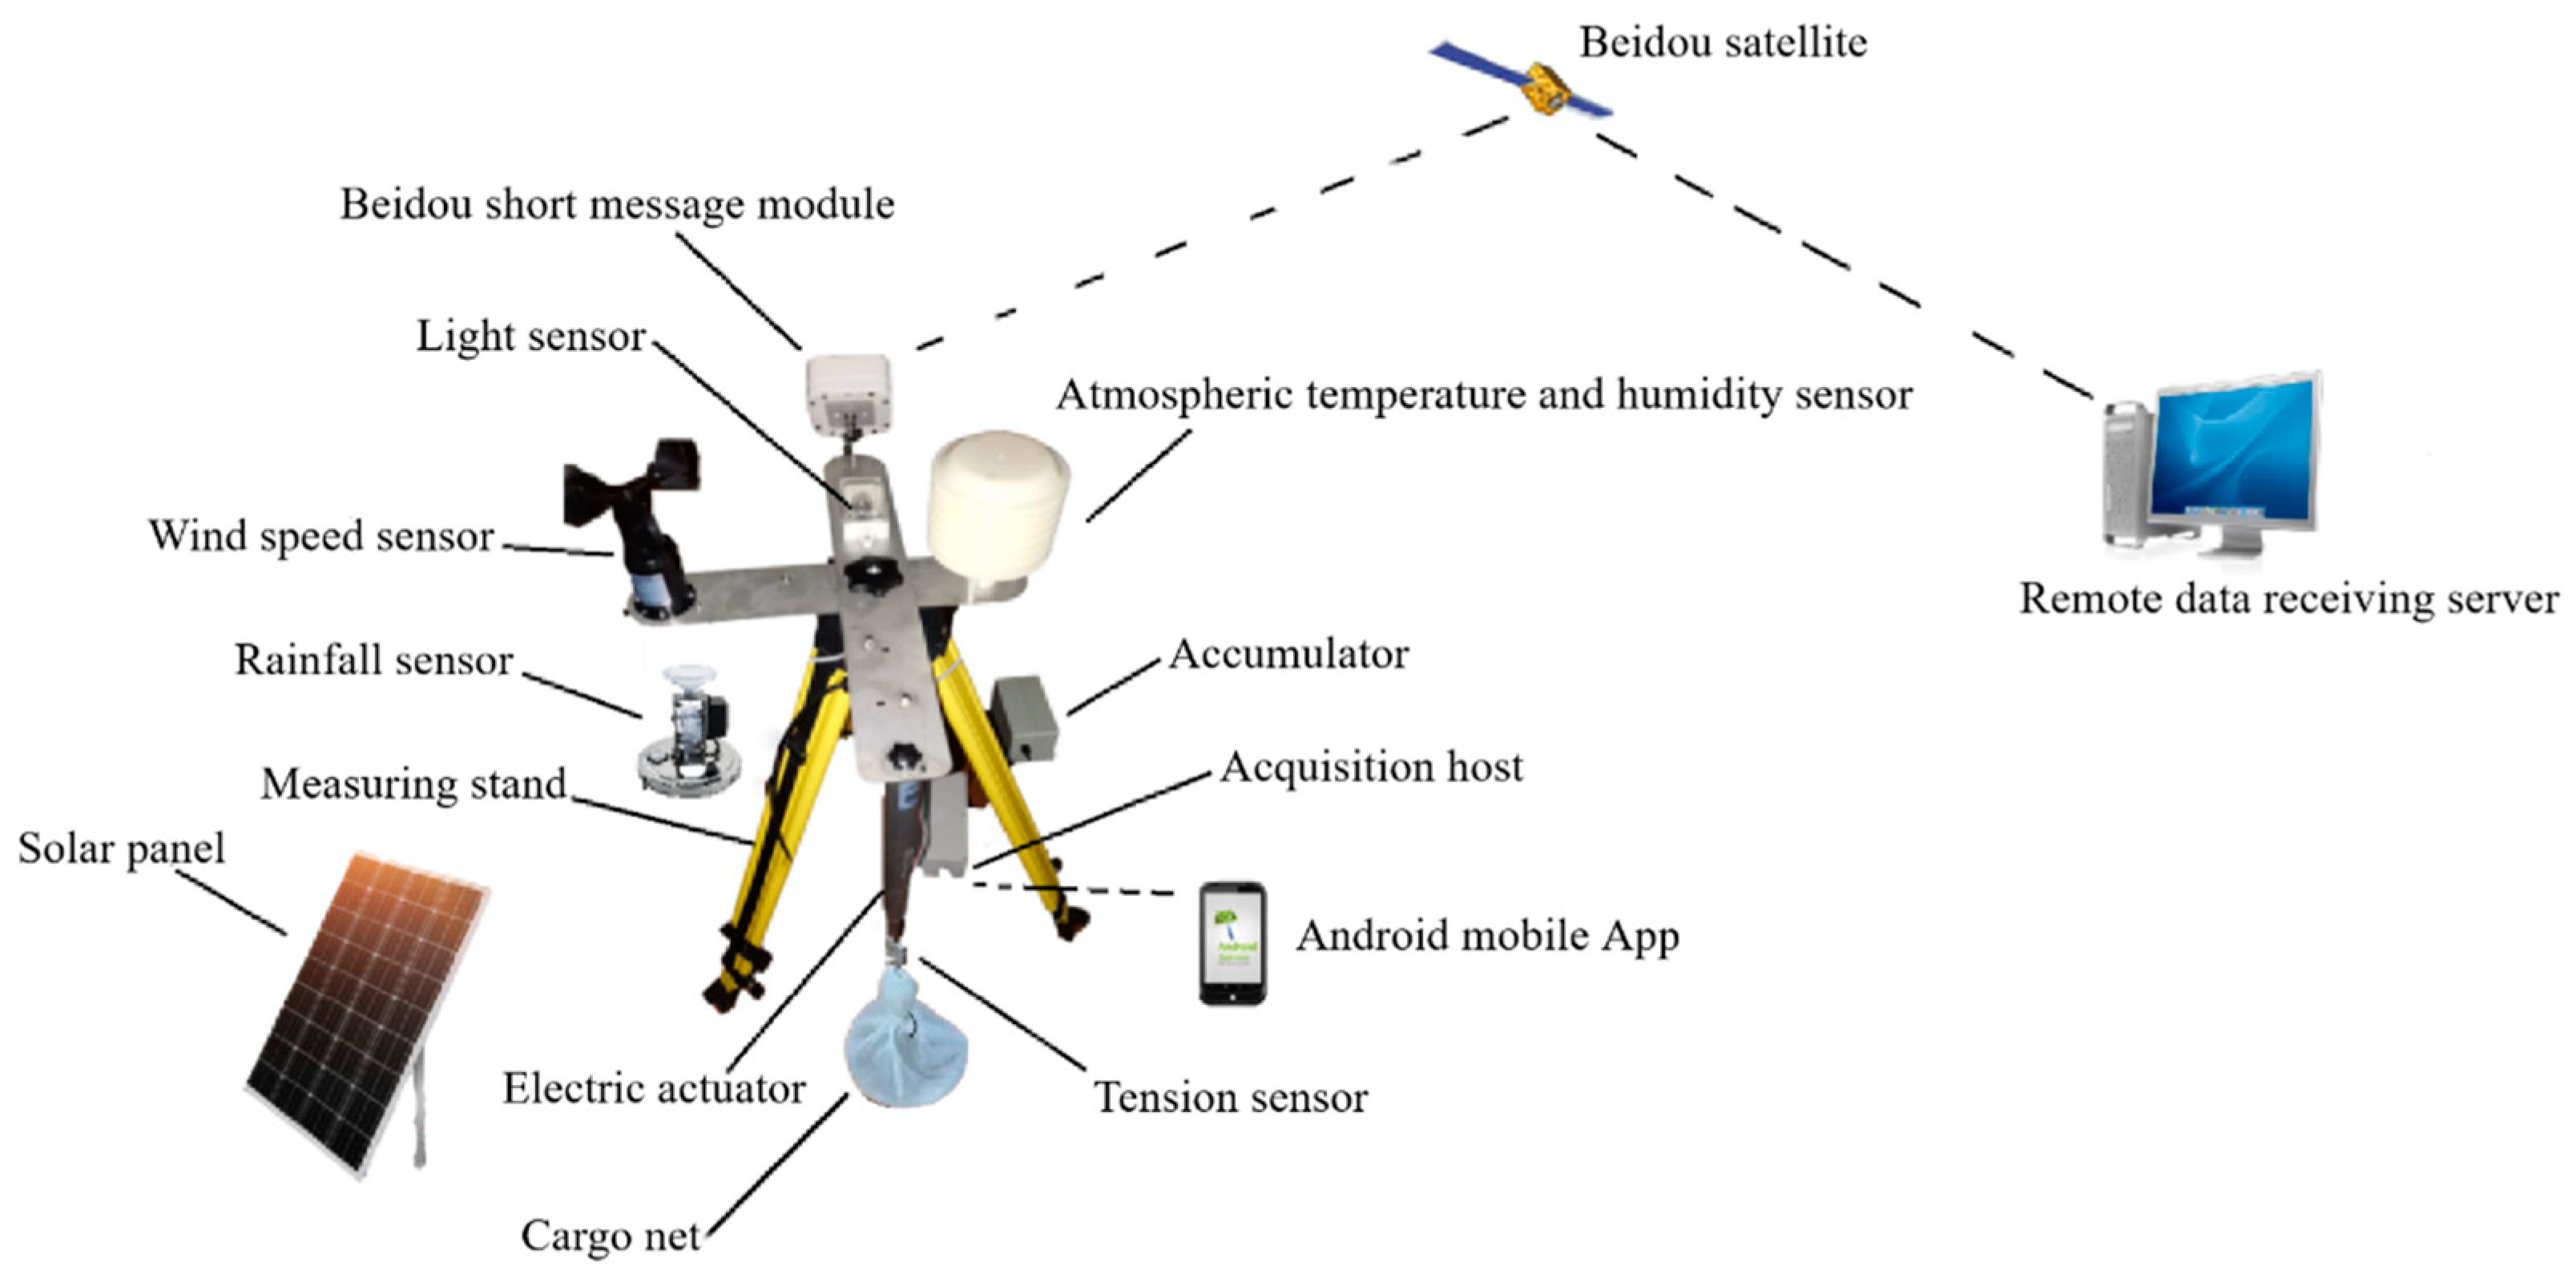
Five monitoring plots of Pinus massoniana forest are selected in Gannan. From July 2021 to August 2023, at a time step of 2 h, the meteorological conditions and moisture content of fine dead surface fuel (composed of dead surface herbs and branches with diameter less than 0.64 cm) were monitored in real time by using an automatic moisture content monitor. The automatic monitor of fuel moisture content is fixed by a tripod and a weighing push-pull rod, which consists of a tension sensor and a weighing cargo net. The sensors for monitoring wind, temperature, and humidity as well as light are placed on the device (Figure 2). The wet mass (g), air temperature (°C), atmospheric relative humidity (%), wind speed (m/s), and light intensity (lux) of fine dead fuel are collected synchronously and automatically. The data are collected by the acquisition host, while the fuel loading and meteorological data can be obtained through the Android mobile phone app or Beidou satellite transmission. The entire device is powered by an accumulator and a solar panel to ensure continuous operation of the monitoring device [37].
In the study plot, a 50 cm × 50 cm quadrat is set up with the monitor as the center, and an automatic moisture content monitor is installed. The fine dead surface fuel collected in the field is dried to constant weight in advance using an oven, and its dry weight is recorded. Then, it is packed into a nylon cargo net. The lower part is in contact with the soil surface while leaving the upper part uncovered. This non-destructive placement on the ground mimics natural conditions and ensures water vapor exchange with the surrounding environment. Periodically, a high-precision tension sensor automatically lifts and measures the wet mass of the sample for continuous monitoring of moisture content. Regular maintenance of equipment includes checking and replacing any rotten samples, as well as ensuring reliability and integrity of experimental data collection.
The formula of fuel moisture content is
where is the fuel moisture content, is the wet mass of fuel, and is the dry mass of fuel.
After removing the missing data caused by instrument failure, a total of 13,700 sets of fuel moisture content data of Pinus massoniana are collected during the sampling period (Table 1).
With the automatic moisture content monitor as the center, a 20 m × 20 m quadrate is set to obtain the forest stand and terrain factor information of the monitoring plots (Table 2). The forest stand information is mean height (m), mean diameter at breast (cm), mean first stalk height (m), and canopy density (%). Terrain information includes altitude (m), slope position (upper, middle, and lower), and slope gradient (°) aspect. The aspect is divided into eight grades; the larger the number, the sunnier it is: 1 is north, 2 is northeast, 3 is northwest, 4 is east, 5 is west, 6 is southeast, 7 is southwest, and 8 is south. The slope position is divided into 3 levels: lower, middle, and upper; 1 is the down slope, 2 is the middle slope, and 3 is the upper slope.
2.3. Feature Factor Screening
The feature factors considered are meteorology, terrain, and forest stand. Because the influence of air temperature, relative air humidity, wind speed, and light on the change in fuel moisture content has a time lag, 48 average meteorological factors in the last m hours (m = 0, 2, 4 … 24) and 16 average meteorological factors in the last n days (n = 3, 5, 7, 15) are selected for a total of 64.
There is likely a high degree of collinearity between meteorological characteristic factors. The collinearity between explanatory variables may distort model estimation or interfere with simulation estimation accuracy, which makes its parameter estimation unstable, and it is difficult to evaluate the relative importance of feature factors. Therefore, a variance inflation factor (VIF) analysis is used to exclude meteorological factors with high collinearity (VIF > 5) [38]. Out of 64 meteorological factors, 13 meteorological factors are ultimately selected (Table 3).
2.4. Feature Factor Combination Scheme
Four combination Schemes are constructed using the various meteorology, terrain, and forest stand factors (Table 4). A separate meteorological factor is used to establish a model and explore the prediction accuracy of fuel moisture content (Scheme 1). After adding the forest stand and terrain factors to the meteorological factors, we determine whether the prediction accuracy of the fuel moisture content is improved (Scheme 2 and Scheme 3). The meteorology, forest stand, and terrain factors are then combined to explore the change in prediction accuracy of fuel moisture content (Scheme 4).
2.5. Prediction Model
The sample data set is randomly divided into 70% for training and 30% for testing. Taking meteorological, forest stand, and terrain as independent variables, five machine learning algorithms including stepwise linear regression (StepLm), random forest (RF), k-nearest neighbor (KNN), support vector machine (SVM), and extreme gradient boosting (Xgboost) are constructed to predict fine dead fuel moisture content.
The stepwise liner regression method (StepLm) is a generalization of univariate linear regression analysis. The principle is that after introducing all independent variables into the equation, according to the degree of influence of independent variables on dependent variables, a correlation significance test coefficient is used to eliminate the independent variables without significance. The independent variables with statistical significance are selected, and regression models are established to reflect the correlation between multiple independent variables and dependent variables [14,15]. Stepwise linear regression is based on the ‘MASS’ package in the R-project.
Random forest (RF) is an ensemble learning method widely used in regression and classification problems. It integrates the prediction results of multiple randomized decision trees and obtains the final prediction results by voting or averaging [15,39]. Random forest can overcome the complex nonlinear relationship between multi-factor and different dimension data. It has high prediction accuracy, faster learning speed, and good tolerance to outliers and noise [21,40]. This study uses the ‘randomForest’ package in the R-project to construct a random forest model.
K-nearest neighbors (KNN) is a commonly used supervised learning algorithm. The classification or prediction is based on the similarity between instances, that is, the decision is made based on the characteristics of the sample and the label of the nearest k neighbors [41]. The basic idea of the KNN algorithm is, for an unknown sample, to calculate its distance from each sample in the training data set and select the k neighbors that are closest to it. Then, voting or weighted voting is performed according to the labels of these k neighbors, and the sample is assigned to the majority class [42]. For the regression problem, the average of k neighbors can be used as the predicted value. The k-nearest neighbor algorithm is based on the ‘class’ package in the R-project.
Support vector machine (SVM) is a classifier developed based on statistical theory. The core goal is to find an optimal hyperplane to clearly separate different classes of data points in N-dimensional space while maximizing the spacing between this hyperplane and data points [22,39]. It has great advantages in solving nonlinear and high-dimensional pattern sample recognition, effectively overcoming the ‘dimensional disaster’ and other problems to a large extent. Support vector machine is established by using the ‘kernlab’ package in the R-project.
Extreme gradient boosting (XGB) is an ensemble learning model based on the gradient boosting decision tree algorithm. It is an efficient, flexible, and extensible machine learning algorithm with strong predictive performance and nonlinear mapping ability. It is often used to solve problems such as classification and regression, and has been widely used in data mining, recommendation systems, and other fields [42]. Extreme gradient boosting is built using the ‘xgboost’ package in the R-project.
A 10-fold cross-validation (CV) of the ‘caret’ package in the R-project is used for all machine learning algorithms to evaluate the performance of the model. The train function in the ‘caret’ package is used to optimize the parameters of RF, KNN, SVM, and XGB in different Schemes [43].
2.6. Model Evaluation
The mean absolute error (MAE), root mean square error (RMSE), and coefficient of determination (R2) are used as the criteria for evaluating the performance of the fuel moisture content prediction model and the comparison of feature factor combination Schemes:
where represents the number of samples, represents the measured value of fuel moisture content (%), represents the predicted value of the fuel moisture content (%), represents the average value of the measured value of the fuel moisture content.
3. Results
3.1. Parameter Selection and Accuracy Comparison of Machine Learning Algorithms
The optimization results of RF, KNN, SVM, and XGB parameters in different Schemes are shown in Table S1. The fitting equation of the model in StepLm is shown in Table S2.
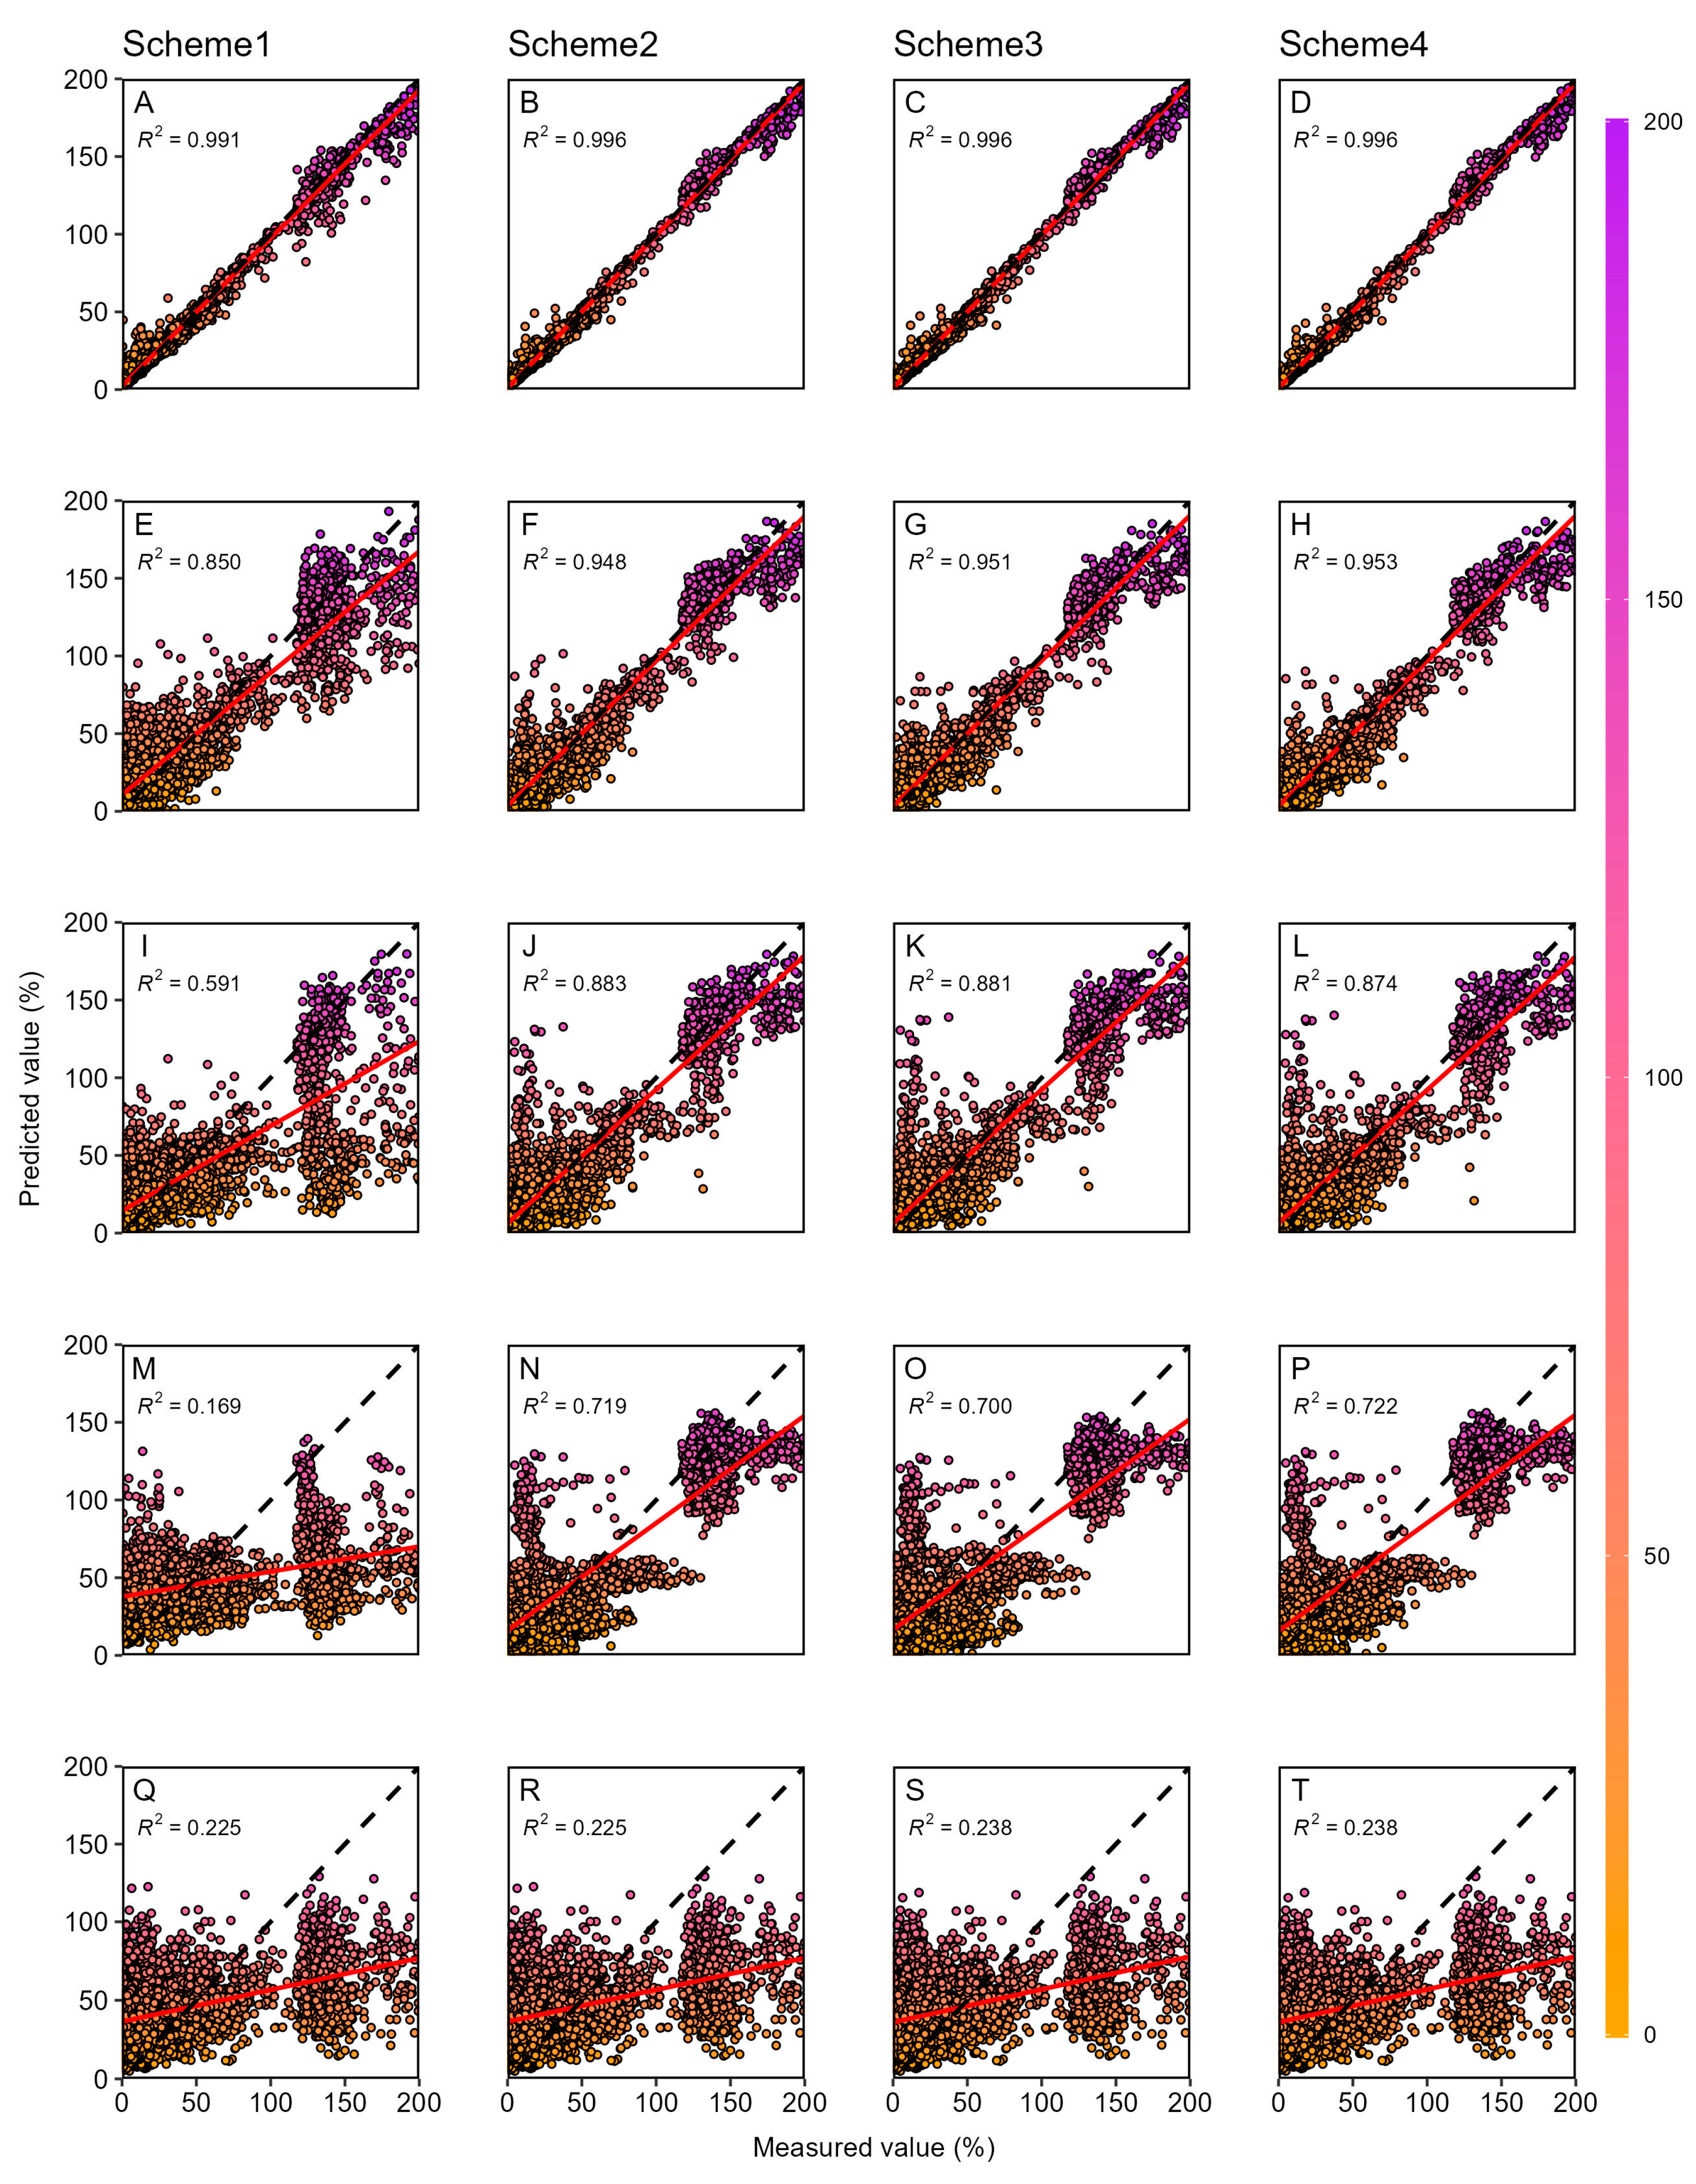
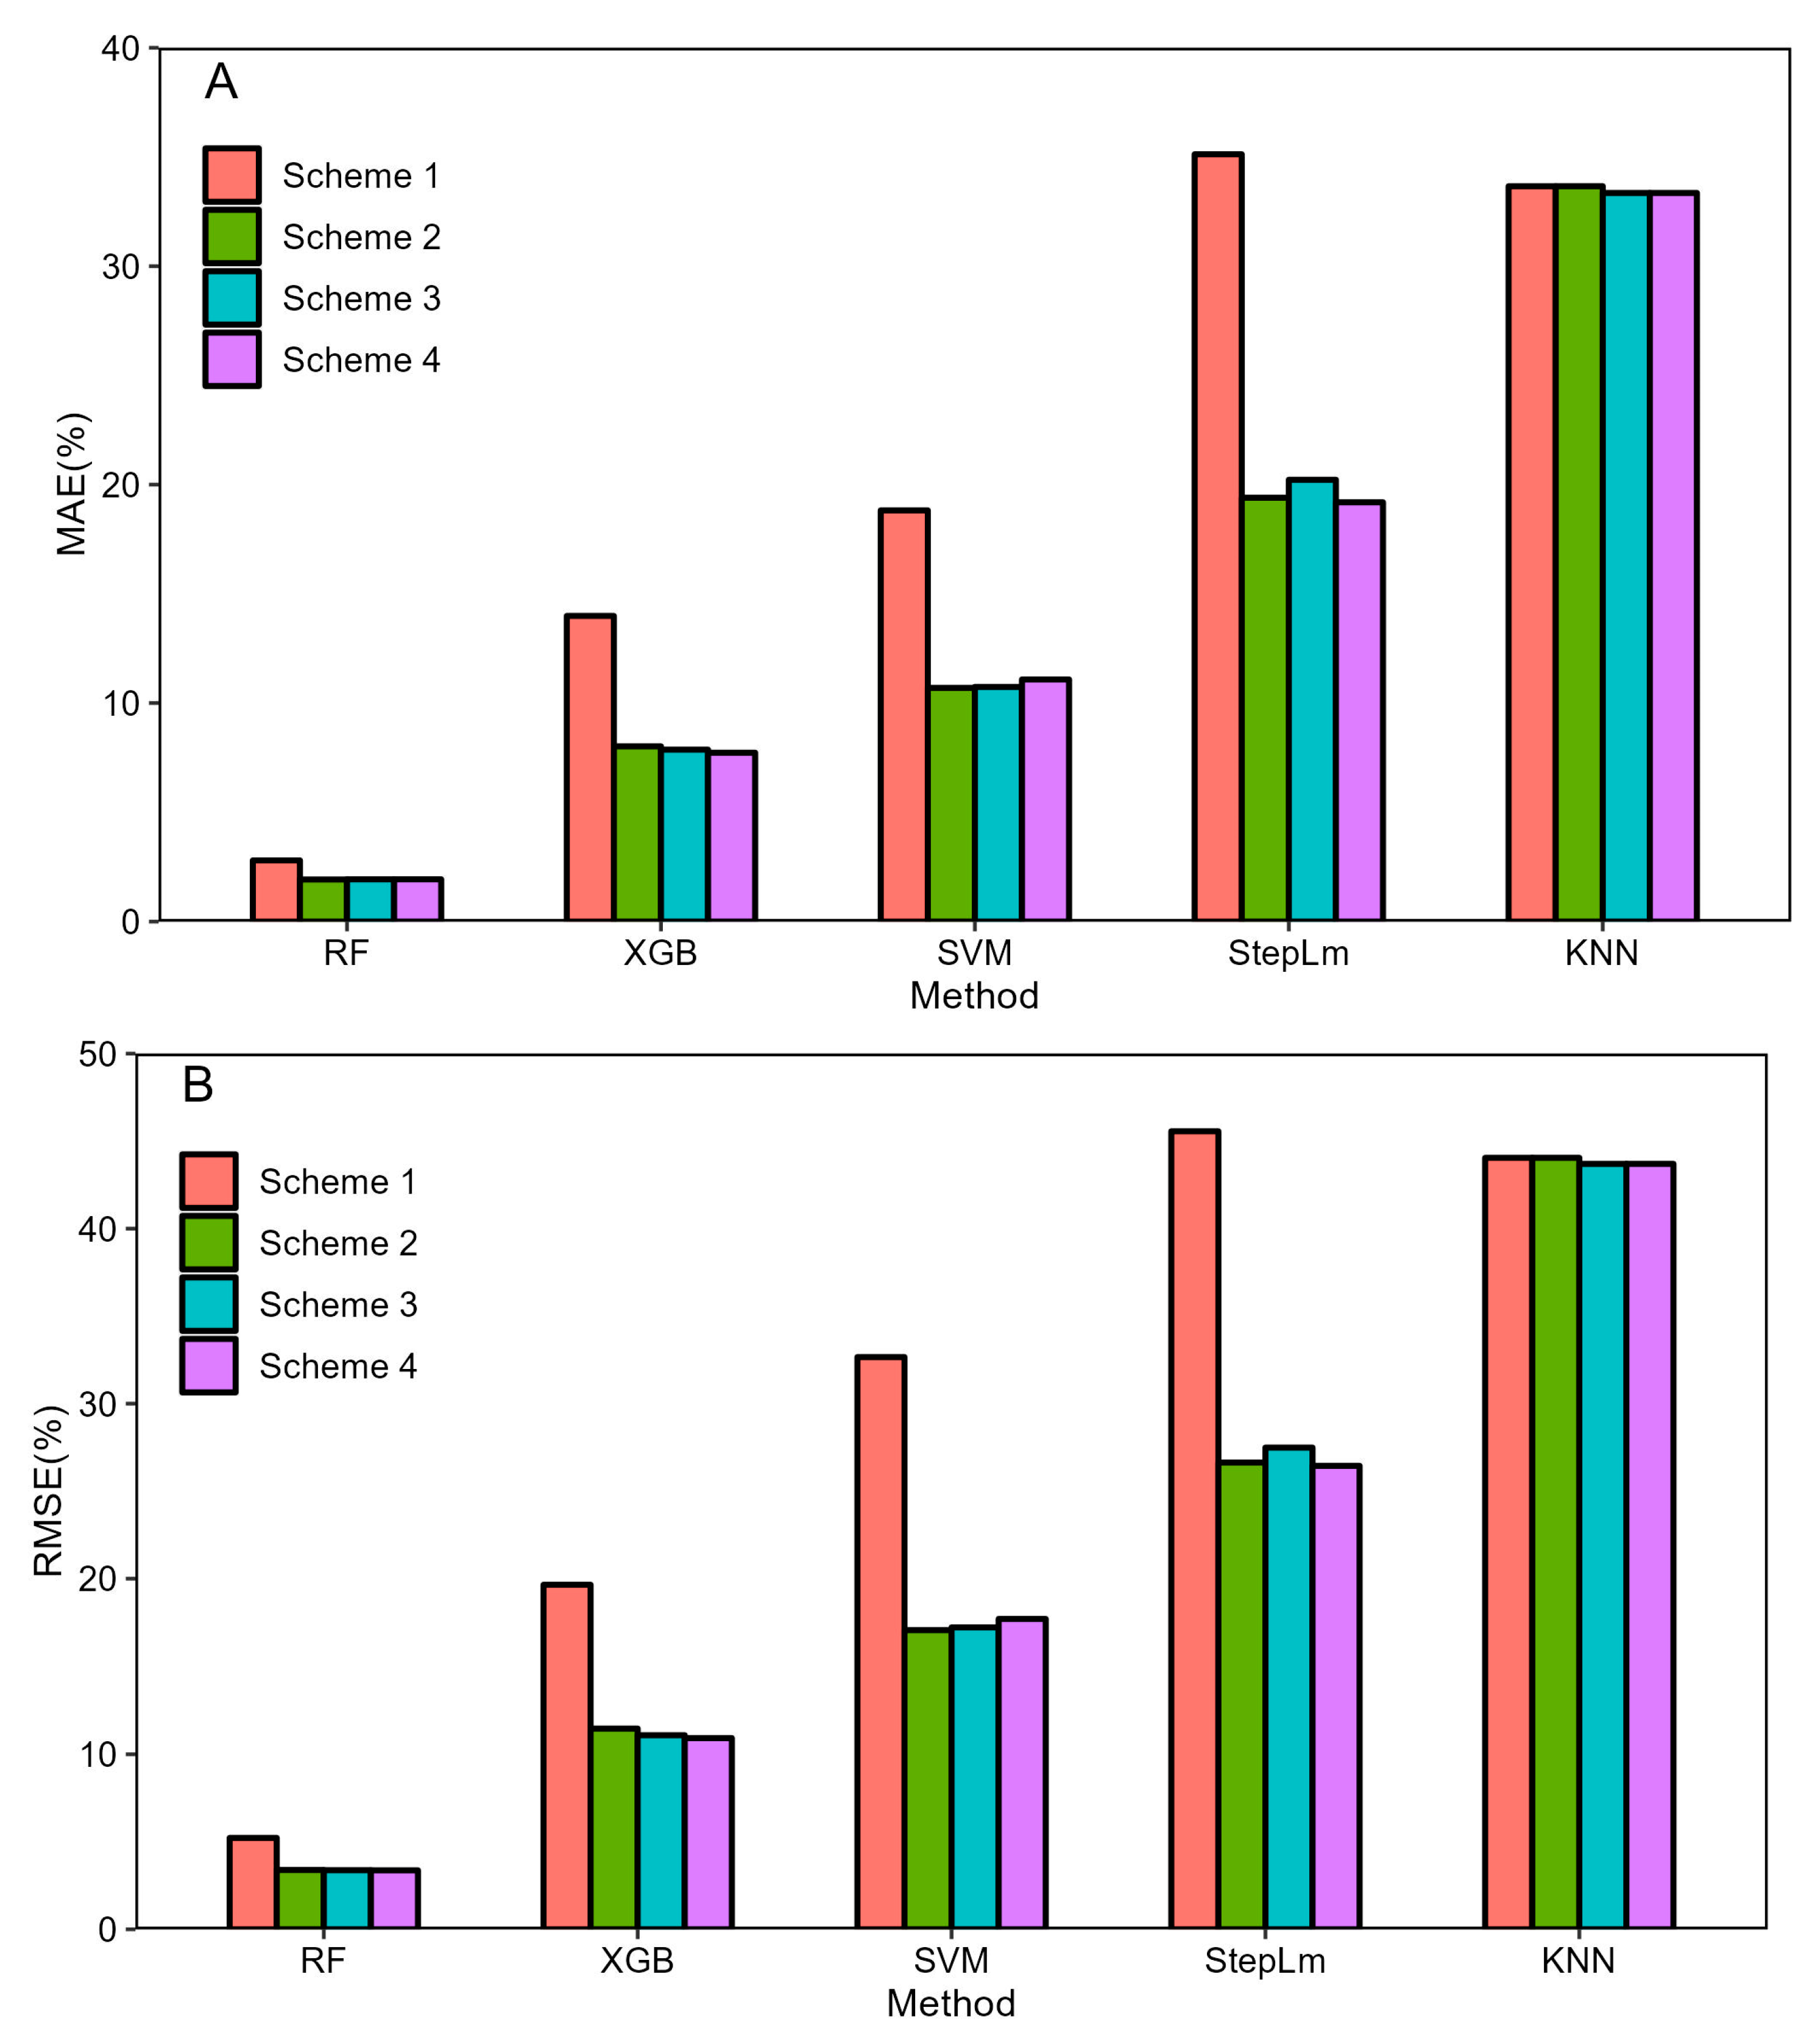
The prediction accuracy evaluation indexes R2 of each model are shown in Figure 3, and RMSE and MAE are shown in Figure 4. The RF model has the highest prediction accuracy and the best fitting effect, with the highest R2 of 0.996, the lowest RMSE and MAE of 3.370% and 1.934%, respectively. The prediction accuracy of the XGB model is second, R2 is up to 0.953. The R2 of the SVM model is up to 0.883, and RMSE and MAE are 17.059% and 10.693%. The R2 of StepLm is 0.722, and the RMSE and MAE values are relatively high, 26.446% and 19.190%, and the accuracy of the prediction model is slightly worse. The KNN model has the lowest prediction accuracy, R2 is only 0.238, and the RMSE and MAE values are 43.701% and 33.352%.
The highest accuracy and optimal Scheme of the fuel moisture content prediction model established by five different machine learning algorithms are next selected for comparative analysis. The results show that the overall prediction accuracy of the model is RF > XGB > SVM > StepLm > KNN (Table 5).
3.2. Prediction Accuracy Evaluation of Each Combination
The maximum MAE and RMSE values of Scheme 1 containing only meteorological factors are 45.561% and 35.123%, respectively, so the prediction accuracy of Scheme 1 fuel moisture content model is the lowest. After adding forest stand and terrain factors to meteorological factors, the prediction accuracy of Scheme 2 and Scheme 3 is greatly improved. The stepwise regression method has the most significant change, MAE improves from 35.123% to 19.401%, RMSE improves from 45.561% to 26.635%, and other machine learning algorithms also improve to varying degrees. The prediction accuracy of Scheme 4, which includes all factors in the SVM method, is slightly lower than that of Scheme 2 and Scheme 3. However, the difference is not significant. The Scheme 4 model with all factors considered has the highest prediction accuracy (Figure 4).
Compared with Scheme 1 and Scheme 2, the accuracy of MAE is improved by 15.72% and the accuracy of RMSE is improved by 18.926% after adding forest stand factors to meteorological factors. Compared with Scheme 1 and Scheme 3, the MAE accuracy is improved by 0.307%–14.902%, and the RMSE accuracy is improved by 0.346%–18.072% after adding the terrain factor to the meteorological factor. Compared with Scheme 1 and Scheme 4, MAE accuracy increases by 0.307%–15.934% and RMSE accuracy increases by 0.344%–19.115% when meteorological factors are combined with forest stand and terrain factors; it is the largest improvement.
The prediction accuracy of Scheme 1 model with meteorological factors alone is the lowest. The model accuracy of Scheme 2 and Scheme 3 is better than that of Scheme 1, and the overall accuracy of Scheme 2 and Scheme 3 is not much different. In addition to SVM, the prediction model of fuel moisture content in Scheme 4 has the highest accuracy (Table 6).
3.3. Relative Importance of Factors
The optimal Scheme of five machine learning algorithms is selected, and the ‘caret’ package in R is used to explore the relative importance of each feature factor in each machine learning algorithm, as shown in Figure 5.
In the RF model, slope position (SP), canopy density (CD), average light intensity within 15 days (S15d), altitude (Alt), average relative air humidity within 15 days (H15d), and average wind speed within 15 days (W15d) have higher relative importance. The relative importance of slope position (SP) and altitude (Alt) in terrain factors, canopy density (CD) in forest stand factors, and average light intensity within 15 days (S15d) in meteorological factors account for more than 60% Those are the four most important factors in the random forest model.
In the SVM model, canopy density (CD), average relative air humidity within 15 days (H15d), mean diameter at breast height (MDBH), average relative air humidity within 3 days (H3d), and average light intensity within 15 days (S15d) are relatively important in the model construction. Canopy density (CD) and average relative air humidity within 15 days (H15d) are the two factors with the highest proportion of relative importance.
In the XGB model, canopy density (CD), average light intensity within 15 days (S15d), average relative air humidity within 15 days (H15d), average relative air humidity within 3 days (H3d), average light intensity within 16 h (S16), average wind speed within 15 days (W15d), and air temperature (T) account for a relatively high proportion in the model. The relative importance of canopy density (CD) is more than 60%.
In the StepLm model, slope position (SP), canopy density (CD), altitude (Alt), average relative air humidity within 15 days (H15d), and mean diameter at breast (MDBH) are relatively important. Slope position (SP) and altitude (Alt) and canopy density (CD) are the top three ranked in relative importance in the StepLm model.
In the KNN model, slope position (SP), canopy density (CD), altitude (Alt), average relative air humidity within 15 days (H15d), mean diameter at breast height (MDBH), average relative air humidity within 3 days (H3d), and average light intensity within 15 days (S15d) account for a relatively high proportion in the model construction process. The slope position (SP) and the canopy density (CD) are similar to other models but are still the two factors with the highest proportion of relative importance.
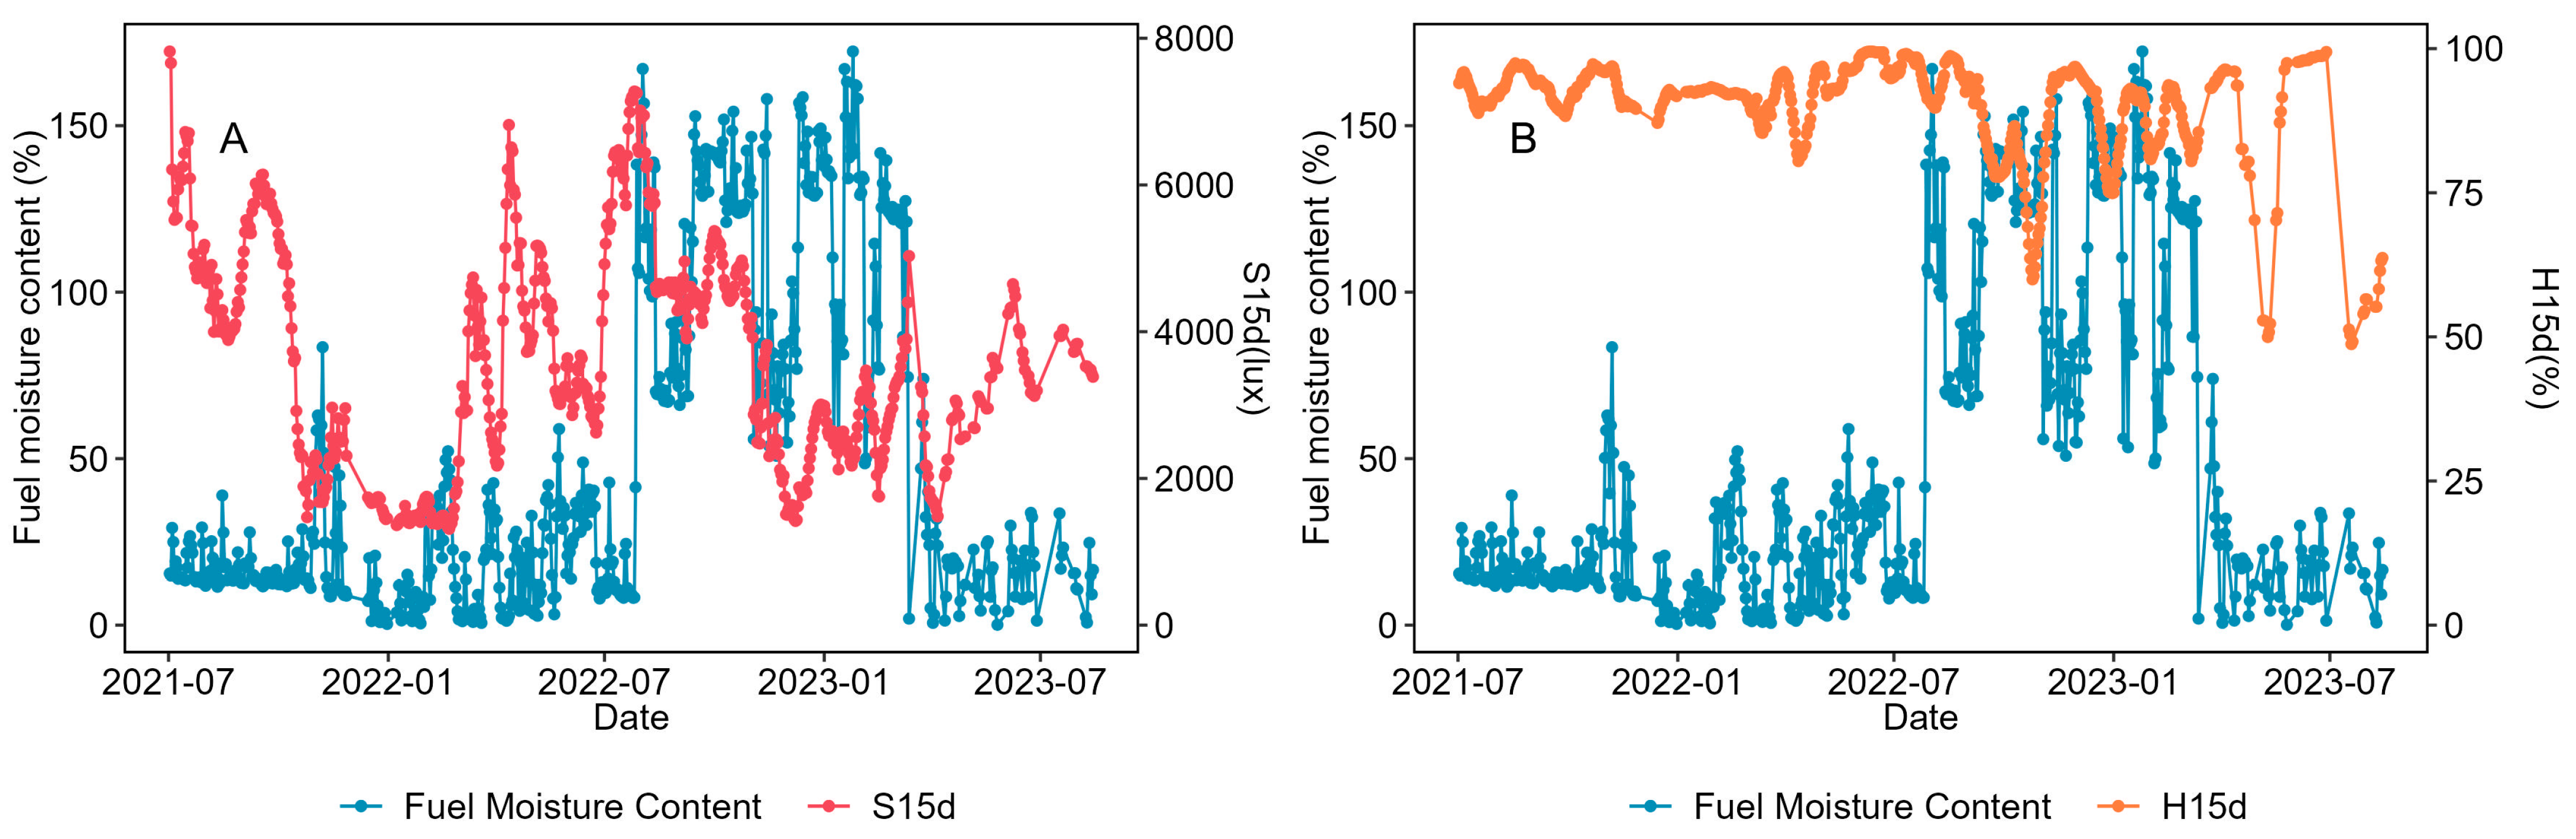
Comprehensive analysis shows that canopy density (CD), slope position (SP) and altitude (Alt), average relative air humidity within 15 days (H15d), and average light intensity within 15 days (S15d) are the most important overall factors. The relative importance of wind speed (W) and light intensity (S) and the average light intensity within 8 h (S8) rank last. According to the time series analysis, relative air humidity (H), average relative air humidity within 8 h (H8), average relative air humidity within 3 days (H3d), average relative air humidity within 15 days (H15d), and average light intensity within 8 h (S8) exhibit a certain linear correlation with fuel moisture content (Figure 6 and Figure S3). While other meteorological factors are relatively important in machine learning models, there is no clear linear relationship between them and the fuel moisture content. This indicates that a complex nonlinear relationship exists between these factors and fuel moisture content.
4. Discussion
Five machine learning algorithms performed well in predicting the moisture content of fine dead fuel in the forest. The overall prediction accuracy of the models is RF > XGB > SVM > StepLm > KNN. The determination coefficient R2 of the RF model can reach 0.996, indicating that the RF model is suitable for the prediction of the moisture content of fine dead fuel on the forest surface in subtropical regions. This is similar to the conclusion of Masinda [44] for the middle temperate zone of China and McCandless [45] for the north temperate zone of the United States. This shows that random forest can effectively simulate the complex nonlinear relationship between fuel moisture content and environment and has high prediction accuracy [14,15,21]. The optimal prediction accuracy R2 of XGB and SVM models is 0.953 and 0.883, respectively, which shows that XGB and SVM have advantages in solving nonlinear and multivariate pattern sample recognition and that they have strong prediction performance and nonlinear mapping ability [42,46].
The accuracy (R2) of the StepLm model is 0.772, which is relatively lower than that of other models, possibly because of the complex nonlinear relationship between the moisture content of fine dead fuel and environmental factors [13]. However, the overall accuracy of StepLm in this paper is higher than that of Fan et al. [14] in predicting the fuel moisture content of typical tree species in Northeast China (R2 is 0.244). More forest stand factors, terrain factors, and meteorological factors at a time delay were considered here, which may explain our improved results [28]. The lowest prediction accuracy R2 of the model in KNN is 0.238, which may be due to the large sample size and more feature factors. KNN is affected by the ‘dimension disaster’, which reduces the efficiency of KNN classification and increases the error of model prediction results [19,42].
The model accuracy of the Schemes based on single meteorological factors is generally low. However, the model prediction accuracy when adding forest stand factors and/or terrain factors increased, which indicates that a single type of characteristic factor is insufficient to predict the moisture content of fine dead surface fuel with high accuracy [14,47]. However, most previous moisture content prediction models only included meteorological factors, and did not consider forest stand, terrain, and average meteorological factors at a time delay as important variables for modeling and analysis, which may explain the low accuracy [14,48]. In subtropical evergreen broad-leaved forest areas with high biodiversity and high vegetation coverage, the combination of multi-type characteristic factors can make full use of terrain, forest stand, and other characteristic information to improve the accuracy of the model to predict fine dead surface fuel moisture content in forests [26,47,49].
The canopy density (forest stand factors), slope position and altitude (terrain factor), and average relative air humidity within 15 days and average light intensity within 15 days (meteorological factors) all play an important role in the prediction of fuel moisture content. When the canopy density is high, the light intensity in the forest is low, the air temperature is decreased, the relative air humidity is increased, the water evaporation rate is slowed down, and the surface fuel moisture content is increased [27,50]. There is also a clear correlation between slope location and altitude. Generally, the air temperature is low in the high-altitude area, while the light intensity, air temperature, and ventilation are weak in the downhill area, and the surface fuel moisture content is high [24]. It takes time for the fuel moisture content to change to an equilibrium state, so meteorological factors are time-lagged to the change in the fuel moisture content [28]. Yu et al. proposed that the appropriate equilibrium moisture content model should be selected according to forest stand and terrain conditions in different regions, or a prediction model of fuel moisture content based on different forest stand parameters should be established [27]. Hu et al. pointed out that terrain factors such as slope gradient and aspect are significantly correlated with fuel moisture content [51]. Shmuel et al. pointed out that adding meteorological factors at a time delay into the dead fuel moisture content prediction model can greatly improve the prediction accuracy of the model [18]. Therefore, among all factors, selecting the characteristic factors with highest relative importance significantly improves the prediction accuracy of the model.
Guo et al. pointed out that the lower the relative humidity of the air, the higher the altitude and the steeper the slope of subtropical forest, the more likely the high-intensity forest fire will occur [35]. The moisture content model in this study predicts that low moisture content is more likely to cause forest fires under these conditions, which aligns with our results. Additionally, according to the report by Jiangxi Provincial Emergency Management Department from 2022 to 2023, there were 13 forest fires in the study area. Of those, 11 occurred during the periods of relatively low moisture content (84.62%), indicating high prediction accuracy. Currently, most of the forest fire warning platforms rely solely on meteorological factors alone and struggle to accurately predict fire occurrence. However, since the moisture content is influenced by multiple factors and directly related to fire risk. The lower the moisture content, the higher the forest fire risk. Therefore, this model has an important reference value for assessing forest fires.
The prediction accuracy of machine learning algorithms used here is generally high, with the prediction accuracy of RF model being the highest [15,21]. However, it is worth noting that machine learning models cannot clearly describe the intermediate operation process via mathematics [14,19]. Therefore, future research should consider combining machine learning algorithms with process models based on physical descriptions so as to achieve more comprehensive, accurate, and reliable support for constructing a forest fire warning platform in the future.
In our work, environmental factors such as fuel moisture content and meteorological data have only been observed for a period of two years. The meteorological, terrain and forest stand factors that influence the fuel moisture content exhibit significant temporal or spatial variability. There are variations in the interannual fluctuations of meteorological factors and the moisture content among different forest vegetation types at various succession stages. Therefore, in order to improve the accuracy and reliability of the model’s predictions, it is imperative to collect meteorological and other factor data over a longer time period in the future. Additionally, it is essential to develop fuel moisture content prediction models on a broader spatial scale for various vegetation types [52,53].
5. Conclusions
Here, five machine learning algorithms, StepLm, RF, KNN, SVM, and XGB are used to establish prediction models of fine dead surface fuel moisture content. The results show that the overall prediction accuracy of the model is RF > XGB > SVM > StepLm > KNN. The prediction accuracy of RF, XGB, and SVM models is good, and the coefficient of determination R2 can exceed 0.88.
In this study, four types of combination Schemes of meteorological, forest stand, and terrain characteristics are comprehensively considered to predict fine dead surface fuel moisture content. Scheme 1, which only includes meteorological factors, has the lowest prediction accuracy. However, the prediction accuracy increases in Scheme 2 when forest stand factors are added and in Scheme 3 when terrain factors are included. The best model prediction ability is achieved in Scheme 4, which incorporates all feature factors, such as meteorological, forest stand, and terrain.
The comprehensive consideration of forest stand, terrain, and average meteorological factors (including time delayed factors) for predicting fine dead surface moisture content is critical. The canopy density (forest stand factor), slope position and altitude (terrain factors), and the average relative air humidity and light intensity in the last 15 days (meteorological factors) are found here to be particularly important.
Fine dead fuel moisture content is a key indicator of forest fire warning, which significantly influences the occurrence and spread of forest fire. In this study, the variability and influencing factors of fine dead fuel moisture content on forest surface in subtropical region are revealed, and several machine learning algorithm models are compared and analyzed. The results can provide a scientific basis and theoretical guidance for future studies on forest fire warning.
Supplementary Materials
The following supporting information can be downloaded at: https://www.mdpi.com/article/10.3390/f15050736/s1, Table S1: Optimal parameters of machine learning algorithm under different factor combination Schemes; Table S2: StepLm fitting equation; Figure S1: The change of average annual temperature in Gannan in recent 20 years; Figure S2: The change of average annual precipitation in Gannan in recent 20 years; Figure S3: Time series of fuel moisture content and meteorological variables.
Author Contributions
X.H.: Writing—original draft, Methodology, Analysis, Data curation, Funding acquisition. Z.W.: Conceptualization, Methodology, Project administration, Funding acquisition. S.Z. and Z.L.: Investigation, Data curation. S.L.: Writing—review, Editing. All authors have read and agreed to the published version of the manuscript.
Funding
This research was jointly funded by the National Natural Science Foundation of China (32271897) and the Jiangxi Provincial Department of Education Graduate Innovation Fund (YC2023-B104).
Data Availability Statement
Upon request to corresponding author.
Acknowledgments
We thank Adam T. Devlin for his English language editing.
Conflicts of Interest
The authors declare no conflicts of interest associated with this manuscript.
References
- Sun, Q.H.; Miao, C.Y.; Hanel, M.; Borthwick, A.G.L.; Duan, Q.Y.; Ji, D.Y.; Li, H. Global heat stress on health, wildfires, and agricultural crops under different levels of climate warming. Environ. Int. 2019, 128, 125–136. [Google Scholar] [CrossRef]
- Hanes, C.C.; Wang, X.L.; Jain, P.; Parisien, M.A.; Little, J.M.; Flannigan, M.D. Fire-regime changes in Canada over the last half century. Can. J. For. Res. 2019, 49, 256–269. [Google Scholar] [CrossRef]
- Flannigan, M.; Bergeron, Y.; Engelmark, O.; Wotton, B. Future wildfire in circumboreal forests in relation to global warming. J. Veg. Sci. 1998, 9, 469–476. [Google Scholar] [CrossRef]
- Hayasaka, H.; Tanaka, H.L.; Bieniek, P.A. Synoptic-scale fire weather conditions in Alaska. Polar Sci. 2016, 10, 217–226. [Google Scholar] [CrossRef]
- Pechony, O.; Shindell, D.T. Driving forces of global wildfires over the past millennium and the forthcoming century. Proc. Natl. Acad. Sci. USA 2010, 107, 19167–19170. [Google Scholar] [CrossRef]
- Liu, Z.; Zu, J. Extreme heat disaster rescue actions and its response effectiveness: Analysis on the context of regional mountain fires in china and canada. China Emerg. Rescue 2023, 6, 63–68. [Google Scholar] [CrossRef]
- Stocks, B.J.; Lawson, B.; Alexander, M.; Wagner, C.V.; Mcalpine, R.; Lynham, T.; Dube, D. The Canadian forest fire danger rating system: An overview. For. Chron. 1989, 65, 450–457. [Google Scholar] [CrossRef]
- Tian, X.; Mcrae, D.J.; Zhang, Y. Assessment of forest fire danger rating systems. World For. Res. 2006, 2, 39–46. [Google Scholar] [CrossRef]
- Jin, S.; Li, L. Validation of the method for direct estimation of timelag and equilibrium moisture content of forest fuel. Sci. Silvae Sin. 2010, 46, 95–102. [Google Scholar]
- Nelson, R.M., Jr. Prediction of diurnal change in 10-h fuel stick moisture content. Can. J. For. Res. 2000, 30, 1071–1087. [Google Scholar] [CrossRef]
- Simard, A. The Moisture Content of Forest Fuels–I: A Review of Basic Concepts; Forest Fire Research Institute, Canadian Department of Forest and Rural Developoment: Ottawa, Ontario, 1968. [Google Scholar]
- Nolan, R.H.; Resco De Dios, V.; Boer, M.M.; Caccamo, G.; Goulden, M.L.; Bradstock, R.A. Predicting dead fine fuel moisture at regional scales using vapour pressure deficit from modis and gridded weather data. Remote Sens. Environ. 2016, 174, 100–108. [Google Scholar] [CrossRef]
- Dragozi, E.; Giannaros, T.M.; Kotroni, V.; Lagouvardos, K.; Koletsis, I. Dead fuel moisture content (dfmc) estimation using modis and meteorological data: The case of Greece. Remote Sens. 2021, 13, 4224. [Google Scholar] [CrossRef]
- Fan, J.L.; Hu, T.X.; Ren, J.S.; Liu, Q.; Sun, L. A comparison of five models in predicting surface dead fine fuel moisture content of typical forests in northeast China. Front. For. Glob. Change 2023, 6, 1122087. [Google Scholar] [CrossRef]
- Ferrer Palomino, A.; Sánchez Espino, P.; Borrego Reyes, C.; Jiménez Rojas, J.A.; Rodríguez Y Silva, F. Estimation of moisture in live fuels in the mediterranean: Linear regressions and random forests. J. Environ. Manag. 2022, 322, 116069. [Google Scholar] [CrossRef] [PubMed]
- Matthews, S.; Mccaw, W.; Neal, J.; Smith, R. Testing a process-based fine fuel moisture model in two forest types. Can. J. For. Res. 2006, 37, 23–35. [Google Scholar] [CrossRef]
- Matthews, S.; Mccaw, W. A next-generation fuel moisture model for fire behaviour prediction. For. Ecol. Manag. 2006, 234, S91. [Google Scholar] [CrossRef]
- Shmuel, A.; Ziv, Y.; Heifetz, E. Machine-learning-based evaluation of the time-lagged effect of meteorological factors on 10-hour dead fuel moisture content. For. Ecol. Manag. 2022, 505, 119897. [Google Scholar] [CrossRef]
- Jain, P.; Coogan, S.C.P.; Subramanian, S.G.; Crowley, M.; Taylor, S.; Flannigan, M.D. A review of machine learning applications in wildfire science and management. Environ. Rev. 2020, 28, 478–505. [Google Scholar] [CrossRef]
- Miller, L.; Zhu, L.; Yebra, M.; Rüdiger, C.; Webb, G.I. Projecting live fuel moisture content via deep learning. Int. J. Wildland Fire 2023, 32, 709–727. [Google Scholar] [CrossRef]
- Capps, S.B.; Zhuang, W.; Liu, R.; Rolinski, T.; Qu, X. Modelling chamise fuel moisture content across california: A machine learning approach. Int. J. Wildland Fire 2021, 31, 136–148. [Google Scholar] [CrossRef]
- Noble, W.S. What is a support vector machine? Nat. Biotechnol. 2006, 24, 1565–1567. [Google Scholar] [CrossRef]
- Sun, L.; Liu, Q.; Hu, T. Advances in research on prediction model of moisture content of surface dead fuel in forests. Sci. Silvae Sin. 2021, 57, 142–152. [Google Scholar]
- Slijepcevic, A.; Anderson, W.; Matthews, S.; Anderson, D. Evaluating models to predict daily fine fuel moisture content in eucalypt forest. For. Ecol. Manag. 2015, 335, 261–269. [Google Scholar] [CrossRef]
- Zhang, H.; Ma, S.; Kang, P.; Zhang, Q.; Wu, Z. Spatial heterogeneity of dead fuel moisture content in a larix gmelinii forest in inner mongolia using geostatistics. J. For. Res. 2021, 32, 569–577. [Google Scholar] [CrossRef]
- Lindberg, H.; Aakala, T.; Vanha-Majamaa, I. Moisture content variation of ground vegetation fuels in boreal mesic and sub-xeric mineral soil forests in Finland. Int. J. Wildland Fire 2021, 30, 283–293. [Google Scholar] [CrossRef]
- Yu, H.; Jin, S.; Di, X. Prediction models for ground surface fuels moisture content of larix amelinii stand in daxing’anling of China based on one-hour time step. Chin. J. Appl. Ecol. 2013, 24, 1565–1571. [Google Scholar] [CrossRef]
- Hiers, J.K.; Stauhammer, C.L.; O’Brien, J.J.; Gholz, H.L.; Martin, T.A.; Hom, J.; Starr, G. Fine dead fuel moisture shows complex lagged responses to environmental conditions in a saw palmetto (Serenoa repens) flatwoods. Agric. For. Meteorol. 2019, 266–267, 20–28. [Google Scholar] [CrossRef]
- Delcourt, C.J.; Combee, A.; Izbicki, B.; Mack, M.C.; Maximov, T.; Petrov, R.; Rogers, B.M.; Scholten, R.C.; Shestakova, T.A.; Van Wees, D. Evaluating the differenced normalized burn ratio for assessing fire severity using sentinel-2 imagery in northeast Siberian larch forests. Remote Sens. 2021, 13, 2311. [Google Scholar] [CrossRef]
- FAO. Global Forest Resources Assessment 2020—Key Findings; FAO: Rome, Italy, 2020; Available online: https://openknowledge.fao.org/handle/20.500.14283/ca8753en (accessed on 6 January 2024). [CrossRef]
- Fang, K.; Yao, Q.; Guo, Z.; Zheng, B.; Du, J.; Qi, F.; Yan, P.; Li, J.; Ou, T.; Liu, J. Enso modulates wildfire activity in China. Nat. Commun. 2021, 12, 1764. [Google Scholar] [CrossRef]
- Farukh, M.A.; Islam, M.A.; Hayasaka, H. Wildland fires in the subtropical hill forests of southeastern Bangladesh. Atmosphere 2023, 14, 97. [Google Scholar] [CrossRef]
- Singleton, M.P.; Thode, A.E.; Meador, A.J.S.; Iniguez, J.M. Increasing trends in high-severity fire in the southwestern USA from 1984 to 2015. For. Ecol. Manag. 2019, 433, 709–719. [Google Scholar] [CrossRef]
- Hansen, M.C.; Potapov, P.V.; Moore, R.; Hancher, M.; Turubanova, S.A.; Tyukavina, A.; Thau, D.; Stehman, S.V.; Goetz, S.J.; Loveland, T.R. High-resolution global maps of 21st-century forest cover change. Science 2013, 342, 850–853. [Google Scholar] [CrossRef]
- Guo, L.; Wu, Z.; Li, S.; Xie, G.A. The relative impacts of vegetation, topography and weather on landscape patterns of burn severity in subtropical forests of southern China. J. Environ. Manag. 2023, 351, 119733. [Google Scholar] [CrossRef]
- Guo, L.; Pan, P.; Ouyang, X.; Ning, J.; Zang, H.; Liu, Y.; Yang, Y.; Gui, Y. Distribution characteristics of carbon density of natural Pinus massoniana forest at different stand growing stages in southern Jiangxi province, eastern China. J. Beijing For. Univ. 2018, 40, 37–45. [Google Scholar] [CrossRef]
- Fan, J.; Guo, Y.; Yu, H.; Sun, L.; Hu, H.; Hu, T. The comparison and dynamic calibration between the manual measured data of the surface fine fuels moisture content and the automatic measuring instrument data. For. Eng. 2023, 39, 129–139. [Google Scholar]
- Wu, Z.; He, H.S.; Keane, R.E.; Zhu, Z.; Wang, Y.; Shan, Y. Current and future patterns of forest fire occurrence in China. Int. J. Wildland Fire 2019, 29, 104–119. [Google Scholar]
- Xu, Q.; Li, W.; Liu, J.; Wang, X. A geographical similarity-based sampling method of non-fire point data for spatial prediction of forest fires. For. Ecosyst. 2023, 10, 100104. [Google Scholar] [CrossRef]
- Tian, H.; Zhu, J.; He, X.; Chen, X.; Jian, Z.; Li, C.; Ou, Q.; Li, Q.; Huang, G.; Liu, C.; et al. Using machine learning algorithms to estimate stand volume growth of larix and quercus forests based on national-scale forest inventory data in China. For. Ecosyst. 2022, 9, 100037. [Google Scholar] [CrossRef]
- Sotiropoulou, K.F.; Vavatsikos, A.P.; Botsaris, P.N. A hybrid ahp-promethee ii onshore wind farms multicriteria suitability analysis using knn and svm regression models in northeastern Greece. Renew. Energy 2024, 221, 119795. [Google Scholar] [CrossRef]
- Yue, W.; Ren, C.; Liang, Y.; Liang, J.; Lin, X.; Yin, A.; Wei, Z. Assessment of wildfire susceptibility and wildfire threats to ecological environment and urban development based on gis and multi-source data: A case study of Guilin, China. Remote Sens. 2023, 15, 2659. [Google Scholar] [CrossRef]
- Kuhn, M. Building predictive models in r using the caret package. J. Stat. Softw. 2008, 28, 1–26. [Google Scholar] [CrossRef]
- Masinda, M.M.; Li, F.; Liu, Q.; Sun, L.; Hu, T. Prediction model of moisture content of dead fine fuel in forest plantations on maoer mountain, northeast China. J. For. Res. 2021, 32, 2023–2035. [Google Scholar] [CrossRef]
- Mccandless, T.C.; Kosovic, B.; Petzke, W. Enhancing wildfire spread modelling by building a gridded fuel moisture content product with machine learning. Mach. Learn. Sci. Technol. 2020, 1, 035010. [Google Scholar] [CrossRef]
- Fan, J.L.; Wang, X.K.; Wu, L.F.; Zhou, H.M.; Zhang, F.C.; Yu, X.; Lu, X.H.; Xiang, Y.Z. Comparison of support vector machine and extreme gradient boosting for predicting daily global solar radiation using temperature and precipitation in humid subtropical climates: A case study in China. Energy Convers. Manag. 2018, 164, 102–111. [Google Scholar] [CrossRef]
- Rakhmatulina, E.; Stephens, S.; Thompson, S. Soil moisture influences on sierra nevada dead fuel moisture content and fire risks. For. Ecol. Manag. 2021, 496, 119379. [Google Scholar]
- Matthews, S. Dead fuel moisture research: 1991–2012. Int. J. Wildland Fire 2014, 23, 78–92. [Google Scholar] [CrossRef]
- Xie, J.J.; Qi, T.; Hu, W.N.; Huang, H.G.; Chen, B.B.; Zhang, J. Retrieval of live fuel moisture content based on multi-source remote sensing data and ensemble deep learning model. Remote Sens. 2022, 14, 4378. [Google Scholar] [CrossRef]
- Wotton, B.M.; Beverly, J.L. Stand-specific litter moisture content calibrations for the Canadian fine fuel moisture code. Int. J. Wildland Fire 2007, 16, 463–472. [Google Scholar] [CrossRef]
- Hu, H.; Liang, Y.; Sun, L.; Song, Y. Effects of simulated aspect and gradient of slope on moisture of combustible material in laboratory. J. For. Environ. 2016, 36, 80–85. [Google Scholar] [CrossRef]
- Titus, S.J.; Woodard, P.; Johnson, A.F. Sampling intensity for estimating fuel moisture content in lodgepole pine and white spruce trees. Int. J. Wildland Fire 1992, 2, 1–6. [Google Scholar]
- Yebra, M.; Chuvieco, E.; Riaño, D. Estimation of live fuel moisture content from modis images for fire risk assessment. Agric. For. Meteorol. 2008, 148, 523–536. [Google Scholar] [CrossRef]
Figure 1.
Study area location and plot distribution map.

Figure 2.
Automatic fuel moisture content monitor.

Figure 3.
Scatterplot of the error between the measured value and the predicted value of fuel moisture content. (A–D) RF, (E–H) XGB, (I–L) SVM, (M–P) StepLm, (Q–T) KNN. The red solid line represents the fitting line of the predicted value, and the black dotted line represents the 1:1 line.
Figure 3.
Scatterplot of the error between the measured value and the predicted value of fuel moisture content. (A–D) RF, (E–H) XGB, (I–L) SVM, (M–P) StepLm, (Q–T) KNN. The red solid line represents the fitting line of the predicted value, and the black dotted line represents the 1:1 line.

Figure 4.
Comparison of errors for each combination Scheme. (A) MAE (%), (B) RMSE (%).

Figure 5.
Relative importance of feature factors. The full name of each factor is shown in Table 3.
Figure 5.
Relative importance of feature factors. The full name of each factor is shown in Table 3.

Figure 6.
Time series of fuel moisture content and two important meteorological factors. (A) Average light intensity within 15 days, (B) average relative air humidity within 15 days.
Figure 6.
Time series of fuel moisture content and two important meteorological factors. (A) Average light intensity within 15 days, (B) average relative air humidity within 15 days.


Table 1.
Statistics of fuel moisture content data.
| Time Period | Order Statistic | Descriptive Statistic | |||||||
|---|---|---|---|---|---|---|---|---|---|
| Minimum | 25% Value | Median | 75% Value | Maximum | Arithmetic Mean | Standard Deviation | Skewness Coefficient | Kurtosis Coefficient | |
| Spring | 0.01 | 7.96 | 24.31 | 40.10 | 193.68 | 31.82 | 33.64 | 1.89 | 3.43 |
| Summer | 0.04 | 10.37 | 16.62 | 30.73 | 196.51 | 30.59 | 38.56 | 2.19 | 3.77 |
| Autumn | 0.01 | 13.09 | 21.38 | 75.82 | 199.43 | 49.72 | 51.64 | 1.10 | −0.18 |
| Winter | 0.01 | 18.23 | 46.92 | 132.12 | 199.90 | 72.60 | 60.54 | 0.41 | −1.35 |
| Annual | 0.01 | 12.51 | 20.88 | 59.10 | 199.90 | 45.45 | 50.07 | 1.31 | 0.36 |
Table 2.
Forest stand and terrain factors of sample plots.
| Plot Number | Altitude (m) | Aspect | Slope Position | Slope Gradient (°) | Mean Height (m) | Mean Diameter at Breast (cm) | Mean First Stalk Height (m) | Canopy Density (%) |
|---|---|---|---|---|---|---|---|---|
| 1 | 249.1 | East | lower | 16 | 7.1 | 12.0 | 3.1 | 10 |
| 2 | 235.8 | West | middle | 9 | 4.1 | 8.2 | 1.1 | 20 |
| 3 | 159.7 | Northeast | upper | 23 | 8.2 | 12.3 | 3.5 | 40 |
| 4 | 163.8 | East | middle | 46 | 5.8 | 8.3 | 3.5 | 20 |
| 5 | 154.3 | Southeast | upper | 22 | 8.4 | 12.0 | 2.6 | 25 |
Table 3.
Feature factor screening.
| Factors | Abbreviation | Full Name | Unit | Value Range | VIF |
|---|---|---|---|---|---|
| meteorology | T | Air temperature | °C | [−2.8, 44.4] | 2.0 |
| H | Relative air humidity | % | [20, 99.9] | 2.3 | |
| H8 | Average relative air humidity in the last 8 h | [21.7, 99.9] | 3.2 | ||
| H3d | Average relative air humidity in the last 3 days | [20.2, 99.7] | 3.1 | ||
| H15d | Average relative air humidity in the last 15 days | [47.7, 99.6] | 2.2 | ||
| S | Light intensity | lux | [0, 81,469.4] | 1.7 | |
| S8 | Average light intensity in the last 8 h | [0, 40,421.3] | 3.0 | ||
| S16 | Average light intensity in the last 16 h | [42.2, 22,745.3] | 2.7 | ||
| S15d | Average light intensity in the last 15 days | [959.7, 12,407.5] | 2.4 | ||
| W | Wind speed | m/s | [0, 4.1] | 1.9 | |
| W8 | Average wind speed in the last 8 h | [0, 2.2] | 2.4 | ||
| W3d | Average wind speed in the last 3 days | [0, 1.4] | 2.1 | ||
| W15d | Average wind speed in the last 15 days | [0, 0.8] | 1.8 | ||
| forest stand | MH | Mean height | m | [4.1, 9.4] | / |
| MDBH | Mean diameter at breast | cm | [8.2, 13.8] | ||
| MFSH | Mean first stalk height | m | [1.1, 3.5] | ||
| CD | Canopy density | % | [10, 50] | ||
| terrain | Alt | Altitude | m | [153.1, 249.1] | |
| Asp | Aspect | / | [2, 6] | ||
| SP | Slope position | / | [1, 3] | ||
| SG | Slope gradient | ° | [9, 46] |
Table 4.
Feature factor combination Schemes.
| Combining Scheme | Type of Factors |
|---|---|
| Scheme 1 | meteorology |
| Scheme 2 | meteorology + forest stand |
| Scheme 3 | meteorology + terrain |
| Scheme 4 | meteorology + terrain + forest stand |
Table 5.
Model accuracy in machine learning algorithm Schemes.
| Method | Scheme | RMSE (%) | MAE (%) | R2 |
|---|---|---|---|---|
| RF | 4 | 3.370 | 1.934 | 0.996 |
| XGB | 4 | 10.925 | 7.727 | 0.953 |
| SVM | 2 | 17.059 | 10.693 | 0.883 |
| StepLm | 4 | 26.446 | 19.190 | 0.722 |
| KNN | 4 | 43.701 | 33.352 | 0.238 |
Table 6.
Accuracy difference of each machine learning algorithm model.
| Accuracy Difference | RF | XGB | SVM | StepLm | KNN | |||||
|---|---|---|---|---|---|---|---|---|---|---|
| MAE | RMSE | MAE | RMSE | MAE | RMSE | MAE | RMSE | MAE | RMSE | |
| Scheme 1–Scheme 2 | 0.873 | 1.832 | 5.969 | 8.182 | 8.127 | 15.600 | 15.723 | 18.926 | −0.002 | −0.002 |
| Scheme 1–Scheme 3 | 0.865 | 1.844 | 6.121 | 8.561 | 8.083 | 15.445 | 14.902 | 18.072 | 0.307 | 0.346 |
| Scheme 1–Scheme 4 | 0.865 | 1.852 | 6.260 | 8.726 | 7.743 | 14.961 | 15.934 | 19.115 | 0.307 | 0.344 |
| Scheme 2–Scheme 3 | −0.008 | 0.012 | 0.152 | 0.378 | −0.044 | −0.155 | −0.821 | −0.854 | 0.309 | 0.347 |
| Scheme 2–Scheme 4 | −0.009 | 0.020 | 0.291 | 0.543 | −0.384 | −0.639 | 0.211 | 0.189 | 0.309 | 0.345 |
| Scheme 3–Scheme 4 | 0.000 | 0.008 | 0.139 | 0.165 | −0.340 | −0.484 | 1.032 | 1.043 | 0.000 | −0.002 |
Disclaimer/Publisher’s Note: The statements, opinions and data contained in all publications are solely those of the individual author(s) and contributor(s) and not of MDPI and/or the editor(s). MDPI and/or the editor(s) disclaim responsibility for any injury to people or property resulting from any ideas, methods, instructions or products referred to in the content. |
© 2024 by the authors. Licensee MDPI, Basel, Switzerland. This article is an open access article distributed under the terms and conditions of the Creative Commons Attribution (CC BY) license (https://creativecommons.org/licenses/by/4.0/).
Share and Cite
MDPI and ACS Style
Hou, X.; Wu, Z.; Zhu, S.; Li, Z.; Li, S. Comparative Analysis of Machine Learning-Based Predictive Models for Fine Dead Fuel Moisture of Subtropical Forest in China. Forests 2024, 15, 736. https://doi.org/10.3390/f15050736
AMA Style
Hou X, Wu Z, Zhu S, Li Z, Li S. Comparative Analysis of Machine Learning-Based Predictive Models for Fine Dead Fuel Moisture of Subtropical Forest in China. Forests. 2024; 15(5):736. https://doi.org/10.3390/f15050736
Chicago/Turabian StyleHou, Xiang, Zhiwei Wu, Shihao Zhu, Zhengjie Li, and Shun Li. 2024. "Comparative Analysis of Machine Learning-Based Predictive Models for Fine Dead Fuel Moisture of Subtropical Forest in China" Forests 15, no. 5: 736. https://doi.org/10.3390/f15050736
Note that from the first issue of 2016, this journal uses article numbers instead of page numbers. See further details here.