Article

Species Diversity of Oak Stands and Its Significance for Drought Resistance

1
Remote Sensing Division, Center of Space Technologies, Institute of Aviation, 02-256 Warsaw, Poland
2
Faculty of Physics, Warsaw University, 5 Pasteura Street, 02-093 Warsaw, Poland
3
Department of Forest Protection, Forest Research Institute, Sękocin Stary, 3 Braci Leśnej Street, 05-090 Raszyn, Poland
*
Author to whom correspondence should be addressed.
Forests 2018, 9(3), 126; https://doi.org/10.3390/f9030126
Submission received: 25 January 2018 / Revised: 22 February 2018 / Accepted: 1 March 2018 / Published: 7 March 2018
(This article belongs to the Special Issue Remotely Sensing of Drought-Induced Forest Change and Recovery)

Abstract

:
Drought periods have an adverse impact on the condition of oak stands. Research on different types of ecosystems has confirmed a correlation between plant species diversity and the adverse effects of droughts. The purpose of this study was to investigate the changes that occurred in an oak stand (Krotoszyn Plateau, Poland) under the impact of the summer drought in 2015. We used a method based on remote sensing indices from satellite images in order to detect changes in the vegetation in 2014 and 2015. A positive difference was interpreted as an improvement, whereas a negative one was treated as a deterioration of the stand condition. The Shannon-Wiener species diversity was estimated using an iterative principal component analysis (PCA) algorithm based on aerial images. We observed a relationship between the species indices of the individual forest divisions and their response to drought. The highest correlation between the index differences and the Shannon-Wiener indices was found for the Green Normalized Difference Vegetation Index (GNDVI) index (+0.74). In addition, correlations were observed between the mean index difference and the percentage shares in the forest divisions of species such as Pinus sylvestris L. (P. sylvestris) (+0.67 ± 0.08) and Quercus robur L. (Q. robur) (−0.65 ± 0.10). Our results lead us to infer that forest management based on highly diverse habitats is more suitable to meet the challenges in the context of global climatic changes, characterized by increasingly frequent droughts.

1. Introduction

Drought affects all forest ecosystem properties. It is therefore essential to improve drought monitoring by understanding its spatial diversity with relation to tree species diversity, resilience, and resistance [1]. Apart from light, water availability is the most important factor determining tree growth [2]. Water shortage influences the biophysical properties of the vegetation, and the size of this effect depends on the drought duration. For example, water stress results in reduced photosynthesis rates and stomatal closure, thereby inhibiting the growth of all plant cell types [3]. In forest management, it is therefore crucial to obtain up-to-date information about the actual tree habitat condition and its changes caused by drought.
A comparison of remote sensing images of vegetation indices from two periods can indicate a spatial distribution of changes. However, adequate change detection is a challenging issue. Several methods are available to not only determine differences between images, but also to designate an appropriate threshold to distinguish regions with and without changes [4]. Of these methods, image differencing is the most popular one, where an image from one period is subtracted, pixel by pixel, from an image from another period [5].
Research on the impact of drought on ecosystems, taking into account different variables, is important not only for the Central European areas examined in this study, but also for other moderate climate zone regions, including Scandinavian countries, in which adverse impacts of drought on species mortality [6] and distribution [7] of forest complexes have been observed. For example, a 10-year summer drought cycle in southern Finland halted the growth of a 12-year-old oak (Quercus robur L.) stand, irrespective of the health class [8]. It is therefore important to enhance the long-term resistance of such stands to water stress, especially as species ranges shift to northern Europe (Scandinavian countries) and to greater longitudes [9] in the context of global climatic changes. It is expected that in the timeframe of 50–70 years, the mean drought duration in Europe will become considerably longer. Climate models indicate that at present, in northern Europe, the mean period without precipitation is increasing and that from 2070 to 2099, droughts will be markedly longer than in 1961 to 1990 [10]. For example, the maximum duration of the period without precipitation in eastern Finland may increase from 27 to 39 days (as an average from four models) [11]. Our understanding of the present and future drought lengths in Europe should be analyzed in the historical context. Droughts were more prolonged during the Medieval Warm Period (10th–12th century). The occurrence of megadroughts in north-central Europe was similar in timing, duration, and relative intensity to droughts in the North America [12]. The most extreme drought in southern England, but also in Central Europe and Italy, was noticed in 1921 [13]. Other periods of historical droughts were noticed in 1540 (widespread occurrence of moderate to extreme droughts in central Europe), 1616 (including “dried-up rivers”, precipitation deficit, and excessive warmth), 1741 (drought over Ireland contributed to the severity of the “Irish famine”), and the great drought of 1893 over the British Isles and also continental Europe [14].
Also, research on drought response differences between mixed and pure stands has been done during the past decade. Pine–beech mixed stands were indicated to be an effective stand model for climate change in drought-prone sites in the Mediterranean region [15]. Species complementarity may also enhance growth in mixed forests, but competition effects between tree species may override complementarity advantages at the drought-prone sites [16]. Research on temporal shifts between competition and facilitation in mixed forests of beech–oak and beech–spruce in Central Europe showed that the promotion of mixed stands in forest management can improve forest resilience in terms of growth in the face of climate change [17], but this type of forestry should consider the site’s moisture and fertility, as well as climatic conditions [18]. If we assume that water is one of many resources necessary for forest growth, research done during the last two decades has pointed out that species mixing frequently improves resource supply, uptake, use efficiency, and, as a result, also tree and stand growth [19,20,21]. If two species differ in their strategies of space occupation, complementarity and reduction in competition for resources in mixed versus pure stands is possible [22]. This effect may increase when one species exerts a positive effect and facilitates the other [23]. It is important for research studies to take into account the dominant species of the forest stand(s) being considered. In our case, four species may affect the response for drought in 2015.
Drought tolerance varies among forest tree species. In mixed temperate forests, Scotch pine (Pinus sylvestris L.) shows the ability to tolerate long-term and short-term periods of drought, which is related to the morphology, phenology, and adaptability of this species [24]. Q. robur demonstrates less drought tolerance abilities. In comparison with other oak species in the temperate climate zone, this species has higher water requirements and is more vulnerable to water stress [25,26]. On the other hand, Q. robur can also be found on sites with low water availability, for example, on sandy, nutrient-poor soils [27] or on plateaus and the exposed slopes of well-drained limestone hills [28]. In such habitats, pedunculate oak (Q. robur) shows a high drought tolerance, which ensures its survival, and is important for the acclimation of Central European oak species to drought stress [29]. Data from previously established literature indicate that pedunculate oak copes better with drought than red oak Quercus rubra L. (Q. rubra) [30,31,32]. The increased drought tolerance of oak habitats that are generally lacking in diversity may have been caused by the coexistence of pedunculate oak with an admixture of red oak, which has adapted to the limited water resources found in the habitats that it often appears. Despite the fact that both Q. rubra and Q. robur are considered to be highly vulnerable to water stress, they can occupy habitats with varied water availability, although Q. rubra can also occur in extremely dry habitats [30,33]. The most drought sensitive among interested trees seems to be Betula pendula Roth (B. pendula) species. Previous literature indicates that birches are less drought tolerant than Q. robur [34]. Under natural conditions, B. pendula (silver birch) often resides in cool and wet regions, including peat-bogs, stream and lake banks, cool and wet forests, and the slopes of cool bays [35,36]. For this species, water deficit may cause significant stress and is dangerous for both adult individuals and nursery seedlings [37].
This article analyzes the relationship between the stand response to short-term drought and the species diversity measured by remote sensing methods. It is assumed that species diversity is an important element influencing stand resilience to different stressors [38]. Variations in the water regime and the related water shortages caused by reduced precipitation levels are some of the most important factors that contribute to the development of fungal diseases of trees [39,40]. Fungal infections, such as the one caused by the genus Phytophthora (the HESOFF Life + project, European Commision grant no. LIFE11 ENV/PL/000459), or the Dutch elm disease caused by invasive fungal species [41,42] (ELMIAS Life + project, European Commision grant no. LIFE12 NAT/SE/001139), pose some of the greatest threats to natural habitats with ecological and economic values. For this reason, it is important to explore the specific behavior of individual habitats in response to a drought-affected season.
Forest stands selected as HESOFF project test areas were affected by Phytophthora pathogen. The aim of the study was to estimate the influence of phosphite treatments on the health of the affected forests. In situ and remote sensing measurements were conducted between 2012 and 2015. The results of the measurements, carried out by traditional methods, unambiguously demonstrated the occurrence of drought in 2015. The effects of agricultural drought were the greatest in the Wielkopolska region, where its duration exceeded 100 days. The soil drought was also the most intensive there compared with the whole country and the soil water deficit lasted for more than 30 days. The climatic water balance showed that the annual water deficit in 2015 in Wielkopolska—the macroregion where our test site is located—exceeded 100 mm [43].
In the summer of 2016, field surveys were organized. The residents of the surrounding lands confirmed exceptional water shortages in their wells in the previous season (on average, 2.5 times lower water levels). The drought impact affected surveys of the health of oak stands that were conducted every month of the growing season and this was a reason that we decided to estimate this impact. Consequently, vegetation seasons in 2014 and 2015 were selected for this study.
To analyze the stand response to drought, 15 forest complexes near Leszno, Poland, were designated and, using remote sensing techniques, their species diversity and the changes in vegetation indices between 2014 and 2015 were measured. Subsequently, taking into account the species diversity index and other habitat variables, the impacts of drought on the condition of the examined stands were analyzed.

2. Materials and Methods

2.1. Vegetation Indices Change Threshold

A comparison of remotely sensed data for various points in time demands the use of normalized data, where errors and discrepancies caused by sensor and sun locations as well as atmospheric, plant, or soil components are eliminated [44]. The method was found to be efficient for land-cover changes [45] or the mapping of crop plantations [46]. A technique based on differential images was successfully used and recommended for operational application in forests, using the vegetation indices calculated from surface reflectance level products [47] in a habitat suffering from oak dieback [48,49]. The use of the multiplicity of the standard deviation as a change/no change (±σ) (standard deviation) threshold is also a popular approach [5,50].
In our research, the following four steps were carried out [49] for images located on path 190, row 24, of the Landsat system.
Step 1. For further analysis, a set of 10 commonly used remote sensing vegetation indices was prepared: Enhanced Vegetation Index (EVI) [51], Modified Soil-Adjusted Vegetation Index (MSAVI) [52], Normalized Burn Ratio (NBR) [53], Normalized Burn Ratio 2 (NBR2) [53], Normalized Difference Moisture Index (NDMI) [54], Normalized Difference Vegetation Index (NDVI) [55], Soil-Adjusted Vegetation Index (SAVI) [56], Green Normalized Difference Vegetation Index (GNDVI) [57], Atmospherically Resistant Vegetation Index (ARVI) [58], and Blue-Normalized Difference Vegetation Index (BNDVI) [59]. Of these, NDVI is the most popular index used for drought analysis, based on both low-resolution and medium-resolution data [38,50,60,61], as it uses the basic channels registered from the satellite ceiling, i.e., red and near-infrared.
Step 2. The mean values of the vegetation index images for selected forest areas for 2015 were subtracted from those for 2014 to determine the differences between these years. For 2015, the following images were taken, as described with a Julian day and a growing season day in brackets: 111 (14), 127 (30), and 223 (126), while for 2014, they were 92 (6), 140 (54), 156 (70), and 188 (102). A cloud mask was used to eliminate the influence of pixels that were not covered by vegetation, and their shadows were taken into account [62].
Step 3. For all pixels, the mean and the standard deviation were calculated.
Step 4. The mean ΔVI14–15 difference, calculated as the first step, was reduced by the mean VI and divided by the standard deviation Δσ of all the pixels resulting from the differential vegetation index of relative change:
Δ VI =   Δ VI 14 15 VI ¯ Δ σ ,

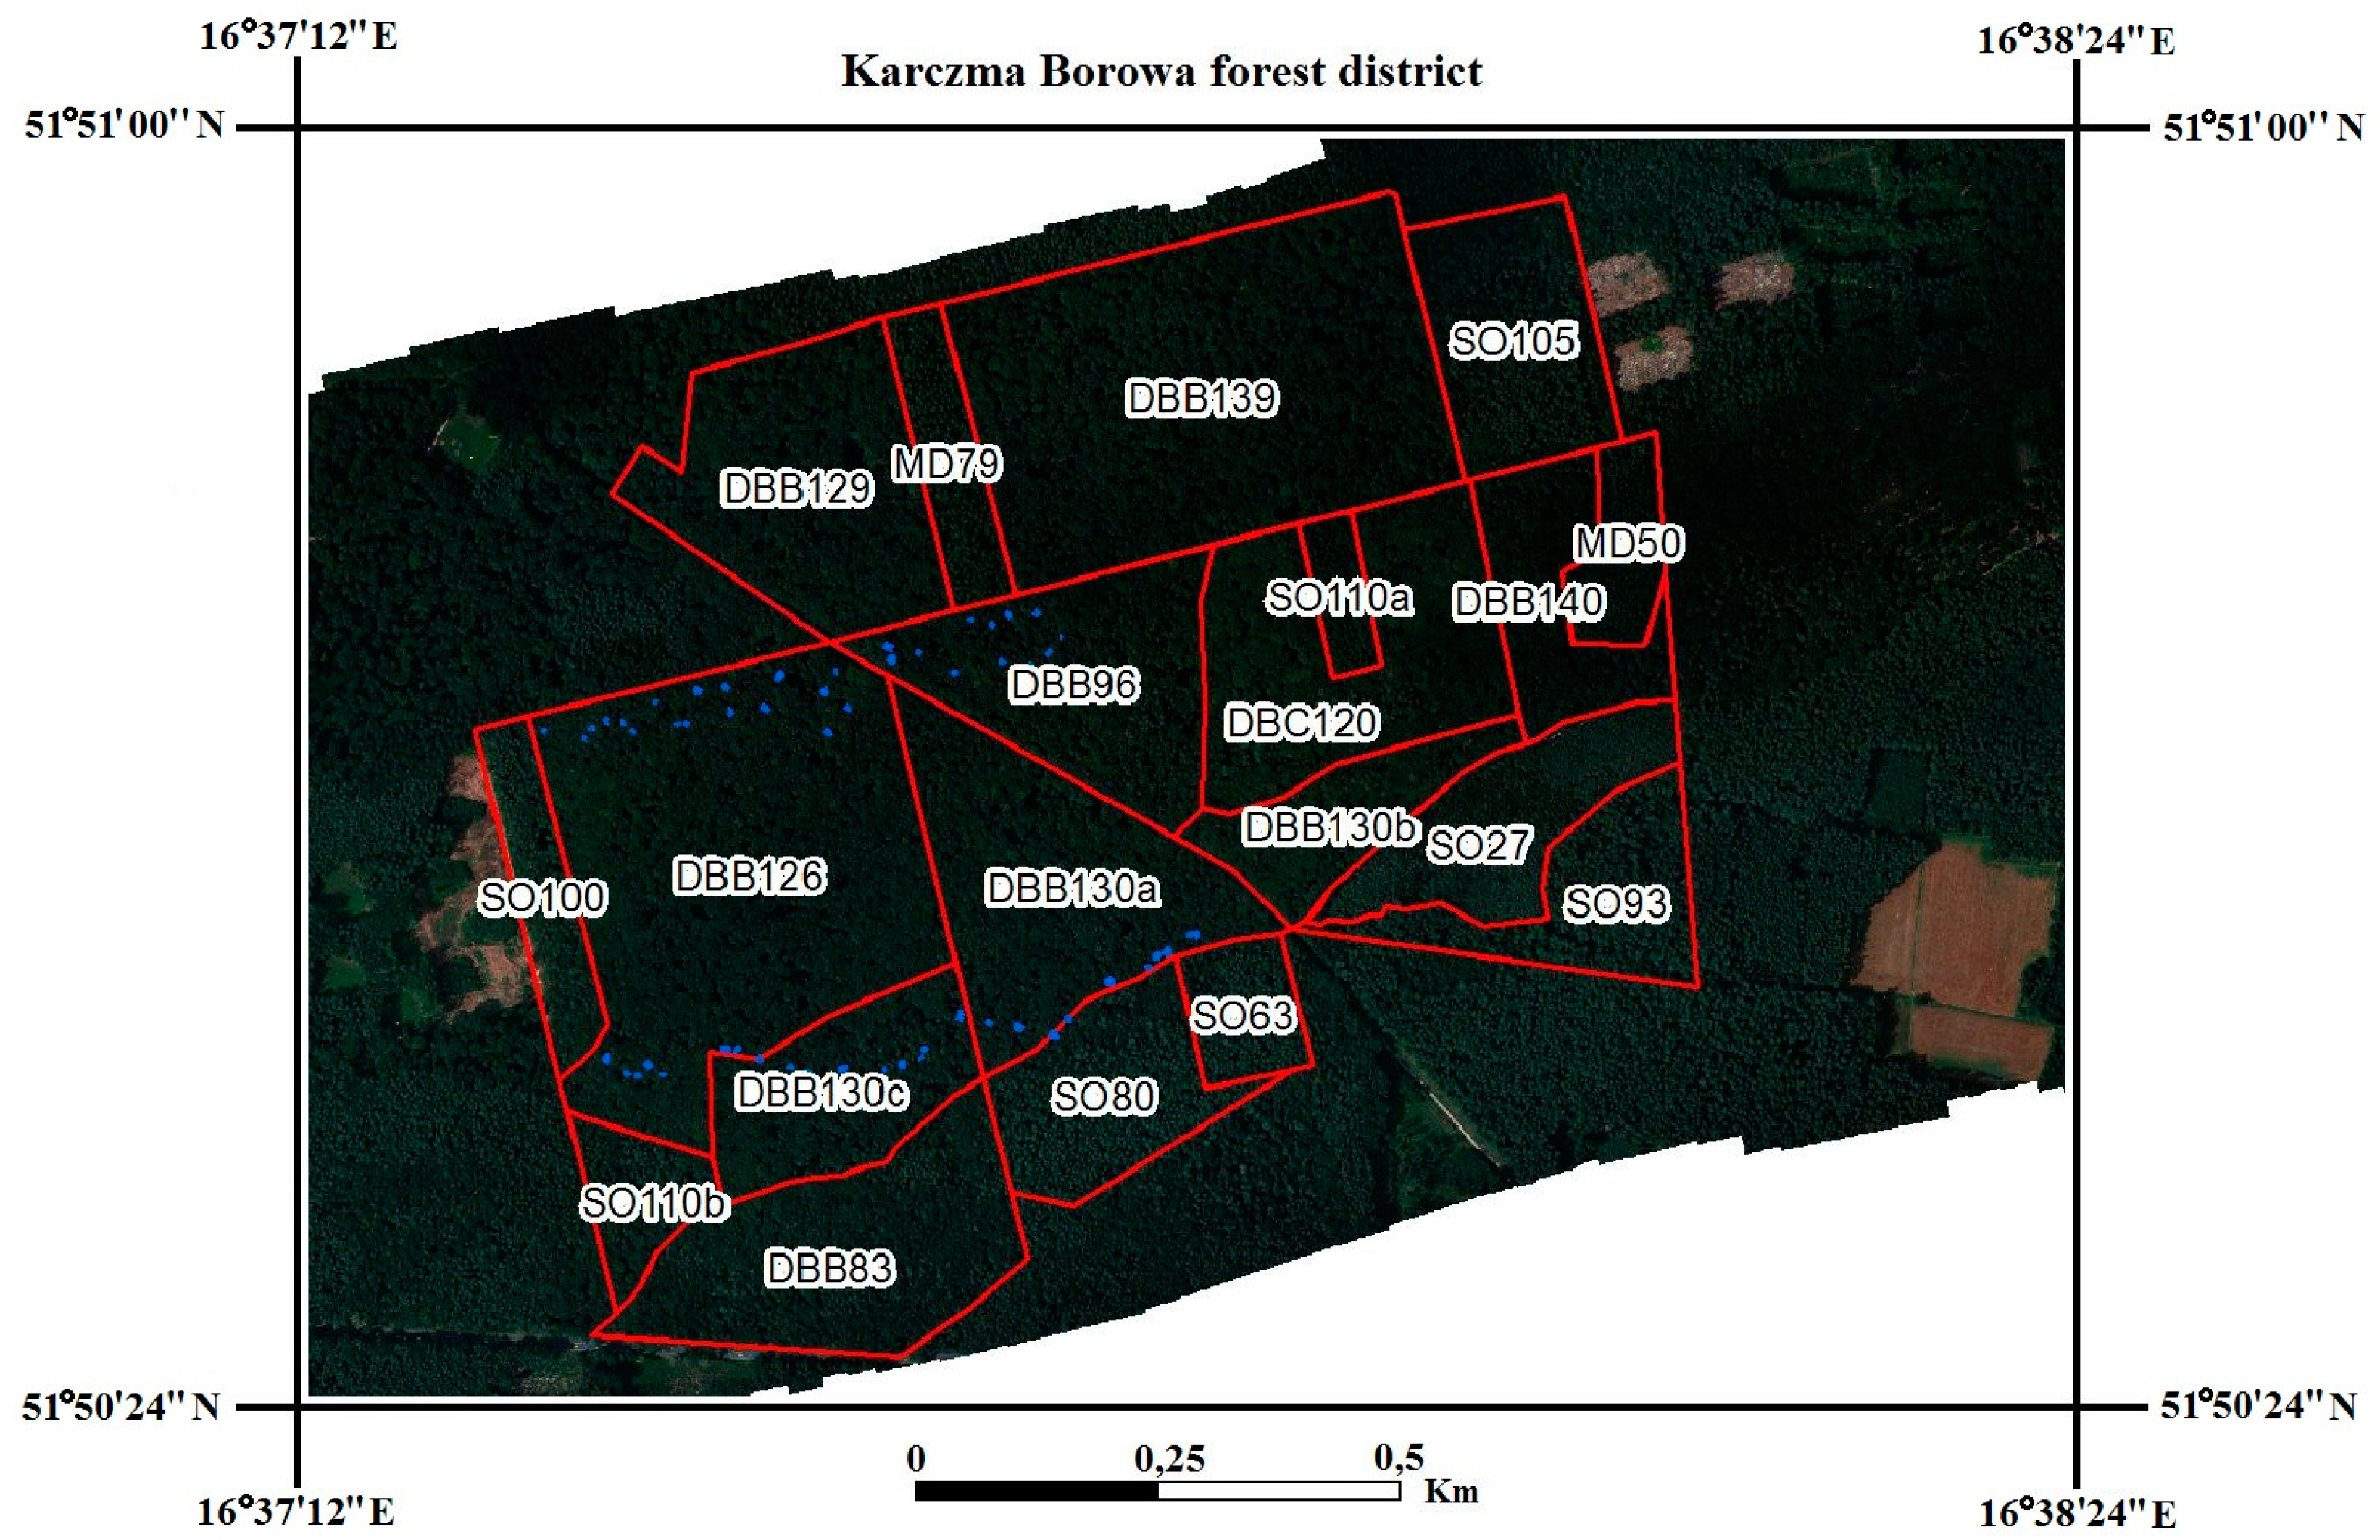
2.2. Determination of Regions of Interest (ROIs)

The forest properties were analyzed in 15 different habitats, which were selected on the basis of Landsat imagery, using Forest Data Bank (FDB) maps showing forest divisions according to dominant species as a reference. The regions of interest included Q. robur specimens selected for the HESOFF project: DBB 126, DBB 96, DBB 130c, and DBB 130a (Figure 1) [63]. The other regions were selected to cover the ortho photomaps to a maximum extent and were derived from photogrammetric products generated in the project [64]. Only 15 out of the 20 selected polygons were used to elaborate the research method (Section 2.3). Of these, 10 were deciduous forests dominated by oak and five were coniferous (two larch forests and three pine forests). The analyzed stands were located in the Karczma Borowa Forest District, near the City of Leszno, in southern Wielkopolska (Poland). All 15 regions of interest (ROIs) are described in Table 1, providing information about the tree and understory coverage, the soil type of the forest habitat, and the properties of dominant tree species, such as age, diameter at breast height (DBH), height, and wealth (abundance of the stand). The name of the region was obtained from the Forest Data Bank. The dominant species, including age, were specified as follows: DBB for Q. robur, DBC for Q. rubra, MD for Larix sp. Mill., and SO for P. sylvestris. Based on Digital Terrain Model information, we may assume that the depth of groundwater is constant for the whole area. Also, water sources such as streams, lakes, or ponds are not present on our test site. The nearest stream is located 2.1 km to the east from our test site, mainly outside the forest complex.
This study follows the assumptions that the main differentiating factors for our 15 forest complexes are: (1) dominant species, (2). diversity of the species, and (3) soil type.

2.3. Estimation of Changes in the Condition of Forest Complexes between 2014 and 2015

The satellite data from the Landsat-8 Operational Land Imager (Landsat-8 OLI) series, products at the level of surface reflectance, were acquired from the ESPA server (https://espa.cr.usgs.gov/ordering/new/) and provided the basis for calculating the differences in indices between 2015 and 2014. These were multispectral data, imaging the land surface from visible light (400–760 nm) through near-infrared (750–1500 nm) to mid-infrared (1500–2600 nm). The calculation of indices, on the basis of spectral channels registering the reflectance of particular wave types, is frequently applied to process the particular wave types, since their values are correlated with changes in the properties of the vegetation, rocks, or water. Knowledge of the specificity of the individual indices and their relationships with changes in the biophysical variables of vegetation enables the monitoring of its condition and, thus, of the specific impacts of stressors.

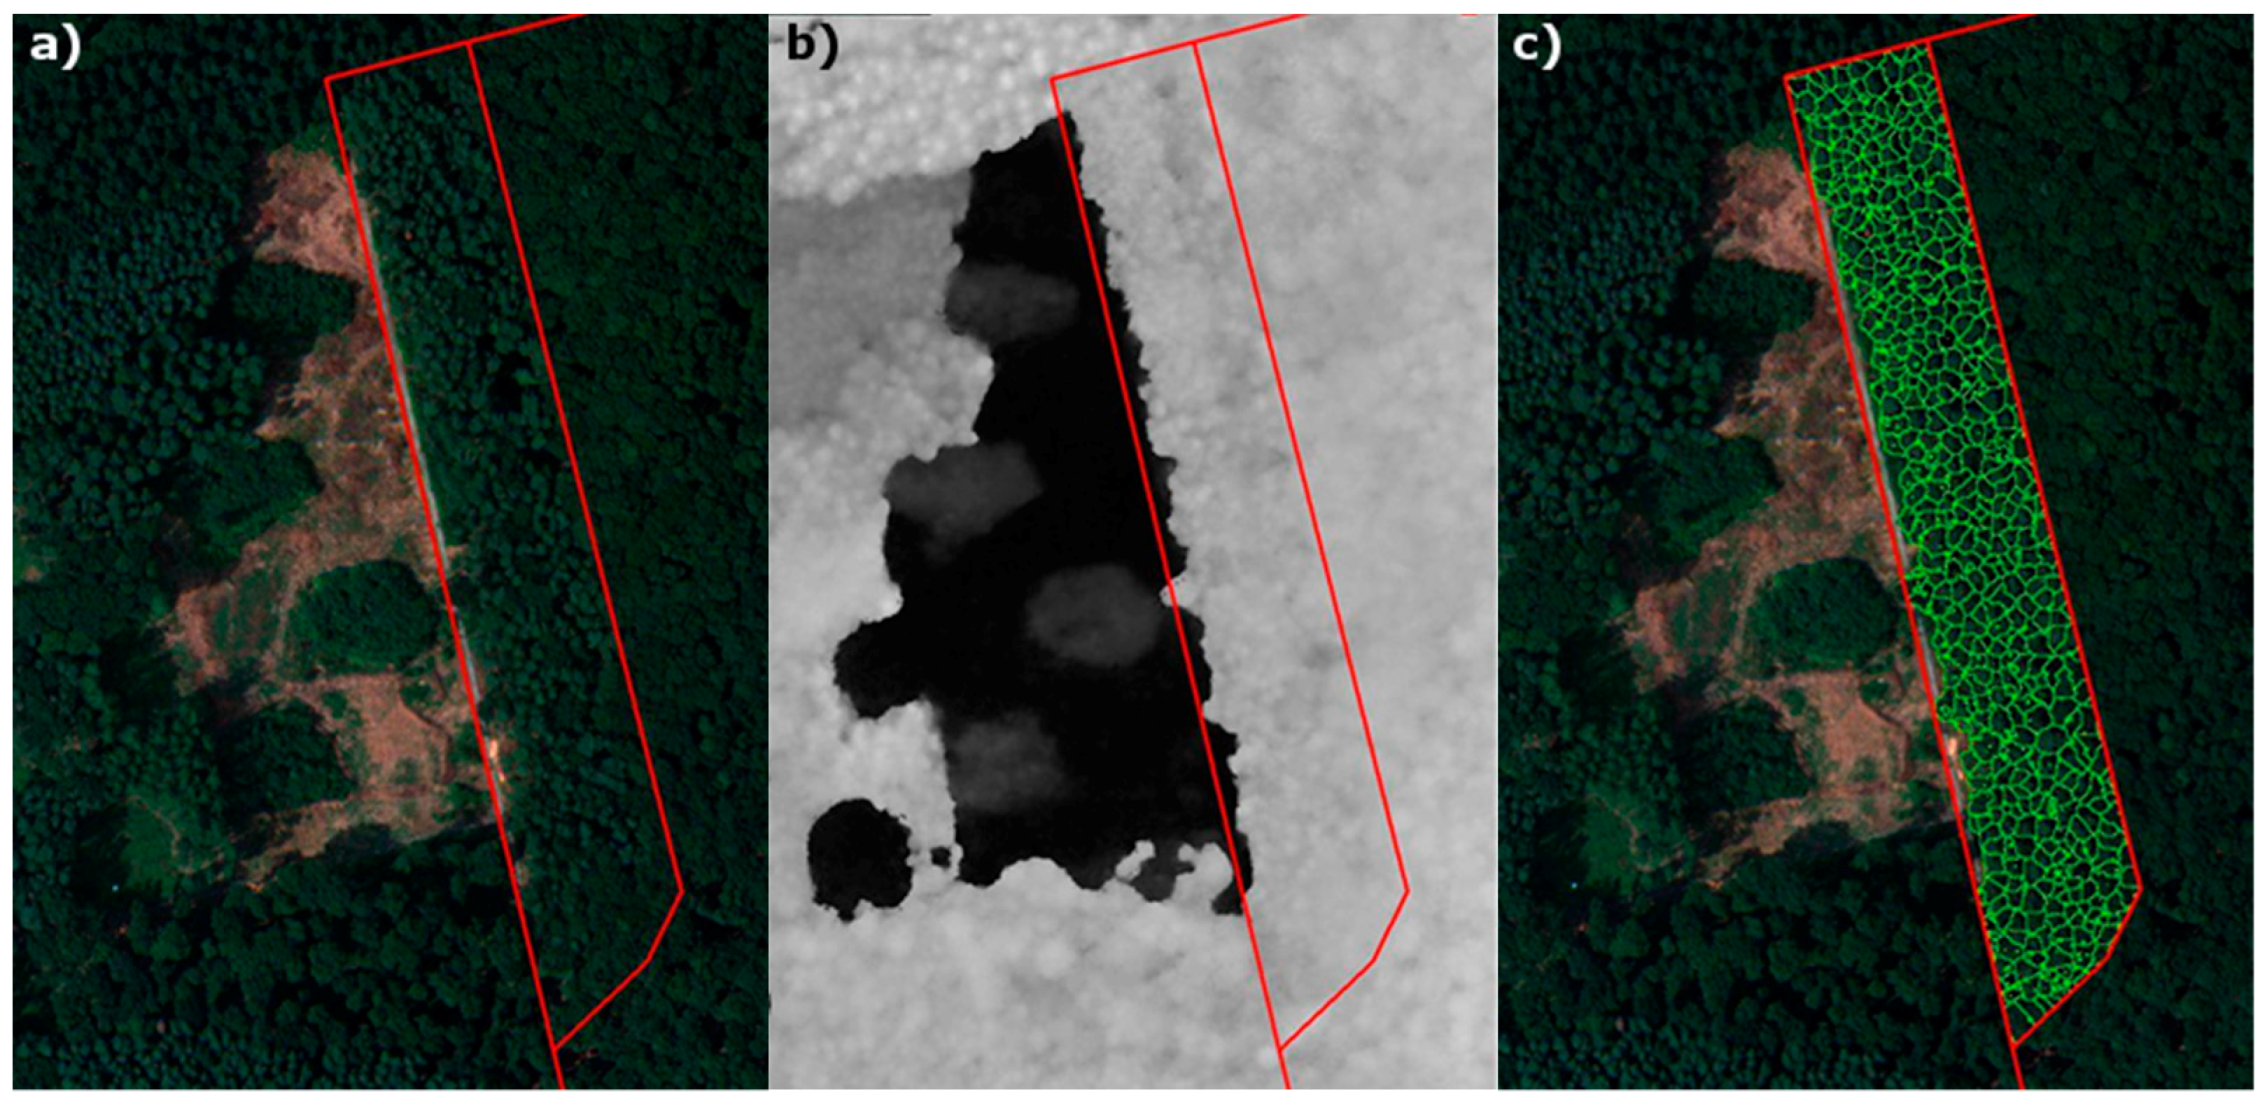
2.4. Segmentation of Tree Crowns in Aerial Images

The segmentation of tree crowns consisted of determining single crowns from the differential elevation model nDSM (Digital Surface Model (DSM) minus Digital Terrain Model (DTM)) (Figure 2). This model was generated from a point cloud established from the matching of the acquired images, using the QUERCUS.6 platform with a GSD (ground sampling distance) of 0.25 m [64]. To acquire a differential model, a point cloud acquired from images taken outside of the growing season (deciduous trees had no leaves) was filtered, enabling terrain observations—this model was used to generate the DTM. The DSM model was generated from images taken in the course of the vegetation season; in this case, a cloud point represented tree crowns. The project did not include an accuracy analysis of the determined heights of single trees. In accordance with Pitkänen et al. (2004) [65], a systematic height error (with height representing the highest point of the crown) can be expected at a level of 1 m for data from airborne scanning (LIDAR: light detection and ranging). In the case of models originating from the matching of images with a GSD of 0.25 m, this error should be higher by a factor of about 1.5–2 for tall trees. In the investigated area, maximum tree height was about 30–40 m.
At present, several algorithms are applied to detect treetops and to determine the range of tree crowns. Among them, methods based on a search for local maxima prevail. In the research proposed here, the watershed algorithm [66] was used. The operating principle of this algorithm consists in reversing the crown model by multiplying the values recorded in the pixel by −1 (the tops become hollows). In the model thus created, the algorithm seeks out micro-catchments-imitating water spillage. The point with the lowest values is determined as the top. The boundaries of such a catchment are considered to be the boundaries of the tree crown [67,68]. In addition, the variables determining the minimum height of the tree crown (only trees taller than 15 m were analyzed) and the minimum height of the tree crown were applied. In view of the variables applied, the results of the segmentation for areas dominated by coniferous trees were unsatisfactory. In light of this, further analyses omitted for regions SO110b, SO110a, SO93, SO63, and SO80 (Figure 3B).

2.5. Estimation of the Species Diversity Index

The species diversity in a given ecosystem or in a designated area may be estimated by measuring two variables: (a) species richness (number of species) and (b) the evenness of individuals of a given species in an ecosystem. These two variables are reflected by the Shannon-Wiener diversity index, which is commonly used in ecological research [69].
The measurement of species diversity using remote sensing methods is based on both a factor analysis of multispectral images [70,71] and digital modelling of the land cover [72]. Time-related analyses of changes observed in both reflectance [73] and in vegetation indices [74] play a special role in environmental studies.
In this paper, the method used to estimate the tree species diversity index in individual forest divisions was based on analysis of multispectral images acquired in July 2015, using the QUERCUS.6 multi-sensor platform [64,75,76]. Imaging was performed in six optical channels within the visible light and near-infrared ranges. An algorithm for an iterative application of a factor analysis of multispectral images was used in post-processing [49,75,77]. Six-dimensional color space was reduced using Principal Component Analysis (PCA) to a two-dimensional Principal Component Plane (PCP) covering over 99.5% color variability. Iso Cluster Unsupervised Classification (ISOCLASS) algorithm was used for reduced data classification. Spectral signatures of certain species were also projected on PCP for classes interpretation. This post-processing method was described in detail in Kotlarz et al. 2016 [77] and Kotlarz and Kacprzak 2017 [78].
As a result of the image classification of an image, the following is determined: (a) the number of classes, including number (n) of classes with mean pseudo-signatures interpreted as biomass, and (b) the share of the quantity of the determined crowns attributed to a given species in all tree crowns. These data can be regarded as estimates of the variables determining the species diversity of the ecosystem in terms of (a) species richness and (b) species evenness. This provides the entire information needed to calculate the Shannon-Wiener diversity index H, which is defined as follows (Equation (2)) [79]:
H = i = 1 n   p i ln ( p i ) ,
where n is the estimate of species richness and pi is the estimate of species evenness.
An iterative PCA analysis was carried out separately for each forest division in order to assign an appropriate tree species diversity index to each division.

2.6. A Comparison of Inventory-Based Stand Characteristics in ROIs and Their Species Diversity with the Changes Observed between 2014 and 2015

A correlation analysis was carried out to identify the relationship between the occurred changes and the habitat variables related to the species diversity of the stands. Pearson’s correlation coefficient was calculated to determine the relationship with the species diversity of tree crowns H, the shares of particular species (Table 2), and the tree variables (Table 1).
In addition, to gain a better understanding of the specificity of the observed changes, the differences and the standard deviations between the indices in 2014 and 2015 were calculated.

2.7. Different Forest Trees Species Features Related to Drought

2.7.1. Quercus robur

Although it has less drought tolerance, Q. robur can also be found on sites with low water content [27,28]. Experimental data acquired under controlled greenhouse conditions also show good drought tolerance of pedunculate oak. The results indicate that under the conditions of progressive drought, plants demonstrate intensive adaptation mechanisms, consisting of the alignment of the physiological potential of leaves [80,81]. In Q. robur, drought causes biomass allocation, leading to reduced foliage in favor of small roots. This seems to be the most important process of the acclimation of oak species to water deficit. At the level of leaves, the acclimation to drought stress consists in osmotic regulation to achieve resistance to dehydration. However, these processes generally occur under moderate drought stress rather than under strong drought stress [26].
Urli et al. (2015) [82] also assessed the ecophysiological response of Quercus ilex L. (Q. ilex) and Q. robur to drought and their vulnerability to dehydration stress under field conditions. Their research indicated that despite limited water availability, the abundance of Q. ilex was comparable to that of the control stand, whereas the abundance of Q. robur dramatically fell as water availability deteriorated. These authors claimed that the different species responses might be caused by the differences in the structure and operation of their hydraulic systems. Q. robur demonstrated the threshold water transport variables in contrast to Q. ilex, in which the transport level was satisfactory—this probably makes pedunculate oak extremely vulnerable to drought [82]. In the context of increased drought frequency and intensity, the findings by Urli et al. (2015) [82] suggest that in the face of progressive climate change, the Q. robur population may be at risk.

2.7.2. Quercus rubra

In Poland, Q. rubra is considered to be an alien species and is characterized by a higher tolerance to drought and frost than native oak species. According to the literature, Q. rubra is a species with a low drought tolerance [83] and is best adapted to habitats with moderate or well-balanced moisture conditions [84]. In Polish stands, it usually constitutes a production or biocenotic admixture or may occur in the form of a homogenous stand [85]. Genetic differences between oak species in drought tolerance can also be seen within a species from a specific geographical location. Research carried out in central Pennsylvania demonstrated that Q. rubra growing in extremely dry habitats had both physiological and morphological features of drought tolerance in contrast to the same species in habitats with higher moisture levels [33].
Under water deficit conditions, Q. rubra can demonstrate changes in hydraulic conductance by adjusting stomata openings at values below −2.3 MPa [32]. Parker et al. (1982) compared the resistance of Quercus alba L. (Q. alba), and Q. rubra to water stress [86]. Both species responded with a change in the osmotic potential in leaves under the impact of drought, and the closing of stomata was triggered by a turgor potential of 0.2 MPa for Q. alba, whereas the respective value for Q. rubra was 0.4. Hinckley et al. (1978) also observed the closing of stomata at higher values of the osmotic potential in red oak than those for white oak, indicating that Q. alba was more capable of adapting to drought than Q. rubra was [87]. Despite the fact that, as indicated in the literature, it is a typical species which avoids drought [88], our research demonstrated its positive effect on the drought resistance of habitats with addition of Q. rubra.

2.7.3. Pinus sylvestris

The results of the analysis of remote sensing indices also demonstrate that an enhanced share of Scotch pine increases the drought resistance of forest ecosystems, which has also been confirmed by the scientific community and forestry experiments. Scotch pine is a species with a demonstrated ability to tolerate long-term and short-term changes in water availability. This is related to the morphology, phenology, and adaptability of this species. Under the conditions of increased water deficit, pine development is negatively impacted, resulting in changes in tree morphology, such as reduced height, changes in tree form, leaf shape, and size, and altered wood anatomy [24]. Prolonged drought decreases the growth rate of Scotch pine, which is reflected by its reduced DBH. In short drought periods, a reduced height may not be noticed. This is related to the phenology of the pine: needles remain on the tree for one to five years; therefore, seasonal drought may not have any adverse effects on tree development [89]. Moreover, pine often colonizes dry habitats, such as dunes. Pine species are adapted to such habitats since their roots are characterized by a taproot structure, enabling the trees to take up water, along with mineral salts, from deeper soil layers, thereby helping the trees to survive short-term droughts.

2.7.4. Betula pendula

The analysis of areas containing birch yielded disputable results. Although the obtained results concerned only three out of the fifteen examined divisions, they indicated that the drought resistance of forest stands increased with increasing numbers of B. pendula. Scientific research indicates that birch leaves are vulnerable to water stress [81], and the species demonstrated severely reduced growth as a result of mild water stress. In addition, in the course of a drought during daytime hours, birch leaves did not show any significant accumulation of dissolved substances, which caused a drop in the water potential in the leaves; we therefore assume that growth during daytime is constrained by low turgor. When subjected to water stress, the plants showed reduced growth and low stomatal conductance. No mechanisms for adapting stomata to drought stress could be seen. After water had been supplied to the plants, a slow regeneration of the stomata occurred [81]. In turn, Ranney et al. (1990) observed that stomata responded directly to water deficit in leaves [90]. Humphries et al. (1982) also found that B. pendula had low water stress tolerance [91]. The authors found a higher mortality of B. pendula seedlings under less intensive water stress compared to that of Buddleja davidii Franch (B. davidii) under more severe drought [91].

3. Results

3.1. Habitat Characteristics

In our study region, 10 out of 15 investigated stands grew on rusty brown soils. Two oak stands and one pine stand grew on acid brown soils; there were two stands on gley soils: one pine stand and one oak stand. Very dense tree cover dominated (with a median of 100%); most of the trees were older (with a median of 126 years for oaks and 100 years for pines). Table 1 shows the detailed results.

3.2. Species Diversity Indices of Tree Crowns in the Particular Forest Divisions

In the evaluated forest divisions, tree crown classes corresponding to the following species or genera were determined: Q. robur (with a mean share in the biomass of a single ROI of 55.7%), P. sylvestris (21.2%), Larix sp. (11.6%), Q. rubra (8.2%), C. betulus (1.3%), P. abies (1.2%), B. pendula (1.1%), F. sylvatica (0.8%), Pseudotsuga menziesii Carrière (<0.1%), and Tilia sp. L. (<0.1%). Divisions with the highest species diversity indices H included MD50 (0.882), DBB 130c (0.860), and DBB 130b (0.829). Here, the relatively high diversity indices resulted from large admixtures of red oak (10–20%) and larch (>10%) in stands dominated by pedunculate oak (70–75%) or a substantial admixture of Scotch pine (>30%) in stands dominated by larch (>55%). The more homogenous divisions (H < 0.100) were dominated by pedunculate oak (DBB 126, DBB 129, DBB 130a, and DBB 139). Table 2 shows the detailed results.

3.3. Coefficients of Correlation between the Characteristics of ROIs and Their Responses to Drought

Table 3 presents the relative values of change in calculated differences for 10 well-known vegetation indices. The results are values which represent a relative improvement or a deterioration of the stand condition in the course of one year for the particular divisions without prejudging the nature of the causes that produce the phenomena (including short-term drought). Values in the range from −1 (σ) to +1 (σ) are interpreted as the absence of a change in the examined stand [5,50]. Negative results indicate that the environmental conditions caused by drought have brought about an adverse change in the stand. Positive values correspond to stands that are more resistant to stressors. The most important factor that determines the stand response to drought is the forest type: forests dominated by coniferous species respond in a different manner (better) to water stress than deciduous stands.
The statistics summing up the occurred changes include the mean and the standard deviation for all indices (Table 3). When calculated for the rows of Table 3, i.e., for the particular forest divisions, they represent the mean response of the forest divisions to drought and the differentiation of this response for selected indices.
The results of the Pearson’s correlation between the observed changes in the stand condition and the environmental indices indicate the following relationships:
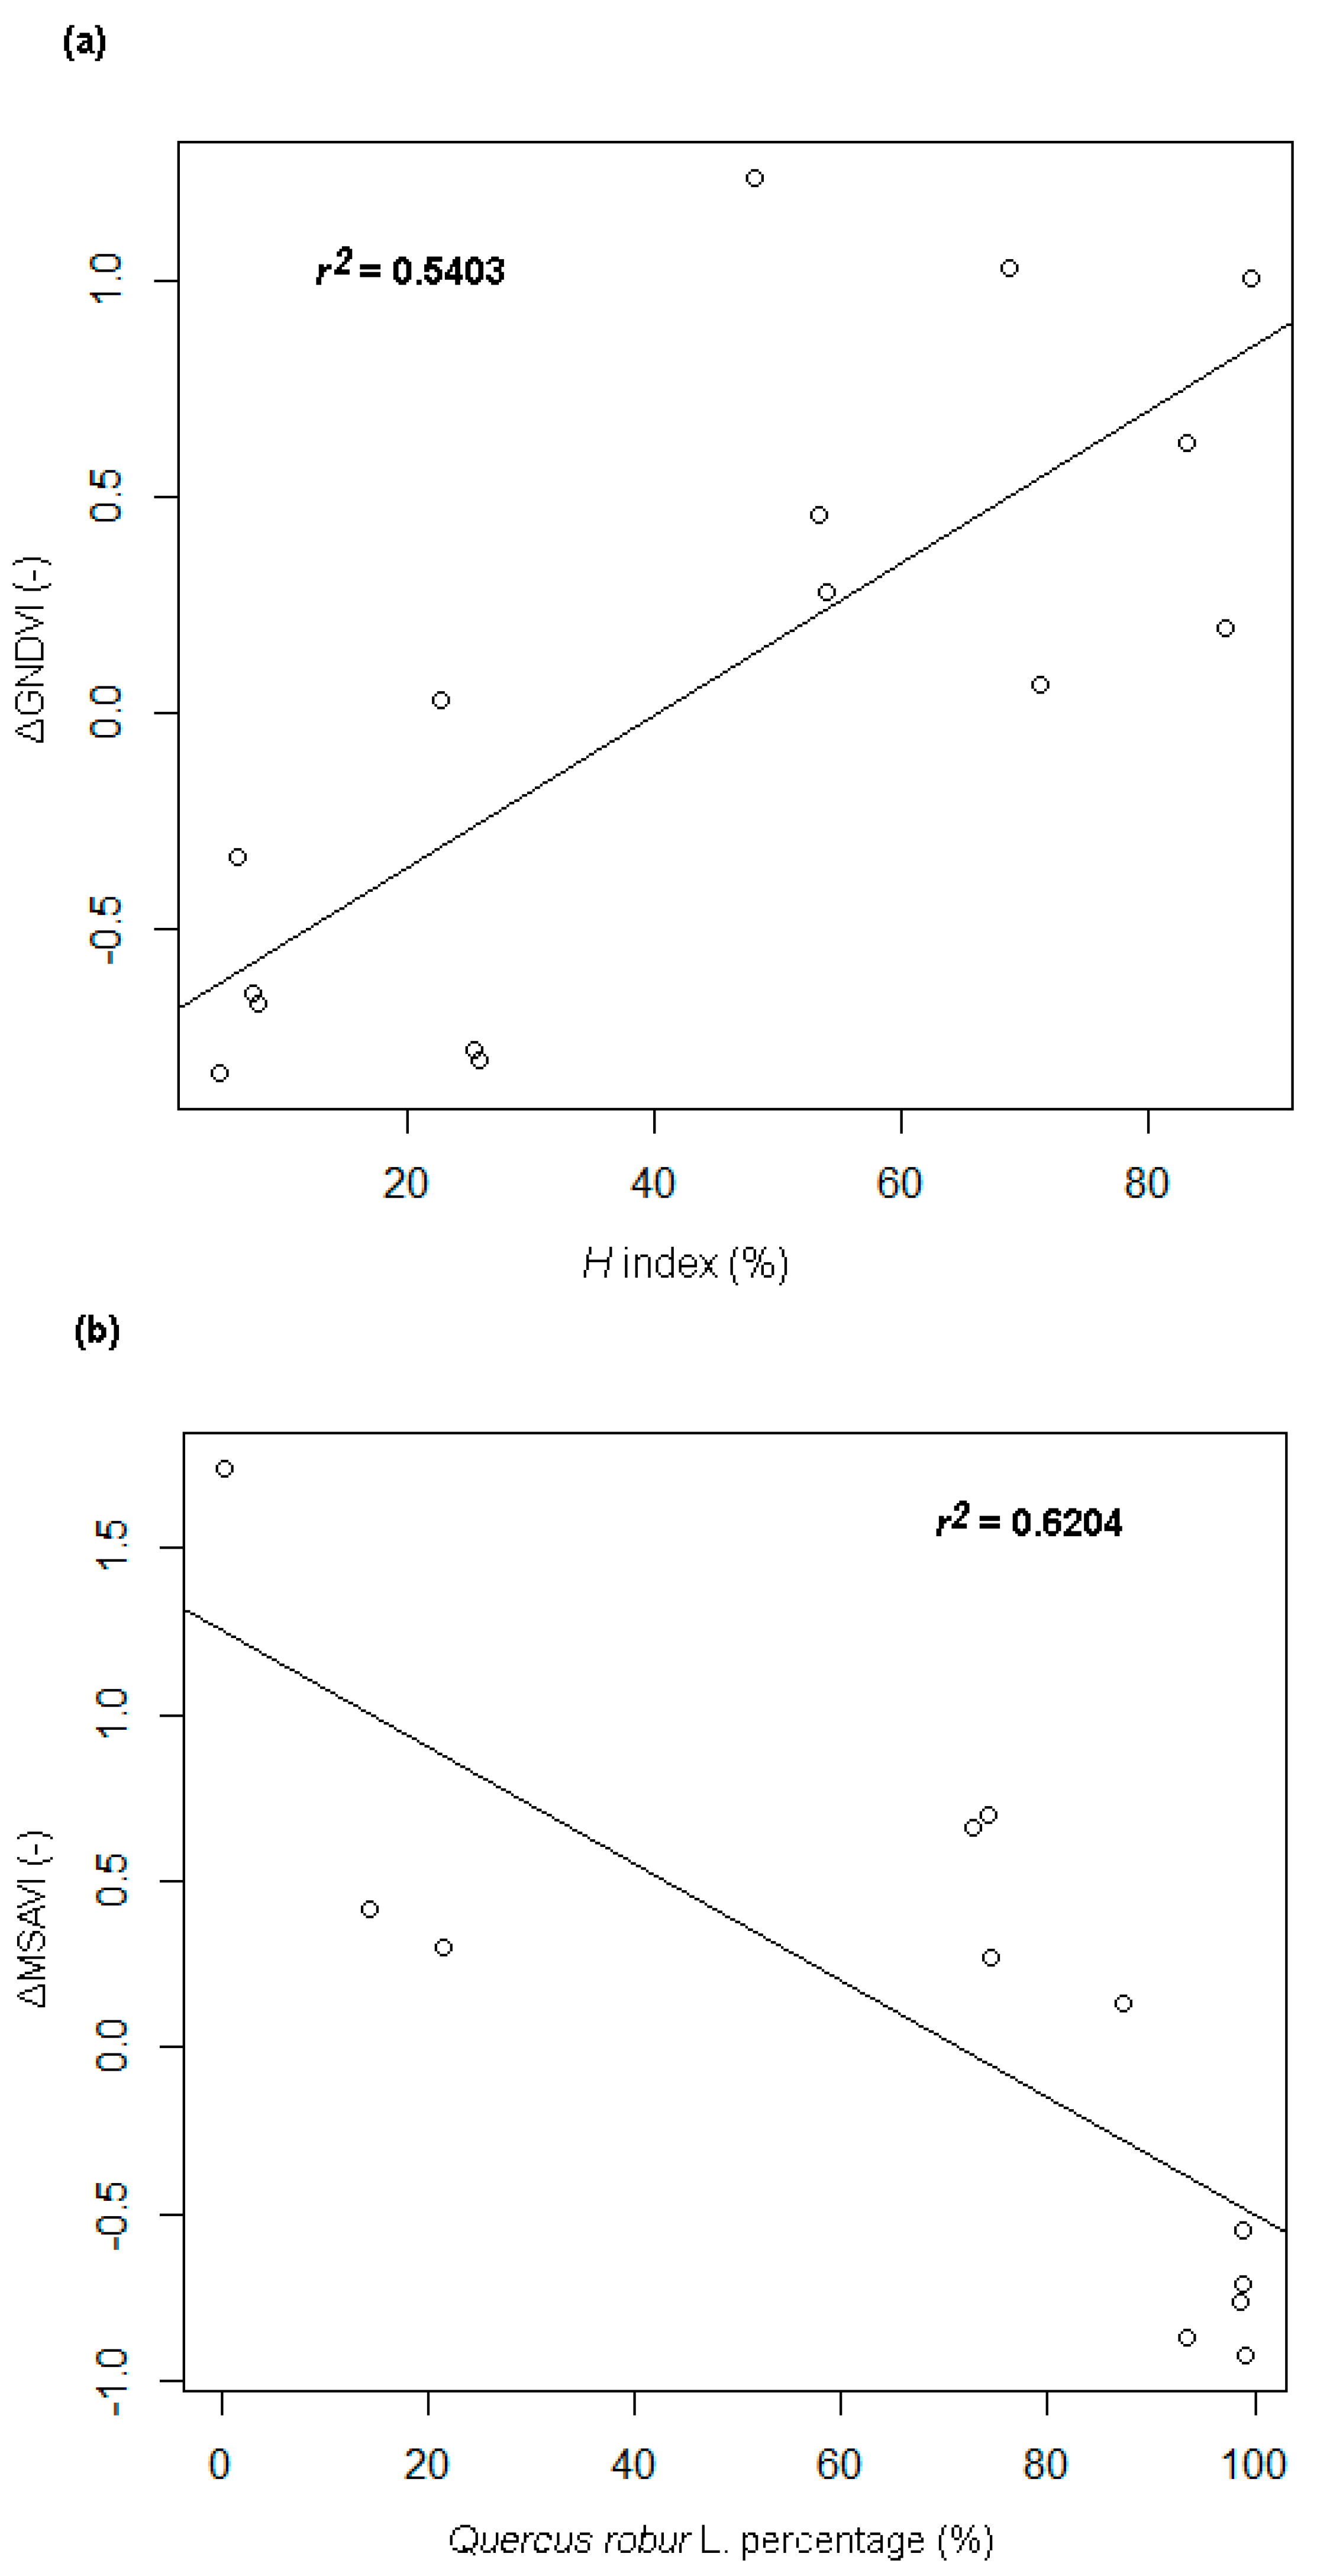
  • A strong positive correlation between the Shannon-Wiener species diversity of tree crowns and the particular vegetation indices differences (ΔVIs); the mean value of the correlation is 0.66 (±0.083); the strongest correlation (+0.73, r² = 0.54; p-value < 0.005) occurred for the ΔGNDVI differential index (Figure 4a), while the lowest one could be observed for ΔNDMI (+0.57).
  • A strong negative correlation between the percentage share of the tree crowns of the Q. robur species and the particular ΔVIs. The strongest relationship (with a correlation coefficient of −0.69, r² = 0.48) was found for the correlation with the ΔMSAVI index (Figure 4b).
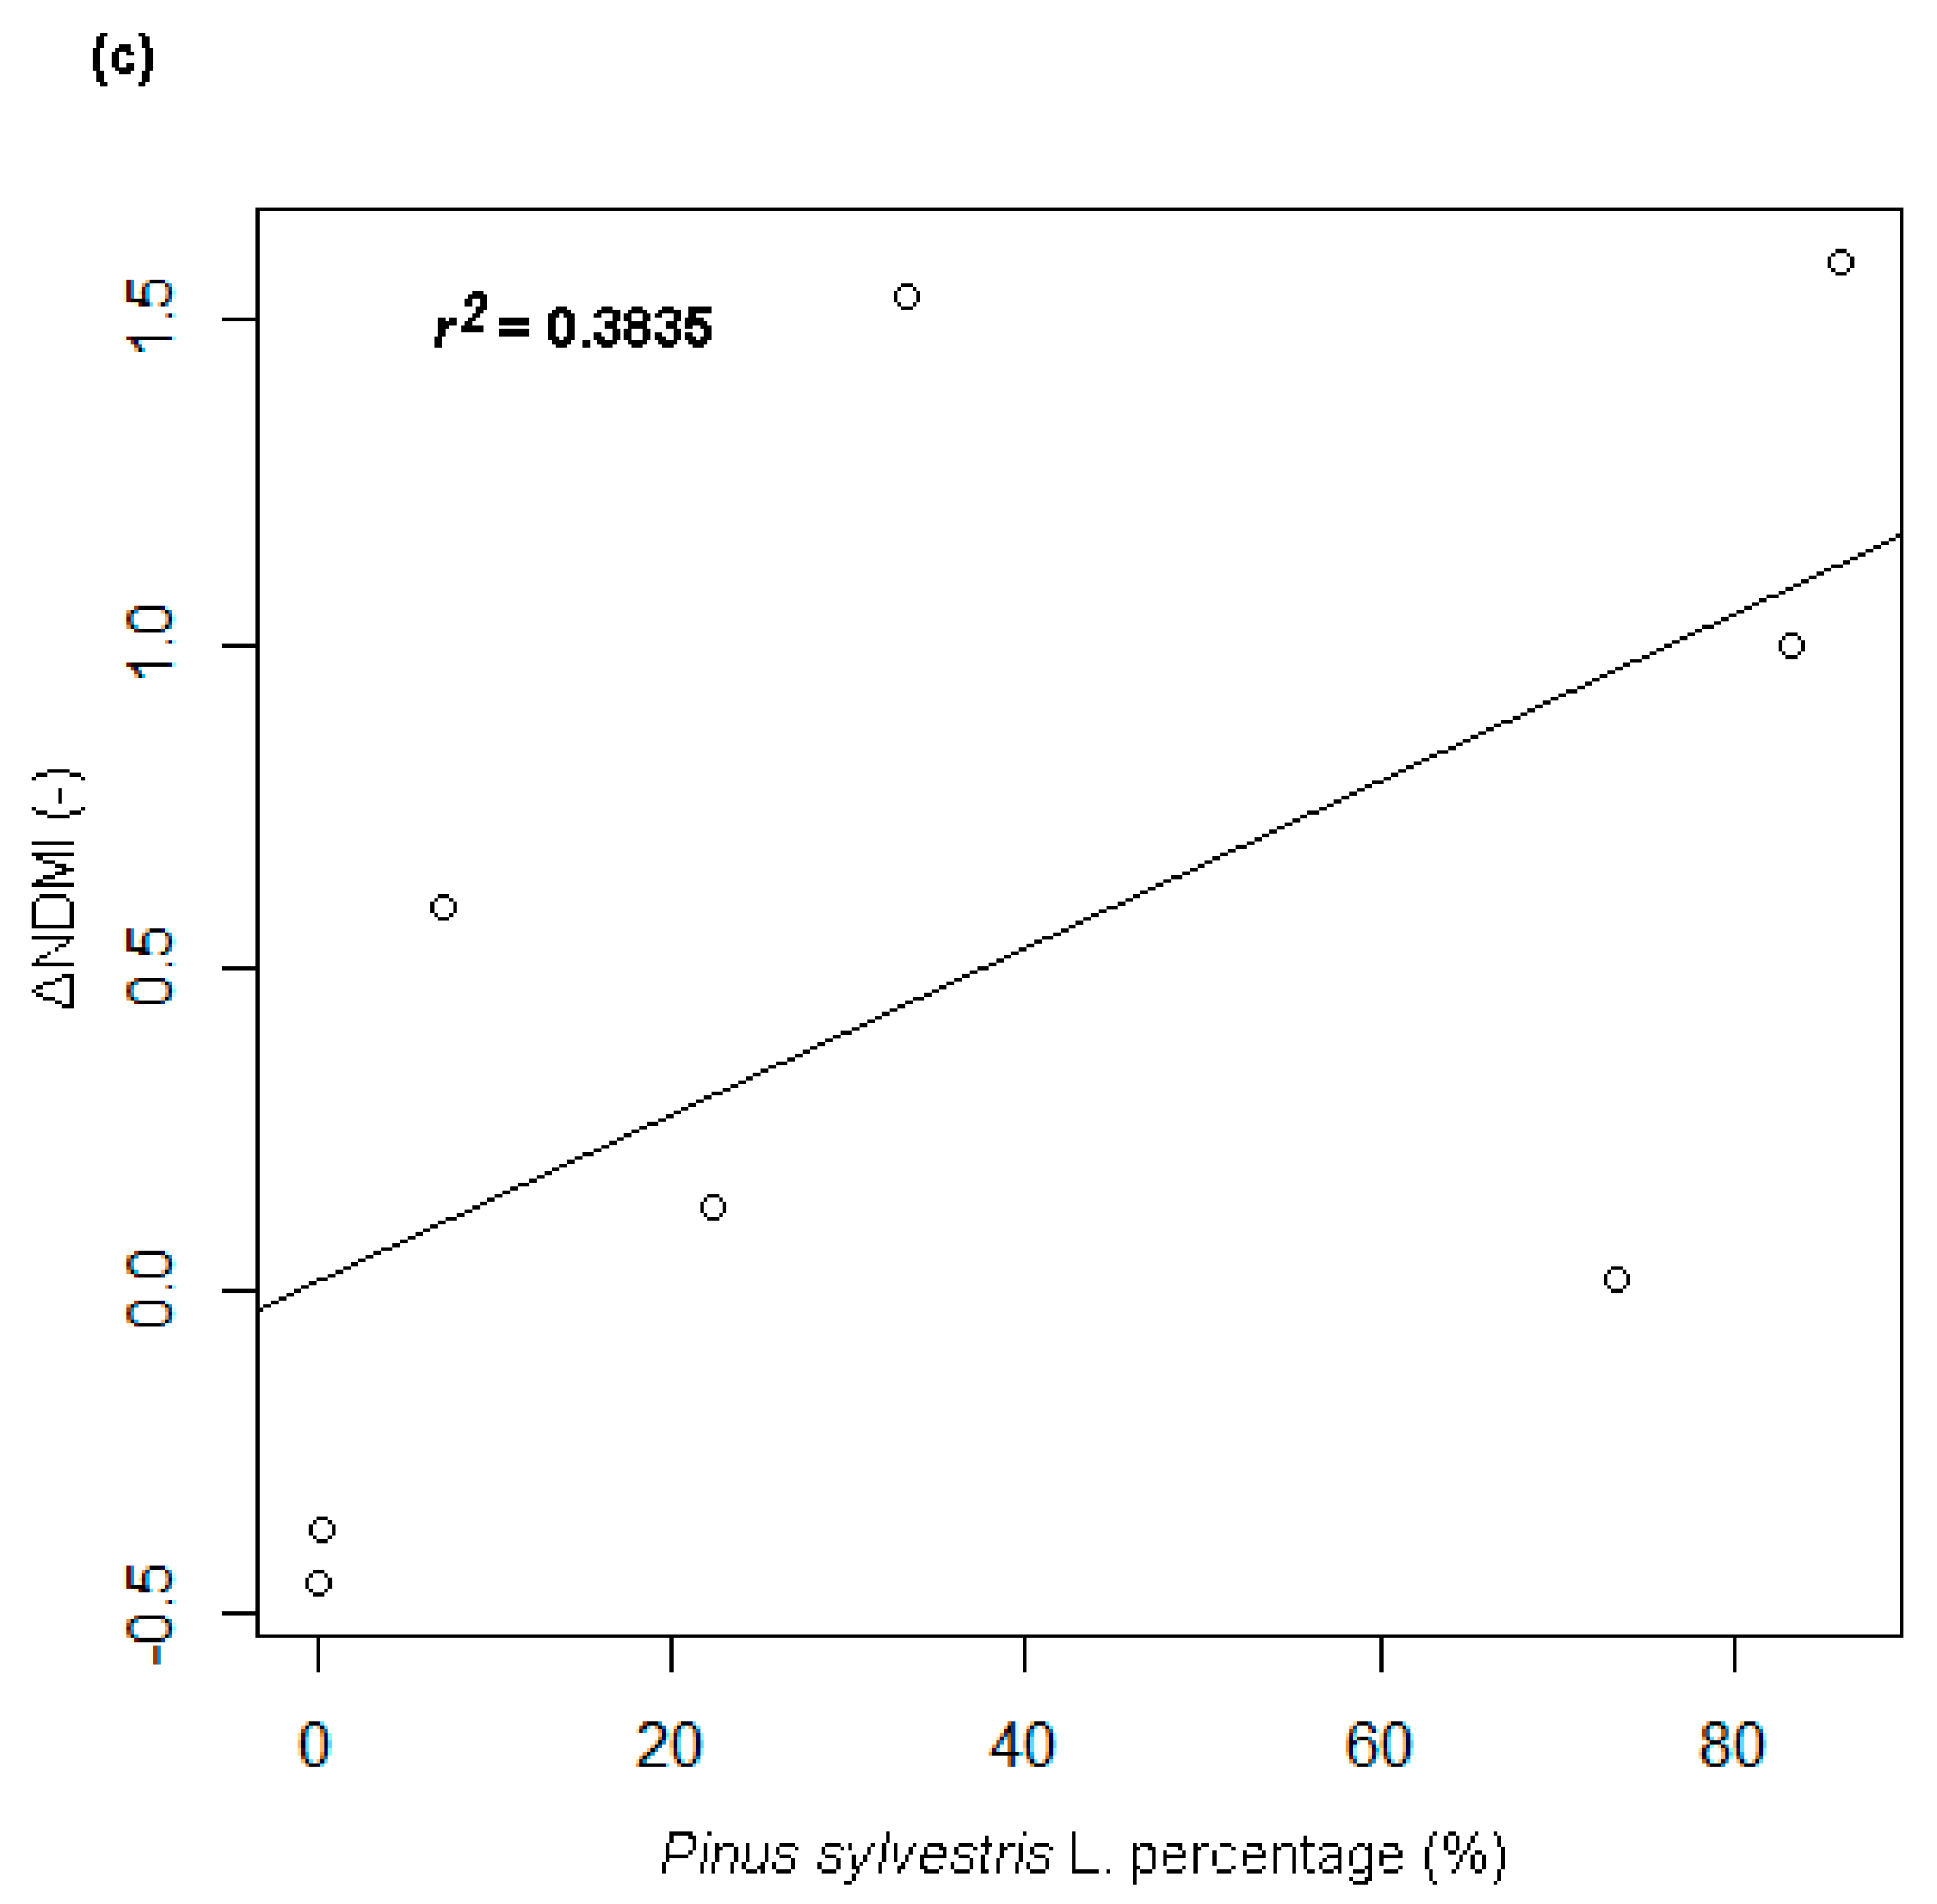
  • A strong positive correlation between the percentage share of the tree crowns of the Pinus sp. and the particular ΔVIs. The strongest relationship (with the correlation coefficient of +0.72, r² = 0.53) was found for the correlation with the ΔNDMI index (Figure 4c).
A statistically significant correlation for some indices was found for B.pendula (e.g., for ΔMSAVI, with a correlation coefficient of +0.56); however, the quantitative representation of this species is relatively small, necessitating caution in interpreting the results.
Highly significant correlations were found for all differential indices in relation to the following four variables: age, DBH, height, and stock. This confirms the results of the previous research carried out in this area, which demonstrated the relationship between the age of a stand and its resistance to drought.
Table 4 shows the detailed results in terms of the correlation between the differential and environmental indices.

4. Discussion

Based on our results, we can draw conclusions about the impact of drought on stand resistance, assessed via the following factors: habitat conditions, species diversity, and the dominant species in the stand. The highest correlations between the differential indices and the Shannon-Wiener index were observed for GNDVI (+0.74), BNDVI (+0.68), and SAVI (+0.68).
We found no relationship between the differential indices and the indices demonstrating tree and understory coverage. However, a statistically significant relationship was found for the variables characterizing the dominant species in a given stand for all analyzed ΔVIs. The resistance to drought increases with decreasing diameter at breast height (DBH), height, and abundance.

4.1. Species Diversity

Divisions MD50 and SO27 were characterized by the highest resistance to drought. These habitats had the youngest stands and thus the lowest DBH, age, and abundance. At the same time, division MD50 showed the highest species diversity index (88.24%), while SO27 had the largest share of Scotch pine. It should be noted that Nasiłowska et al. (2017) [49] indicated both species diversity and the share of Scotch pine within a division as factors enhancing the response to drought. In turn, the values of indices decreasing within the ranges (−0.79 to −0.99), (−0.67 to −0.81), and (−0.68 to −0.87) could be seen for divisions DBB 126, DBB 129, and DBB 96, evidencing a negative trend in the development of the local vegetation. These were the divisions with the lowest species diversity index values (all below 9.0%) and Q. robur as the dominant species.
When comparing the indices H of all divisions with the corresponding differential indices, a mean correlation coefficient of +0.66 (±0.042) was obtained, confirming a decisive effect of H parameter on the stand response to drought. It should be pointed out that the study on the impact of species diversity on the stand response to drought could not consider the simultaneous effects of factors such as forest type or dominant species, and it was only a simultaneous analysis of the index H and the other habitat variables that ensured a full description of the reasons for the behavior of stands under stress conditions. However, our results also show exceptions to this general trend.
Two divisions with a low diversity index, i.e., DBB 130a (H = 0.064) and DBB 139 (H = 0.076), demonstrated higher drought resistance than a division with higher diversity, i.e., DBB 96 (H = 0.26). This could have been caused by a poor understory in division DBB 96 and a small percentage share of additional species in the oak stand (<7.0%). This example shows that one must not interpret the index H uncritically, as it is sensitive to the number of scarce species in a stand.

4.2. Dominant Species

The percentage share of the determined tree species was significantly (p-value < 0.05) correlated with ΔVIs for most indices only for Q. robur (−0.63 ± 0.04) and B. pendula (+0.55 ± 0.02), as well as for all indices for P. sylvestris (+0.63 ± 0.096). This result indicates that the resistance of forest stands to drought increased as the percentage share of Q. robur diminished and the shares of B. pendula and P. sylvestris increased.
Two notable observations in the literature regarding Q. robur may be confirmed by our results. Q. robur monocultures are less resistant to drought than Q. rubra and P. sylvestris monocultures. Oak stands with Q. robur share >98% had mean ΔVIs below −0.46, for one Q. rubra monoculture the ΔVI was equal to +0.11 and for two P. sylvestris monocultures the ΔVIs were higher than +0.66. Very interesting is the influence of soil type on the almost pure oak stands. The lowest values of the differential indices, just below the interpretation threshold (−0.99 for the ΔBNDVI), were found in DB126, a 126-year-old homogenous (H = 49.0%) oak stand. Among the analyzed oak divisions with low diversity, it was the only one situated on gley soils. In non-drought periods, these soils favor the growth of wet forests and cause the development of more shallow root systems as a result of gleying [92], thus creating ecosystems that are more vulnerable to water stress. During drought periods, these soils are characterized by an exceptional water deficit, leading to water stress in plants [93].
The second phenomenon that was observed on our test site was reducing foliage in favor of small roots, which is probably part of the process of the acclimation of Central European oak species to drought stress. This is confirmed by the highest significance of the correlation between the percentage share of Q. robur and the NDMI differential index.
Comparison between Q. robur monocultures and mixed stands show large difference between corresponding ΔVIs: below −0.46 for monocultures and near 0.00 or +.0.57 for mixed stands. Mixed stands with relative small admixtures of Q. rubra or P. sylvestris seem to be most resistant to drought (>0.57). For an oak–pine mixed stand, but with inverse proportions, the ΔVI was average (+0.04).
In areas DBB 130b and DBB 130c, where Q. robur dominated with a share of Q. rubra (17.7% and 11.16%, respectively), a higher drought tolerance was found than in areas with higher biodiversity, such as DBB 96. Despite the fact that, as indicated in the literature, it is a species that typically avoids drought [88], our research demonstrated that, when found alongside the addition of Q. rubra, Q. robur appeared to have positive effects on the drought resistance of habitats. This study found that areas overgrown by pedunculate oak, with an admixture of Q. rubra (DBB 130b and DBB 130c), had a higher drought tolerance than areas without Q. rubra. This might also be related to the habitat requirements of both oak species. Q. robur is a species with high soil requirements, as it prefers rich soils, such as brown and lessive soils and black earths, whereas Q. rubra develops well on poorer soils, such as clayey sands and sandy soils [94]. On the Krotoszyn Plateau, the areas under study were dominated by low-fertile gley soils, to which red oak was considerably better adapted than pedunculate oak. Vivin et al. (1993) found that the richness/fertilization of a habitat had a significant impact on the growth and development of Q. robur and Q. rubra under water deficit conditions [95]. Under the impact of a prolonged drought, the mortality of young Q. robur specimens was higher than that of Q. rubra and, on this basis, the authors noted that Q. rubra was a species with a higher tolerance to drought stress than Q. robur. They also found that both species coped better with drought stress if mineral fertilizers were provided, which was probably related to the osmoregulation mechanism in the case of a low water potential [95].
Our results confirmed that P. sylvestris monocultures are drought resistant. The worse difference index observed for the pine stand with oak admixture (21.65%) should be the subject of future research.
These observations will help add to the data from previous literature, since an assessment of the vulnerability of trees to drought is of major importance for improving the forecasts of the dieback of forests and species under the impact of climate change. This topic is very complex, because favorable climatic periods that allow for abundant tree growth may result in structural overshoot of aboveground tree biomass and when water and temperature stress occurs premature leaf senescence and partial canopy dieback to whole-tree mortality may occur as a consequence, thus reducing canopy leaf area during the stress [96]. On the other hand, historical data suggests that dry forests are experiencing increasing drought-induced mortality, but this observation is not absolutely true for all of the forest types, and the spatial variability of this phenomenon is very large [97]. Certain forest tree species demonstrate substantially different needs in terms of water supply. In particular, this is the case with oaks [98]. For example, a direct comparison between Quercus petraea (Matt.) Liebl. (Q. petraea), Q. robur, and Q. rubra has shown that Q. petraea is more resistant to drought than the other two species [95].

4.3. Monitoring Water Stress Using Differential Indices

Among the analyzed indices, only ΔGNDVI accommodated the green channel and is thus the only index sensitive to the chlorophyll content in cellular structures. The chlorophyll content indicates the condition of the vegetation and its photosynthetic potential; the higher the content, the more energy can be absorbed and used for plant development. A reduced share of this pigment in cellular structures can be seen in the lower reflectance in green light. As indicated by the literature, its value should be independent of changes in pigments other than chlorophyll [57], which is responsible for light absorption; its efficiency depends on stressors. The ΔGNDVI, which shows the drought impact, correlates most strongly with biodiversity; we therefore conclude that this green pigment and its quantity in the habitat determines and differentiates the spectral response to a greater extent than other factors do.
In addition, this index should be independent of the impact of the soil visible between leaves or the impact of the atmosphere, which is particularly important for forest areas [57]. Moreover, its relationship with the diversity index H is stronger than that for classical indices, which are applied on a standard basis to eliminate the impact of the substrate (Table 4), such as SAVI [56] and MSAVI [52].
Considering all these factors, this index is increasingly used to investigate stress in vegetation [99,100,101]. Our results indicate that it is useful for forests and suggest that it should be used more frequently as an alternative to NDVI.

4.3.1. Quercus sp. L.

The ΔMSAVI differential index is distinguished by its strongest correlation (displaying the highest statistical significance) with the percentage share of the dominant species Q. robur. It has been designed to enhance its sensitivity to changes in the condition of vegetation and, at the same time, to eliminate soil impact, making it less dependent on the quantity of the biomass than the original SAVI. This factor clearly affects the drought response of oak. However, when approached in general terms (Table 3), the variation of both ΔMSAVI and ΔSAVI is similar (with a standard deviation of 0.81). This indicates the greater usefulness of the ΔMSAVI index for investigating forest environments dominated by Quercus species.

4.3.2. Pinus sp. L.

The percentage share of the species P. sylvestris showed the most significant statistical correlation with the ΔNDMI differential index. This coniferous tree species occurred in several analyzed habitats and dominated three of them, i.e., SO100, SO105, and SO27 (Table 1). Among the three analyzed indices based on mid-infrared, it demonstrates by far the strongest relationship with drought. Therefore, when comparing the results in Table 3, it can be considered that trends of change shown by ΔNBR and ΔNBR2 are less reliable than those calculated using ΔNDMI. Research performed to date has indicated the usefulness of indices based on mid-infrared for investigating coniferous forests [102,103,104]. The present study demonstrates that the index calculated on the basis of bands 5 (880 nm) and 6 (1610 nm) more adequately shows the condition of a stand with a large share of pine than the other two indices (NBR and NBR2), considering the second reflectance maximum in mid-infrared of 2200 nm (band 7). It is possible to better explore the behavior of these three indices and their usefulness for investigating drought impacts for a larger number of divisions including this species, whereas this study considers only three of them.

5. Conclusions

Our results for the drought resistance of mixed stands versus monocultures may be described by the five following conclusions.
  • In assessing drought tolerance, remote sensing analysis showed the following order, beginning with the most tolerant monocultures of species: P. sylvestris > Q. robur > Q. rubra. Additionally, a negative impact of gley soil was observed on Q. robur monoculture.
  • Mixed stands with Q. robur as the dominant species are more resistant to drought than Q. robur monocultures. Having a ~20% admixture of Q. robur and P. sylvestris significantly reduced deterioration of vegetation indices during short-term drought. In a single case, a ~10% admixture of Larix sp. contributed to the decline of vegetation indices.
  • In a single case, a ~20% admixture of Q. robur in the stand with P. sylvestris as a dominant species contributed to the decline of vegetation indices. We suggest that this particular case may confirm the results of Urli et al. (2015) [82]. This particular ROI is the only pine stand with rusty brown soil, which may cause limited water availability and the threshold water transport variables observation [82]. This observation should be explained in future research.
  • The particular differential indices have different degrees of usefulness, depending on the examined factor. In general, the sensitivity to green light is important for biodiversity research. The index MSAVI is most useful for investigating Q. robur, while NDMI is more adequate for P. sylvestris. It is important to note that such conclusions can only be drawn for species that dominate a given habitat. More detailed analyses require data with significantly higher spatial resolution than that of Landsat. It is therefore envisaged that further research will use data with a GSD of 0.25 m, acquired from the QUERCUS.6 aerial platform, which was used in the present study for image segmentation. This will allow the analysis of the spectral response of individual crowns, using six channels registered in the range from 400 to 1000 nm. An additional advantage of high-resolution data is the ability to eliminate shadows and clearances between trees, facilitating the analysis of tree properties.
  • Despite all constraints, Landsat satellite images with a 30-m accuracy are suitable to obtain a quick and general overview of a situation. Their analysis is relatively rapid, and they are generally available for any time and place. The major constraints include cloudiness and correct radiometric adjustment. However, the present study demonstrates that, based on accurate knowledge of the quantitative shares of individual species, indirect conclusions can be drawn about their contribution to changes in the particular remote sensing indices. Their characteristics and interrelationships can also be assessed.

Acknowledgments

This research was performed under the HESOFF Project (Life 11 ENV/PL/000459), financed by the European Commission and the National Fund for Environmental Protection and Water Management.

Author Contributions

J.K. was responsible for tree crowns separation and estimation of the species diversity; K.K. was responsible for description of ddifferent trees species features related to drought sensitivity and resistance; S.A.N. was responsible for vegetation indices (VI) changes analysis; K.R. was responsible for digital terrain model (DTM) preparation; M.K. was responsible for the study area description; J.K. and S.A.N. analyzed the data. J.K., S.A.N., and K.K. wrote the paper.

Conflicts of Interest

The authors declare no conflict of interest.

References

  1. Thompson, I.; Mackey, B.; McNulty, S.; Mosseler, A. Forest Resilience, Biodiversity, and Climate Change. In A Synthesis of the Biodiversity/Resilience/Stability Relationship in Forest Ecosystems; Technical Series; Secretariat of the Convention on Biological Diversity: Montreal, QC, Canada, 2009; pp. 43–67. [Google Scholar]
  2. Long, S.P.; Humphries, S.; Falkowski, P.G. Photoinhibition of photosynthesis in nature. Annu. Rev. Plant Physiol. Plant Mol. Biol. 1994, 45, 633–662. [Google Scholar] [CrossRef]
  3. Coder, K.D.; Daniel, B. Drought Damage to Trees; University of Georgia: Athens, GA, USA, 1999. [Google Scholar]
  4. Singh, A. Digital change detection techniques using remotely-sensed data. Int. J. Remote Sens. 1989, 10, 989–1003. [Google Scholar] [CrossRef]
  5. Jensen, J.R. Introductory Digital Image Processing: A Remote Sensing Perspective; University of South Carolina: Columbus, OH, USA, 1986. [Google Scholar]
  6. Allen, C.D.; Macalady, A.K.; Chenchouni, H.; Bachelet, D.; Dowell, N.M.; Vennetier, M.; Kitzberger, T.; Rigling, A.; Breshears, D.D.; Hogg, E.H.; et al. A global overview of drought and heat-induced tree mortality reveals emerging climate change risks for forests. For. Ecol. Manag. 2010, 259, 660–684. [Google Scholar] [CrossRef]
  7. Delzon, S.; Urli, M.; Samalens, J.; Lamy, J.; Lischke, H.; Sin, F.; Zimmermann, N.E.; Porté, A.J. Field evidence of colonisation by Holm oak, at the northern margin of its distribution range, during the Anthropocene period. PLoS ONE 2013, 8. [Google Scholar] [CrossRef] [PubMed]
  8. Sohar, K.; Helama, S.; Läänelaid, A.; Raiso, J.; Tuomenvirta, H. Oak decline in a southern Finnish forest as affected by a drought sequence. Geochronometria 2014, 41, 92–103. [Google Scholar] [CrossRef] [Green Version]
  9. Lindner, M.; Fitzgerald, J.B.; Zimmermann, J.E.; Reyer, C.; Delzon, S.; der Maaten, E.; Schelhaas, M.; Lasch, P.; Eggers, J.; van der Maaten-Theunissen, M.; et al. Climate change and European forests: What do we know, what are the uncertainties, and what are the implications for forest management? J. Environ. Manag. 2014, 146, 69–83. [Google Scholar] [CrossRef] [PubMed]
  10. Rummukainen, M. Changes in climate and weather extremes in the 21st century. Wiley Interdiscip. Rev. Clim. Chang. 2012, 3, 115–129. [Google Scholar] [CrossRef]
  11. Orlowsky, B.; Seneviratne, S.I. Global changes in extreme events: Regional and seasonal dimension. Clim. Chang. 2012, 110, 669–696. [Google Scholar] [CrossRef]
  12. Helama, S.; Meriläinen, J.; Tuomenvirta, H. Multicentennial megadrought in northern Europe coincided with a global El Niño–Southern Oscillation drought pattern during the Medieval Climate Anomaly. Geology 2009, 37, 175–178. [Google Scholar] [CrossRef]
  13. Bonacina, L.C.W. The European drought of 1921. Nature 1923, 112, 488–489. [Google Scholar] [CrossRef]
  14. Cook, E.R.; Seager, R.; Kushnir, Y.; Briffa, K.R.; Büntgen, U.; Frank, D.; Krusic, P.J.; Tegel, W.; van der Schrier, G.; Andreu-Hayles, L.; et al. Old World megadroughts and pluvials during the Common Era. Sci. Adv. 2015, 1. [Google Scholar] [CrossRef] [PubMed] [Green Version]
  15. Gonzalez de Andres, E.; Seely, B.; Blanco, J.A. Increased complementarity in water-limited environments in Scots pine and European beech mixtures under climate change. Ecohydrology 2017, 10. [Google Scholar] [CrossRef]
  16. González de Andrés, E.; Camarero, J.J.; Blanco, J.A.; Imbert, J.B.; Lo, Y.H.; Sangüesa-Barreda, G.; Castillo, F.J. Tree-to-tree competition in mixed European beech—Scots pine forests has different impacts on growth and water-use efficiency depending on site conditions. J. Ecol. 2018, 106, 59–75. [Google Scholar] [CrossRef]
  17. Río, M.D.; Schütze, G.; Pretzsch, H. Temporal variation of competition and facilitation in mixed species forests in Central Europe. Plant Biol. 2014, 16, 166–176. [Google Scholar] [PubMed]
  18. Pretzsch, H.; Del Río, M.; Ammer, C.; Avdagic, A.; Barbeito, I.; Bielak, K.; Brazaitis, G.; Coll, L.; Dirnberger, G.; Drössler, L.; et al. Growth and yield of mixed versus pure stands of Scots pine (Pinus sylvestris L.) and European beech (Fagus sylvatica L.) analysed along a productivity gradient through Europe. Eur. J. For. Res. 2015, 134, 927–947. [Google Scholar] [CrossRef] [Green Version]
  19. Kelty, M.J. Comparative productivity of monocultures and mixed-species stands. In The Ecology and Silviculture of Mixed-Species Forests; Springer: Dordrecht, The Netherlands, 1992; pp. 125–141. [Google Scholar]
  20. Pretzsch, H.; Dieler, J.; Seifert, T.; Rötzer, T. Climate effects on productivity and resource-use efficiency of Norway spruce (Picea abies L. Karst.) and European beech (Fagus sylvatica L.) in stands with different spatial mixing patterns. Trees 2012, 26, 1343–1360. [Google Scholar] [CrossRef]
  21. Richards, A.E.; Forrester, D.I.; Bauhus, J.; Scherer-Lorenzen, M. The influence of mixed tree plantations on the nutrition of individual species: A review. Tree Physiol. 2010, 30, 1192–1208. [Google Scholar] [CrossRef] [PubMed]
  22. Wiedemann, E. Gleichaltrige Fichten-Buchen-Mischbestand; FAO: Rome, Italy, 1942. [Google Scholar]
  23. Vandermeer, J. The Ecology of Intercropping; Cambridge University Press: Cambridge, UK, 1989. [Google Scholar]
  24. Sass-Klaassen, U.; Chowdhury, Q.; Sterck, F.J.; Zweifel, R. Effects of water availability on the growth and tree morphology of Quercus pubescens Willd. and Pinus sylvestris L. in the Valais, 2006, Switzerland, Section 1 Cultural Heritage. In Proceedings of the TRACE-Tree Rings in Archaeology, Climatology and Ecology, Proceedings of the Dendrosymposium, Tervuren, Belgium, 20–22 April 2006. [Google Scholar]
  25. Raftoyannis, Y.; Radoglou, K. Physiological Responses of Beech and Sessile Oak in a Natural Mixed Stand during a Dry Summer. Ann. Bot. 2002, 89, 723–730. [Google Scholar] [CrossRef] [PubMed]
  26. Vranckx, G.; Jacquemyn, H.; Mergeay, J.; Cox, K.; Janssens, P.; Gielen, B.A.S.; Muys, B.; Honnay, O. The effect of drought stress on heterozygosity–fitness correlations in pedunculate oak (Quercus robur). Ann. Bot. 2014, 113, 1057–1069. [Google Scholar] [CrossRef] [PubMed]
  27. Pietrzykowski, M.; Krzaklewski, W.; Likus, J.; Woś, B. Assessment of English oak (Quercus robur L.) growth in varied soil-substrate conditions of reclaimed Piaseczno sulfur mine dump. Folia For. Pol. 2015, 57, 28–32. [Google Scholar] [CrossRef]
  28. Dzwonko, Z.; Loster, S. Vegetation differentiation and secondary succession on a limestone hill in southern Poland. J. Veg. Sci. 1990, 1, 615–622. [Google Scholar] [CrossRef]
  29. Thomas, F.M.; Gausling, T. Morphological and physiological responses of oak seedlings (Quercus petraea and Q. robur) to moderate drought. Ann. For. Sci. React-Text 2002, 57, 325–333. [Google Scholar] [CrossRef]
  30. Dickson, R.E.; Tomlinson, P.T. Oak growth, development and carbon metabolism in response to water stress. Ann. Sci. For. 1996, 53, 181–196. [Google Scholar] [CrossRef]
  31. Dat, J.F.; Parent, C. Differential responses in sympatric tree species exposed to waterlogging. Tree Physiol. 2012, 32, 115–118. [Google Scholar] [CrossRef] [PubMed]
  32. Tyree, M.T.; Cochard, H. Summer and winter embolism in oak: Impact on water relations. Ann. Sci. For. 1996, 53, 173–180. [Google Scholar] [CrossRef]
  33. Kubiske, M.E.; Abrams, M.D. Photosynthesis, water relations, and leaf morphology of xeric versus mesic Quercus rubra ecotypes in central Pennsylvania in relation to moisture stress. Can. J. For. Res. 1992, 22, 1402–1407. [Google Scholar] [CrossRef]
  34. Sverdrup, H.; Stjernquist, I. Forest vitality and stress implications. In Developing Principles and Models for Sustainable Forestry in Sweden (Managing Forest Ecosystems), 2002nd ed.; Sverdrup, H., Stjernquist, I., Eds.; Springer: Dordrecht, The Netherlands, 2002; pp. 197–271. ISBN 978-94-015-9888-0. [Google Scholar]
  35. Farrar, J.L. Trees in Canada, 1st ed.; Fitzhenry & Whiteside Limited: Markham, ON, Canada; The Canadian Forest Services: Ottawa, ON, Canada, 1995. [Google Scholar]
  36. Gu, M.; Rom, C.R.; Robbins, J.A. Effect of water deficit on gas exchange, osmotic solutes, leaf abscission, and growth of four birch genotypes (Betula L.) under a controlled environment. HortScience 2007, 42, 1383–1391. [Google Scholar]
  37. Robson, T.M.; Hartikainen, S.M.; Aphalo, P.J. How does solar ultraviolet-B radiation improve drought tolerance of silver birch (Betula pendula Roth.) seedlings? Plant Cell Environ. 2015, 38, 953–967. [Google Scholar] [CrossRef] [PubMed]
  38. Lloret, F.; Lobo, A.; Estevan, H.; Maisongrande, P.; Vayreda, J.; Terradas, J. Woody plant richness and NDVI response to drought events in Catalonian (northeastern Spain) forests. Ecology 2007, 88, 2270–2279. [Google Scholar] [CrossRef] [PubMed]
  39. Kuźmiński, R.; Szewczyk, W.; Korczyński, I.; Łakomy, P. Assessment of leaf damage in oak stands in the flood-affected Wołów Forest Division. For. Res. Pap. 2015, 76, 297–303. [Google Scholar]
  40. Oszako, T. Oak declines in Europe’s forest—History, causes and hypothesis. In Procedings of the Recent Advances on Oak Health in Europe, Warsaw, Poland, 22–24 November 1999; Instytut Badawczy Leśnictwa. Forest Research Institute: Warsaw, Poland, 1999. [Google Scholar]
  41. Menkis, A.; Ostbrant, I.L.; Wagstrom, K.; Vasaitis, R. Dutch elm disease on the island of Gotland: Monitoring disease vector and combat measures. Scan. J. For. Res. 2015, 31, 237–241. [Google Scholar] [CrossRef]
  42. Menkis, A.; Ostbrant, I.L.; Davydenko, K.; Bakys, R.; Balalaikins, M.; Vasaitis, R. Scolytus multistriatus associated with Dutch elm disease on the island of Gotland: Phenology and communities of vectored Fungi. Mycol. Prog. 2016, 15, 55. [Google Scholar] [CrossRef]
  43. Boczoń, A.; Kowalska, A.; Dudzińska, M.; Wróbel, M. Drought in Polish forests in 2015. Pol. J. Environ. Stud. 2016, 25, 5. [Google Scholar] [CrossRef]
  44. Jensen, J.R. Remote Sensing of the Environment: An Earth Resource Perspective, 2nd ed.; Prentice Hall Series in Geographic Information Science; Pearson Education India: London, UK, 2000. [Google Scholar]
  45. Mas, J.F. Monitoring land-cover changes: A comparison of change detection techniques. Int. J. Remote Sens. 1999, 20, 139–152. [Google Scholar] [CrossRef]
  46. Hui, F.; Fu, X.; Zhang, Z.; Wu, Q. Phenology-based vegetation index differencing for mapping of rubber plantations using Landsat OLI data. Remote Sens. 2015, 7, 6041–6058. [Google Scholar]
  47. Coppin, P.R.; Bauer, M.E. Processing of multitemporal Landsat TM imagery to optimize extraction of forest cover change features. IEEE Trans. Geosci. Remote Sens. 1994, 32, 918–927. [Google Scholar] [CrossRef]
  48. Wang, C.; Lu, Z.; Haithcoat, T.L. Using Landsat images to detect oak decline in the Mark Twain National Forest, Ozark Highlands. For. Ecol. Manag. 2007, 240, 70–78. [Google Scholar] [CrossRef]
  49. Nasiłowska, S.A.; Kotlarz, J.; Rynkiewicz, A.; Kacprzak, M.; Rotchimmel, K. The impact of drought in 2015 on the forest condition determined using Landsat-8 OLI images. Leśne Prace Badawcze 2018. under review. [Google Scholar]
  50. Volcani, A.; Karnieli, A.; Svoray, T. The use of remote sensing and GIS for spatio-temporal analysis of the physiological state of a semi-arid forest with respect to drought years. For. Ecol. Manag. 2005, 215, 239–250. [Google Scholar] [CrossRef]
  51. Huete, A.R.; Liu, H.Q.; Batchily, K.; van Leeuwen, W. A comparison of vegetation indices over a global set of TM images for EOS-MODIS. Remote Sens. Environ. 1997, 59, 440–451. [Google Scholar] [CrossRef]
  52. Qi, J.; Chehbouni, A.; Huete, A.R.; Kerr, Y.H.; Sorooshian, S. A modified soil adjusted vegetation index. Remote Sens. Environ. 1994, 48, 119–126. [Google Scholar] [CrossRef]
  53. Key, C.H.; Benson, N.C. FIREMON: Fire Effects Monitoring and Inventory System; Technical Report in press for USDA Forest Service; Rocky Mountains Research Station: Washington, DC, USA, 2006. [Google Scholar]
  54. Hardisky, M.; Klemas, V.; Smart, R. The influences of soil salinity, growth form, and leaf moisture on the spectral reflectance of Spartina alterniflora. Photogramm. Eng. Remote Sens. 1983, 49, 77–83. [Google Scholar]
  55. Rouse, J.W., Jr.; Haas, R.H.; Schell, J.A.; Deering, D.W. Monitoring the Vernal Advancement and Retrogradation (Green Wave Effect) of Natural Vegetation; Texas A & M University: College Station, TX, USA, 1974. [Google Scholar]
  56. Huete, A.R. A soil-adjusted vegetation index (SAVI). Remote Sens. Environ. 1988, 25, 295–309. [Google Scholar] [CrossRef]
  57. Gitelson, A.; Kaufman, A.; Yoram, J.; Merzlyak, M.N. Use of a green channel in remote sensing of global vegetation from EOS-MODIS. Remote Sens. Environ. 1996, 58, 289–298. [Google Scholar] [CrossRef]
  58. Kaufman, Y.J.; Tanre, D. Atmospherically resistant vegetation index (ARVI) for EOS-MODIS. IEEE Trans. Geosci. Remote Sens. 1992, 30, 261–270. [Google Scholar] [CrossRef]
  59. Hancock, D.W.; Dougherty, C.T. Relationships between blue- and red-based vegetation indices and leaf area and yield of alfalfa. Crop Sci. 2007, 47, 2547–2556. [Google Scholar] [CrossRef]
  60. Asner, G.P.; Nepstad, D.; Cardinot, G.; Ray, D. Drought stress and carbon uptake in an Amazon forest measured with spaceborne imaging spectroscopy. Proc. Natl. Acad. Sci. USA 2004, 101, 6039–6044. [Google Scholar] [CrossRef] [PubMed]
  61. Brown, M.E.; Pinzon, J.E.; Didan, K.; Morisette, J.T.; Tucker, C.J. Evaluation of the consistency of long-term NDVI time series derived from AVHRR, SPOT-Vegetation, SeaEiFS, MODIS, and Landsat ETM+ Sensors. IEEE Trans. Geosci. Remote Sens. 2006, 44, 1787–1793. [Google Scholar] [CrossRef]
  62. Product Guide. Landsat 8 Surface Reflectance Code (LaSRC) Product. Available online: https://landsat.usgs.gov/sites/default/files/documents/lasrc_product_guide.pdf (accessed on 1 March 2018).
  63. Czapski, P.; Kacprzak, M.; Kotlarz, J.; Mrowiec, K.; Kubiak, K.; Tkaczyk, M. Preliminary analysis of the forest health state based on multispectral images acquired by Unmanned Aerial Vehicle. Folia For. Pol. 2015, 57, 138–144. [Google Scholar] [CrossRef] [Green Version]
  64. Kacprzak, M.; Rotchimmel, K. Creating photogrammetry products with photos acquired by array of non-metric cameras. Prace Instytutu Lotnictwa 2016, 243, 120–129. [Google Scholar]
  65. Pitkänen, J.; Maltamo, M.; Hyyppä, J.; Yu, X. Adaptive methods for individual tree detection on airborne laser based canopy height model. Int. Arch. Photogramm. Remote Sens. Spat. Inf. Sci. 2004, 36, 187–191. [Google Scholar]
  66. Stereńczak, K. Single tree detection based on airborne LIDAR (ALS) data. Roczniki Geomatyki 2009, 7, 121–126. [Google Scholar]
  67. Wężyk, P.; Sroga, R.; Szwed, P. Postex precision positioning of tree trunks on circular inventory plots using the postex device. Roczniki Geomatyki 2008, 8, 109–118. [Google Scholar]
  68. Myszkowski, M.; Ksepko, M.; Gajko, K. Tree number detection based on airborne laser scanning data. Archiwum Instytutu Inżynierii Lądowej 2009, 6, 63–72. [Google Scholar]
  69. Falińska, K. Ekologia Roślin; PWN: Warszawa, Poland, 2004; p. 511. [Google Scholar]
  70. Bai, Y.; Zhuang, C.; Ouyang, Z.; Zheng, H.; Jiang, B. Spatial characteristics between biodiversity and ecosystem services in a human-dominated watershed. Ecol. Complex. 2011, 8, 177–183. [Google Scholar] [CrossRef]
  71. Mendenhall, C.D.; Shields-Estrada, A.; Krishnaswami, A.J.; Daily, G.C. Quantifying and sustaining biodiversity in tropical agricultural landscapes. Proc. Natl. Acad. Sci. USA 2016, 113, 14544–14551. [Google Scholar] [CrossRef] [PubMed]
  72. Wilson, A.M.; Walter, J. Remotely sensed high-resolution global cloud dynamics for predicting ecosystem and biodiversity distributions. PLoS Biol. 2016, 14. [Google Scholar] [CrossRef] [PubMed]
  73. Geller, G.N.; Halpin, P.N.; Helmuth, B.; Hestir, E.L.; Skidmore, A.; Abrams, M.J.; Aguirre, N.; Blair, M.; Botha, E.; Colloff, M.; et al. Remote sensing for biodiversity. In The GEO Handbook on Biodiversity Observation Networks; Springer International Publishing: New York, NY, USA, 2017; pp. 187–210. [Google Scholar]
  74. Wang, R.; Gamon, J.A.; Montgomery, R.A.; Townsend, P.A.; Zygielbaum, A.I.; Bitan, K.; Cavender-Bares, J. Seasonal variation in the NDVI—Species richness relationship in a prairie grassland experiment (Cedar Creek). Remote Sens. 2016, 8, 128. [Google Scholar] [CrossRef]
  75. Czapski, P.; Kotlarz, J.; Kubiak, K.; Tkaczyk, M. Analiza czynnikowa zdjęć wielospektralnych. Prace Instytutu Lotnictwa 2014, 234, 143–150. (In Polish) [Google Scholar] [CrossRef]
  76. Kacprzak, M.; Wodziński, K. Execution of photo mission by manned aircraft and unmanned aerial vehicle. Prace Instytutu Lotnictwa 2016, 243, 130–141. [Google Scholar]
  77. Kotlarz, J.; Kubiak, K.; Kacprzak, M.; Czapski, P. Estimation of tree species diversity of forest stands based on their spectral reflectance. Sylwan 2016, 160, 1036–1045. [Google Scholar]
  78. Kotlarz, J.; Kacprzak, M. Algorytm automatycznego oszacowania zróżnicowania gatunkowego drzewostanu z wykorzystaniem zdjęć RGB koron drzew. Pomiary Automatyka Robotyka 2017, 21, 63–70. (In Polish) [Google Scholar] [CrossRef]
  79. Krebs, C.J. Ecological Methodology; Harper & Row: New York, NY, USA, 1989. [Google Scholar]
  80. Épron, D.; Dreyer, E. Starch and soluble carbohydrates in leaves of water-stressed oak saplings. Ann. Sci. For. 1996, 53, 263–268. [Google Scholar] [CrossRef]
  81. Osonubi, O.; Davies, W.J. Solute accumulation in leaves and roots of woody plants subjected to water stress. Oecologia 1978, 32, 323–332. [Google Scholar] [CrossRef] [PubMed]
  82. Urli, M.; Lamy, J.B.; SinRégis, F.; Delzon, B.S. The high vulnerability of Quercus robur to drought at its southern margin paves the way for Quercus ilex. Plant Ecol. 2015, 216, 177–187. [Google Scholar] [CrossRef]
  83. Ashton, P.; Berlyn, G.P. A Comparison of leaf physiology and anatomy of Quercus (Section Er Ythrobalanus-Fagaceae) species in different light environments. Am. J. Bot. 1994, 8, 589–597. [Google Scholar] [CrossRef]
  84. Abrams, M.D. Adaptations and responses to drought in Quercus species of North America. Tree Physiol. 1990, 7, 227–238. [Google Scholar] [CrossRef] [PubMed]
  85. Głowacki, D.; Sławska, M.; Sławski, M. The dynamics of northern red oak (Quercus rubra L.) in managed forests of central Poland. Leśne Prace Badawcze 2016, 77, 32–41. [Google Scholar]
  86. Parker, W.C.; Pallardy, S.G.; Hinckley, T.M.; Teskey, R.O. Seasonal changes in tissue water relations of three woody species of the Quercus-Carya forest type. Ecology 1982, 63, 1259–1267. [Google Scholar] [CrossRef]
  87. Hinckley, T.M.; Teskey, R.O.; Waring, R.H.; Morikawa, Y. The water relations of true firs. In True Fir, Proceedings of the Biology and Management of True Fir in the Pacific Northwest Symposium; University of Washington: Seattle, WA, USA, 1982; pp. 85–92. [Google Scholar]
  88. Roberts, S.W.; Knoerr, K.R. Components of water potential estimated from xylem pressure measurements in five tree species. Oecologia 1877, 28, 191–202. [Google Scholar] [CrossRef] [PubMed]
  89. Kurkela, T.; Jalkanen, R. Revealing past needle retention in Pinus spp. Scand. J. For. Res. 1990, 5, 481–485. [Google Scholar] [CrossRef]
  90. Ranney, R.; Skroch, W.A. Comparative drought resistance among six species of birch (Betula): Influence of mild water stress on water relations and leaf gas exchange. Tree Physiol. 1990, 8, 351–360. [Google Scholar] [CrossRef]
  91. Humphries, R.N.; Jordan, M.A.; Guarino, L. The effect of water stress on the mortality of Betula pendula Roth. and Buddleia davidii Franch seedlings. Plant Soil 1982, 64, 273–276. [Google Scholar] [CrossRef]
  92. Kowalkowski, A.; Hoffman, M.; Wecko, D. Root system development of cherries in gley soils. Roczniki Gleboznawcze XXIV 1973, 24, 299–315. [Google Scholar]
  93. Agyare, W.A. Soil Characterization and Modeling of Spatial Distribution of Saturated Hydraulic Conductivity at Two Sites in the Volta Basin of Ghana; Cuvillier Verlag: Göttingen, Germany, 2004. [Google Scholar]
  94. Danielewicz, W.; Wiatrowska, B. Inwazyjne gatunki drzew i krzewów w lasach Polski. Peckiana 2014, 9, 59–67. (In Polish) [Google Scholar]
  95. Vivin, P.; Aussenac, G.; Levy, G. Differences in drought resistance among 3 deciduous oak speciesgrown in large boxes. Ann. Sci. For. 1993, 50, 221–233. [Google Scholar] [CrossRef]
  96. Jump, A.S.; Ruiz-Benito, P.; Greenwood, S.; Allen, C.D.; Kitzberger, T.; Fensham, R.; Lloret, F. Structural overshoot of tree growth with climate variability and the global spectrum of drought-induced forest dieback. Glob. Chang. Boil. 2017, 23, 3742–3757. [Google Scholar] [CrossRef] [PubMed]
  97. Steinkamp, J.; Hickler, T. Is drought-induced forest dieback globally increasing? J. Ecol. 2015, 103, 31–43. [Google Scholar] [CrossRef]
  98. Cater, M. Osmotic adaptation of Quercus robur L. under water stress in stands with different tree density—Relation with groundwater table. Dendrobiology 2011, 65, 29–36. [Google Scholar]
  99. Carreiras, J.; Pereira, J.; Pereira, J.S. Estimation of the canopy cover in evergreen oak woodlands using remote sensing. For. Ecol. Manag. 2006, 223, 45–53. [Google Scholar] [CrossRef]
  100. Ismail, R.; Mutanga, O.; Bob, U. Forest health and vitality: The detection and monitoring of Pinus patula trees infected by Sirex noctilio using digital multispectral imagery. South For. 2007, 69, 39–47. [Google Scholar] [CrossRef]
  101. Schwantes, A.M.; Swenson, J.J.; Jackson, R.B. Quantifying drought-induced tree mortality in the open canopy woodlands of central Texas. Remote Sens. Environ. 2016, 181, 54–64. [Google Scholar] [CrossRef]
  102. Horler, D.; Ahern, F. Forestry information content of thematic mapper data. Int. J. Remote Sens. 1986, 7, 405–428. [Google Scholar] [CrossRef]
  103. Collins, J.B.; Woodcock, C.E. An assessment of several linear change detection techniques for mapping forest mortality using multitemporal Landsat TM data. Remote Sens. Environ. 1999, 56, 66–77. [Google Scholar] [CrossRef]
  104. Vogelmann, J.; Rock, B. Assessing forest damage in high-elevation coniferous forests in Vermont and New Hampshire using thematic mapper data. Remote Sens. Environ. 1988, 24, 227–246. [Google Scholar] [CrossRef]
Figure 1. Map of the research plot in the Karczma Borowa Forest District in the adopted World Geodetic System 84 (WGS 84) reference system. The red color denotes the region of interest (ROIs) adopted in accordance with the divisions of the Forest Data Bank (FDB). The blue color denotes the positions of sample tress set out by the Forest Research Institute (Q. robur). Dominant species name with its age: DBB for Q. robur, DBC for Q. rubra, MD for Larix sp., SO for P. sylvestris.
Forests 09 00126 g001
Figure 2. Segmentation in the case of ROI SO 100 (Figure 1). (a) Orthophotomap—a RGB composition in natural colors, (b) An elevation model acquired as a result of the matching of images, (c) The particular tree crowns were determined using segmentation based on the watershed algorithm.
Forests 09 00126 g002
Figure 3. Surface representation of the mean Green Normalized Difference Vegetation Index (ΔGNDVI) differential index between 2014 and 2015 (a). The mean value of the GNDVI differential index for 2014 and 2015 for all ROIs (b). The green color denotes the Shannon-Wiener diversity index values exceeding 0.60, the grey color represents those between 0.20 and 0.60, the orange color represents those below 0.20. Products at the surface reflectance level Landsat-8 OLI were used as source data. The study did not consider mixed pixels at the boundary of divisions. An improvement in the condition of trees is represented by the green color, while its deterioration is indicated by the orange color.
Forests 09 00126 g003
Figure 4. (a): Diversity index H in relation to the value of the ΔGNDVI index; (b): percentage share of the Q. robur species in relation to the value of the ΔMSAVI index; (c): percentage share of the P. sylvestris species in relation to the value of the ΔNDMI index. Coefficients of determination (r2) indicate that ΔGNDVI index was predictable from H index (positive correlation), ΔMSAVI index was predictable from the percentage share of the Q. robur species (negative correlation), and ΔNDMI index was predictable from the percentage share of the P. sylvestris species (positive correlation).
Forests 09 00126 g004aForests 09 00126 g004b
Table 1. Environmental tree parameters (Forest Data Bank). Dominant species name with its age: DBB for Q. robur, DBC for Q. rubra, MD for Larix sp., SO for P. sylvestris (the abbreviations come from polish names of dominant species and are used in polish Forest Data Bank). Soil type according to the Polish forestry nomenclature: OGw—rain-dependent gley soil; Gw—groundwater-dependent gley soil; Pw—lessive soil; BRk—acid brown soil; RDbr—rusty brown soil; due to its mineralogical composition, it is most permeable in our analysis. ROI—region of interest; DBH—diameter at breast height.
ROIArea (ha)Soil TypeTree Coverage (%)Understory Coverage (%)Properties of Dominant SpeciesAge of Tree Species
Tree DBH (cm)Tree height (m)Stock (m3/ha)Quercus roburPicea abies (L.) H. Karst (P. abies)Fagus sylvatica L. (F. sylvatica)Carpinus betulus L. (C. betulus)Quercus rubraLarix sp.Pinus sylvestrisBetula pendula
DBB 12614.9Gw100604233509126126------
DBB 1296.8RDbr80704632550129-129101----
DBB 130a7.1RDbr100504331586130--130----
DBB 130b2.7RDbr100404431466130130--130130130-
DBB 130c4.2RDbr1007042314111306666-130130130-
DBB 13915.0BRk90604932554139139-139-81139-
DBB 1403.1RDbr1004045331181400140-140140--
DBB 836.7BRk10050272534683----838383
DBB 965.9RDbr902035303909651130-----
DBC 1207.0RDbr70104732411----120120--
MD 501.7RDbr110402526194---36-5050-
MD 792.0RDbr110804034509---79-79--
SO 1002.6RDbr11010342830910026----100-
SO 1054.5BRk90303928386105--105-105105105
SO 273.7OGw1102011141522727-27-272727
Table 2. Shannon-Wiener species diversity index (H) and the shares of the identified species in forest divisions (the results based on analyses of aerial images, see Section 2.4). Dominant species name with its age: DBB for Q. robur, DBC for Q. rubra, MD for Larix sp., SO for P. sylvestris. FDB: Forest Data Bank.
FDB RegionH (%)Share of Particular Species in a Forest Division (%)
Quercus roburPicea abiesFagus sylvaticaCarpinus betulusQuercus rubraLarix sp.Pinus sylvestrisBetula pendula
DBB 1264.9499.140.86------
DBB 1298.0698.64-0.910.45----
DBB 130a6.3998.83--1.17----
DBB 130b82.9472.861.18--17.701.187.08-
DBB 130c86.0374.400.883.06-11.1610.280.22-
DBB 1397.6198.890.27-0.37-0.320.16-
DBB 14053.3087.233.196.91-0.531.60--
DBB 8368.6174.33----2.4222.400.85
DBB 9625.5393.545.170.90-----
DBC 12022.78----93.976.03--
MD 5088.24---8.06-58.6033.33-
MD 7925.89---7.20-92.80--
SO 10071.2521.655.15----73.20-
SO 10553.9314.47--1.28-0.1883.150.92
SO 2748.130.420.72-0.55-0.1285.9512.23
Table 3. Values of differential vegetation indices for each forest region.
FDB idΔEVIΔMSAVIΔNBRΔNBR2ΔNDMIΔNDVIΔSAVIΔGNDVIΔARVIΔBNDVIMEANStandard Deviation (σ)
DBB 126−0.91−0.92−0.94−0.79−0.92−0.93−0.91−0.83−0.89−0.99−0.900.06
DBB 129−0.74−0.76−0.76−0.73−0.73−0.81−0.77−0.67−0.80−0.78−0.760.04
DBB 130a−0.54−0.55−0.34−0.29−0.32−0.54−0.54−0.33−0.47−0.66−0.460.13
DBB 130b0.670.660.720.800.590.360.620.630.420.280.580.17
DBB 130c0.300.27−0.28−0.08−0.37−0.050.310.20−0.080.020.020.24
DBB 139−0.69−0.71−0.46−0.58−0.45−0.39−0.65−0.65−0.44−0.30−0.530.14
DBB 1400.160.130.340.500.130.420.200.460.420.410.320.15
DBB 830.700.700.220.600.130.530.721.030.520.570.570.26
DBB 96−0.86−0.87−0.69−0.72−0.68−0.76−0.86−0.78−0.75−0.79−0.780.07
DBC 1200.700.72−0.10−0.06−0.15−0.230.620.03−0.25−0.120.110.40
MD 501.291.281.641.451.541.521.311.011.521.421.400.18
MD 79−0.44−0.36−0.20−0.43−0.25−0.20−0.48−0.80−0.23−0.25−0.360.18
SO 1000.200.30−0.10−0.440.020.010.200.07−0.080.210.040.22
SO 1050.420.420.980.641.000.860.410.280.890.700.660.26
SO 271.701.741.461.411.591.461.691.241.451.491.520.16
MEAN0.130.140.100.090.080.080.120.060.080.08--
σ0.810.810.790.760.780.770.810.720.770.76--
EVI: Enhanced Vegetation Index; MSAVI: Modified Soil-Adjusted Vegetation Index; NBR: Normalized Burn Ratio; NBR2: Normalized Burn Ratio 2; NDMI: Normalized Difference Moisture Index; NDVI: Normalized Difference Vegetation Index; SAVI: Soil-Adjusted Vegetation Index; GNDVI: Green Normalized Difference Vegetation Index; ARVI: Atmospherically Resistant Vegetation Index; BNDVI: Blue-Normalized Difference Vegetation Index.
Table 4. Pearson’s coefficient of correlation between vegetation indices differences (ΔVIs) and the shares of particular species in forest divisions and for taxonomic data (* for p-value < 0.05, ** for p-value < 0.005).
ΔEVIΔMSAVIΔNBRΔNBR2ΔNDMIΔNDVIΔSAVIΔGNDVIΔARVIΔBNDVIMEANσ
H0.67 *0.66 *0.61 *0.64 *0.57 *0.66 *0.68 *0.73 **0.65 *0.68 *0.660.042
Q. robur−0.67 *−0.69 **−0.46 *−0.15−0.66 *−0.63 *−0.65 *−0.42−0.61 *−0.64 *−0.610.083
P. abies−0.1−0.1−0.1−0.2−0.1−0.1−0.1−0.1−0.1−0.1−0.170.034
F. sylvatica−0.0−0.0−0.00.04−0.10.01−0.00.090.010.02−0.010.061
C. betulus0.170.180.380.270.360.350.170.050.350.310.260.112
Q. rubra0.230.23−0.0−0.0−0.0−0.00.200.03−0.1−0.00.030.140
Larix sp.0.070.080.190.110.170.190.06−0.00.180.160.120.083
P. sylvestris0.60 *0.62 *0.65 *0.53 *0.72 **0.67 *0.61 *0.54 *0.66 *0.69 **0.630.061
Tilia sp.0.01−0.00.080.140.010.120.020.150.120.120.080.061
B. pendula0.55 *0.56 *0.500.500.56 *0.52 *0.56 *0.480.52 *0.54 *0.530.029
Pseudotsuga menziesii Carrière−0.34−0.34−0.28−0.29−0.27−0.30−0.34−0.32−0.30−0.32−0.310.027
Tree coverage (%)0.290.300.400.370.410.460.310.350.450.440.380.064
Understory coverage (%)−0.46−0.47−0.37−0.31−0.41−0.33−0.45−0.39−0.33−0.37−0.390.056
Age (years)−0.62 *−0.63 *−0.64 *−0.58 *−0.68 **−0.67 *−0.62 *−0.51 *−0.66 *−0.67 *−0.630.052
Tree DBH (cm)−0.66 *−0.67 *−0.64 *−0.63 *−0.68 **−0.7 **−0.67 *−0.65 *−0.69 **−0.7 **−0.670.025
Tree height (m)−0.72 **−0.73 **−0.67 *−0.67 *−0.73 **−0.72 **−0.73 **−0.71 **−0.71 **−0.73 **−0.710.023
Tree stock (m3/ha)−0.71 **−0.71 **−0.69 **−0.70 **−0.67 *−0.76 **−0.72 **−0.74 **−0.74 **−0.78 **−0.720.033

