Selecting Network-Level Project Sections for Sustainable Pavement Management in Texas

1
Department of Architectural Engineering, Pusan National University, Busan 46241, Korea
2
Department of Civil and Environmental Engineering/Institute of Engineering Research, Seoul National University, Seoul 08826, Korea
3
Civil Design Team, Daelim Industrial Corp. Ltd., Seoul 03155, Korea
*
Author to whom correspondence should be addressed.
Sustainability 2018, 10(3), 686; https://doi.org/10.3390/su10030686
Submission received: 5 February 2018
/
Revised: 25 February 2018
/
Accepted: 27 February 2018
/
Published: 2 March 2018
(This article belongs to the Section Sustainable Transportation)
Abstract
:In recent years, the increasing gap between available funding and preservation needs has influenced district pavement engineers to select and prioritize projects to effectively use funding. However, currently, projects are often selected after an informal assessment, based on local conditions and local district engineers’ experience, in the absence of a statewide systematic process. The primary objective of this study is to determine network-level project sections for effective sustainable pavement management using logistic regression analysis. A large volume of inventory data, documented using pavement-management information systems (PMIS), was used to develop the logistic regression (LR) model for selecting candidate sections. The LR model was subsequently validated using a single 50/50 split sample method. The findings of this study will assist the Austin, Texas, USA district to select and evaluate candidate projects. Furthermore, the study will eventually contribute to improved efficiency in project selection and prioritization by reducing not only the amount of time necessary to review the district PMIS data to identify project candidates, but also the potential for human error.
1. Introduction
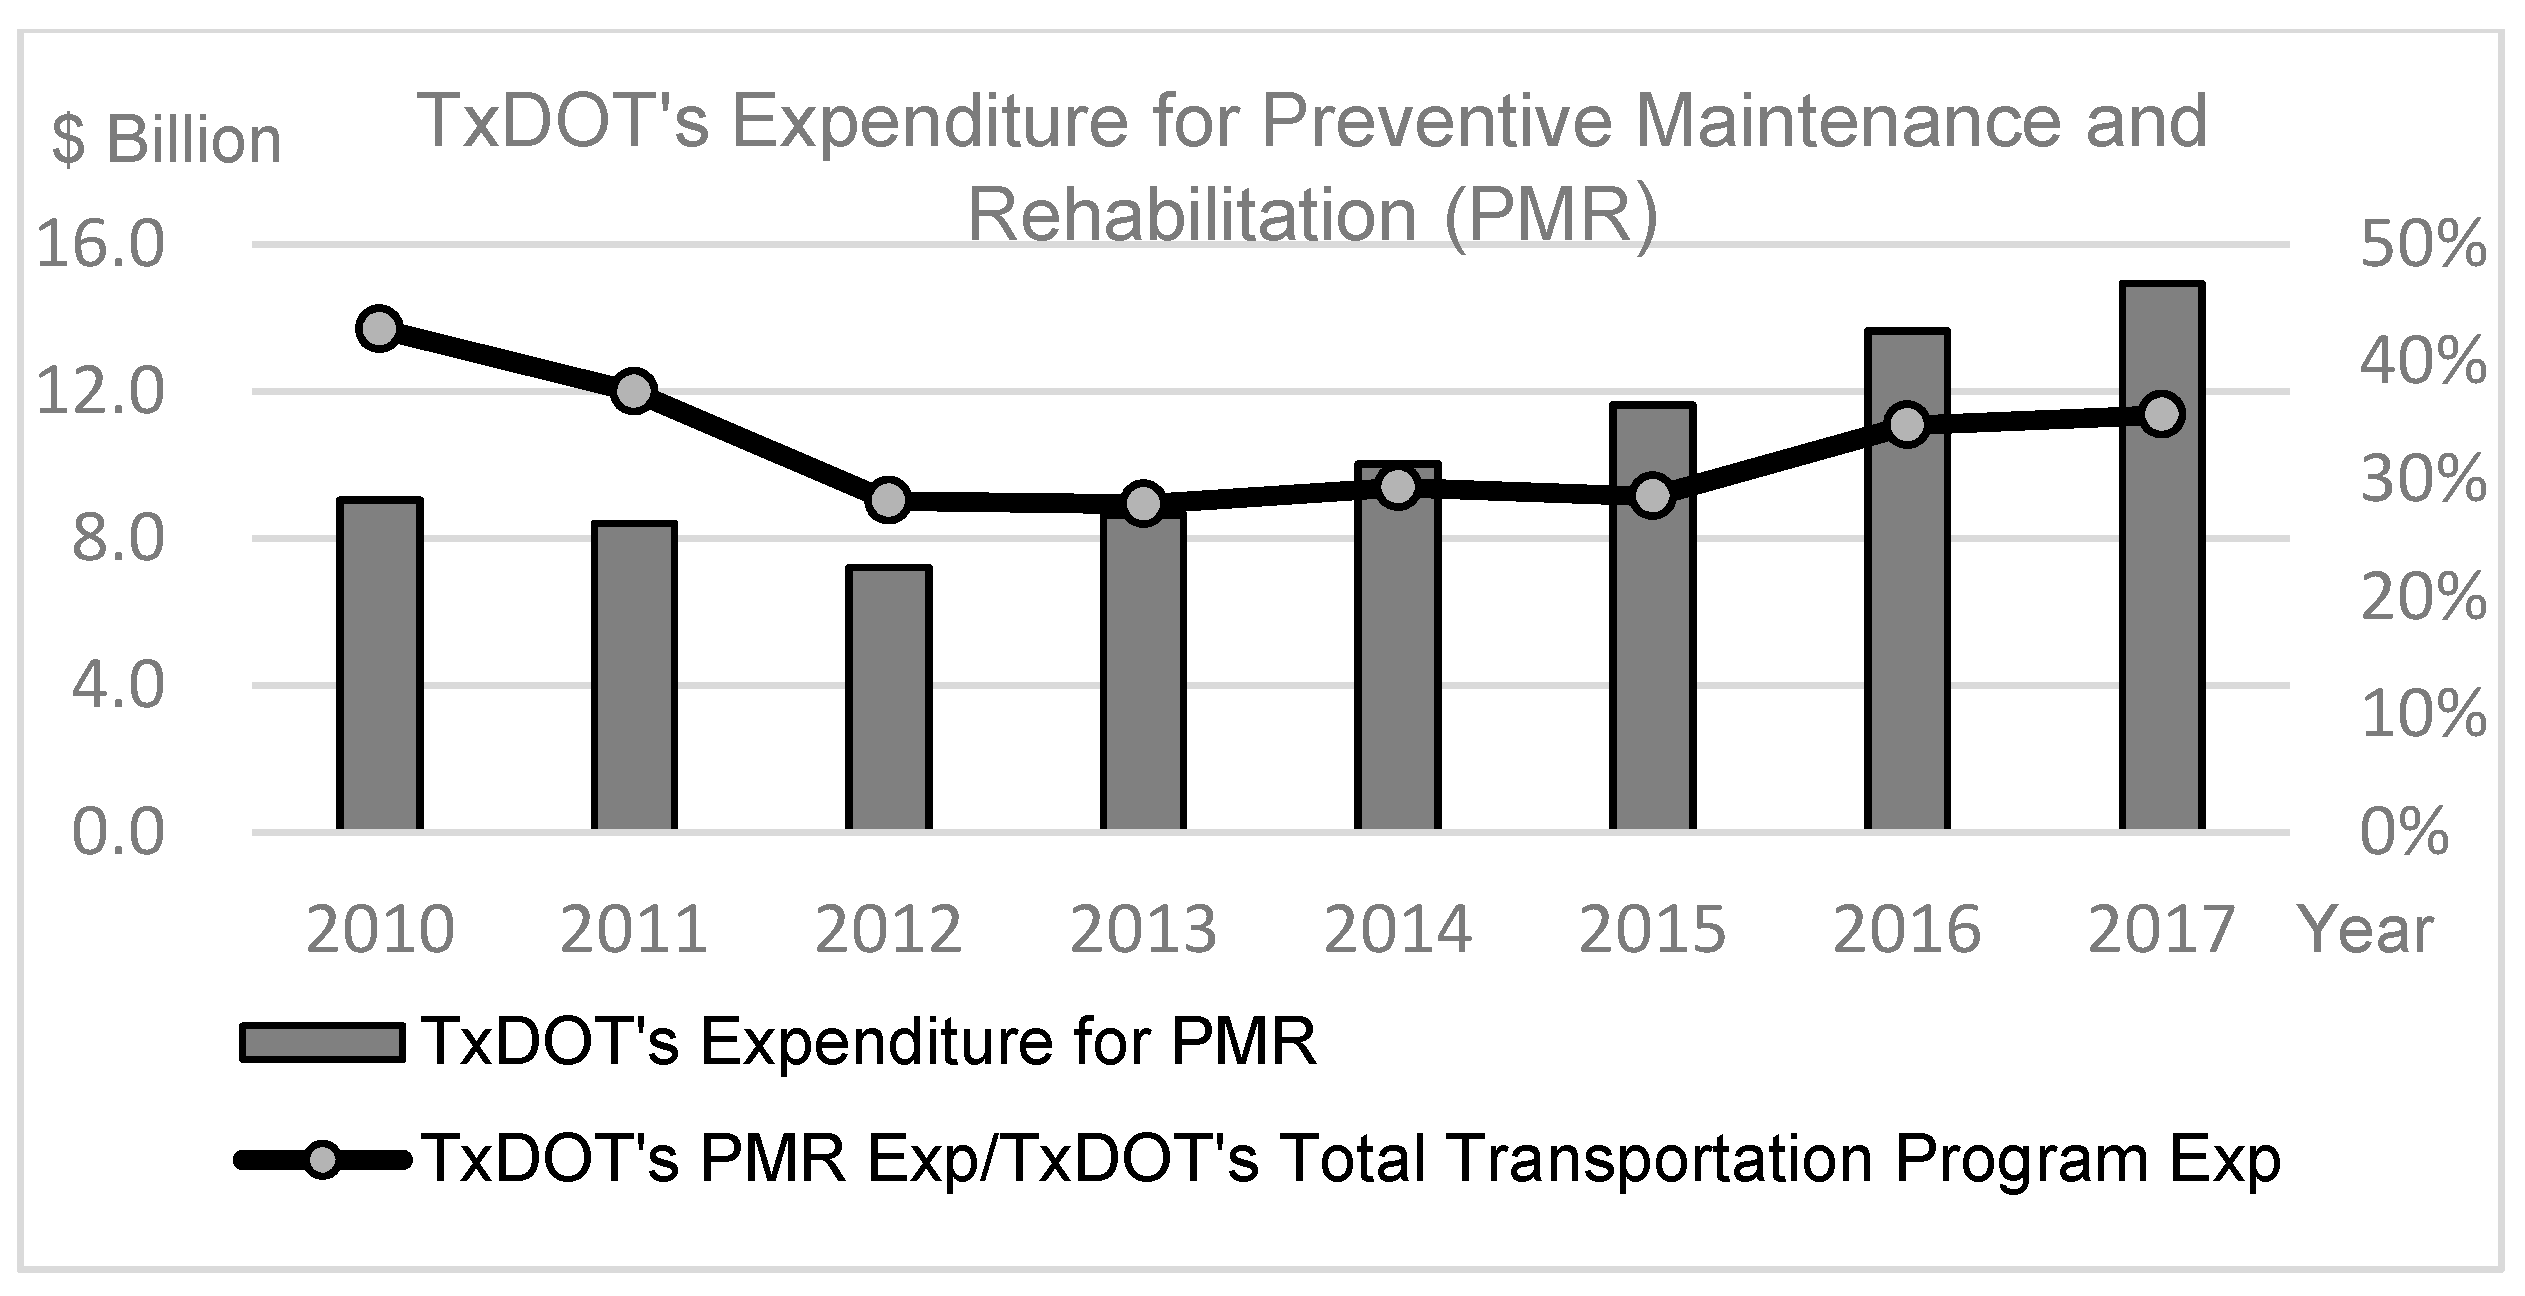
The Texas Department of Transportation (TxDOT) is concerned about effectively allocating their limited resources to current pavement-preservation efforts. In practice, repairing and maintaining pavements that are in good condition costs less than repairing them after they deteriorate [1]. However, the current funding level has not kept pace with Texas’ pavement-preservation needs. In recent years, the TxDOT preventive-maintenance rehabilitation funding has continuously decreased, as shown in Figure 1 [2,3,4,5,6,7,8,9].
In 2011, the Texas 2030 committee warned that, although only 13 percent of the current road miles in Texas have been rated as fair, poor, or very poor, insufficient funding for pavement maintenance will significantly adversely affect future pavement quality. Eventually, nearly all of the pavements in Texas will reach poor or very poor conditions, based upon the current funding trend [10,11]. The increasing gap between available funding and preservation needs motivated the district pavement engineers to select and prioritize projects in order to use funding effectively [12]. To enable sustainable pavement management in Texas, district pavement engineers are requested to submit a list of pavement projects to the Four-Year Pavement-Management Plan Committee (PMPC). The 25 individual district plans are combined to create the statewide Four-Year Pavement-Management Plan, which is reviewed at all levels within TxDOT, including local or lower management levels, district or network management levels, and statewide or upper management levels.
When district pavement engineers suggest projects for the Four-Year Pavement-Management Plan, they must determine and prioritize which projects should be funded first. Currently, each district in Texas uses locally developed methods to select and prioritize projects. Specifically, the Austin district previously assessed and prioritized project sections based on local factors and district experience, e.g., traffic level, pavement type, distress type, and maintenance costs. Based on their assessment, projects were created by combining adjacent project sections. Then, the projects were possibly modified based on funding source, project timing, and public or political issues, to support funding allocation. In particular, the network-level assessment generally required the district pavement engineers to spend almost two months manually evaluating the inventory data stored in the Pavement Management Information System (PMIS).
TxDOT does not have standard procedures for selecting and ranking candidate projects. As a result, projects are currently selected after an informal assessment based on local conditions and local district engineers’ experience, without a statewide systematic process. A data-based project-selection model that applies common rules based on district engineers’ knowledge is immediately needed to achieve a rational, transparent, and effective statewide Four-Year Pavement-Management Plan.
The primary objective of this study is to determine network-level project sections for effective, sustainable pavement management using logistic regression analysis. The study will (1) develop a logistic regression model using the data documented in PMIS, (2) determine the factors that significantly affect network-level project decisions, (3) select network-level project sections, and (4) prioritize those sections for projects that will later be listed in the Four-Year Pavement Management Plan. The findings of this study will establish a solid foundation for project prioritization based on a thorough analysis of pavement needs and project evaluations. The results will assist the Austin district in selecting and evaluating candidate projects. Furthermore, the study will ultimately contribute to improving project selection and prioritization efficiency by reducing not only the amount of time necessary to review the district PMIS data to identify project candidates, but also the potential for human error.
2. Background
2.1. Pavement Management Information System (PMIS)
In 1993, the Texas Department of Transportation (TxDOT) developed the Pavement Management Information Systems (PMIS) to manage their pavement assets and to improve the overall conditions of Texas pavements [13,14]. This database is one of the largest pavement databases in the U.S., containing relevant pavement information for more than 300,000 road sections, each roughly 0.5 m in length [15].
An annual PMIS data-collection survey is conducted at the beginning of each fiscal year from September to December to update the database with new pavement-condition and other inventory data. The pavement information stored in the system typically includes road type, location characteristics, and other indices, e.g., pavement-condition score, distress score, and ride score. The database is generally used by district pavement engineers to select pavement projects.
2.2. Logistic Regression Analysis
The logistic regression model, also referred to as a logit model, is commonly used to predict the presence or absence of an outcome with predictor variables [16]. Compared to other traditional regression techniques, logistic regression is mostly used for binominal models. The dependent variable is usually dichotomous, and the independent variables can take any form, e.g., categorical or numerical variables. Therefore, logistic regression does not need to be normally distributed like linear regression. The logit transformation [17,18] converts a probability measurement between 0 and 1 into values in the interval (−∞, ∞). The logit transformation is defined as
where Logit (p) = the natural log of the odds, ln = the natural logarithm, and p = the probability of success.
After the dependent variable is transformed into a logit variable, it can be predicted by the independent variables using the maximum likelihood estimation. In a logistic regression model, the regression coefficients (β) can be interpreted as in linear models. Thus, βk represents the logit change of the probability associated with a unit change in the kth predictor, holding all other predictors constant. The regression equation is described below
where logit (p) = the log odds of the dependent variable, b0 = a constant, βk = a regression coefficient, and Xk = k independent variables.
3. Model Development Process
The main goal of this study is to prioritize network-level project sections to support the Four-Year Pavement Management Plan. To effectively achieve this goal, logistic regression analysis was conducted using inventory data recorded from the PMIS and a list of projects for Austin district included in the statewide Four-Year Pavement Management Plan. Using the logit model, a large number of project sections that consistently matched with actual projects were selected and prioritized for sustainable pavement management. Figure 2 shows an overview of the model-development process.
3.1. Factors Affecting Pavement Treatment Decisions
To identify the relevant factors for a pavement-preservation decision, a number of pavement engineers from the Austin district of TxDOT participated in the research meetings. The participants were asked to evaluate an initial list of potential factors presented by the research team. Based on expert opinions, the research team identified five relevant factors documented in the PMIS database. These factors included (1) total average daily traffic (total ADT), (2) truck ADT, (3) posted speed limit, (4) condition score, and (5) change in condition score [19,20,21,22]. Each factor can be broken down into several categories that are relevant to the district pavement engineers. These factors are defined below:
- Total average daily traffic (total ADT): volume of traffic in both lanes.
- Truck average daily traffic (truck ADT): volume of truck traffic in both lanes.
- Posted speed limit: legally assigned numerical maximum speed limit.
- Condition score (CS): description of the overall pavement condition, combining the distress score and ride quality (1 = worst condition, 100 = best condition).
- Change in condition score: change in condition score since last year (condition score in previous year—condition score in current year).
3.2. Data Source and Preparation
This study used two main data sets obtained from the TxDOT Austin district, including (1) the PMIS database and (2) a list of Austin district’s pavement preservation projects for TxDOT’s four-year plan. The PMIS database for Austin district includes 8423 road sections, each roughly 0.5 m in length, with relevant pavement information, e.g., a pavement condition summary and route characteristics. Austin district’s preliminary list of pavement preservation projects included 409 pavement maintenance projects. This project data typically consisted of sections more than one-mile long, created by combining several related sections.
To link the relevant pavement information between the two different data sets, the selected projects were split into 0.5-m-long sections (network-level data), and 3800 sections were obtained. These sections were matched with those in the PMIS database, and the relevant pavement information was loaded from the PMIS database. However, missing or zero-value pavement information may often result in inaccurate inference. To avoid this, listwise deletion method was used and as a result, an entire record is excluded from analysis if any single pavement information is missing or zero-value. After removing missing or zero-value pavement information, 3076 sections were identified that had been selected for projects, and 4839 sections were identified that had not been selected for projects. Table 1 summarizes the statistics of the variables included in the analysis.
3.3. Logistic Regression Analysis
A total of 3958 sample project sections (training set: 50.0% of the total), which were randomly selected from the total samples (7915 sections), was used to build the logistic regression model for selecting pavement-preservation projects. The PMIS variables selected by expert input were set as the independent variables for the model, and the final decision on the Four-Year project selection was set as the dependent variable. For easy and consistent interpretation of the relative impact, the most severe categories were selected as references. These variables were dummy coded to evaluate their impact on project selection with the reference categories (marked * in Table 1).
Using the Statistical Package for Social Sciences (SPSS® 19.0), a logistic regression model was developed with the combined data from the PMIS database and the preliminary list of projects for TxDOT’s four-year plan. In the model, the coefficients and standard errors of the parameters were determined using the maximum-likelihood method based on p-values less than 0.5.
3.4. Logistic Regression Analysis
The study adopted a cross-validation technique for validation, which was mainly used to assess the estimate of model-generalization errors. The most common sample splits are 50/50 or 2/3:1/3. In this study, a single 50/50 split sample validation was used to test the model. Therefore, the remaining 3957 sections (test sets: 50% of the total) were used to test the model after developing the LR model with the training set. This validation process ultimately supports the degree to which the logistic regression model can be generalized from the independent variables.
4. Results
The results of the logistic regression analysis showed that all the independent variables, except truck ADT, were significant predictors of project selection. Table 2 shows the logistic regression coefficient, Wald test, and odds ratio for each of the predictors. Using a 0.05 criterion of statistical significance, the total ADT, speed limit (less than 35 mph), condition score (above 50), and changes in CS (above +15) had significant effects. The independent variables that were not significant indicated coefficients that were not significantly different between selected and unselected projects. The following is the final model that was fit to the data:
The logistic regression model showed a significant relationship between the dependent variable (project/non-project) and the independent variables. In the model, the dependent variable is presented on the logit scale, which is the natural log of the odds. Accordingly, the variable estimates indicated the increase or decrease in the predicted log odds of a pavement maintenance project being selected with a one-unit increase in a predictor, holding all other predictors constant. In addition, the constant represented the expected odds of project selection when all the predictor variables were included in the (0) categories (all reference variables: above 50,000 total ADT, above 7500 truck ADT, above 55-mph speed limit, less than 50 condition score, and less than −30 change in CS).
In the total ADT, for example, the odds ratio of total ADT (1) is 0.419 (Exp (−0.870)). This means the odds of being selected for preservation projects, compared to those of not being selected for the projects, significantly decreased by a factor of 0.419 when the section decreased the total ADT from above 50,000 (total ADT (0): reference) to less than 1000 (ADT (1)). Consequently, the inverted odds ratios for these dummy variables indicate that the odds of selecting the section with total ADT (0) for preservation projects were 2.39 times (1/Exp[B]) more likely to be selected for a pavement-preservation project than not to be selected for the project.
Similarly, the odds for selecting a section with a speed limit above 55 mph were 3.7 times (1/0.267) higher than with a speed limit of less than 35 mph. Moreover, the odds for selecting a section with a condition score of less than 50 were 2.18 times (1/0.458) higher than that with a condition score between 70 and 90, and 7.75 times (1/0.129) higher than with a condition score between 90 and 100.
This can be more easily understood when the odds ratio is converted to the probability for project selection. Equation (4) computes the probability of being selected for a project from the log odds (logit). If the section has all reference categories, the model predicts an 89.3% chance of it being selected for a project. By controlling all other predictors as reference categories, the model predicts that 77.7% of the sections with an ADT between 10,000 and 50,000 will be selected for a pavement-maintenance project, while 68.9% of the sections with a speed limit of less than 35 mph will be selected for the project. Therefore, the probabilities of being selected for a project are improved when the sections have a greater total ADT, higher speed limit, lower condition score, and greater negative changes in the condition score. Based on the probability of being selected for a project, each section can be prioritized using the default cut-off value of 0.5. Table 3 shows examples of sections prioritized based on their probability for being selected as a project. The following is the equation for calculating probability of project selection:
5. Logistic Regression Model Validation
A single 50/50 split sample validation was used to validate the LR model. After developing the model with 50% of the samples, the remaining 3957 samples were used to test the model. Table 4 shows the correct-classification rate of the LR model compared to the results of the validation. The LR model shows a higher correct-classification rate on selecting non-projects, while it has a relatively lower correct-classification rate for projects. On the other hand, the validation results showed somewhat similar rates for selecting projects or non-projects, with 72.6% and 64%, respectively. However, the research team found that the LR model consistently produced an overall correct-classification rate of about 70%, compared to the validation results.
6. Discussion
The primary purpose of this study was to develop a logistic regression model to select and prioritize project sections that were supported for the Four-Year Pavement Management Plan. This study was rigorously conducted with a huge number of samples. Although this study focused on the Austin district of Texas, other districts and states can employ similar methods to select and prioritize projects. As discussed with Austin district pavement engineers, the maintenance history was a critical factor for selecting projects. Although the LR model partially considered the pavement maintenance history by using the ‘changes in condition score’ factor—if maintenance occurs, the condition score increases significantly—the correct classification rate could be improved when the factor is directly included.
The findings of this study will be used to assist district pavement engineers in evaluating pavement sections for the statewide management plan. It will also improve the project selection and prioritization efficiency by providing the LR model, which potentially reduces human errors. Moreover, the study’s findings should significantly reduce the time necessary to review the district PMIS data to identify candidate projects, which could potentially maximize the budget-allocation efficiency and improve the pavement conditions. In a nutshell, the study will eventually contribute to improved efficiency in project selection and prioritization by reducing not only the amount of time necessary to review the district PMIS data to identify project candidates, but also the potential for human error. In addition, the findings of the study suggest further studies on pavement-treatment selection, by extracting expert knowledge using the inventory data. Optimizing the funding allocation for pavement-project efficiency would expand these research findings as well.
7. Conclusions
This study attempted to predict network-level sections that would be selected for pavement-preservation projects using logistic regression analysis. A large number of samples were used to develop a logistic regression model. The model results indicated that all of the predictors, except the truck ADT, were significant at the 95% confidence level. These predictors included the total ADT, speed limit, condition score, and changes in condition score since last year. Based on the model, the probabilities of being selected for a project are improved when the sections have a greater total ADT, higher speed limit, lower condition score, and greater negative changes in the condition score. Based on the probability of being selected for a project, each section can be prioritized using the default cut-off value of 0.5.
In addition, a single 50/50 split sample validation was used to validate the result. The validation results also confirmed the LR model by producing about a 70% correct-classification rate. The LR model shows a higher correct-classification rate on selecting non-projects, while it has a relatively lower correct-classification rate for projects. On the other hand, the validation results showed somewhat similar rates for selecting projects or non-projects, with 72.6% and 64%, respectively. However, the research team found that the LR model consistently produced an overall correct-classification rate of about 70%, compared to the validation results. Therefore, the findings of this study will assist the Austin, Texas, USA district to select and evaluate candidate projects.
Acknowledgments
The authors gratefully thank Michael Murphy at the Center for Transportation Research of the University of Texas at Austin and TxDOT engineer Miguel Arellano for sharing their experiences.
Author Contributions
Dae Young Kim and Seokho Chi conceived the ideas for the study, and collected data; Janghwan Kim analyzed the data; all authors wrote the paper and contributed to the final output of the paper.
Conflicts of Interest
The authors declare no conflict of interest.
References
- Elhadidy, A.A.; Elbeltagi, E.E.; Ammar, M.A. Optimum analysis of pavement maintenance using multi-objective genetic algorithms. HBRC J. 2015, 11, 107–113. [Google Scholar] [CrossRef]
- Official Website of Texas Department of Transportation. Transportation Program Expenditures Fiscal Year 2010. Available online: https://ftp.dot.state.tx.us/pub/txdot-info/library/reports/expenditures/fy2010.pdf (accessed on 17 January 2018).
- Official Website of Texas Department of Transportation. Transportation Program Expenditures Fiscal Year 2011. Available online: https://ftp.dot.state.tx.us/pub/txdot-info/library/reports/expenditures/fy2011.pdf (accessed on 17 January 2018).
- Official Website of Texas Department of Transportation. Transportation Program Expenditures Fiscal Year 2012. Available online: https://ftp.dot.state.tx.us/pub/txdot-info/library/reports/expenditures/fy2012.pdf (accessed on 17 January 2018).
- Official Website of Texas Department of Transportation. Transportation Program Expenditures Fiscal Year 2013. Available online: https://ftp.dot.state.tx.us/pub/txdot-info/library/reports/expenditures/fy2013.pdf (accessed on 17 January 2018).
- Official Website of Texas Department of Transportation. Transportation Program Expenditures Fiscal Year 2014. Available online: https://ftp.dot.state.tx.us/pub/txdot-info/library/reports/expenditures/fy2014.pdf (accessed on 17 January 2018).
- Official Website of Texas Department of Transportation. Transportation Program Expenditures Fiscal Year 2015. Available online: https://ftp.dot.state.tx.us/pub/txdot-info/library/reports/expenditures/fy2015.pdf (accessed on 17 January 2018).
- Official Website of Texas Department of Transportation. Transportation Program Expenditures Fiscal Year 2016. Available online: https://ftp.dot.state.tx.us/pub/txdot-info/library/reports/expenditures/fy2016.pdf (accessed on 17 January 2018).
- Official Website of Texas Department of Transportation. Transportation Program Expenditures Fiscal Year 2017. Available online: https://ftp.dot.state.tx.us/pub/txdot-info/library/reports/expenditures/fy2017.pdf (accessed on 17 January 2018).
- 2030 Committee. Texas Transportation Needs Summary; 2030 Committee: Austin, TX, USA, 2009. [Google Scholar]
- 2030 Committee. It’s about Time: Investing in Transportation to Keep Texas Economically Competitive; 2030 Committee: Austin, TX, USA, 2011. [Google Scholar]
- Li, M.; Faghri, A.; Ozden, A.; Yue, Y. Economic feasibility study for pavement monitoring using synthetic aperture radar-based satellite remote sensing: Cost–benefit analysis. Transp. Res. Rec. J. Transp. Res. Board 2017, 1–11. [Google Scholar] [CrossRef]
- Stampley, B.E.; Miller, B.; Smith, R.E.; Scullion, T. Pavement Management Information System (PMIS) Concepts, Equations, and Analysis Models; Texas Department of Transportation Research Report TX-96/1989-1; Texas Transportation Institute, Texas A&M University: College Station, TX, USA, 1996. [Google Scholar]
- Al-Zou’bi, M.M.; Chang, C.M.; Nazarian, S.; Kreinovich, V. Systematic statistical approach to populate missing performance data in pavement management systems. J. Infrastruct. Syst. 2015, 21, 04015002. [Google Scholar] [CrossRef]
- Zhang, Z.; Murphy, M. A Web-Based Pavement Performance and Maintenance Management and GIS Mapping System for Easy Access; Texas Department of Transportation Research Report FHWA/TX-11/5-9035-01-1; Center for Transportation Research: Austin, TX, USA, 2011. [Google Scholar]
- Powers, D.A.; Xie, Y. Statistical Methods for Categorical Data Analysis, 2nd ed.; Emerald Group: Bingley, UK, 2008; pp. 31–66. ISBN 13 978-0123725622. [Google Scholar]
- Johnson, N.L. Systems of frequency curves generated by methods of translation. Biometrika 1949, 36, 149–176. [Google Scholar] [CrossRef] [PubMed]
- Wang, M.; Rennolls, K. Tree diameter distribution modelling: Introducing the logit logistic distribution. Can. J. For. Res. 2005, 35, 1305–1313. [Google Scholar] [CrossRef]
- Charmpis, D.C.; Dimitriou, L. A stress-test of alternative formulations and algorithmic configurations for the binary combinatorial optimization of bridges rehabilitation selection. Eng. Appl. Sci. Opt. 2015, 489–507. [Google Scholar] [CrossRef]
- Loprencipe, G.; Pantuso, A.; Di Mascio, P. Sustainable pavement management system in urban areas considering the vehicle operating costs. Sustainability 2017, 9, 453. [Google Scholar] [CrossRef]
- Sarwar, M.T.; Anastasopoulos, P.C. The effect of long term non-invasive pavement deterioration on accident injury-severity rates: A seemingly unrelated and multivariate equations approach. Anal. Methods Acid. Res. 2017, 13, 1–15. [Google Scholar] [CrossRef]
- Shah, Y.U.; Jain, S.S.; Parida, M. Evaluation of prioritization methods for effective pavement maintenance of urban roads. Int. J. Pavement Eng. 2014, 15, 238–250. [Google Scholar] [CrossRef]
Figure 1.
TxDOT’s expenditures for preventive maintenance and rehabilitation.

Figure 2.
Process for decision-tree-based model development.


Table 1.
Statistics of project-selection variables for pavement preservation.
| Variable | Category | Frequency | Percentage (%) |
|---|---|---|---|
| Total ADT (vehicles) | (1) 0–1000 | 2018 | 25.5 |
| (2) 1001–5000 | 2454 | 31.0 | |
| (3) 5001–10,000 | 1372 | 17.3 | |
| (4) 10,001–50,000 | 1781 | 22.5 | |
| * (5) 50,001+ | 290 | 3.7 | |
| Truck ADT (vehicles) | (1) 0–100 | 1788 | 22.6 |
| (2) 101–1000 | 4650 | 58.7 | |
| (3) 1001–5000 | 1108 | 14.0 | |
| (4) 5001–7500 | 103 | 1.3 | |
| * (5) 7501+ | 266 | 3.4 | |
| Posted Speed Limit | (1) 0–35 mph | 78 | 1.0 |
| (2) 36–45 mph | 627 | 7.9 | |
| (3) 46–55 mph | 1927 | 24.3 | |
| * (4) 55–80 mph | 5283 | 66.7 | |
| Condition Score | * (1) 1–50 | 516 | 6.5 |
| (2) 51–70 | 776 | 9.8 | |
| (3) 71–90 | 1202 | 15.2 | |
| (4) 91–100 | 5421 | 68.5 | |
| Change in Ride Score Since Last Year | * (1) −99–−30 | 364 | 4.6 |
| (2) −29–−15 | 602 | 7.6 | |
| (3) −14–0 | 1415 | 17.9 | |
| (4) 1–15 | 3851 | 48.7 | |
| (5) 16+ | 1683 | 21.3 |
* Indicates reference categories in logistic regression analysis.
Table 2.
Logistic regression analysis results.
| Variables | B | S.E. | Wald | df | Sig. | Exp(B) | 95% CI for EXP(B) | |
|---|---|---|---|---|---|---|---|---|
| Lower | Upper | |||||||
| Constant | 2.119 | 0.268 | 62.399 | 1 | 0.000 | 8.319 | 2.119 | |
| Total ADT (0) * | 60.722 | 4 | 0.000 | |||||
| Total ADT (1) | −0.870 | 0.191 | 20.793 | 1 | 0.000 | 0.419 | 0.288 | 0.609 |
| Total ADT (2) | −0.450 | 0.187 | 5.763 | 1 | 0.016 | 0.638 | 0.442 | 0.921 |
| Total ADT (3) | −0.706 | 0.197 | 12.878 | 1 | 0.000 | 0.493 | 0.336 | 0.726 |
| Total ADT (4) | −1.104 | 0.196 | 31.748 | 1 | 0.000 | 0.332 | 0.226 | 0.487 |
| Speed Limit (0) | 11.265 | 3 | 0.010 | |||||
| Speed Limit (1) | −1.320 | 0.406 | 10.554 | 1 | 0.001 | 0.267 | 0.120 | 0.592 |
| Speed Limit (2) | 0.059 | 0.140 | 0.181 | 1 | 0.671 | 1.061 | 0.807 | 1.396 |
| Speed Limit (3) | -0.058 | 0.085 | 0.470 | 1 | 0.493 | 0.943 | 0.798 | 1.115 |
| Condition Score (0) | 240.822 | 3 | 0.000 | |||||
| Condition Score (1) | −0.367 | 0.188 | 3.807 | 1 | 0.051 | 0.693 | 0.479 | 1.002 |
| Condition Score (2) | −0.780 | 0.188 | 17.307 | 1 | 0.000 | 0.458 | 0.317 | 0.662 |
| Condition Score (3) | −2.049 | 0.185 | 122.940 | 1 | 0.000 | 0.129 | 0.090 | 0.185 |
| Change in CS (0) | 51.869 | 4 | 0.000 | |||||
| Change in CS (1) | −0.250 | 0.223 | 1.255 | 1 | 0.263 | 0.779 | 0.503 | 1.206 |
| Change in CS (2) | 0.254 | 0.219 | 1.350 | 1 | 0.245 | 1.289 | 0.840 | 1.980 |
| Change in CS (3) | −0.341 | 0.221 | 2.373 | 1 | 0.123 | 0.711 | 0.461 | 1.097 |
| Change in CS (4) | −0.521 | 0.223 | 5.439 | 1 | 0.020 | 0.594 | 0.383 | 0.920 |
* The (0) class of each variable (in bold and Italic style) indicates the reference category in the analysis.
Table 3.
Examples of section prioritization based on probability
| Rank | Variables | Decision | |||||||||||||||
|---|---|---|---|---|---|---|---|---|---|---|---|---|---|---|---|---|---|
| Total ADT (1) | Total ADT (2) | Total ADT (3) | Total ADT (4) | Speed Limit (1) | Speed Limit (2) | Speed Limit (3) | CS (1) | CS (2) | CS (3) | ΔCS (1) | ΔCS (2) | ΔCS (3) | ΔCS (4) | Prob. | Pred. | Act. | |
| 1 | × | × | 0.833 | 1 | 1 | ||||||||||||
| 2 | × | × | 0.818 | 1 | 1 | ||||||||||||
| 3 | × | × | 0.781 | 1 | 1 | ||||||||||||
| 4 | × | 0.734 | 1 | 1 | |||||||||||||
| 5 | × | × | × | × | 0.712 | 1 | 1 | ||||||||||
| 6 | × | × | × | 0.708 | 1 | 1 | |||||||||||
| 7 | × | × | 0.682 | 1 | 1 | ||||||||||||
| 8 | × | × | × | 0.643 | 1 | 1 | |||||||||||
| 9 | × | × | × | × | 0.641 | 1 | 1 | ||||||||||
| 10 | × | × | 0.621 | 1 | 1 | ||||||||||||
| 11 | × | × | × | 0.620 | 1 | 1 | |||||||||||
| 12 | × | × | × | × | 0.584 | 1 | 1 | ||||||||||
| 13 | × | × | × | 0.528 | 1 | 1 | |||||||||||
| 14 | × | × | × | 0.473 | 0 | 1 | |||||||||||
| 15 | × | × | × | 0.367 | 0 | 1 | |||||||||||
| 16 | × | × | × | 0.273 | 0 | 1 | |||||||||||
| 17 | × | × | × | 0.242 | 0 | 1 | |||||||||||
| 18 | × | × | × | × | 0.212 | 0 | 1 | ||||||||||
| 19 | × | × | × | 0.202 | 0 | 1 | |||||||||||
| 20 | × | × | × | × | 0.193 | 0 | 1 | ||||||||||
× Indicates that each section has × marked categories.
Table 4.
Correct-classification rate of the LR model vs. validation.
| Prediction | Percentage Correct | |||
|---|---|---|---|---|
| Non-Project | Project | |||
| Actual Observation | Non-Project | 2025 (2071 *) | 345 (398) | 85.4% (72.6%) |
| Project | 822 (781) | 766 (707) | 48.2% (64.0%) | |
| Overall Correct Classification | 2847 (2852) | 1111 (1105) | 70.5% (70.2%) | |
* ( ) Indicates the results of the cross validation.
© 2018 by the authors. Licensee MDPI, Basel, Switzerland. This article is an open access article distributed under the terms and conditions of the Creative Commons Attribution (CC BY) license (http://creativecommons.org/licenses/by/4.0/).
Share and Cite
MDPI and ACS Style
Kim, D.Y.; Chi, S.; Kim, J. Selecting Network-Level Project Sections for Sustainable Pavement Management in Texas. Sustainability 2018, 10, 686. https://doi.org/10.3390/su10030686
AMA Style
Kim DY, Chi S, Kim J. Selecting Network-Level Project Sections for Sustainable Pavement Management in Texas. Sustainability. 2018; 10(3):686. https://doi.org/10.3390/su10030686
Chicago/Turabian StyleKim, Dae Young, Seokho Chi, and Janghwan Kim. 2018. "Selecting Network-Level Project Sections for Sustainable Pavement Management in Texas" Sustainability 10, no. 3: 686. https://doi.org/10.3390/su10030686
Note that from the first issue of 2016, this journal uses article numbers instead of page numbers. See further details here.