Article

Integrating Extended Fourier Amplitude Sensitivity Test and Set Pair Analysis for Sustainable Development Evaluation from the View of Uncertainty Analysis

1
Key Laboratory of Remote Sensing of Gansu Province, Northwest Institute of Eco-Environment and Resources, Chinese Academy of Sciences, Lanzhou 730000, China
2
University of Chinese Academy Sciences, Beijing 100049, China
3
Key Laboratory of Inland River Basin Eco Hydrology, Northwest Institute of Eco-Environment and Resources, Chinese Academy of Sciences, Lanzhou 730000, China
4
Institute of Tibetan Plateau Research, Chinese Academy of Sciences, Beijing 100101, China
5
CAS Center for Excellence in Tibetan Plateau Earth Sciences, Beijing 100049, China
*
Author to whom correspondence should be addressed.
Sustainability 2018, 10(7), 2435; https://doi.org/10.3390/su10072435
Submission received: 12 June 2018 / Revised: 29 June 2018 / Accepted: 6 July 2018 / Published: 12 July 2018

Abstract

:
It is of importance but great difficulty to objectively and quantitatively evaluate the sustainable development level, especially in the weight determination process and uncertainty evaluation. The traditional weight determination methods hardly reflect the coupling effect (interaction) among the indices. More importantly, conventional evaluation methods seldom consider the uncertainties of the indices in the index system. Thus, it is indispensable to apply a more comprehensive approach to solve these defects. This paper presents a new method to evaluate the sustainable development level. The approach integrates the advantages of the Extended Fourier Amplitude Sensitivity Test (EFAST) and Set Pair Analysis (SPA) (called EFAST-SPA). The EFAST algorithm is used to determine the indices’ weight, and the SPA is employed to handle the uncertain relations in the evaluation system and to calculate the sustainable development level. A quantitative evaluation on the agricultural sustainable development in the middle reaches of Heihe river has been conducted using the EFAST-SPA method. The results have been compared with the traditional entropy method and it was concluded that EFAST-SPA and entropy are highly in line with the actual development status. In most cases, the EFAST-SPA method can describe the development levels more accurately, which reflects a higher reliability and application value of this proposed approach. Moreover, the presented method deepens the understanding of sustainable development evaluation from the view of uncertainty analysis inside the evaluation system.

1. Introduction

Sustainability is an integral science which focuses on the dynamic relationship between humans and the environment [1]. It especially emphasizes the vulnerability of the coupled human-society-environment system [2]. With the rapid expansion of human society, the relationship between human society and the human living environment is in a unstable change [3]. This inconstant change exacerbates the uncertainty in the evaluation system and causes several problems for the sustainable development level evaluation. One of change is how to analyze the uncertainties among the indices to identify the real sustainable development status using a reasonable and quantitative method. The evaluation model and indices weighing method selection are two main aspects of the sustainable development evaluation process. Both may bring a great influence on the accurate identification of the dynamic sustainable development status.
Numerous evaluation models are widely used in sustainable development research [4,5,6]. While the quantitative evaluation [7] models are becoming mainstream in recent times. The quantitative models can be separated into four types [8]. Including the Social-economic model, Ecology model, Systematic model, and some other emerging models [9]. The Social-economic model [10] includes the Human Development Index (HDI) [11] and Input-output model [12]. These kinds of methods integrate the social-economic indices into a composite index or employ the relationship between consumption and output to evaluate the sustainable development levels. The Social-economic model is easy to handle, but not all the data it needs can be easily obtained in every research area. Thus, it is not considered a universal model. There are some widely used methods in the Ecology model, such as the Ecological Footprint [13] and Emergy Analysis [14]. This kind of model often converts the natural resources which are necessary for human survival and ecological restoration into a given unit, and then calculates the natural resource supplies with the same unit. Lastly, sustainable development levels can be determined by quantitatively analyzing the relationship between consumption and supplies. However, this kind of method pays too much attention on the aspect of ecology and less on the social-economic aspect, which may lead to a partial evaluation result. The Systematic model [15] is the most frequently used model in sustainable development evaluation research. This is because it is very comprehensive and easy to conduct. The Systematic model incorporates the social, economic, ecological, and environmental indices into the evaluation system. The sustainable development levels could be calculated via a simple linear weighing method. But a reasonable weight of each index is a high crucial factor for the Systematic model to work out an authentic evaluation result. Nowadays, emerging models which are derived from the interactive of interdisciplinary academic are getting more attention. Including the Neural Network model [16], Genetic Algorithm [17], Projection Pursuit model [18], and Support Vector Machine [19] (SVM) method. These innovative approaches are developing rapidly from the highly interdisciplinary of other research fields. Even there is a high value can be explored in those new methods, they are still not widely used due to the shallowness in current research.
The weighing method is essential for an accurate evaluation of the sustainable development level. A lot of evaluation researches have been carried out using different approaches in the past [20,21,22,23]. Among them, several classic theories have been widely applied. Including Analytic Hierarchy Process (AHP), Entropy [24]. AHP was proposed by Satty [25] when he researched on how to allocate the electric quantity that depended on the contribution of different industries. Through calculating the decision matrix and the indices’ score estimated by experts, the weight of each index can be obtained, but this kind of method is overly relying on the experience of decision-makers. The Entropy method is the most common objective technique used by researchers [26,27]. This method usually takes the normalized index entropy as the indices’ weight. Even this method can work out precise weights in most cases. But the no-supervision weighing process requires pinpoint accuracy of data. Generally speaking, the traditional weighing methods seldom take the coupling effect among indices into account, which means that the common techniques rarely consider the uncertainties and the dynamic status stated in the beginning. In recent times, some uncertainty analysis approaches have been employed to evaluate the sustainable development level. Fuzzy Logic [28] is a representative solution to handle the uncertainties in evaluation problems which can be conducted without indices’ weight. The membership function it contains can be applied to determine the sustainable development level directly. But the calculation process is a bit complicated and it is only applicable when the standard index system exists. It is hard to define a standard index system for dynamic sustainable development. So, the application of this kind method on sustainable development evaluation is not very wide.
The overall objectives of this research are to quantitatively estimate the sustainable development level and to work out a more reasonable classification of evaluation levels through the uncertainty analysis technique. However, lacking comprehensive uncertainty analysis may exist as a common weakness in the previous models and techniques. To overcome the deficiency, this paper proposes a more comprehensive approach integrating the Extended Fourier Amplitude Sensitivity Test (EFAST) [29] and Set Pair Analysis (SPA) [30], namely the EFAST-SPA method, to conduct sustainable development evaluation. The feasibility of applying EFAST to evaluate sustainable development levels has been validated in previous research [31]. But only the sustainable development trends which presented evaluation results were analyzed in that research. To provide a more detailed explanation of the evaluation, this paper will convert the evaluation results from a trend description to a quantitative level classification. The classification can make the evaluation results in different areas more comparable. To be brief, two main specific issues are explored in this paper: (1) How to conduct the uncertainty analysis and obtain a quantitative sustainable development level from the EFAST-SPA method? (2) How to verify the accuracy of the evaluation result calculated by this proposed approach? To solve these questions, we completed the following work: Firstly, the EFAST is applied to fix indices’ weight because of its advantage in quantitative global sensitivity analysis [31,32,33,34]. Secondly, the SPA algorithm, which can analyze the unity, opposition, and uncertainty among different objects [35,36,37], was employed to analyze the uncertain relations in the evaluation system and to serve as evaluation model. Lastly, the evaluation results were compared with the results of the conventional entropy method and the positive analysis was also conducted synchronously.
The remainder of this paper comprises five sections. The materials and evaluation method are described in Section 2. The results and comparison analysis are described in Section 3. The discussion is provided in Section 4, and conclusions are presented in Section 5.

2. Materials and Methods

2.1. Study Area

Heihe River Basin is the second largest inland river basin in China with an area of 142,300 square kilometers [38]. The study area (Figure 1) of this paper is located at the middle reaches of the Heihe River Basin. It is a main agricultural region. There are various landscapes inside the study area [39], of which the oases proportion is 28.9%. However, the Gobi Desert and the mountain region occupies 61.4% and 9.5%, respectively. The lack of water and farmland constrains the agriculture development naturally [40]. Additionally, the increasing population and the expansion of human activities in recent years have brought many serious problems [41]. Including soil desertification [42], soil salinization, and soil erosion [43]. All of those problems have had a negative effect on the ecological environment and on the agriculture sustainable development in this study basin [44,45].

2.2. Brief Introduction of the Whole Evaluation Process

Figure 2 illustrates that how uncertainty analysis approaches were applied to evaluate the agricultural sustainable development levels. The evaluation system we constructed is based on the actual condition of the study area. The EFAST and the entropy were used to fix the weights of each index in the evaluation system. Weight comparison between the EFAST and entropy was also conducted. Based on the multi-index comprehensive analysis model and the weights determined by entropy, the development index can be calculated. Meanwhile, with the weights assigned by EFAST and the connection degree which was calculated by SPA, the development index of EFAST-SPA can be obtained. After that, the evaluation results of the subsystem and the entire system were acquired. To avoid repetition, only the subsystem results calculated by entropy and EFAST-SPA were selected to analyze. Positive analysis in this process was conducted to demonstrate the accuracy and the advantages of this new approach when it was compared with the entropy. Afterwards, the evaluation results of the entire system were classified into five levels. Depending on the analysis of evaluation results, the major development problems were revealed in the conclusion section.

2.3. Evaluation Syestem and Data Collection

2.3.1. Construction of Evaluation System

The evaluation process included many steps. The construction of the indicator system was the first work to be prepared for that process. Numerous international sustainable development evaluation systems were established during the last 30 years and many of them are widely used [46]. The latest Sustainable Development Goals [47] system was released by the UN Sustainable Development Summit in 2015. However, the international systems are too complex to apply when the research is not on a global scale. While evaluating the sustainable development level of the local region, the local conditions and the problems can vary from one area to another.
The agricultural sustainable development problems in the middle reaches of the Heihe River Basin consisted of four main aspects. Including a long-term fragile ecological environment [48], water shortages [36], undeveloped economy and social development [49], and lower efficiency in agricultural production [50]. Depending on these aspects a specific evaluation system (Table 1), which mainly focused on the local problems of the research area, was constructed. The system contained positive and negative indices. For the positive indices, the higher index value means a better development status. For the negative indices, a lower index value means better development status.
Eight negative indices have been set in our evaluation system. Therein, natural population growth rates were designed as negative indices because the population in the research area was large enough. The agricultural population proportion index was negative because a larger agricultural population led to labor redundancy with the progress in agriculture. Obviously, a chemical fertilizer application rate assuming 100% utilization pesticide use intensity, plastic sheeting use, and agricultural disaster rate, it was easy to understand their negative attributes. Besides, the smaller the water table value, the easier access to groundwater. Thus, the water table was set as at a negative index. The more groundwater irrigation in the Heihe middle reaches, the worse impact will appear. So, the groundwater irrigation was regarded as a negative index.
Among the positive indices, the only-child family rate can reflect the proportion of the families which raised only one child. In this research area, a one-child family usually means that this family can get access to higher quality living conditions. Thus, it is logical to define the only-child family rate as a positive index. Combining with the explanation of the negative indices, it is easy to understand the attribute of the rest positive indices.

2.3.2. Index Explanations

The indices selection was on the basis of a great number of related studies [51,52,53,54] and the researcher’s experiences. All the index data can be obtained from the statistical yearbook or some specific websites. Each index in the evaluation was directly or closely related to the agricultural development in the study area. Therein, the agricultural economic development level subsystem was designed to focus on economy. Among them, the primary industry output per capita and crop input-output ratio were used to identify the agricultural economic level directly. The second and third industry output per capita were also adopted because these two indices would impede or facilitate the agricultural development to some extent. The livestock input-output ratio index was employed because the stockbreeding was always in conflict with the crop farming. The agricultural productive factors development level subsystem was mainly composed of the agricultural output per capita and the production efficiency. Meat and grain share per capita reflected the basic living substance level for human survival. Net income per capita of farmers was used to measure the farming economic efficiency. The mechanical effective utilization factor and effective irrigation coefficient were chosen as production efficiency indices to identify agricultural mechanization level. Agricultural social development level was designed on the basis of population, basic livelihood protection, and sociocultural development. Natural population growth rate, agricultural population proportion, only-child family rate, and the proportion of agriculture technicians among rural laborers were used to evaluate the labor resources development trend. The hospital beds share per 104 population and tap water supply rate were employed to calculate the basic livelihood protection level. Cultural and arts workers per 104 population represented the local cultural participation level. Agricultural resources and environment development level subsystem was aimed at agricultural resources consuming and environmental concerns. Therein, arable land per capita and the water table can reflect the resources whose status were germane to agricultural development. The chemical fertilizer application rate assuming 100% utilization, closed forest area, pesticide use intensity, plastic sheeting use, surface water and groundwater irrigation were used to evaluate the environmental impact caused by human activities. The agricultural disaster rate was employed to estimate the environmental influence from nature.

2.3.3. Data Collection and Pre-Processing

The data adopted in this paper was mainly derived from the Zhangye Yearbook (2006–2015) which comprised all the social and economic data. The unbalanced sustainable development states of different counties would make their evaluation comparison more difficult. To overcome this difficulty, the ratio data, which can be obtained after preprocessing, was adopted in this research. For instance, the index namely “Arable land per capita” was the ratio of arable land and total population in the certain area. Besides, some remote sensing data were also used. The surface and groundwater irrigation data were calculated from the “Monthly irrigation datasets (for both surface water and groundwater, 1981–2013) with 30 s spatial resolution over the Heihe River Basin” [55,56]. Additionally, from the “Monthly groundwater table depth, soil moisture, and evapotranspiration datasets (1981–2013) with high spatial resolution over the Heihe River Basin” [55,56], the water table data can be extracted. All those remote sensing data were downloaded from the Cold and Arid Regions Science Data Center at Lanzhou. The data available is under strict checking process, which can ensure the data’s accuracy and reliability. In this paper we extracted those three indices by administrative boundary. Then the averaged pixel value can be obtained with the tool named “Band Collection Statistics” in Arcgis 10.2 [57]. After the extraction we found that even the smallest county Linze still contained 52 pixels, and that the number of pixels can satisfy the accuracy calculation needs.
This research input the index data into the SPA model to evaluate the sustainable development level. The raw data were various in units and cannot be compared directly, so a standardization of those data was the first process before putting them into the model. This paper employed the extreme standardization method [58] as the pre-process approach.

2.4. Evaluation Method

2.4.1. Model Selection

Model selection is an important step to conduct the sustainable development evaluation because it is closely associated with the weighing method. The Systematic model requires a very high accurate weight of index. Thus, this model can be an optimal choice to test the feasibility of EFAST weighing method.
The SPA algorithm can separate the indices into different levels perfectly by quantitatively analyzing the interaction among the indices. Besides, the modified SPA algorithm, which contains the indices weight, can offer a composite index to describe the sustainable development level as the Systematic models do. Thus, the SPA was selected as our evaluation model.

2.4.2. Entropy Evaluation Method

Entropy is the most frequently used method in previous research. Depending on the degree of discreteness of each index, this subjective method can calculate the entropy of the indices. Afterwards, the weight of each index can be obtained through the normalization process of their entropy.
In this research, the evaluation result, which was calculated by the entropy method, can be described using the following formula.
T j = i = 1 n w i P j i
where, T j is the evaluation result of a certain county in its j t h year; w i represents the weight of the i t h index.

2.4.3. EFAST-SPA Evaluation Method

Fixing a reasonable weight of each index is the key process before evaluating the sustainable development level in the chosen evaluation model. It is hard to quantitatively analyze the complex uncertainties among the indices. That issue raises difficulties in the weight determination process. Besides, accurately classifying the development levels into different categories is another difficulty for the evaluation because the sustainable development status is dynamic and there exists no standard classifications to identify the evaluation results. To solve the weighing problem, the EFAST method was adopted to fix the indices’ weight. Based on the analysis of EFAST, both the first-order sensitivity (the main effect, also called MSI) indices, which represent a single index influence on the model output, and the total sensitivity indices (TSI, the total effect), which reflects the main effect and the coupling effect among indices on the model output, can be calculated. The TSI normalization result would offer the weight of each index. The feasibility and advantage of this weighing method has been verified in previous research [31]. To provide a reasonable evaluation classification, this research has improved the EFAST with the SPA algorithm to develop a more improved and quantitative evaluation method. The detail of weighing process can be found from a previous work [31] and the combined method can be described subsequently.
All the weighing processes were compiled into Python code which can execute the program efficiently. The weights obtained from this program were adopted into the SPA model to calculate the sustainable development level. If there were two groups whose elements were related from one another, the SPA method would set the elements of those two groups into one-to-one correspondence pairs. The certain-uncertain relations can be analyzed by Equation (2):
μ = a + b i + c j
In this expression, the μ represents the connection degree, a , b and c are the degree of identity, uncertainty and opposites, respectively. Additionally, the sum of a , b and c is 1, and the range of them can be defined as 0 a , b , c 1 . Commonly, the value of opposite coefficient j = 1 . The range of the uncertainty coefficient i is ( 1 , 1 ) [59].
There always exists various degrees of uncertainty relations between the comparison groups. The expression of the connection degree can be extended into a multi one [60].
μ = a + b 1 i 1 + b 2 i 2 + ... + b m i m + c j
In this paper, a standard table, namely the classification of index level (Table 2), was constructed. The boundary of each level was set by equal-interval. For the positive index, the boundary of the first level is the highest in the system, and the boundary of the fourth level is the lowest one. The negative indices’ boundary was then set by the opposite conduct.
By comparing the standard level data with the original index data, the connection degree can be calculated with Equation (3). The connection degree of positive and negative indices should be calculated by different expressions. The negative index was processed by Equation (4):
μ K = { 1 + 0 i 1 + ... + 0 j x t S 1 s 2 x t s 2 s 1 + x t s 1 s 2 s 1 i 1 + ... + 0 j S 1 x t S 2 s 3 x t s 3 s 2 i 1 + x t s 2 s 3 s 2 i 2 + ... + 0 j S 2 x t S 3 s 4 x t s 4 s 3 i 2 + x t s 3 s 4 s 3 i 3 + 0 j S 3 x t S 4 0 + ... + j x t > S 4
where S 1 < S 2 < S 3 < S 4 .
The following expression was used to calculate the connection degree of positive indices.
μ K = { 1 + 0 i 1 + ... + 0 j x t S 1 x t s 2 s 1 s 2 + s 1 x t s 1 s 2 i 1 + ... + 0 j S 2 x t < S 1 x t s 3 s 2 s 3 i 1 + s 2 x t s 2 s 3 i 2 + ... + 0 j S 3 x t < S 2 x t s 4 s 3 s 4 i 2 + s 3 x t s 3 s 4 i 3 + 0 j S 4 x t < S 3 0 + ... + j x t < S 4
where S 1 > S 2 > S 3 > S 4 .
To simplify the calculation process, the uncertainty coefficient was divided by their range with equal-interval and the value of coefficients were defined as i 1 = 0.5 , i 2 = 0 , i 3 = 0.5 .
After the definitions above, the connection degree of the standard group and the original group can be calculated. Combined with the weights determined by EFAST method, the sustainable development index μ ( A , B ) can be expressed as the following equation:
μ ( A , B ) = n = 1 N ω n μ ( A n , B K ) = n = 1 N ω n a n + n = 1 N ω n b n , 1 i 1 + ... + n = 1 N ω n b n , K 2 i K 2 + n = 1 N ω n c n j
where, K represents the number of standardization level, μ ( A n , B K ) means the connection degree of H ( A n , B K ) , and ω n is the weight of index n .
The last process was to quantitatively classify the sustainable development index into different levels. The method of classification was introduced as the Table 3:

3. Results

3.1. Comparison of MSI and TSI

According to the weighing process of EFAST, both the MSI and TSI of each index can be calculated. There are a total of six counties in the research area and the MSI value was slight less than the TSI value in all these counties. To be brief, only Ganzhou was selected as a sample to conduct the comparison between MSI and TSI.
From Figure 3, it can easily be seen that the difference between the MSI and TSI in Ganzhou is very small. For instance, the biggest difference between them was found in 2005 and it was only 0.0011, while the smallest difference was only 0.0006. For the entire period, the biggest difference was 0.0012 and the smallest was 0.0004. The difference reflected the coupling effect among the indices to the model output. But those differences were not as significant as expected. These results may be caused by the simple lineal model; because the EFAST algorithm can be more efficient when it is applied in the analysis of nonlinear and high dimension models. Even though, the weak coupling effect still cannot be neglected when an accurate evaluation is needed. Besides, the differences of SIs among each index from 2005–2007 were more significant than the 2008–2013 period. Only a few indices’ SIs can be amounted to 80% in the entire SIs space from 2005–2007 because during that period only a small number of indices were paid attention by the farmers or governments. During the 2008–2014 period, more indices were attached importance. That may be because of more comprehensive thoughts of decision-makers. However, the differences of SIs in 2014 were significant again, which may be caused by the policy orientation of the government.

3.2. Weights Determined by Entropy and EFSAT

The agricultural sustainable development levels were variable because different areas would be confronted with different problems. So, in this paper, different weights were set for the same index in different areas. The weights assigned by the entropy and EFAST are shown in Figure 4.
From Figure 4, it can be clearly seen that high conformity exists between the weights assigned by entropy and EFSAT methods. Taking Ganzhou as an example, closed forest area, the proportion of agriculture technician among rural laborers, meat share per capita, livestock input-output ratio, and pesticide use intensity were regarded as the top five indices which had a higher weight than other indices in entropy method. While according to the EFAST, the top five indices included meat share per capita, livestock input-output ratio, the proportion of agriculture technician among rural laborers, closed forest area, and cultural and arts workers per 104 population. Obviously, we can find that four indices were the same in the top five of both methods. When the top five indices of the six counties were concluded by entropy and EFAST, there were also 18 of the same indices amongst the 30 indices. Entropy is a widely used approach in weight determination research, the 60% overlap rate of higher weight indices shows the feasibility of EFAST. Further validation would need to be conducted via the evaluation results comparison of these two methods.
Weight determination is a process to screen out the important indices to the target from the index system and fix the important indices with high weights. The more discrete the weights, the better the evaluation results will be. The dispersed degree of entropy and EFAST is exhibited in Table 4. In this table it was found that all the dispersed degrees in EFAST were greater than that in entropy. The smallest difference existed in Sunan, however, the ratio between EFAST and entropy was still high as 1.41.

3.3. Analysis of Subsystem Evaluation Results

The evaluation results of the subsystem reflect the balance degree of the four subsystems during their development phase. The Subsystem Development Index (SDI) was calculated with no classification of levels. The reason was that we only want to analyze the development trend on each subsystem, and the SDI with no level classification can be more intuitional for analysis via a straight-line graph. To avoid repetition, only Ganzhou and Minle were selected to analyze the difference of SDI calculated by entropy and EFAST-SPA.
From Figure 5 and 6, it can be seen that there was a high consistence between the SDI marked with EFAST-SPA and entropy. But it was noted that subsystems in Ganzhou experienced an unbalanced development from 2005 to 2014. The agricultural economic development level showed a slow development speed during that period. Meanwhile, the agricultural social subsystem developed rapidly at the first half research period, but its trend declined in the following years. Especially in 2013, the agricultural social SDI nearly decreased to the level of 2005. The agricultural productive factors, resources, and environment subsystem experienced a circuitous rise during the entire research period. Thus it can be concluded that the development pace among those four subsystems in Ganzhou was not in line and the pace did not satisfy the balance demand of sustainable development.
Similarly, there existed an unbalanced development trend among these subsystems in Linze. The agricultural productive factors and the agricultural social subsystem showed a rapid development in the first several years and then stayed steady or subtlety declined in the following years. Besides, the agricultural economic development level expressed a very slow development speed during the entire time. However, agricultural resources and environment development level even experienced a sharp downward trend from 2009 to 2012, this worsening ecological environment phenomenon violated the concept of sustainable development.
Overall, both the entropy and the EFAST-SPA have evaluated the subsystem sustainable development level objectively. Entropy is a widely accepted evaluation method. Thus, this paper selected its results as our reference standard to verify the EFAST-SPA method. Thus, similar evaluation results between entropy and EFAST-SPA further verified the accuracy of our proposed method.

3.4. Comprehensive Evaluation Results and Positive Analysis

This section would exhibit the comprehensive development index (CDI) calculated by entropy and EFSAT-SPA methods (see Figure 7). According to the sustainable development level classification method introduced in Section 2.4.3, the evaluation results of each area were classified into different levels (see Figure 8).

3.4.1. Positive Analysis of Entropy and EFAST-SPA

Figure 7 illustrated the CDI of those six counties. The trend it showed also reflected the consistence pattern between the entropy and the EFAST-SPA approach on the whole study area. Only a small part of these dots showed obvious differences. The inconsistent year should be emphasized in the positive analysis. For instance, the CDI in 2013 calculated by entropy in Ganzhou showed a significant downward trend, but the EFAST-SPA showed a rising trend. Compared with 2012 (Table 5), many positive indices decreased significantly, but few negative indices improved. So, the evaluation results of entropy were more reasonable. However, in 2006, the negative indices in Ganzhou, such as pesticide use intensity and plastic sheeting use, experienced a weak rise, and that weak rise lead to a significant improvement in the positive indices. This improvement can probably bring a rise in CDI. Thus, the rising trend of the EFAST-SPA was more accurate than the entropy for 2006.
During 2006–2008, CDI in Minle also showed a difference between entropy and EFAST-SPA. From Table 6, it can be noted that most positive indices in 2006 improved compared to 2005. For the negative indices, only the Natural population growth rate increased. But the benefits that came from the positive indices compensated for the loss that the negative indices brought. Therefore, the rising trend in entropy was correct through the positive analysis. However, the significant rising trend of 2007 and 2008 in the EFSAT-SPA method can be more accurate than the entropy, because, in comparison with 2007, most positive indices in 2008 experienced an improvement, and meanwhile, most negative indices decreased to a variable extent.
There also existed some differences between entropy and EFAST-SPA in Shandan during 2012 and 2013. As shown in Table 7, 15 positive indices remained the same or decreased in 2013, and 6 negative indices remained unchanged or increased, which could probably cause a sharp downward trend in the CDI. This downward trend was not evidently expressed in the entropy method.
Only six obvious inconsistent years existed among the sixty points in Figure 7. Two of the inconsistent years showed that the entropy was more accurate. The remaining four stated that the EFAST-SPA performed better. The entropy often provided a narrow range CDI. So, it cannot perform as well as EFAST-SPA when radical change occurs. That was the main reason why EFAST-SPA performed better in the other four inconsistent years. In this paper, the 90% consistent results can verify the feasibility of our proposed method. Overall, the EFAST-SPA method may cause some deviations in this research. However, this small deviation cannot affect its application.

3.4.2. Sustainable Development Level Classification of Entropy and EFAST-SPA

The evaluation results were classified into five levels and shown in Figure 8. The difference in levels between entropy and EFAST-SPA was not significant. In this section, only the classifications of EFSTA-SPA were selected to rank the sustainable development level of the six counties from 2005–2014. The ranking was calculated by summing up the levels of each county. The smaller the sum, the better the sustainable status. Thus, the ranking was listed as: Sunan (20) > Shandan (36) > Gaotai (40) > Linze (41) > Minle (44) > Ganzhou (45).

3.4.3. Sustainable Development Level Classification on Spatial Map

To demonstrate the level classification more directly and analyze the sustainable development relationship spatially, a spatial map containing the classification could be a useful tool for the analysis. To keep the paper reasonably concise, only the classifications in 2005, 2010, and 2014 (see Figure 9, Figure 10 and Figure 11) were exhibited as representatives.
The color in the maps showed that all the six counties were becoming greener from 2005 to 2014. Which reflected a better development trend during the research period. Besides, the sustainable development status was better when the area was further towards Ganzhou. This phenomenon existed in all the maps.

4. Discussion

4.1. Comparison of the Weights Assigned by Entropy and EFAST

A reasonable weight for the index is a primary and key process for evaluation. Few previous studies were based on the analysis of the coupling effect among the indices. Applying the global sensitivity analysis method aims at offering a deeper understanding of weight determination and providing more reasonable weights for the evaluation indices. This paper found that the EFAST algorithm, which considered the coupling effect among the indices, was feasible. Furthermore, the EFAST algorithm can be able to fix a more comprehensive and reasonable weight than the traditional entropy method. That is because a more discrete weight range can efficiently separate the indices into different important levels. Additionally, this subjective method has been widely used in the other models and its prudent calculation has been verified.

4.2. Analysis of the Unbalance Development in Subsystems

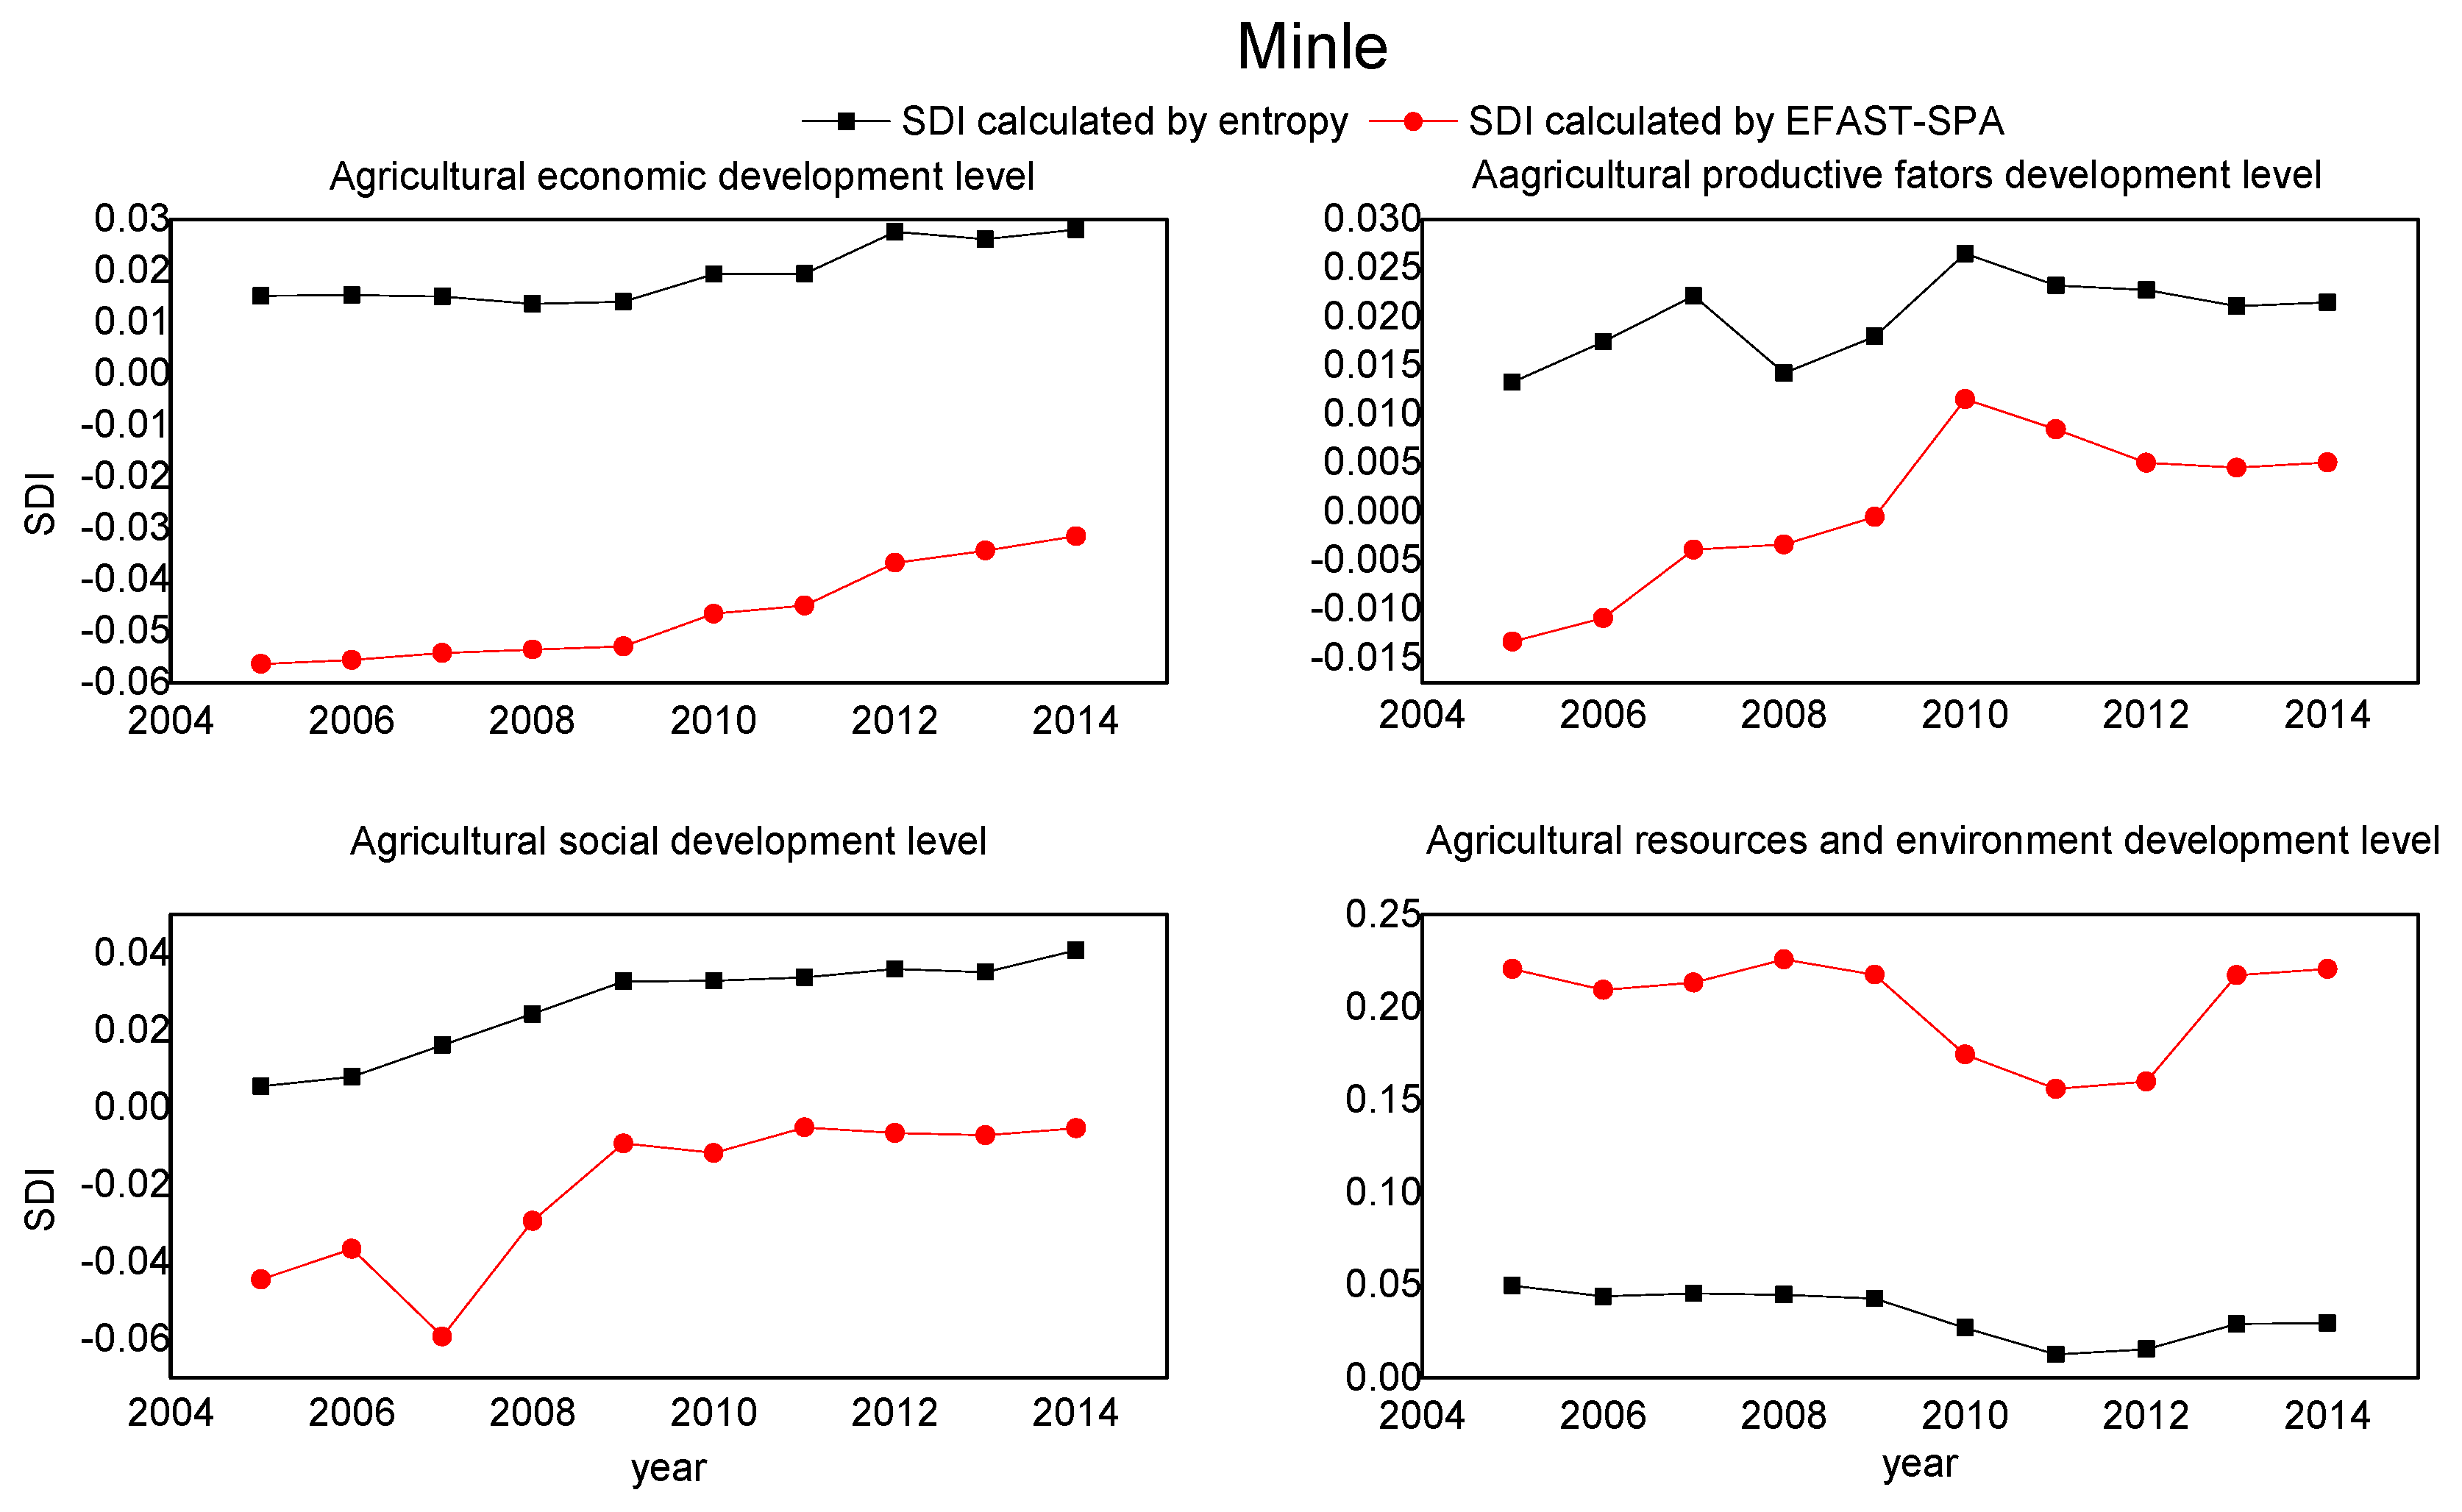
The purpose of setting subsystems is to analyze the balance degree of a sustainable development level from a micro-scale. This paper analyzed the four subsystems in each county and found various problems in different counties. Therein, the unbalanced development pace of the subsystems was a common defect among all of these six counties. Due to the results calculated by entropy, EFAST-SPA showed the similar trend. Only the EFAST-SPA results would be analyzed in this section. The following analyses would reveal the major problems in each county and these problems can guide the decision-maker to make more reasonable decisions [61].
The most serious problem in Ganzhou was the agricultural social subsystem, because this subsystem developed weakly, while the other three subsystems developed well during the research period. Especially the agricultural sources and environment section, the SDI of this subsystem in 2014 was approximately 2.4 times what it was in 2010. The agricultural social subsystem also developed a bit more slowly than other subsystems in Minle. However, when it was compared with other counties, the other three subsystems improved at a slow speed, too. The unbalance trend occurred in Gaotai in the first half of the research period, but the development pace was becoming more balanced between 2010 and 2014. The agricultural and social section was the only subsystem which improved significantly during 2005–2011. However, its SDI showed a bit of a decrease during 2012–2014. Moreover, the SDI of the rest of the subsystems nearly remained the same over the entire ten year period. The agricultural resources and environment in Sunan decreased distinctly when compared with the rest subsystems. It obvious that high-speed development was obtained at the cost of excess resource exploitation. The agricultural productive factors subsystem was the only low-speed development section in Linze. Thus, the mechanization of agriculture could be an efficient solution to improve the sustainable development level in this area. Overall, the information deduced from the evaluation can offer a clear understanding of the development problems the counties faced. This deeper understanding could help the decision-makers to regulate a more targeted ordinance to solve the specific problems.

4.3. Analysis of EFAST-SPA Sustainable Development Levels

Positive analysis demonstrated that the EFAST-SPA results were in line with the authentic development status in most cases. Besides, the span of CDI calculated by EFAST-SPA was wider than that calculated by entropy, which indicated that the EFAST-SPA can evaluate the agricultural sustainable development level more fully. This advantage could offer more detained information which the decision-maker needs. The following analysis was based on the EFAST-SPA evaluation results.
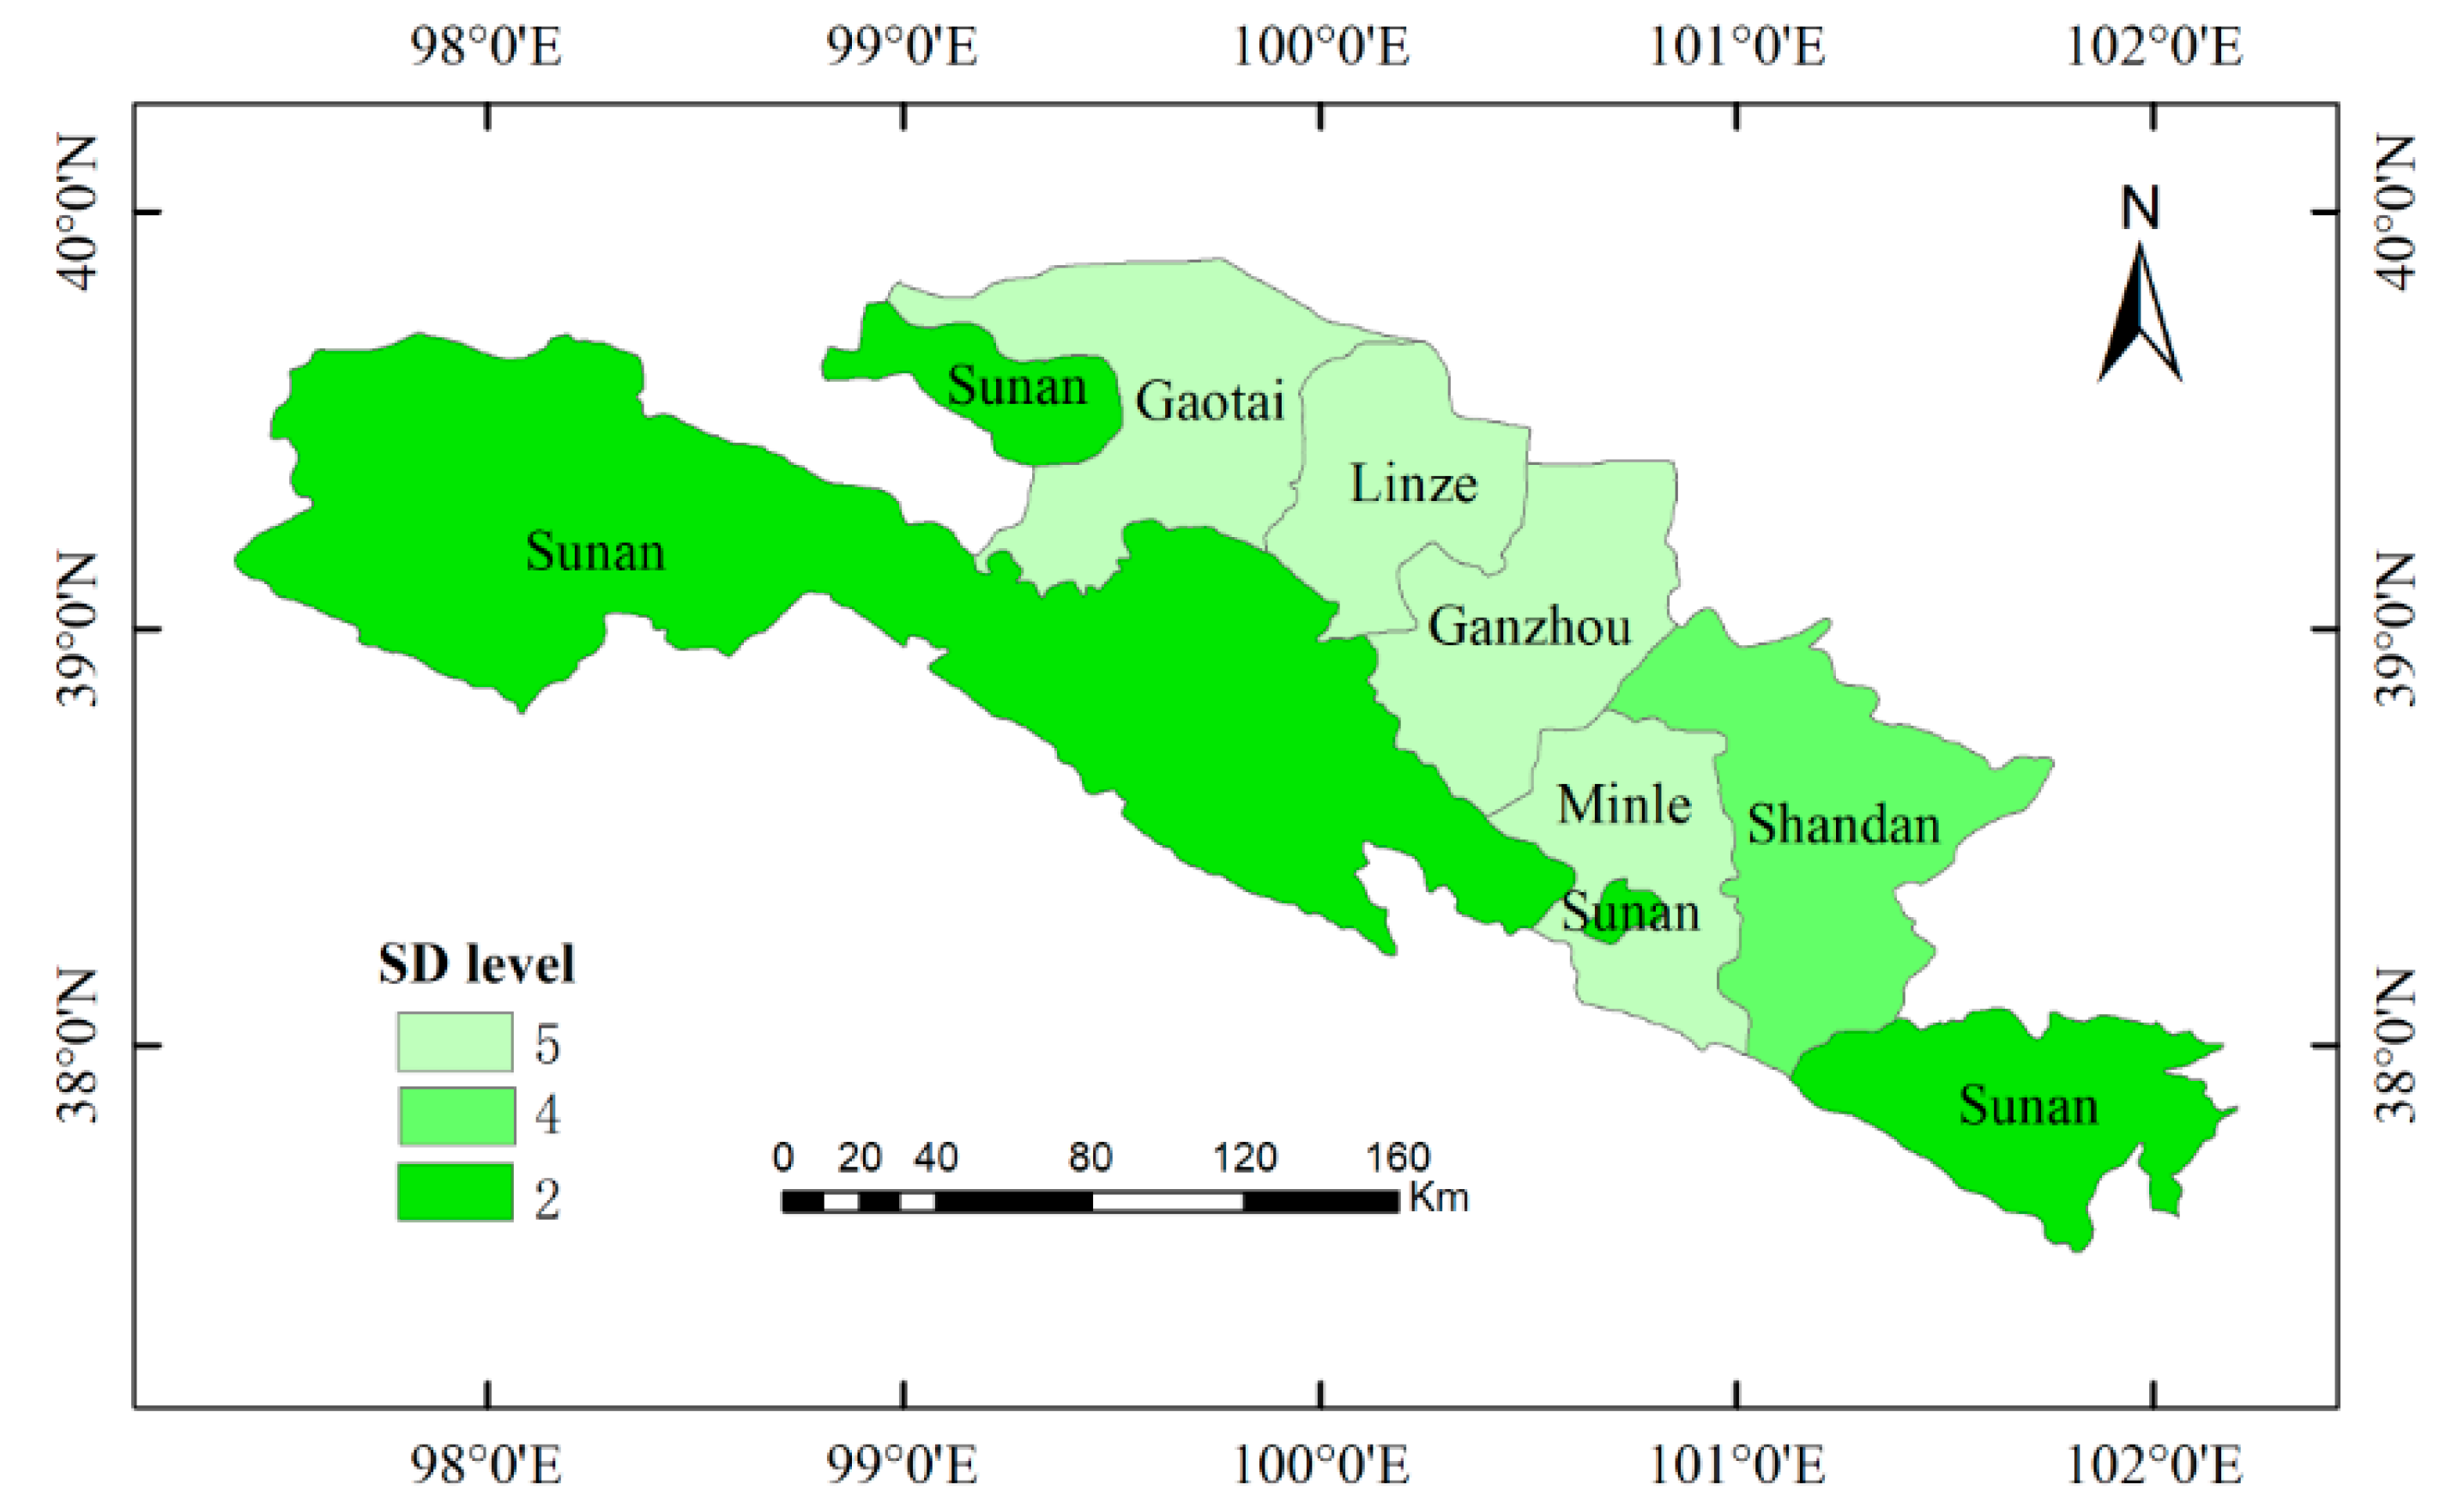
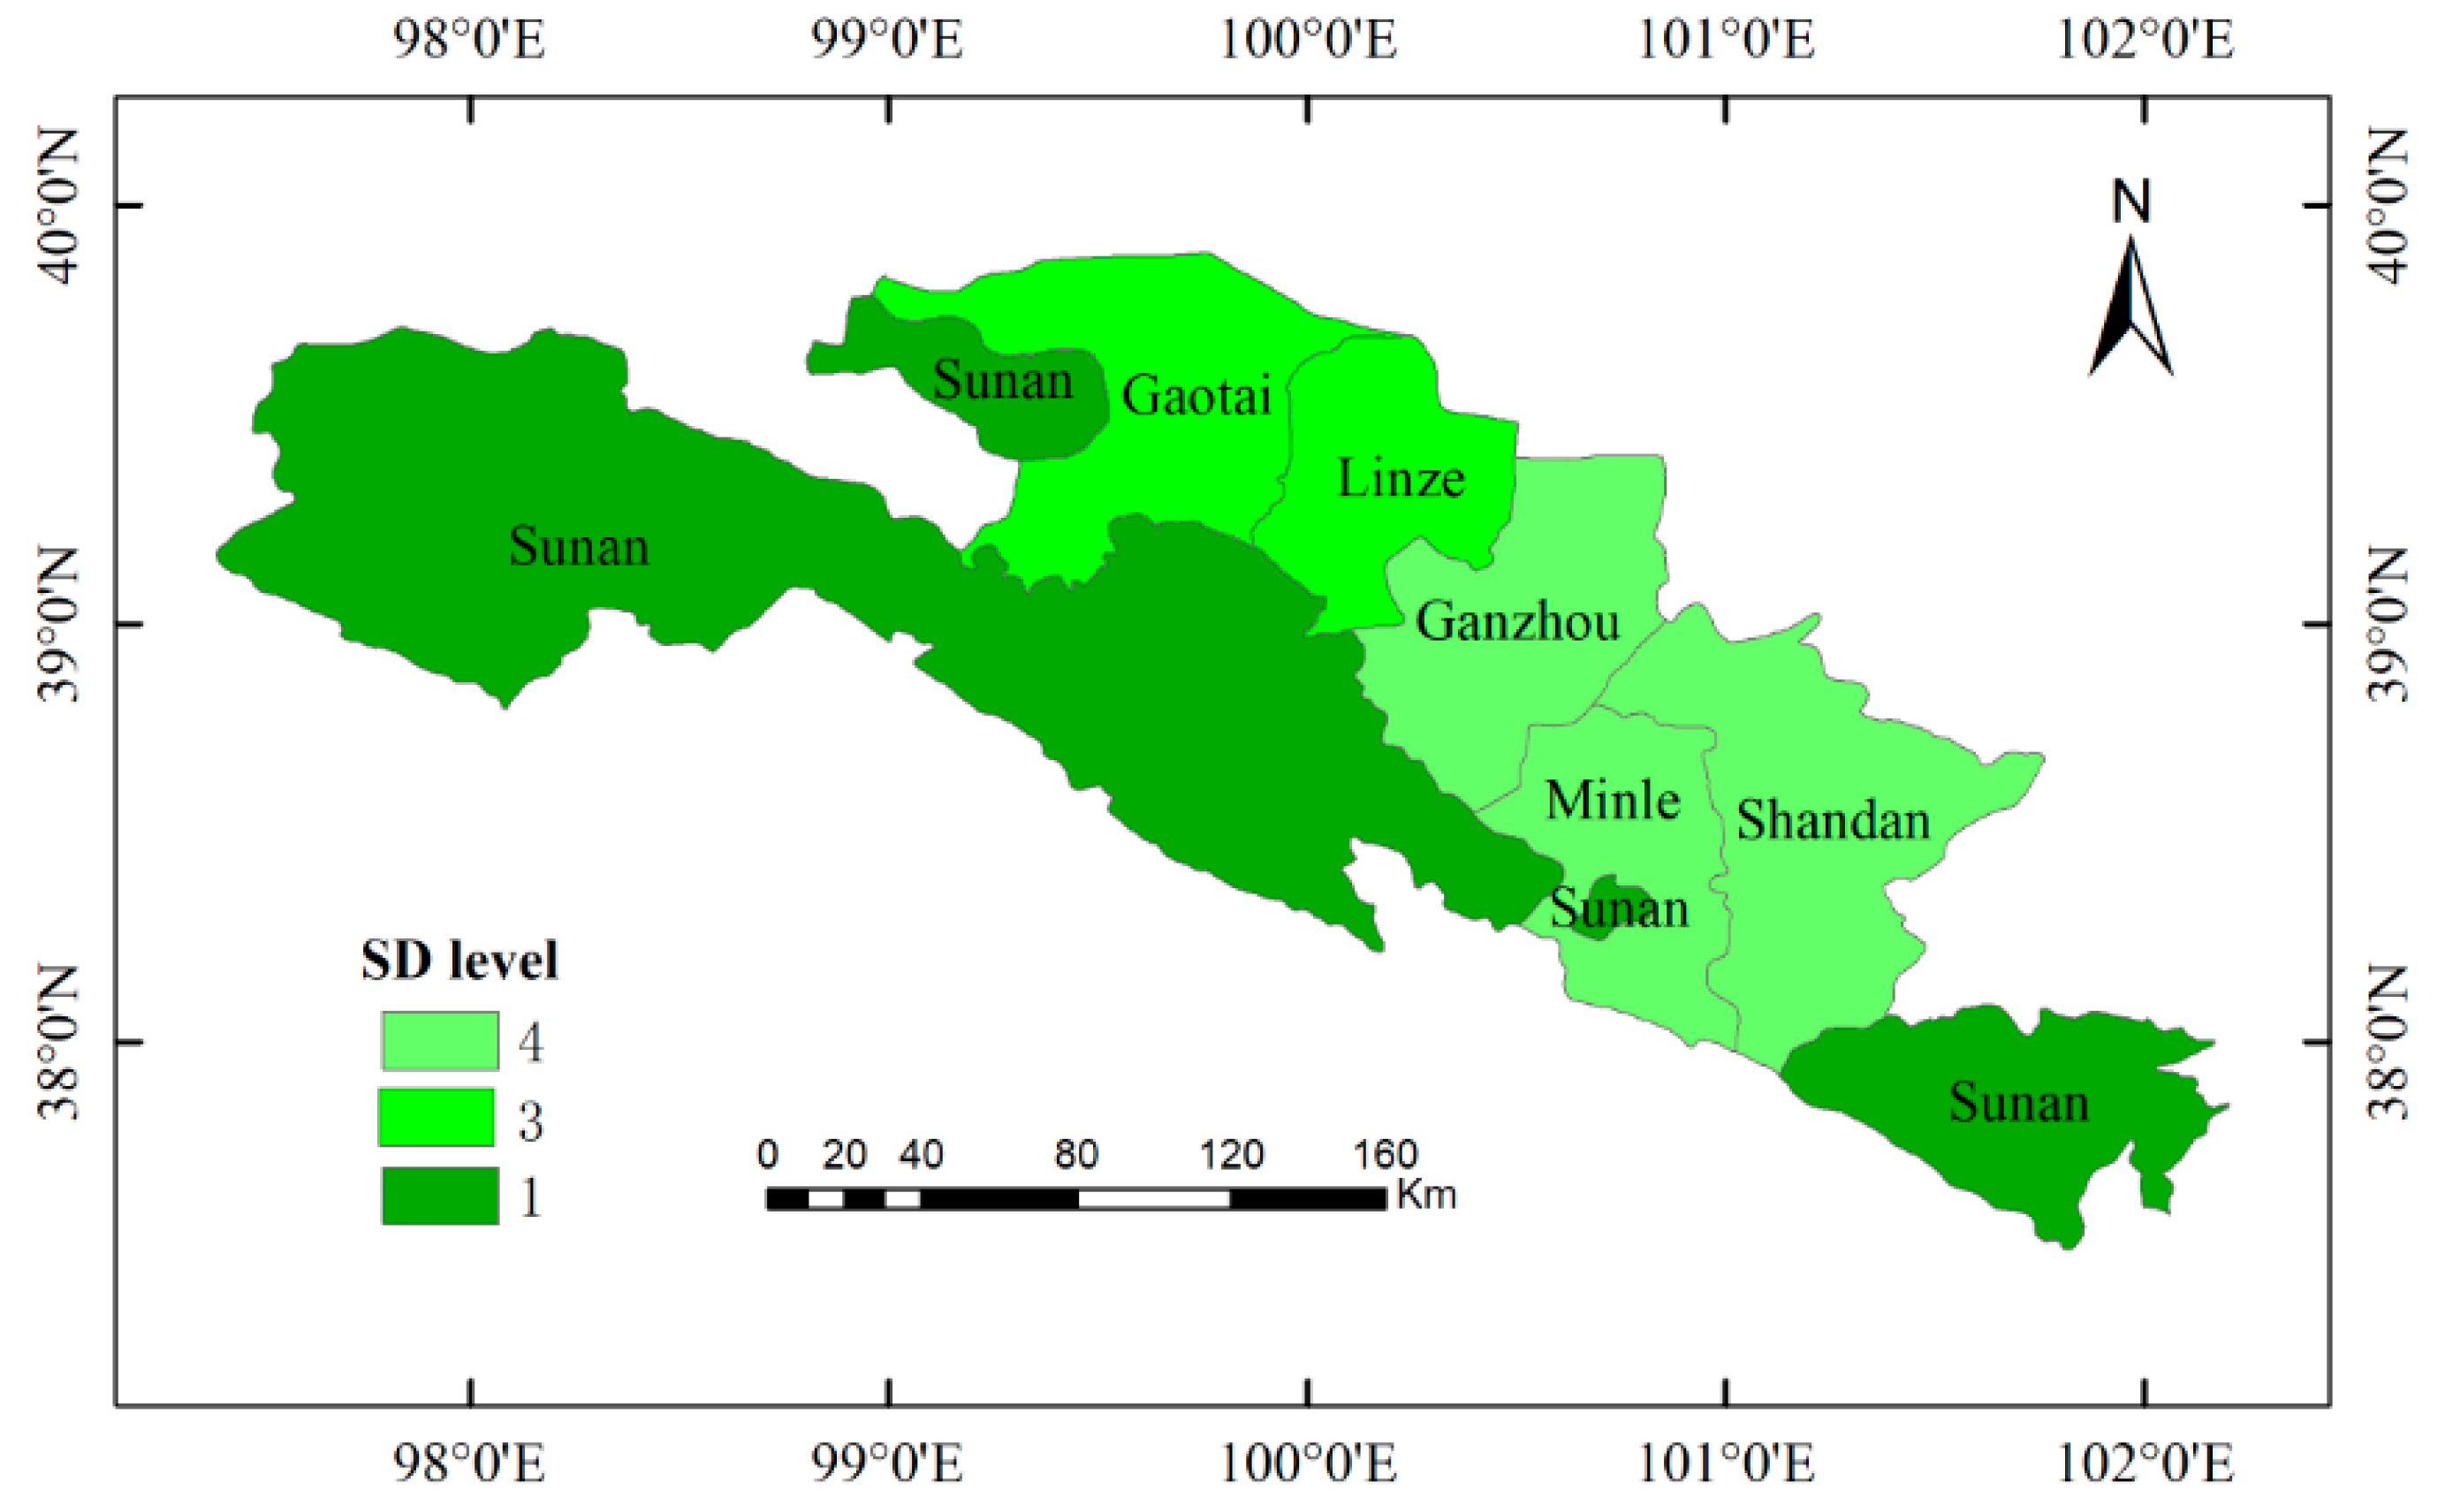
The sustainable development levels in Sunan retained a good development status during the entire research period. However, the status of Shandan was changing between weak sustainable and basic sustainable. Besides, Linze and Gaotai kept the same development pace and both of them have been improved to basic sustainable from unsustainable. Additionally, these two counties experienced the greatest improvement among all of the six counties. The counties Ganzhou and Minle still remained in the weak sustainable status at 2014; they were the areas who needed a better improvement urgently.
From the perspective of spatial analysis, we can find that the status could be better if the county was located further from Ganzhou. Two reasons could be used to explain that result. Firstly, Ganzhou is the central area of economy, politics, and culture. The pursuit of economy improvement may have been a bit excessive during the research period, and that probably lead a bad impact on the local ecology and environment. Sustainable development is a comprehensive concept which considers not only the economy but also includes the ecology and environment. Thus, the worsening condition of ecology and environment will cause a low sustainable development level. The development style of Ganzhou will also influence the nearby counties the most. Secondly, natural conditions are another factor which can affect agricultural development. The altitude in Sunan ranges from 1700–5565 m, which is the highest in all of the six counties. This high elevation has reduced human activity in this area. Less population will bring less impact on the environment and ecology. Besides, the small population also contributes to improve per capita resources and economic growth. In conclusion, reducing the intensity of human activities will benefit the agricultural sustainable development.

4.4. Challenges of EFST-SPA Evaluation Method for Future Research

Although the EFAST-SPA method can identify the sustainable development status successfully. The evaluation process can be further improved from the following perspectives. Firstly, the evaluation system we constructed was on the basis of our research experiences and some indices were removed because of data unavailability. So, an improvement in this system would make it more representative and drive the evaluation result more authentic. Secondly, for convenient calculation purposes, the uncertainty coefficients in the SPA model were simplified by dividing them at equal intervals. Even though this is a common conduction, we still assume that improved uncertainty coefficients can offer more accurate results. Thirdly, there is no standard level boundary of the indices to follow because the standard boundaries are various in different study areas. Thus, the standard boundary we proposed is only appropriate for our research. Defining a universal standard boundary of the evaluation indices is a challenging topic for the further research.

5. Conclusions

In this research, two uncertainty analysis methods (EFAST and SPA) were integrated to evaluate the agricultural sustainable development level in the middle reaches of the Heihe River Basin in consideration of the uncertain relationships among the indices and the dynamic development process. The final result of sustainable development level during 2005–1014 was Sunan > Shandan > Gaotai > Linze > Minle > Ganzhou. This result was in nearly complete accordance with that of the traditional entropy method. The similar result can verify the feasibility of the EFAST-SPA method. More importantly, the method we proposed can describe the development patterns more completely than the entropy method, which indicated that our method can grasp the microchanges of the dynamic development. Besides, the positive analysis which was used to verify the accuracy of our results also proved that our evaluation was in line with the local actual development level in most cases. Thus, our result can be regarded as an accurate evaluation under the index system in this research. Meanwhile, the accuracy of this result also reversely verified the reasonability of the weights assigned by our proposed method. In conclusion, the EFAST-SPA technique can provide objective and reasonable weight for the indices via a more comprehensive technique, it also can offer a quantitative and accurate evaluation for the sustainable development evaluation in the view of uncertainty analysis. Thus, we believe that the EFAST-SPA method can be applied as a feasible and reliable method for sustainable development evaluation research.

Author Contributions

W.L. processed the data and wrote the manuscript. X.L. inspired the main idea. L.L., X.L. and C.M. contributed to editing the manuscript and gave many useful suggestions. All authors have contributed to the writing and revising of the paper.

Funding

This research was funded by the National Natural Science Foundation of China (grant No. 91425303 & 41730642), the 13th Five-year Informatization Plan of Chinese Academy of Sciences (Grant No. XXH13505-06), and the Technology Service Network Initiative Project of the Chinese Academy of Sciences.

Acknowledgments

Supports from the National Natural Science Foundation of China and Chinese Academy of Sciences are gratefully acknowledged.

Conflicts of Interest

The authors declare no conflicts of interest.

References

  1. Clark, W.C.; Dickson, N.M. Sustainability science: The emerging research program. Proc. Natl. Acad. Sci. USA 2003, 100, 8059–8061. [Google Scholar] [CrossRef] [PubMed] [Green Version]
  2. Wu, J.G.; Guo, X.C.; Yang, J.; Qian, G.X.; Niu, J.M.; Liang, C.Z.; Zhang, Q.; Li, A. What is sustainability science? J. Appl. Ecol. 2014, 25, 1–11. [Google Scholar]
  3. Lu, D.D. Theoretical studies of man-land system as the core of geographical science. Geogr. Res. 2002, 21, 135–145. [Google Scholar]
  4. Brandenburg, M.; Govindan, K.; Sarkis, J.; Seuring, S. Quantitative models for sustainable supply chain management: Developments and directions. Eur. J. Oper. Res. 2014, 233, 299–312. [Google Scholar] [CrossRef]
  5. Scrieciu, S.S. The inherent dangers of using computable general equilibrium models as a single integrated modelling framework for sustainability impact assessment: A critical note on böhringer and löschel. Ecol. Econ. 2007, 60, 678–684. [Google Scholar] [CrossRef]
  6. Huppes, G.; Ishikawa, M. Sustainability evaluation: Diverging routes recombined? Tasks for a new working group on modelling and evaluation for sustainability. J. Clean. Prod. 2007, 15, 1183–1184. [Google Scholar] [CrossRef]
  7. Wang, Z.G.; Luo, Y.Z.; Zhang, M.H.; Jun, X. Quantitative evaluation of sustainable development and eco-environmental carrying capacity in water-deficient regions: A case study in the Haihe River Basin, China. J. Integr. Agric. 2014, 13, 195–206. [Google Scholar] [CrossRef]
  8. Zhang, J.P.; Qin, Y.C. Review on quantitative research methods of regional sustainable development in china. Chin. J. Popul. Resour. Environ. 2010, 8, 44–53. [Google Scholar]
  9. Zhang, J.P.; Qin, Y.C. Quantitative study methods of regional sustainable development in China: A review. Acta Ecol. Sin. 2009, 29, 6702–6711. [Google Scholar]
  10. Nautiyal, S.; Kaechele, H.; Zander, P.; Rao, K.S. Socioeconomic and Ecological Modeling for Sustainable Landscape Management in Indian Himalayan Perspective; Springer: Cham, Switzerland, 2016; pp. 597–628. [Google Scholar]
  11. Bray, F.; Jemal, A.; Grey, N.; Ferlay, J.; Forman, D. Global cancer transitions according to the human development index (2008–2030): A population-based study. Lancet Oncol. 2012, 13, 790–801. [Google Scholar] [CrossRef]
  12. Albino, V.; Kühtz, S. Enterprise input–output model for local sustainable development—The case of a tiles manufacturer in italy. Resour. Conserv. Recycl. 2004, 41, 165–176. [Google Scholar] [CrossRef]
  13. Xu, Z.M.; Zhang, Z.Q.; Cheng, G.D. Ecological footprint calculation and development capacity analysis of china in 1999. J. Appl. Ecol. 2003, 14, 280–285. [Google Scholar]
  14. Siche, R.; Pereira, L.; Agostinho, F.; Ortega, E. Convergence of ecological footprint and emergy analysis as a sustainability indicator of countries: Peru as case study. Commun. Nonlinear Sci. Numer. Simul. 2010, 15, 3182–3192. [Google Scholar] [CrossRef]
  15. Camus, S.; Hikkerova, L.; Sahut, J.M. Systemic analysis and model of sustainable tourism. Int. J. Bus. 2012, 17, 365. [Google Scholar]
  16. Daniel, G.; Mihaela, A.; Miron, Z. Analysis of sustainable development using fuzzy logic prediction models and artifical neural networks. Manag. Strateg. J. 2016, 31, 204–218. [Google Scholar]
  17. Bułat, R.; Popławski, Ł. Sustainable development of rural communities in poland—An attempt to apply genetic algorithms and expert systems in decision making process. Contemp. Issues Bus. Manag. Educ. 2017. [Google Scholar] [CrossRef]
  18. Wang, Y.; Wu, P.; Zhao, X.; Jin, J. Projection pursuit evaluation model: Optimizing scheme of crop planning for agricultural sustainable development and soil resources utilization. Clean Soil Air Water 2012, 40, 592–598. [Google Scholar] [CrossRef]
  19. Okwuashi, O.; Mcconchie, J.; Nwilo, P.; Isong, M. Predicting future land use change using support vector machine based gis cellular automata: A case of lagos, nigeria. J. Sustain. Dev. 2012, 5, 132–139. [Google Scholar] [CrossRef]
  20. Sala, S.; Ciuffo, B.; Nijkamp, P. A systemic framework for sustainability assessment. Ecol. Econ. 2015, 119, 314–325. [Google Scholar] [CrossRef]
  21. Reidsma, P.; König, H.; Feng, S.; Bezlepkina, I.; Nesheim, I.; Bonin, M.; Sghaier, M.; Purushothaman, S.; Sieber, S.; van Ittersum, M.K.; et al. Methods and tools for integrated assessment of land use policies on sustainable development in developing countries. Land Use Policy 2011, 28, 604–617. [Google Scholar] [CrossRef]
  22. Munda, G. Multiple criteria decision analysis and sustainable development. In Multiple Criteria Decision Analysis: State of the Art Surveys; Springer: New York, NY, USA, 2005; pp. 953–986. [Google Scholar]
  23. Singh, R.K.; Murty, H.R.; Gupta, S.K.; Dikshit, A.K. An overview of sustainability assessment methodologies. Ecol. Indic. 2009, 9, 189–212. [Google Scholar] [CrossRef]
  24. Cropper, W.H. Rudolf clausius and the road to entropy. Am. J. Phys. 1986, 54, 1068–1074. [Google Scholar] [CrossRef]
  25. Saaty, T.L.; Vargas, L.G. How to make a decision. In Models, Methods, Concepts & Applications of the Analytic Hierarchy Process; Springer: New York, NY, USA, 2012; pp. 1–21. [Google Scholar]
  26. Qiao, J.J. Application of improved entropy method in henan sustainable development evaluation. Resour. Sci. 2004, 26, 113–119. [Google Scholar]
  27. Guo, X.G. Application of improved entropy method in evaluation of economic result. Syst. Eng. Theory Pract. 1998, 12, 98–102. [Google Scholar]
  28. Zadeh, L.A. Toward a theory of fuzzy information granulation and its centrality in human reasoning and fuzzy logic. Fuzzy Sets Syst. 1997, 90, 111–127. [Google Scholar] [CrossRef]
  29. Saltelli, A.; Tarantola, S.; Chan, K. Global sensitivity analysis of model output a quantitative model-independent method for global sensitivity analysis of model output. Technometrics 1999, 41, 39–56. [Google Scholar] [CrossRef]
  30. Zhao, K.Q. Set pair analysis and its prelimiary application. Explor. Nat. 1994, 13, 67–72. [Google Scholar]
  31. Luan, W.F.; Lu, L.; Li, X.; Ma, C.F. Weight determination of sustainable development indicators using a global sensitivity analysis method. Sustainability 2017, 9, 303. [Google Scholar] [CrossRef]
  32. Ma, C.F.; Li, X.; Wang, S.G. A global sensitivity analysis of soil parameters associated with backscattering using the advanced integral equation model. IEEE Trans. Geosci. Remote 2015, 53, 5613–5623. [Google Scholar]
  33. Ma, C.; Li, X.; Wang, J.; Wang, C.; Duan, Q.; Wang, W. A comprehensive evaluation of microwave emissivity and brightness temperature sensitivities to soil parameters using qualitative and quantitative sensitivity analyses. IEEE Trans. Geosci. Remote Sens. 2016, 55, 1025–1038. [Google Scholar] [CrossRef]
  34. Wang, J.; Li, X.; Lu, L.; Fang, F. Parameter sensitivity analysis of crop growth models based on the extended fourier amplitude sensitivity test method. Environ. Model. Softw. 2013, 48, 171–182. [Google Scholar] [CrossRef]
  35. Su, M.; Yang, Z.F.; Chen, B. Set pair analysis for urban ecosystem health assessment. Commun. Nonlinear Sci. Numer. Simul. 2009, 14, 1773–1780. [Google Scholar] [CrossRef]
  36. Wang, W.; Jin, J.; Ding, J.; Li, Y. A new approach to water resources system assessment—Set pair analysis method. Sci. China Ser. E Technol. Sci. 2009, 52, 3017–3023. [Google Scholar] [CrossRef]
  37. Jayaraman, P.; Whittle, J.; Elkhodary, A.M.; Gomaa, H. In Model composition in product lines and feature interaction detection using critical pair analysis. Model Driven Eng. Lang. Syst. 2007, 38, 151–165. [Google Scholar]
  38. Li, X.; Lu, L.; Cheng, G.D.; Xiao, H. Quantifying landscape structure of the heihe river basin, north-west china using fragstats. J. Arid Environ. 2001, 48, 521–535. [Google Scholar] [CrossRef]
  39. Cheng, G.D.; Li, X. Integrated research methods in watershed science. Sci. China Earth Sci. 2015, 58, 1159–1168. [Google Scholar] [CrossRef]
  40. Ge, Y.C.; Li, X.; Huang, C.L.; Nan, Z.T. A decision support system for irrigation water allocation along the middle reaches of the heihe river basin, northwest china. Environ. Model. Softw. 2013, 47, 182–192. [Google Scholar] [CrossRef]
  41. Cheng, G.D.; Li, X.; Zhao, W.; Xu, Z.; Feng, Q.; Xiao, S.; Xiao, H. Integrated study of the water-ecosystem-economy in the heihe river basin. Natl. Sci. Rev. 2014, 1, 413–428. [Google Scholar] [CrossRef]
  42. Chen, Y.; Zhang, D.; Sun, Y.; Liu, X.; Wang, N.; Savenije, H.H. Water demand management: A case study of the Heihe River Basin in China. Phys. Chem. Earth Parts A/B/C 2005, 30, 408–419. [Google Scholar] [CrossRef]
  43. Feng, Q.; Cheng, G.D.; Endo, K.N. Towards sustainable development of the environmentally degraded river heihe basin, china. Hydrol. Sci. J. 2001, 46, 647–658. [Google Scholar] [CrossRef]
  44. Cheng, G.D. Study on the sustainable development in heihe river watershed from the view of ecological economics. J. Glaciol. Geocryol. 2002, 24, 335–343. [Google Scholar]
  45. Li, X.; Cheng, G.D.; Lin, H.; Cai, X.M.; Fang, M.; Ge, Y.C.; Hu, X.; Chen, M.; Li, W. Watershed system model: The essentials to model complex human-nature system at the river basin scale. J. Geophys. Res. Atmos. 2018, 123, 3019–3034. [Google Scholar] [CrossRef]
  46. Cash, D.W.; Clark, W.C.; Alcock, F.; Dickson, N.M.; Eckley, N.; Guston, D.H.; Jäger, J.; Mitchell, R.B. Knowledge systems for sustainable development. Proc. Natl. Acad. Sci. USA 2003, 100, 8086–8091. [Google Scholar] [CrossRef] [PubMed] [Green Version]
  47. United Nations Development Programme (UNDP). Transforming Our World: The 2030 Agenda for Sustainable Development. Available online: https://sustainabledevelopment.un.org/post2015/transformingourworld/ (accessed on 25 September 2015).[Green Version]
  48. Ji, X.B.; Kang, E.; Chen, R.; Zhao, W.Z.; Xiao, S.C.; Jin, B.W. Analysis of water resources supply and demand and security of water resources development in irrigation regions of the middle reaches of the heihe river basin, northwest china. Agric. Sci. China 2006, 5, 130–140. [Google Scholar] [CrossRef]
  49. Qi, S.; Wang, T.; Luo, F. Land desertification and sustainable development in heihe river basin, northwestern china. Res. Soil Water Conserv. 2004, 11, 94–96. [Google Scholar]
  50. Fang, C.L.; Bao, C. The coupling model of water-ecology-economy coordinated development and its application in heihe river basin. Acta Geogr. Sin. 2004, 59, 781–790. [Google Scholar]
  51. Zhen, L.; Routray, J.K. Operational indicators for measuring agricultural sustainability in developing countries. Environ. Manag. 2003, 32, 34–46. [Google Scholar] [CrossRef] [PubMed]
  52. Qiu, H.J.; Zhu, W.B.; Wang, H.B.; Cheng, X. Analysis and design of agricultural sustainability indicators system. Agric. Sci. China 2007, 6, 475–486. [Google Scholar] [CrossRef]
  53. Bockstaller, C.; Guichard, L.; Makowski, D.; Aveline, A.; Girardin, P.; Plantureux, S. Agri-environmental indicators to assess cropping and farming systems: A review. In Sustainable Agriculture; Springer: Dordrecht, The Netherlands, 2009; pp. 725–738. [Google Scholar]
  54. Hayati, D.; Ranjbar, Z.; Karami, E. Measuring Agricultural Sustainability in Biodiversity, Biofuels, Agroforestry and Conservation Agriculture; Springer: Dordrecht, The Netherlands, 2011; pp. 73–100. [Google Scholar]
  55. Zeng, Y.; Xie, Z.; Yu, Y.; Liu, S.; Wang, L.; Jia, B.; Qin, P.; Chen, Y. Ecohydrological effects of stream-aquifer water interaction: A case study of the heihe river basin, northwestern china. Hydrol. Earth Syst. Sci. 2016, 20, 2333–2352. [Google Scholar] [CrossRef]
  56. Zeng, Y.; Xie, Z.; Yu, Y.; Liu, S.; Wang, L.; Zou, J.; Qin, P.; Jia, B. Effects of anthropogenic water regulation and groundwater lateral flow on land processes. J. Adv. Model. Earth Syst. 2016, 8, 1106–1131. [Google Scholar] [CrossRef] [Green Version]
  57. Environmental Systems Research Institute (ESRI). ArcGIS Desktop Help 10.2 Geostatistical Analyst. Available online: http://resources.arcgis.com/en/help/main/10.2/index.html (accessed on 30 July 2013).
  58. Wang, J.J.; Jing, Y.Y.; Zhang, C.F.; Zhao, J.H. Review on multi-criteria decision analysis aid in sustainable energy decision-making. Renew. Sustain. Energy Rev. 2009, 13, 2263–2278. [Google Scholar] [CrossRef]
  59. Li, P.Y.; Qian, H.; Wu, J.H. Application of set pair analysis method based on entropy weight in groundwater quality assessment—A case study in Dongsheng City, Northwest China. E J. Chem. 2011, 8, 851–858. [Google Scholar]
  60. Yang, F.G.; Liang, Y.; Singh, V.P.; Wang, W.S.; Zhou, X.Q.; Liu, X.N.; Cao, S.Y.; Er, H.; Wu, Y.H. Debris flow hazard assessment using set pair analysis models: Take beichuan county as an example. J. Mt. Sci. 2014, 11, 1015–1022. [Google Scholar] [CrossRef]
  61. Pietrucha-Urbanik, K. Assessing the costs of losses incurred as a result of failure. In Dependability Engineering and Complex Systems; Springer: Cham, Switzerland, 2016; pp. 355–362. [Google Scholar]
Figure 1. Map of the middle reaches in Heihe river showing its six municipalities and corresponding population size, land cover, and major rivers.
Sustainability 10 02435 g001
Figure 2. Strategy for agriculture sustainable development evaluation using the EFAST-SPA method.
Sustainability 10 02435 g002
Figure 3. SIs of each index in Ganzhou. Legend: the sequence number is in accordance with Table 1.
Sustainability 10 02435 g003
Figure 4. Weights determined by entropy and EFSAT. (Legend: same as Figure 3).
Sustainability 10 02435 g004
Figure 5. SDI calculated by entropy and EFSAT-SPA in Ganzhou.
Sustainability 10 02435 g005
Figure 6. SDI calculated by entropy and EFSAT-SPA in Minle.
Sustainability 10 02435 g006
Figure 7. CDI calculated by entropy and EFSAT-SPA.
Sustainability 10 02435 g007
Figure 8. Sustainable development level classification of entropy and EFSAT-SPA.
Sustainability 10 02435 g008
Figure 9. The agricultural sustainable development level of the six counties in 2005.
Sustainability 10 02435 g009
Figure 10. The agricultural sustainable development level of the six counties in 2010.
Sustainability 10 02435 g010
Figure 11. The agricultural sustainable development level of the six counties in 2014.
Sustainability 10 02435 g011
Table 1. Evaluation system of agricultural sustainable development in the middle reaches of the Heihe River Basin.
SubsystemIndex
Agricultural development evaluation systemAgricultural economic development level1. Primary industry output per capita (yuan/person)
2. Second industry output per capita (yuan/person)
3. Third industry output per capita (yuan/person)
4. Crop input-output ratio (%)
5. Livestock input-output ratio (%)
Agricultural productive factors development level6. Meat share per capita (kg/person)
7. Grain share per capita (kg/person)
8. Net income per capita of farmers (yuan/mu)
9. Mechanical effective utilization factor (kw/mu)
10. Effective irrigation coefficient (%)
Agricultural social development level11. * Natural population growth rate (%)
12. * Agricultural population proportion (%)
13. Only-child family rate (%)
14. Hospital beds share per 104 populations (bed)
15. Tap water supply rate (%)
16. The proportion of agriculture technician among Rural labor (%)
17. Cultural and arts workers per 104 population (person)
Agricultural resources and environment development level18. Arable land per capita (mu)
19. * Chemical fertilizer application rate assuming 100% utilization (kg/mu)
20. * Pesticide use intensity (kg/mu)
21. * Plastic sheeting use (kg/mu)
22. * Agricultural disaster rate (%)
23. Closed forest area (104 mu)
24. Surface water irrigation (ton/mu)
25. * Groundwater irrigation (ton/mu)
26. * Water table (m)
Notes: mu is a unit of area, one mu is about 666.7 m2. The negative indexes are marked with “*”.
Table 2. Standard level of the evaluation system.
Level1234
Index
Primary industry output per capita (yuan/person)9584.87045.24505.61965.9
Second industry output per capita (yuan/person)44,09929,861.715,624.51387.2
Third industry output per capita (yuan/person)13,849.897975744.31691.6
Crop input-output ratio (%)11.58.24.91.6
Livestock input-output ratio (%)9.56.63.70.8
Meat share per capita (kg/person)238.1167.797.326.9
Grain share per capita (kg/person)1114815.7517.4219.1
Net income per capita of farmers (yuan/mu)6541.54528.62515.7502.8
Mechanical effective utilization factor (kw/mu)1.10.90.70.4
Effective irrigation coefficient (%)10.80.60.5
* Natural population growth rate (%)2.23.85.36.9
* Agricultural population proportion (%)0.60.70.80.9
Only-child family rate (%)28.920.411.93.5
Hospital beds share per 104 populations (bed)54.641.528.415.2
Tap water supply rate (%)10.80.60.4
The proportion of agriculture technician among Rural labor (%)0.120.080.040.002
Cultural and arts workers per 104 populations (person)11.484.61.2
Arable land per capita (mu)5.44.12.91.7
* Chemical fertilizer application rate assuming 100% utilization (kg/mu)8.526.344.261.9
* Pesticide use intensity (kg/mu)0.10.91.72.4
* Plastic sheeting use (kg/mu)02.75.38
* Agricultural disaster rate (%)00.30.60.9
Closed forest area (104 mu)18.712.56.20
Surface water irrigation (ton/mu)2.31.60.80.1
* Groundwater irrigation (ton/mu)00.20.40.6
* Water table (m)29.656.383109.7
Notes: The negative indexes are marked with “*”.
Table 3. The classification of the agricultural sustainable development level in Heihe middle reaches.
Level12345
Range L 1 > 2 ( M + S t d ) M + S t d < L 2 < 2 ( M + S t d ) M < L 3 < M + S t d M S t d < L 4 < M 0 < L 5 < M S t d
Notes: M and S t d are the mean and standard deviation of sustainable development index, respectively. L i represents the i t h level.
Table 4. The dispersed degree of weights in the six counties.
DDGanzhouGaotaiMinleShandanSunanLinze
Method
Entropy0.0030.00280.00230.00250.00350.0041
EFAST0.00550.00560.00370.0050.00490.0071
Abbreviation: DD: Dispersed Degree.
Table 5. The 2005–2006 and 2012–2013 index value in Ganzhou.
Year2005200620122013
Index
12778.492883.915765.935569.97
23191.473845.426327.446283.65
34027.194582.189426.4611,375.79
43.312.132.371.79
51.951.630.851.02
694.4399.8968.7967.43
7622.04604.79711.41708.28
82444.622563.914713.245230.17
90.690.720.740.74
100.890.900.930.90
*114.745.095.145.15
* 120.640.640.640.65
1315.6416.5817.0917.09
1423.9825.6331.0228.83
150.930.961.000.99
160.030.020.020.02
172.112.092.031.97
181.891.872.041.95
* 1942.9743.6940.0643.47
* 200.710.730.610.59
* 216.246.347.985.01
* 220.000.040.000.00
231.680.862.500.55
240.120.120.120.10
* 250.390.380.450.28
* 2629.629.629.629.6
Notes: the number of index is consistent with Table 2.
Table 6. The 2006–2008 index value in Minle.
Year200620072008
Index
12335.762714.232960.06
21727.112086.572618.07
31934.192159.982457.94
43.253.222.91
54.353.973.80
658.5659.0747.33
7893.95948.89984.89
8949.931107.131185.31
90.420.430.46
100.730.730.73
* 112.245.194.71
* 120.870.870.87
138.359.4910.59
1419.5319.5419.88
150.970.980.99
160.0010.0010.001
171.191.761.89
184.284.234.23
* 1919.8720.5121.32
* 200.140.140.14
* 210.200.220.21
* 220.230.170.02
237.818.299.18
240.190.200.22
* 250.00010.00010.0002
* 2647.447.447.4
Notes: the number of index is consistent with Table 2.
Table 7. The 2012 and 2013 index value in Shandan.
Year20122013
Index
13458.933414.93
25500.695503.05
36408.027175.63
44.173.78
51.121.04
632.4831.95
7747.67735.69
81116.751189.15
90.560.53
100.590.57
* 116.096.01
* 120.690.70
1328.5928.59
1422.4622.22
150.930.93
160.010.01
172.032.50
184.604.34
* 1913.2213.66
* 200.350.35
* 211.551.45
* 220.040.29
2317.1314.18
240.140.22
* 250.00020.0003
* 2645.245.2
Notes: the number of index is consistent with Table 2.

