
Catalytic Activity Prediction of α-Diimino Nickel Precatalysts toward Ethylene Polymerization by Machine Learning


1
Key Laboratory of Engineering Plastics and Beijing National Laboratory for Molecular Science, Institute of Chemistry, Chinese Academy of Sciences, Beijing 100190, China
2
University of Chinese Academy of Sciences, Beijing 100049, China
3
PetroChina Petrochemical Research Institute, Beijing 102206, China
*
Authors to whom correspondence should be addressed.
Catalysts 2024, 14(3), 195; https://doi.org/10.3390/catal14030195
Submission received: 30 January 2024
/
Revised: 29 February 2024
/
Accepted: 12 March 2024
/
Published: 16 March 2024
(This article belongs to the Section Catalysis in Organic and Polymer Chemistry)
Abstract
:The present study explored machine learning methods to predict the catalytic activities of a dataset of 165 α-diimino nickel complexes in ethylene polymerization. Using 25 descriptors as the inputs, the XGBoost model presented the optimal performance among six different algorithms (R2 = 0.999, Rt2 = 0.921, Q2 = 0.561). The results of the analysis indicate that high activity is related to the presence of polarizable atoms and less bulky substituents within the N-aryl group. This approach offers valuable insights on the variation principle of catalytic activity as a function of complex structure, helping to effectively design and optimize α-diimino Ni catalysts with desirable performance.
1. Introduction
Polyethylenes are the most prevalent polymeric materials, with extensive applications as plastics, lubricants, and a variety of fine chemicals [1]. In the past two decades, late-transition metal complexes have attracted great attention in homogeneous ethylene polymerization, primarily driven by Brookhart’s discovery of α-diimino precatalysts [2]. Among the many types of α-diimino systems, nickel-type α-diimino complex precatalysts have garnered substantial attention in the field of ethylene polymerization because of their ability to produce polyethylenes with a highly branched structure [3], elastomeric-type properties [4], and improved catalytic activities [5]. Undoubtedly, many efforts have been made to enhance the catalytic performance of Ni complexes by modifying ligand substituents, introducing alternative ligands [6,7], and making precise adjustments to ligand frameworks [8,9,10], but the underlying mechanism for improved catalytic performance is still not fully understood.
Computational chemistry, especially density functional theory (DFT) calculations, could provide reaction mechanisms at the molecular level [11]. However, these calculations are computationally expensive, resource-intensive, and require different levels of functionals and basis sets. Therefore, data-driven approaches are gaining popularity day by day. In recent years, machine learning (ML) methods have become essential tools for scientific research in many fields and also offer new ways to develop chemical catalysts and predict their performances [12,13]. ML-based predictive modeling also plays an increasingly important role in the search for novel transition metal complexes [14]. This enhanced approach has demonstrated its effectiveness as a robust tool for predicting material properties [15]. However, compared to other fields, the application of ML methods for homogenous polyethylene catalysis is still under development.
Previously, the catalytic activities of various Ni complex systems have been investigated through multiple linear regression analysis (MLRA) which is the simplest ML algorithm. For instance, the MLRA technique has been employed to investigate the differences in catalytic activity between two series of 2-imino-1,10-phenanthrolinyl metal complexes [16]. Moreover, to enhance the predictive accuracy of analogs, additional descriptors are taken into account. By exploring the optimal combinations of descriptors, the behavior of Ni complexes with carbocyclic fused pyridineimine ligands is effectively predicted using a combination of electronic and steric descriptors [17]. Subsequently, the catalytic activities of bisiminoacenaphthylnickel complexes were well predicted to study the influence of coordinated halogen atoms on catalytic performance. The results revealed that the electronic effect plays a predominant role in the Ni-Br system, whereas, in the case of the Ni-Cl system, steric considerations have emerged as the dominant influencing factor [18].
In addition, the catalytic activities were further examined using a dataset of 58 bis(imino)pyridyl metal complexes by the two-dimensional quantitative structure–property relationship (2D-QSPR). The findings showed that the bulky phenyl ring substituents and the net charges on the core metal and N atoms were favorable for the catalytic activity [19]. Subsequently, 2D- and 3D-QSPR were employed to examine the different catalytic performances of cycloalkyl-fused aryliminopyridyl nickel complexes, and the 3D contour maps depicted that smaller sizes of cycloalkyl-fused rings favored catalytic activity while hindering an increase in molecular weight [20].
Nonlinear methods are crucial due to their ability to capture complex relationships and provide superior modeling accuracy compared to linear approaches. Nevertheless, the applications of nonlinear ML methods are relatively rare in transition metal ethylene polymerization catalysis due to the lack of a big dataset. Recently, relatively large datasets of transition metal complexes were built to predict the catalytic activity using different ML algorithms. These studies investigated the influence of structural factors on the catalytic activities of complexes, exploring the effects of bulky substitutions, number of atoms [21], charge distributions, and the significance of conjugated bond structures [22].
Herein, this study aims to predict the catalytic activities of a relatively big dataset of 165 α-diimino nickel complexes in ethylene polymerization. By employing six different nonlinear ML methods, the XGBoost model was found as the best-performing model, with predictive power correlation coefficient (R2) values of 0.999 for the training set and 0.921 for the external test set, and a validation power cross-validation coefficient (Q2) value of 0.561. Based on the analysis of the descriptor, the model indicates that the catalytic activity for the Ni complexes is highly related to polarizable atoms and bulkiness within the complex molecule.
2. Results and Discussions
The dataset of 165 α-diimino Ni complexes was chosen from previous experimental reports [4,5,6,7,8,9,10,23,24,25,26,27,28,29,30,31,32,33,34] and is shown in Scheme 1 and Scheme 2. The main differences among the analog complexes are the substitutions at the para-/ortho-positions of the phenyl ring.
Initially, the structures were optimized by the molecular mechanics (MM) method, and the optimized structures of the four complexes 1, 34, 61, and 62 were compared to their respective experimental crystal structures to validate the optimization. The comparisons between the calculated and experimentally observed bond lengths and bond angles are provided in Tables S2–S5, including their respective standard deviations (δ). The low standard deviations for both the bond length and bond angle indicate reliable optimization of the complexes.
In order to establish a quantitative correlation between the catalytic activities of the complexes and their structures, descriptors were computed and selected for model building. As shown in Table S1, based on the prescreening and XGBoost SelectFromModel (SFM) method, the number of descriptors gradually decreased from 124 to 20. An acceptable ML model should have higher R2 and Q2 values as well as lower root mean square error (RMSE) and mean absolute error (MAE) values under a smaller number of descriptors. Therefore, the set of 25 descriptors was selected as the optimum independent variables. To analyze the correlation between the selected 25 descriptors and the catalytic activities, a correlation matrix was plotted, as shown in Figure S2. All pairs of descriptors exhibited low correlation coefficient values, indicating their independent nature from each other.
Furthermore, all of the data were split into test and training sets using the random selection method [35] to build and validate the predictive models. The best train–test ratio was determined by the different train–test ratio tests, as illustrated in Figure S3. It can be seen that the training R2 values increased with the increase in the training data, up to 80%, whereas the RMSE values of the model decreased with the increase in the training data, and the minimum RMSE value was found by 80% of the training data. Therefore, the data split ratio of 80:20 was chosen as the train–test split, resulting in 132 complexes for the training set and 33 complexes for the external test set.
Hereafter, six different non-linear regression algorithms, including XGBoost, Extra Trees (ETRs), CatBoost, Random Forests (RF), LightGBM, and K-nearest neighbor (KNN) were employed to build the predictive models for catalytic activities. For the optimal performance of these models, hyperparameter tuning was employed to systematically explore various combinations of the hyperparameters, resulting in the optimal hyperparameter configurations presented in Table S7. Subsequently, the models were rigorously tested with refined parameters, harnessing the power of hyperparameter tuning to maximize the predictive accuracy and model robustness, as shown in Table 1 for the six ML models.
The predicted catalytic activities were plotted against the experimental values for the various models in Figure 1. The closer the data points are to the diagonal line, the smaller the error produced by the ML model. The close match between the predicted and actual values indicates the feasibility of the models to predict catalytic activities. The data points predicted by all six ML models are uniformly and randomly distributed on both sides of the diagonal, supporting the feasibility of the established models. Additionally, there is no significant pattern in the data points distributed diagonally, indicating that no systematic errors were generated during the modeling process. However, there are a few exceptional predicted values in the results that deviate significantly from the actual values. These discrepancies can be attributed to the limited number of data points in the corresponding data interval. Figure 1 also reveals some interesting observations: the data points for four models, including RF, Extra Trees, KNN, and LightGBM, are more discrete with respect to the diagonal, and the bias amplitude of the data points is relatively large. In contrast, the XGBoost and CatBoost models do not exhibit larger bias amplitudes and have more data points that overlap with the diagonal.
The results show that the LightGBM performed very poorly, with a testing set Rt2 value of 0.761 and a Q2 value of 0.437. Although there was improvement with the single learners, like KNN (Rt2 = 0.801, Q2 = 0.474), the outcomes were still not satisfactory. On the other hand, the ensemble algorithms performed significantly better, such as Extra Trees (Rt2 = 0.841, Q2 = 0.542), CatBoost (Rt2 = 0.896, Q2 = 0.537), and RF (Rt2 = 0.824, Q2 = 0.560). The XGBoost model was found to be the best, with the highest R2 values of 0.999 and 0.921 for the testing and training sets, respectively, and very low RMSE values of 0.859 (106 g·mol−1·h−1) and 0.120 (106 g·mol−1·h−1). Furthermore, the obtained Q2 value was 0.561, the highest among the various approaches. Therefore, the XGBoost model was selected for further analysis and interpretation.
Interpretation of XGBoost Model
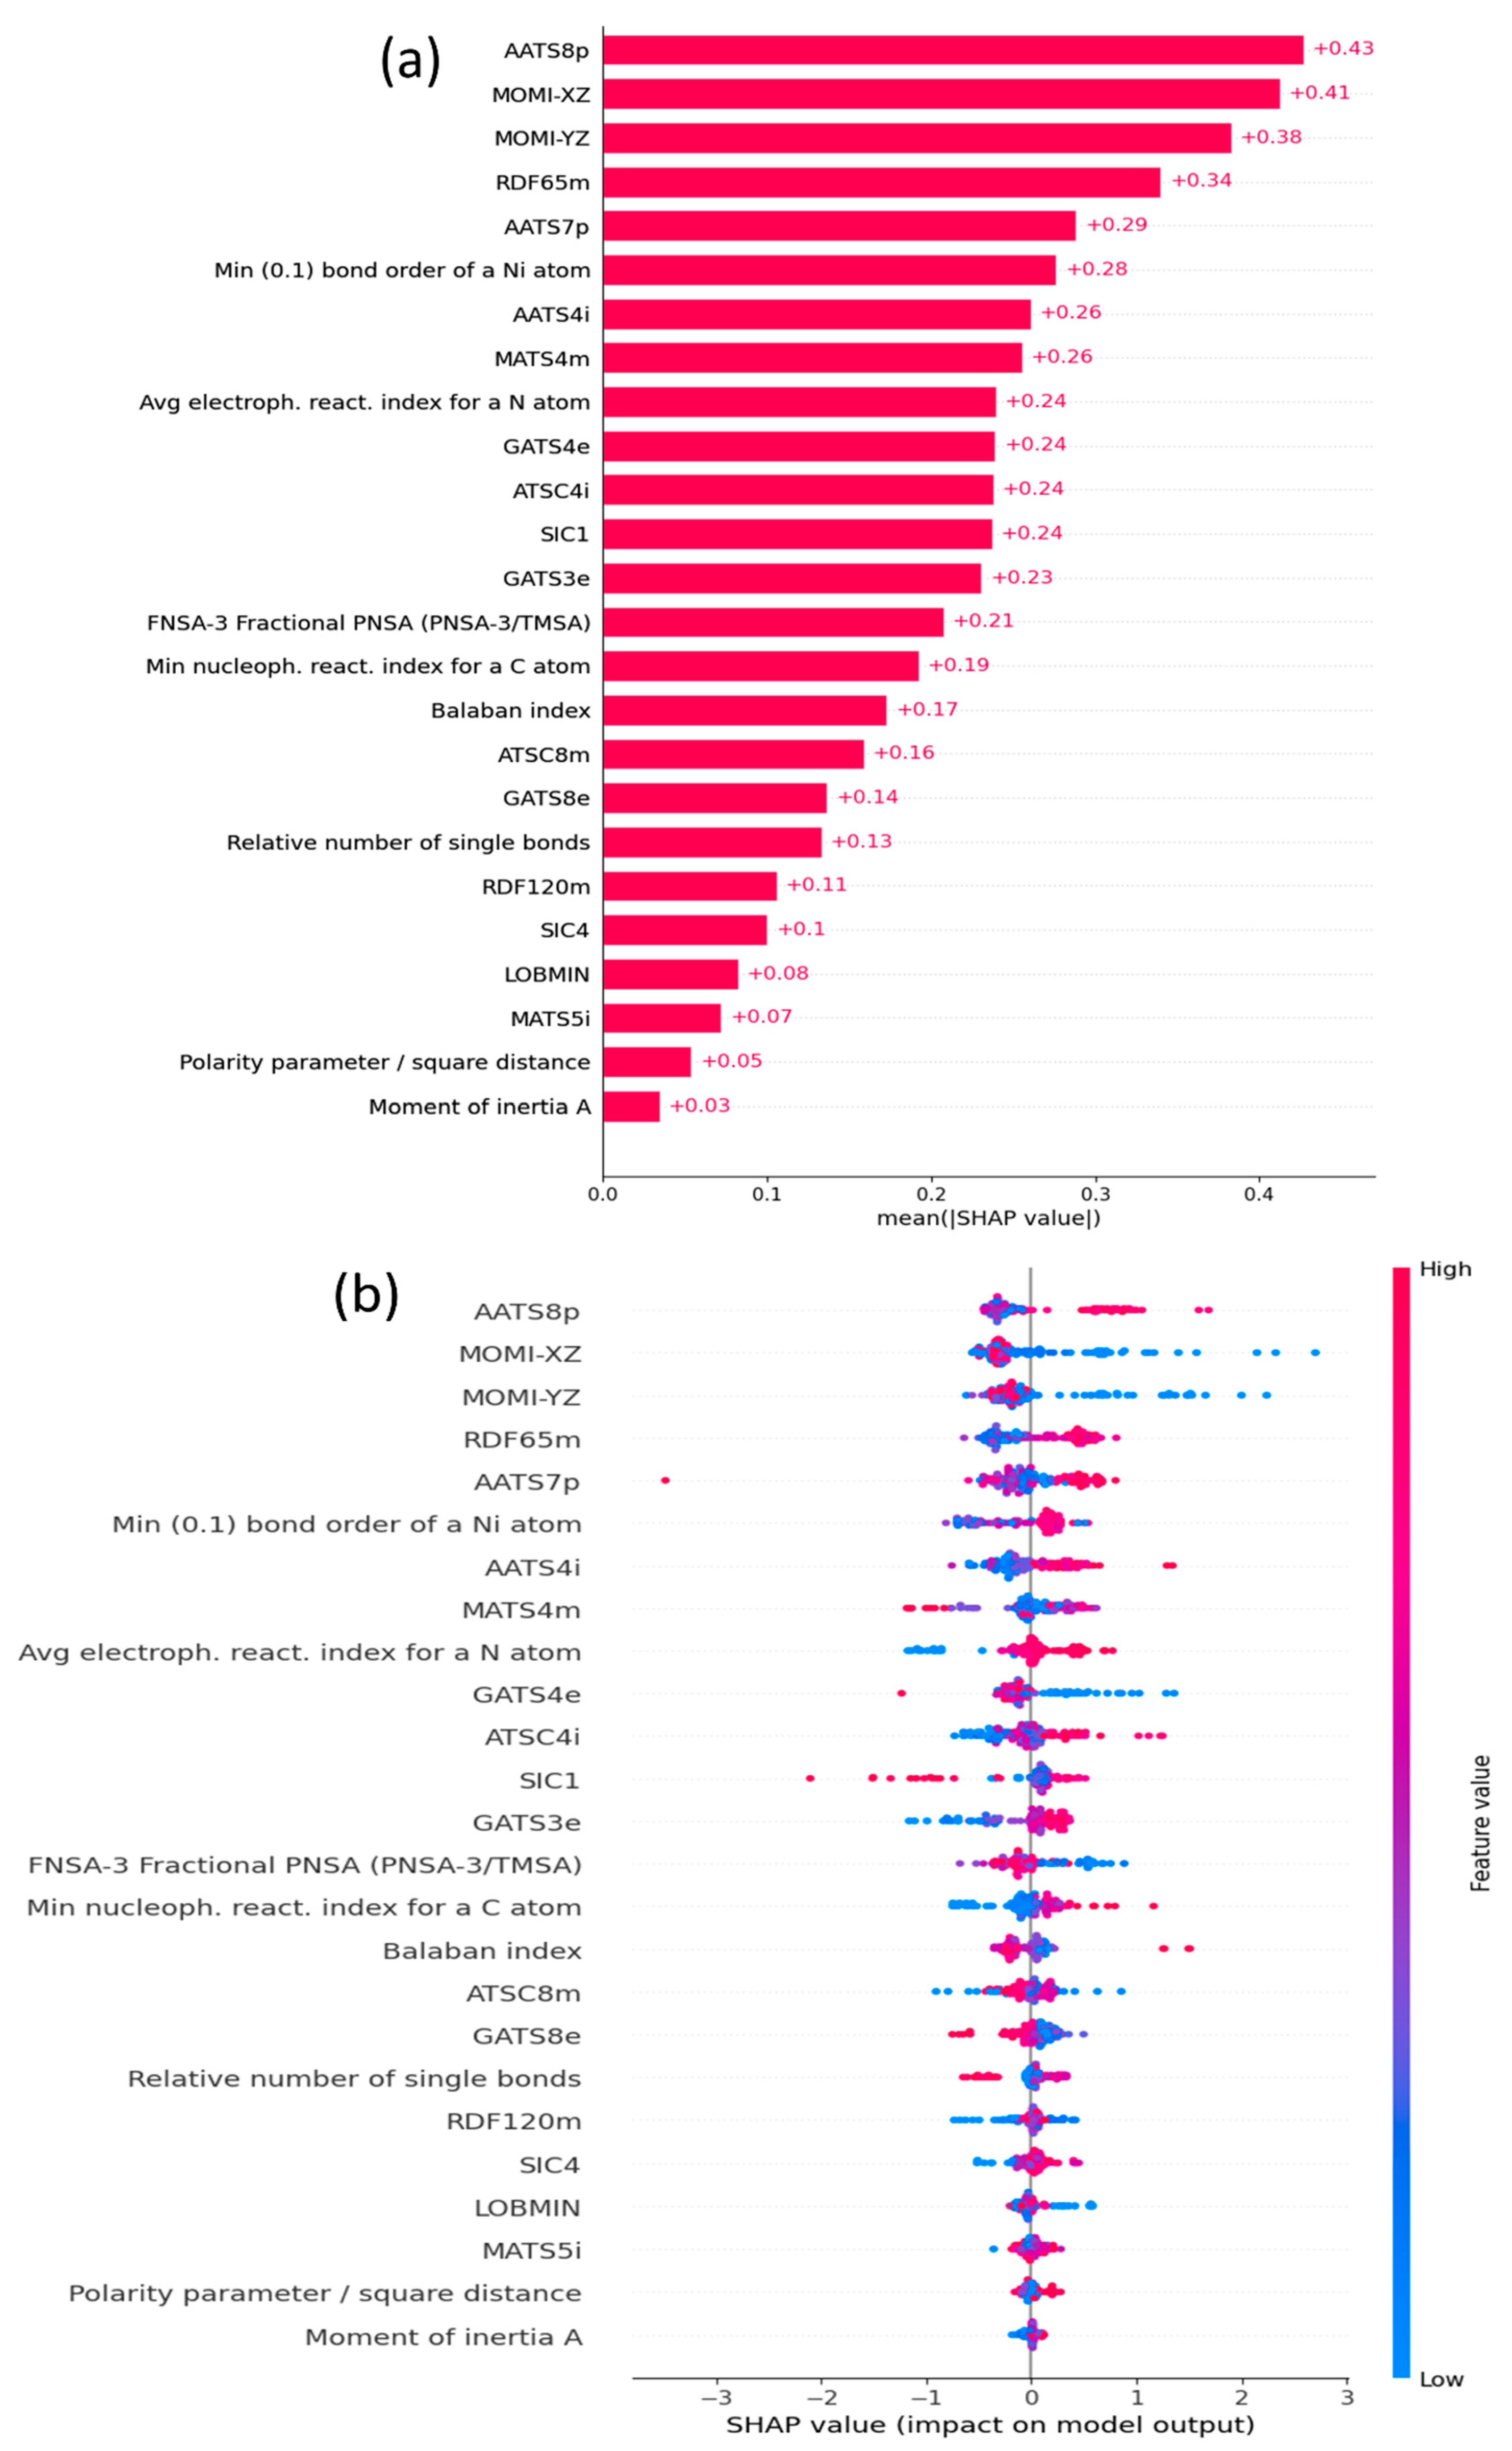
SHapley additive exPlanations (SHAP), permutation feature importance (PFI), and individual conditional expectations plots (ICE) have gained recognition for their effectiveness in interpreting ML models. While SHAP analysis offers valuable insights into how individual input variables affect the model’s output, PFI is employed to pinpoint the most crucial feature, and ICE plots are used to visually represent the connection between a particular feature and the predictions of model. These techniques offer valuable insights into understanding the inner workings of complex models, making them increasingly essential for model interpretability and decision-making. SHAP initially measures the impact of each descriptor on the catalytic activities, which are the so-called SHAP values, for individual complexes within the training set. Subsequently, the contributions are ranked from high to low based on the averaged SHAP value, as shown in Figure 2a.
It is clear that the AATS8p descriptor is the most significant, followed by the MOMI-XZ, MOMI-YZ, RDF65m, and AATS7p descriptors. The rank of feature importance alone is insufficient for a comprehensive interpretation. Therefore, it was necessary to ascertain whether the descriptors exhibited positive or negative correlations with the catalytic activity. In this context, a SHAP summary plot analysis was conducted, as shown in Figure 2b. Points with positive SHAP values represent a positive impact of the features on the performance of the model. Conversely, points with negative SHAP values indicate a negative impact. The overlapping points are spread along the y-axis, indicating the distribution of the SHAP values for each descriptor.
Figure 3 shows SHAP dependence plots of the four most important features determined by both SHAP and PFI analyses. The plots show the value of each feature versus its SHAP value. Each dot in the plot represents a sample from the dataset, and the color of the dot is determined by the value of the highly dependent input feature. The x-axis represents the feature value, and the y-axis illustrates the corresponding SHAP value, signifying the extent to which the prediction output is influenced by the individual feature. Additionally, to visualize and understand the impact of slight changes in features on model predictions, ICE plots have been generated.
The ICE plots in Figure 4 show the variation in the predicted catalytic activity concerning the most significant input features. It shows how the model output changes when one input feature is changed while all other input features are held constant. Each curve in the plot represents a sample in the dataset, and the bold curve represents the average of all curves. To create the ICE plots, each input feature was varied between its maximum and minimum values, while all other features were held constant, and the model predictions were calculated. These predictions are plotted as the thin blue curves in Figure 4. Through the utilization of these precise, robust, and granular explanation methods, such as SHAP analysis, PFI, and ICE plots, a comprehensive interpretation of the impact of each feature on the prediction was achieved.
As illustrated in Figure 2a and Figure S5, AATS8p, AATS7p, MOMI-XZ, and MOMI-YZ emerged as the most significant features, playing a crucial role in the predictions of the model. AATS7p and AATS8p [36] are autocorrelation descriptors designed to consider the variation in polarizability with specific lag distances of 7 and 8 respectively, within the structure of the molecule. AATS8p showed a higher impact than AATS7p, and they encoded very similar structural information, such as the presence of polar atoms in large molecules. These descriptors take into account how polarizability varies across the molecular structure, which is often associated with the presence of polar functional groups or atoms within the molecule. Figure 2b shows a high number of red dots toward the right side of the x-axis, indicating that AATS8p and AATS7p positively influenced the output of the model, namely catalytic activity. Furthermore, the SHAP dependency plot in Figure 3a shows how the activity is represented as a function of the AATS8p descriptor. The interaction with the average electrophilicity index for a nitrogen atom variable is illustrated by the color of each observation point, as indicated on the right y-axis. Firstly, the SHAP value decreases with the increase in feature value between 1.7 and 1.85, but with the further increase in feature value, its SHAP value tends to increase. On the other hand, AATS7p also shows a similar increasing trend. This suggests that complexes with more polarizable atoms may increase the values of these descriptors, leading to higher activity. The polarizable atoms, distinguished by their high electronegativity or the presence of polar functional groups (e.g., F, Cl, NO2), play a pivotal role in enhancing catalytic activity by increasing the reactivity of transition metal complexes by influencing their electronic structure, facilitating more efficient interactions with substrate molecules.
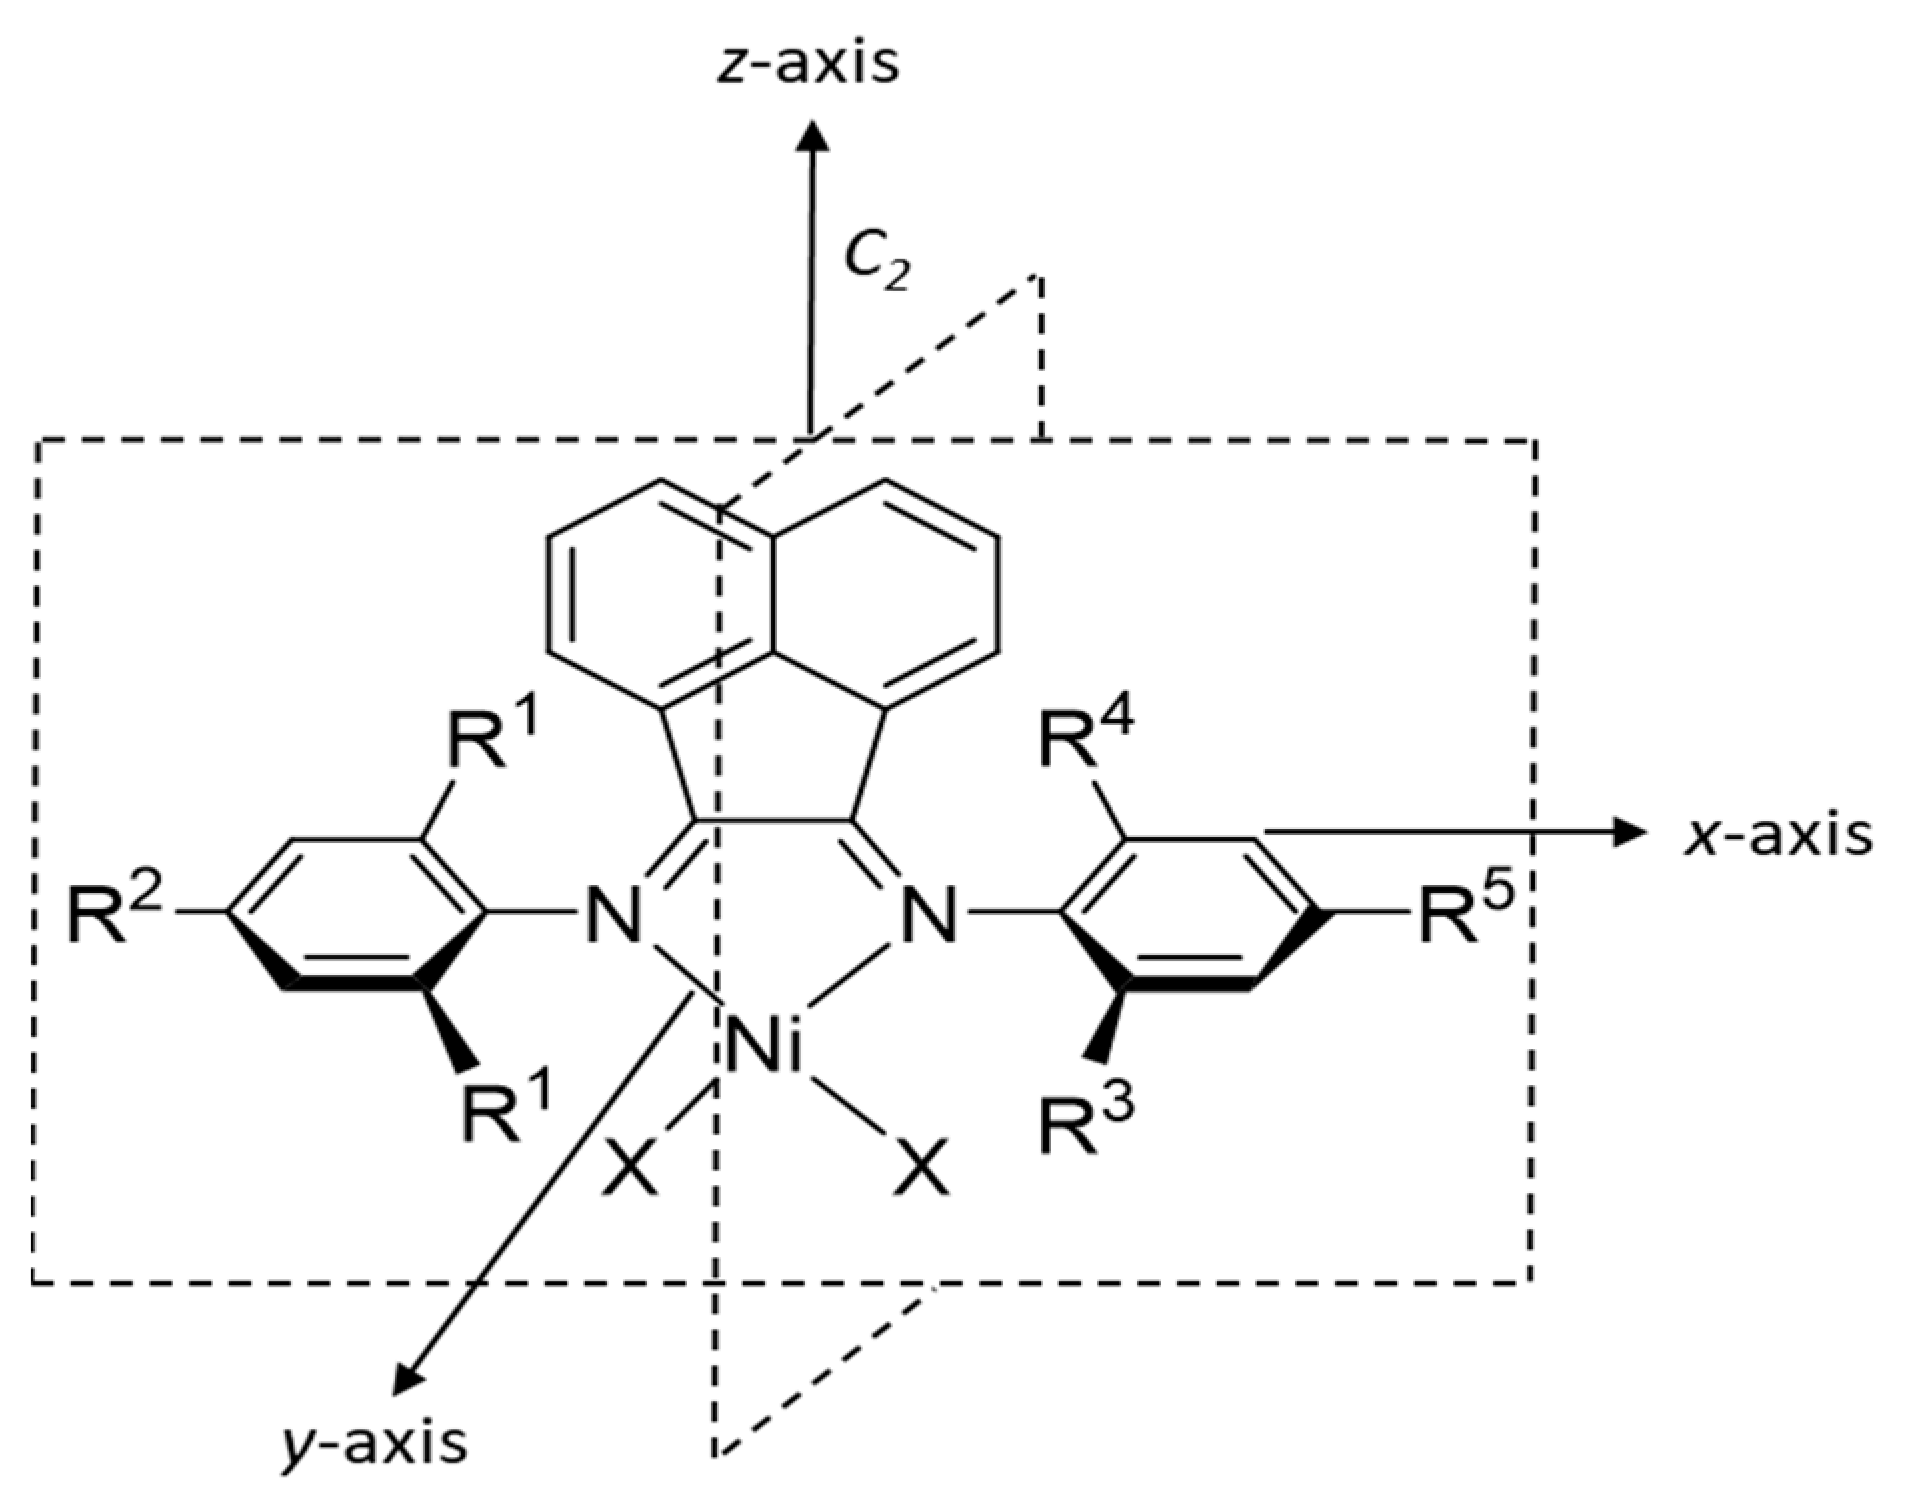
Apart from the trends of the autocorrelation descriptors, the descriptors MOMI-XZ and MOMI-YZ illustrate the negative impact on the model predictions. These are geometrical descriptors based on the moment of inertia of a molecule. The values of MOMI-XZ and MOMI-YZ depend on the total mass of the molecule, the distribution within the molecule, and the specific axis of the molecule, as shown in Figure 5.
As shown in the SHAP summary plot, the negative contribution of these descriptors suggests that the presence of bulky substituents around the x/z and y/z axes will result in lower activity. This can be attributed to the increased bulkiness in these plans, which can make it more difficult for the complex to rotate, hindering the access of ethylene to the metal center, and this aligns closely with the previously reported findings [37]. Furthermore, there is a decreasing trend for both the MOMI-XZ and MOMI-YZ descriptors, as shown in Figure 3b,c. In Figure 3b, the color dependency plot shows that there is a negative correlation between the MOMI-XZ and the SHAP values for MOMI-XZ. Initially, for lower feature values, the SHAP values of MOMI-XZ are higher, indicating that less bulkiness around the x/z plane is favorable to catalytic activity. However, with the increase in feature values, the SHAP values start to decrease and eventually become almost constant after reaching 1.6.
Moreover, as shown in Figure 2a,b, RDF65m is also an important descriptor that contributes significantly to the model predictions. Radial distribution function (RDF) descriptors are based on the probability of finding an atom within a sphere of radius r. The term RDF65m refers to an RDF calculated at a distance of 6.5 Å, and it takes into account the atomic masses of atoms in the calculation. The weights are calculated based on the relative masses of the atoms, and a complex with a high value of this descriptor is more densely packed than a complex with a low value. This is useful for characterizing the distribution of mass around a central atom. The SHAP summary plot for RDF65m indicates a positive contribution to the model predictions, emphasizing that the presence of densely packed atoms around the metal center at a distance around 6.5 Å ensures sufficient space for the monomer to access the metal center, thereby leading to higher catalytic activity.
Furthermore, it is evident from the bold curves in Figure 4 that the most significant change in the predicted activity values was caused by changing the values of AATS8p and MOMI-XZ, whereas the flattest curves in Figure 4c,d show the average change in predicted activity with respect to AATS8p and MOMI-XZ. This confirms the results of the SHAP analysis. The analysis of the XGBoost model suggests that complexes with high catalytic activity tend to exhibit specific structural characteristics, such as the incorporation of additional polarizable atoms, like F, Cl, and NO2, as well as the reduced bulkiness of the substituents on the ortho-position.
3. Computational Methods
3.1. Geometry Optimization
Our previous studies have shown that the optimized structures obtained through the molecular mechanics (MM) method are closely in line with the experimental crystal structure [21,37]. Therefore, the geometry of each complex was optimized by the MM method, using the Dreiding force field [38] embedded in the Forcite package (version 6.0, Accelrys Inc., San Diego, CA, USA, 2011) [39]. As there is no force field for the central transition metal and the coordinated atoms, the force field parameters for these atoms were added based on the crystal structures, including the bond lengths, bond angles, and dihedral angles. The energy and force convergence tolerances were set at 0.001 kcal·mol⁻1 and 0.5 kcal·(mol·Å)⁻1, respectively. To account for electrostatic and van der Waals interactions, the atom-based Summation and Truncation methods were chosen, with a cutoff distance of 1.25 nm using a cubic spline.
3.2. Descriptor Calculation and Selection
Single-point energy (SPE) calculations were performed for each complex using the Gaussian 09 program package [40] to compute molecular descriptors for each complex using Codessa (version 2.7.2) [41]. Furthermore, various kinds of descriptors were also calculated by PaDEL software (version 2.21) [36]. There were 338 descriptors by Codessa and 745 descriptors by PaDEL for each complex. However, it was quite challenging to analyze and model this extensive amount of data using so many descriptors because of the noise, redundancy, and irrelevant information. Variable or feature selection can reduce the number of descriptors while also enhancing the efficiency of learning algorithms by identifying and eliminating redundant data.
Firstly, this large number of descriptors were pre-screened by the filter method based on two-point considerations: (1) Firstly, highly intercorrelated descriptors were eliminated by Pearson’s correlation coefficient method with an R2 over 0.99 for each pair of descriptors. (2) Then, those descriptors were also eliminated, having a very low correlation with catalytic activity with an R2 below 0.1. Then, the SelectFromModel (SFM) method from Scikit-learn (version 1.3.1) [35] was used to iteratively select the descriptors further, reducing the set of descriptors from 108 to 20. Throughout the feature selection, the stepwise evaluation parameters were systematically calculated and are shown in Table S1.
Considering the obtained R2, Q2, RMSE, and MAE values, the optimal results were achieved with 25 descriptors. Therefore, a set of 25 descriptors was chosen for building regression models.
3.3. Machine Learning Modelling
The selected descriptors were chosen as independent variables, with catalytic activity as a dependent variable, to build the predictive models. As there are no silver bullet algorithms for a dataset, we employed a combination of advanced tree-based models, including XGBoost [42], CatBoost [43], LightGBM [44], ETRs [45], and RF [46], along with the instance-based KNN [47] through the Scikit-learn package (version 1.3.1). To address potential data biasing, the random splits were iterated 10 times. The prediction accuracy was evaluated by the accuracy metrics, such as the R2, MAE, and RMSE, whereas the validation capability of the model was assessed through Q2 obtained by the shuffle split method [35], which is an iterative cross-validation method that randomly selects samples from the entire dataset during each iteration to select a training set.
Usually, most ML algorithms typically have several hyperparameters that need to be set during the training of the model. Hyperparameters have a significant impact on model performance. In this study, the hyperparameters of various ML models were optimized manually by experimenting with various combinations on the training data to enhance the comprehension of the model. Manual hyperparameter tuning remains the most prevalent approach, with a significant portion of empirical studies relying on this method. It facilitates the development and testing of hypotheses regarding hyperparameter influences and provides a rapid feedback cycle for the detection and correction of errors during the development of the model, in contrast to programmatic tuning methods [48]. The optimal set of parameters was determined based on the validation accuracy.
3.4. Model Interpretation
The obtained XGBoost model was interpreted from three different aspects, including PFI, SHAP, and ICE plots to conduct a comprehensive investigation of the explanatory factors of the model. The combination of these three methods enabled us to validate and cross-check the significant influential factors, thus enhancing the validity and persistence of our findings.
3.4.1. Permutation Feature Importance (PFI)
PFI is a technique that can be used to identify the most important feature. PFI works by randomly shuffling the values of each feature and then measuring the changes in the predictions of the model [49]. The more the predictions of model change, the more important the feature is. Although it is computationally expensive for large feature sets, it has the advantage of being applicable to any ML algorithm regardless of its complexity. The significance of a feature can be assessed by examining the associated weights, and this analysis can be applied to all features. Consequently, it becomes possible to assess the impact of each feature on the output of model. It can be represented by Equation (1):
where j refers to the feature that requires an explanation, xj represents the value of this particular feature, and x+j represents the value of the sample x, including the jth feature. π(xj) signifies the perturbation introduced to xj, f stands for the prediction made by the complex model for x, and e represents the estimated accuracy of f.
3.4.2. SHapley Additive exPlanations (SHAP)
SHAP is a feature attribution method that uses Shapley values to explain the output of a predictive model [50,51]. In the context of feature attribution, Shapley values are a way to measure the contribution of each feature to the prediction of an ML model. SHAP is different from other feature attribution methods in that it does not require the construction of a surrogate model. It can be used to explain how a model makes decisions, to identify the most important features, and to fix problems when the model is not performing as expected. To calculate SHAP values, the algorithm considers all possible combinations of features, called coalitions. A coalition is a subset of features that work together to make predictions. The algorithm iterates through all possible coalitions and evaluates their importance by comparing the predictions of the model when a feature is either included or excluded in the coalition. The representation of the attribution model for additive features can be expressed by Equation (2):
where g represents the interpretable model, z′i indicates whether the ith feature is observable, M stands for the total number of features, 0 is the mean predicted value across all samples, and i denotes the Shapley value associated with the ith feature.
To obtain an accurate Shapley value, it is necessary to estimate it by considering all potential combinations of utilizing or not utilizing the ith feature. Nevertheless, when dealing with a large number of features, the number of such combinations grows exponentially. Consequently, the estimated Shapley value is determined using Monte Carlo sampling using Equation (3):
where f(x+i) represents the anticipated outcome when including feature xi in the model. Apart from the ith feature, the remaining features not part of this combination are substituted with values drawn from a random distribution. Here, k signifies the kth feature combination, M corresponds to the overall count of feature combinations, and x+i and x−i denote the values of the combination with and without the ith feature, respectively.
3.4.3. Individual Conditional Expectations Plots (ICE)
ICE plots provide an alternative visualization tool for understanding how marginal changes in features impact model predictions. Unlike partial dependence plots (PDPs), which depict the average effect of a feature across all instances. ICE plots generate a separate line for each instance, allowing for the examination of individual-specific relationships. These lines represent the change in the model’s prediction for a given instance as the value of the selected feature is varied while keeping all other features constant. ICE plots offer a more granular view of feature importance compared to PDPs, which provide an overall average effect.
ICE plots can be challenging to interpret due to variations in the starting points of the curves and stacking on each other, making it difficult to distinguish between individual ICE curves. This stacking effect veils both individual variations and cumulative impacts. In such situations, centered ICE plots (c-ICE) offer a valuable solution by removing level effects and providing a clearer picture of the underlying model heterogeneity [52]. Moreover, it enhances the interpretation of the behavior of model, especially in scenarios where conventional ICE plots may conceal crucial insights.
4. Conclusions
In this study, nonlinear ML methods were implemented for predicting the catalytic activities of a set of 165 α-diimino nickel complexes toward ethylene polymerization. A total of 25 descriptors were selected to build the models using six different algorithms. The performance of each model was systematically evaluated, and XGBoost model exhibited the best results with correlation coefficient values of 0.999 and 0.921 for the training and external testing sets. Then, the model was interpreted via SHAP values, PFI, and ICE plots, revealing the positive role of polarizable atoms and the negative role of bulkiness for higher catalytic activities. The exploration of the most significant descriptors using these frameworks offers valuable guidance for designing new α-diimino nickel complexes with superior catalytic performance.
The dataset in the current study is relatively large; however, for a more robust and accurate model, there remains the possibility for further expansion. Moreover, the development of additional descriptors with physical significance could provide a more detailed comprehension of the mechanism underlying the variation in catalytic activity.
Supplementary Materials
The following supporting information can be downloaded at: https://www.mdpi.com/article/10.3390/catal14030195/s1, Table S1: The selection of descriptors and the corresponding values of R2, Q2, RMSE, and MAE, Tables S2–S5: Comparisons of bond lengths and bond angles between the calculated geometry and experimental data for complexes 1, 34, 61, and 62, along with the standard deviation (δ), Table S6: Detailed information of the 25 selected descriptors, Table S7: Hyperparameters of the ML models, Figure S1: The methodology implemented for predicting and interpreting catalytic activities, Figure S2: Triangular matrix of correlations among the selected 25 descriptors and activity, Figure S3: R2 and RMSE scores as functions of different percentages of training data, Figure S4: Training and test sets deviance against boosting iterations, Figure S5: Feature importance ranking based on permutation feature importance (PFI).
Author Contributions
Conceptualization, W.Y. (Wenhong Yang); methodology, Z.A. and W.Y. (Wenhong Yang); investigation, W.Y. (Wenhong Yang) and M.M.M.; formal analysis, Z.A.; resources, W.Y. (Wenhong Yang); writing—original draft preparation, Z.A.; writing—review, W.Y. (Wenhong Yang) and M.M.M.; supervision, W.Y. (Wenhong Yang) and W.-H.S.; project administration, W.Y. (Wenhong Yang) and W.-H.S.; funding acquisition, W.Y. (Wenhong Yang) and W.Y. (Weisheng Yang). All authors have read and agreed to the published version of the manuscript.
Funding
This work was financially supported by the International Cooperation Project of PetroChina, Grant/Award Number: PetroChina Co., Ltd./2023DQ0424.
Data Availability Statement
The raw data supporting the conclusions of this article will be made available by the authors without undue reservation.
Conflicts of Interest
The authors declare that the research was conducted in the absence of any commercial or financial relationships that could be construed as a potential conflict of interest.
References
- Ronca, S. Polyethylene. In Brydson’s Plastics Materials, 8th ed.; Gilbert, M., Ed.; Butterworth-Heinemann: Oxford, UK, 2017; pp. 247–278. [Google Scholar]
- Johnson, L.K.; Killian, M.C.; Brookhart, M. New Pd (II)-and Ni (II)-based catalysts for polymerization of ethylene and. alpha.-olefins. J. Am. Chem. Soc. 1995, 117, 6414–6415. [Google Scholar] [CrossRef]
- Wang, Z.; Liu, Q.; Solan, G.A.; Sun, W.-H. Recent advances in Ni-mediated ethylene chain growth: Nimine-donor ligand effects on catalytic activity, thermal stability and oligo-/polymer structure. Coord. Chem. Rev. 2017, 350, 68–83. [Google Scholar] [CrossRef]
- Soshnikov, I.E.; Bryliakov, K.P.; Antonov, A.A.; Sun, W.-H.; Talsi, E.P. Ethylene polymerization of nickel catalysts with α-diimine ligands: Factors controlling the structure of active species and polymer properties. Dalton Trans. 2019, 48, 7974–7984. [Google Scholar] [CrossRef] [PubMed]
- Qasim, M.; Bashir, M.S.; Iqbal, S.; Mahmood, Q. Recent advancements in α-diimine-nickel and-palladium catalysts for ethylene polymerization. Eur. Polym. J. 2021, 160, 110783. [Google Scholar] [CrossRef]
- Wu, R.; Wang, Y.; Guo, L.; Guo, C.Y.; Liang, T.; Sun, W.-H. Highly branched and high-molecular-weight polyethylenes produced by 1-[2, 6-bis (bis (4-fluorophenyl) methyl)-4-MeOC6H2N]-2-aryliminoacenaphthylnickel (II) halides. J. Polym. Sci. A Polym. Chem. 2019, 57, 130–145. [Google Scholar] [CrossRef]
- Zada, M.; Guo, L.; Zhang, R.; Zhang, W.; Ma, Y.; Solan, G.A.; Sun, Y.; Sun, W.-H. Moderately branched ultra-high molecular weight polyethylene by using N,N′-nickel catalysts adorned with sterically hindered dibenzocycloheptyl groups. Appl. Organomet. Chem. 2019, 33, e4749. [Google Scholar] [CrossRef]
- Yuan, S.; Duan, T.; Zhang, R.; Solan, G.A.; Ma, Y.; Liang, T.; Sun, W.-H. Alkylaluminum activator effects on polyethylene branching using a N,N′-nickel precatalyst appended with bulky 4,4′-dimethoxybenzhydryl groups. Appl. Organomet. Chem. 2019, 33, e4785. [Google Scholar] [CrossRef]
- Zhang, R.; Wang, Z.; Ma, Y.; Solan, G.A.; Sun, Y.; Sun, W.-H. Plastomeric-like polyethylenes achievable using thermally robust N,N′-nickel catalysts appended with electron withdrawing difluorobenzhydryl and nitro groups. Dalton Trans. 2019, 48, 1878–1891. [Google Scholar] [CrossRef]
- Zhang, Q.; Zhang, R.; Ma, Y.; Solan, G.A.; Liang, T.; Sun, W.-H. Branched polyethylenes attainable using thermally enhanced bis (imino) acenaphthene-nickel catalysts: Exploring the effects of temperature and pressure. Appl. Catal. A-Gen. 2019, 573, 73–86. [Google Scholar] [CrossRef]
- Guan, B.; Jiang, H.; Wei, Y.; Liu, Z.; Wu, X.; Lin, H.; Huang, Z. Density functional theory researches for atomic structure, properties prediction, and rational design of selective catalytic reduction catalysts: Current progresses and future perspectives. Mol. Catal. 2021, 510, 111704. [Google Scholar] [CrossRef]
- Kitchin, J.R. Machine learning in catalysis. Nat. Catal. 2018, 1, 230–232. [Google Scholar] [CrossRef]
- Yang, W.; Fidelis, T.T.; Sun, W.-H. Machine learning in catalysis, from proposal to practicing. ACS Omega 2019, 5, 83–88. [Google Scholar] [CrossRef] [PubMed]
- Yang, W.; Sun, W.-H. Application and prospect of machine learning in polyolefin catalysts. Chin. Sci. Bull. 2022, 67, 1870–1880. [Google Scholar] [CrossRef]
- Hayatzadeh, A.; Fattahi, M.; Rezaveisi, A. Machine learning algorithms for operating parameters predictions in proton exchange membrane water electrolyzers: Anode side catalyst. Int. J. Hydrogen Energy 2024, 56, 302–314. [Google Scholar] [CrossRef]
- Yang, W.; Ma, Z.; Sun, W.-H. Modeling study on the catalytic activities of 2-imino-1, 10-phenanthrolinylmetal (Fe, Co, and Ni) precatalysts in ethylene oligomerization. RSC Adv. 2016, 6, 79335–79342. [Google Scholar] [CrossRef]
- Malik, A.A.; Yang, W.; Ma, Z.; Sun, W.-H. The Catalytic Activities of Carbocyclic Fused Pyridineimine Nickel Complexes Analogues in Ethylene Polymerization by Modeling Study. Catalysts 2019, 9, 520. [Google Scholar] [CrossRef]
- Yang, W.; Meraz, M.; Fidelis, T.T.; Sun, W.-H. The Quantitative Influence of Coordinated Halogen Atoms on the Catalytic Performance of Bisiminoacenaphthylnickel Complexes in Ethylene Polymerization. ChemPhysChem 2021, 22, 585–592. [Google Scholar] [CrossRef] [PubMed]
- Yang, W.; Yi, J.; Ma, Z.; Sun, W.-H. 2D-QSAR modeling on the catalytic activities of 2-azacyclyl-6-aryliminopyridylmetal precatalysts in ethylene oligomerization. Catal. Commun. 2017, 101, 40–43. [Google Scholar] [CrossRef]
- Meraz, M.M.; Malik, A.A.; Yang, W.; Sun, W.-H. Catalytic Performance of Cycloalkyl-Fused Aryliminopyridyl Nickel Complexes toward Ethylene Polymerization by QSPR Modeling. Catalysts 2021, 11, 920. [Google Scholar] [CrossRef]
- Meraz, M.M.; Yang, W.; Yang, W.; Sun, W.-H. Predicting the catalytic activities of transition metal (Cr, Fe, Co, Ni) complexes towards ethylene polymerization by machine learning. J. Comput. Chem. 2023, 1. [Google Scholar] [CrossRef]
- Yang, W.; Fidelis, T.T.; Sun, W.-H. Prediction of catalytic activities of bis (imino) pyridine metal complexes by machine learning. J. Comput. Chem. 2020, 41, 1064–1067. [Google Scholar] [CrossRef] [PubMed]
- Wu, R.; Wang, Y.; Zhang, R.; Guo, C.Y.; Flisak, Z.; Sun, Y.; Sun, W.-H. Finely tuned nickel complexes as highly active catalysts affording branched polyethylene of high molecular weight: 1-(2,6-Dibenzhydryl-4-methoxyphenylimino)-2-(arylimino) acenaphthylenenickel halides. Polymer 2018, 153, 574–586. [Google Scholar] [CrossRef]
- Mahmood, Q.; Zeng, Y.; Wang, X.; Sun, Y.; Sun, W.-H. Advancing polyethylene properties by incorporating NO2 moiety in 1, 2-bis (arylimino) acenaphthylnickel precatalysts: Synthesis, characterization and ethylene polymerization. Dalton Trans. 2017, 46, 6934–6947. [Google Scholar] [CrossRef] [PubMed]
- Chen, Y.; Du, S.; Huang, C.; Solan, G.A.; Hao, X.; Sun, W.-H. Balancing high thermal stability with high activity in diaryliminoacenaphthene-nickel (II) catalysts for ethylene polymerization. J. Polym. Sci. A Polym. Chem. 2017, 55, 1971–1983. [Google Scholar] [CrossRef]
- Wang, X.; Fan, L.; Ma, Y.; Guo, C.Y.; Solan, G.A.; Sun, Y.; Sun, W.-H. Elastomeric polyethylenes accessible via ethylene homo-polymerization using an unsymmetrical α-diimino-nickel catalyst. Polym. Chem. 2017, 8, 2785–2795. [Google Scholar] [CrossRef]
- Wang, X.; Fan, L.; Yuan, Y.; Du, S.; Sun, Y.; Solan, G.A.; Guo, C.Y.; Sun, W.-H. Raising the N-aryl fluoride content in unsymmetrical diaryliminoacenaphthylenes as a route to highly active nickel (II) catalysts in ethylene polymerization. Dalton Trans. 2016, 45, 18313–18323. [Google Scholar] [CrossRef] [PubMed]
- Du, S.; Xing, Q.; Flisak, Z.; Yue, E.; Sun, Y.; Sun, W.-H. Ethylene polymerization by the thermally unique 1-[2-(bis (4-fluoro phenyl) methyl)-4, 6-dimethylphenylimino]-2-aryliminoacenaphthylnickel precursors. Dalton Trans. 2015, 44, 12282–12291. [Google Scholar] [CrossRef]
- Fan, L.; Du, S.; Guo, C.Y.; Hao, X.; Sun, W.-H. 1-(2, 6-dibenzhydryl-4-fluorophenylimino)-2-aryliminoacenaphthylylnickel halides highly polymerizing ethylene for the polyethylenes with high branches and molecular weights. J. Polym. Sci. A Polym. Chem. 2015, 53, 1369–1378. [Google Scholar] [CrossRef]
- Du, S.; Kong, S.; Shi, Q.; Mao, J.; Guo, C.; Yi, J.; Liang, T.; Sun, W.-H. Enhancing the activity and thermal stability of nickel complex precatalysts using 1-[2, 6-bis (bis (4-fluorophenyl) methyl)-4-methyl phenylimino]-2-aryliminoacenaphthylene derivatives. Organometallics 2015, 34, 582–590. [Google Scholar] [CrossRef]
- Fan, L.; Yue, E.; Du, S.; Guo, C.Y.; Hao, X.; Sun, W.-H. Enhancing thermo-stability to ethylene polymerization: Synthesis, characterization and the catalytic behavior of 1-(2,4-dibenzhydryl-6-chlorophenylimino)-2-aryliminoacenaphthylnickel halides. RSC Adv. 2015, 5, 93274–93282. [Google Scholar] [CrossRef]
- Yuan, S.F.; Fan, Z.; Zhang, Q.; Flisak, Z.; Ma, Y.; Sun, Y.; Sun, W.-H. Enhancing performance of α-diiminonickel precatalyst for ethylene polymerization by substitution with the 2,4-bis (4,4’-dimethoxybenzhydryl)-6-methylphenyl group. Appl. Organomet. Chem. 2020, 34, e5638. [Google Scholar] [CrossRef]
- Liu, H.; Zhao, W.; Yu, J.; Yang, W.; Hao, X.; Redshaw, C.; Chen, L.; Sun, W.-H. Synthesis, characterization and ethylene polymerization behavior of nickel dihalide complexes bearing bulky unsymmetrical α-diimine ligands. Catal. Sci. Technol. 2012, 2, 415–422. [Google Scholar] [CrossRef]
- Mahmood, Q.; Zeng, Y.; Yue, E.; Solan, G.A.; Liang, T.; Sun, W.-H. Ultra-high molecular weight elastomeric polyethylene using an electronically and sterically enhanced nickel catalyst. Polym. Chem. 2017, 8, 6416–6430. [Google Scholar] [CrossRef]
- Pedregosa, F.; Varoquaux, G.; Gramfort, A.; Michel, V.; Thirion, B.; Grisel, O.; Blondel, M.; Prettenhofer, P.; Weiss, R.; Dubourg, V.; et al. Scikit-learn: Machine learning in Python. J. Mach. Learn. Res. 2011, 12, 2825–2830. [Google Scholar]
- Yap, C.W. PaDEL-descriptor: An open source software to calculate molecular descriptors and fingerprints. J. Comput. Chem. 2011, 32, 1466–1474. [Google Scholar] [CrossRef] [PubMed]
- Yang, W.; Ma, Z.; Yi, J.; Ahmed, S.; Sun, W.-H. Catalytic performance of bis (imino) pyridine Fe/Co complexes toward ethylene polymerization by 2D-/3D-QSPR modeling. J. Comput. Chem. 2019, 40, 1374–1386. [Google Scholar] [CrossRef] [PubMed]
- Mayo, S.L.; Olafson, B.D.; Goddard, W.A. DREIDING: A generic force field for molecular simulations. J. Phys. Chem. 1990, 94, 8897–8909. [Google Scholar] [CrossRef]
- Meunier, M.; Robertson, S. Materials Studio 20th anniversary. Mol. Simul. 2021, 47, 537–539. [Google Scholar] [CrossRef]
- Frisch, M.J.; Trucks, G.W.; Schlegel, H.B.; Scuseria, G.E.; Robb, M.A.; Cheeseman, J.R.; Scalmani, G.; Barone, V.; Mennucci, B.; Petersson, G.A.; et al. Gaussian 09; Revision C.01; Gaussian, Inc.: Wallingford, CT, USA, 2016. [Google Scholar]
- Katritzky, A.R.; Lobanov, V.S. Comprehensive Descriptors for Structural and Statistical Analysis (Codessa); Semichem, Inc.: Shawnee Mission, KS, USA, 2004. [Google Scholar]
- Chen, T.; Guestrin, C. XGBoost: A Scalable Tree Boosting System. In Proceedings of the 22nd ACM SIGKDD International Conference on Knowledge Discovery and Data Mining, San Francisco, CA, USA, 13–17 August 2016. [Google Scholar]
- Prokhorenkova, L.; Gusev, G.; Vorobev, A.; Dorogush, A.V.; Gulin, A. CatBoost: Unbiased boosting with categorical features. Adv. Neural. Inf. Process. Syst. 2018, 31. [Google Scholar] [CrossRef]
- Ke, G.; Meng, Q.; Finley, T.; Wang, T.; Chen, W.; Ma, W.; Ye, Q.; Liu, T.Y. Lightgbm: A highly efficient gradient boosting decision tree. Adv. Neural. Inf. Process. Syst. 2017, 30, 3149–3157. [Google Scholar]
- Geurts, P.; Ernst, D.; Wehenkel, L. Extremely randomized trees. Mach. Learn. 2006, 63, 3–42. [Google Scholar] [CrossRef]
- Breiman, L. Random forests. Mach. Learn. 2001, 45, 5–32. [Google Scholar] [CrossRef]
- Larose, D.T.; Larose, C.D. Discovering Knowledge in Data: An Introduction to Data Mining, 2nd ed.John Wiley & Sons: Hoboken, NJ, USA, 2014; pp. 149–164. [Google Scholar]
- Hasebrook, N.; Morsbach, F.; Kannengießer, N.; Franke, J.; Hutter, F.; Sunyaev, A. Practitioner Motives to Select Hyperparameter Optimization Methods. arXiv 2022, arXiv:2203.01717. [Google Scholar]
- Altmann, A.; Toloşi, L.; Sander, O.; Lengauer, T. Permutation importance: A corrected feature importance measure. Bioinformatics 2010, 26, 1340–1347. [Google Scholar] [CrossRef] [PubMed]
- Shapley, L.S. A Value for n-Person Games. In Contributions to the Theory of Games (AM-28), 1st ed.; Tucker, A.W., Kuhn, H.W., Eds.; Princeton University Press: Princeton, NJ, USA, 1953; pp. 307–318. [Google Scholar]
- Lundberg, S.M.; Lee, S.I. A Unified Approach to Interpreting Model Predictions. In Proceedings of the 31st Conference on Neural Information Processing Systems (NIPS 2017), Long Beach, CA, USA, 4–9 December 2017. [Google Scholar]
- Goldstein, A.; Kapelner, A.; Bleich, J.; Pitkin, E. Peeking inside the black box: Visualizing statistical learning with plots of individual conditional expectation. J. Comput. Graph. Stat. 2015, 24, 44–65. [Google Scholar] [CrossRef]
Scheme 1.
The structure of the complexes 1–80 for the α-diimino nickel complexes with bulky substituents. a 106 g·mol−1·h−1.
Scheme 1.
The structure of the complexes 1–80 for the α-diimino nickel complexes with bulky substituents. a 106 g·mol−1·h−1.

Scheme 2.
The structure of the complexes 81–165 for the α-diimino nickel complexes with bulky substituents. a 106 g·mol−1·h−1.
Scheme 2.
The structure of the complexes 81–165 for the α-diimino nickel complexes with bulky substituents. a 106 g·mol−1·h−1.

Figure 1.
Prediction plots between experimental and predicted catalytic activities, along with R2 and RMSE values of various ML models.
Figure 1.
Prediction plots between experimental and predicted catalytic activities, along with R2 and RMSE values of various ML models.

Figure 2.
(a) Order of descriptor importance by mean absolute SHAP values and (b) SHAP summary plot for 25 selected descriptors, in which red for higher values and blue for lower ones.
Figure 2.
(a) Order of descriptor importance by mean absolute SHAP values and (b) SHAP summary plot for 25 selected descriptors, in which red for higher values and blue for lower ones.

Figure 3.
Feature dependence plots for the top four important descriptors: (a) AATS8p; (b) MOMI-XZ; (c) MOMI-YZ; and (d) AATS7p, in which red dots denote the higher feature values, while blue indicates lower ones.
Figure 3.
Feature dependence plots for the top four important descriptors: (a) AATS8p; (b) MOMI-XZ; (c) MOMI-YZ; and (d) AATS7p, in which red dots denote the higher feature values, while blue indicates lower ones.

Figure 4.
Individual conditional expectation (ICE) plots for the top four important descriptors: (a) AATS8p; (b) MOMI-XZ; (c) MOMI-YZ; and (d) AATS7p, in which each line represents a predicted outcome for a specific instance, highlighting individual patterns, while the bold line shows the average trend across all observations.
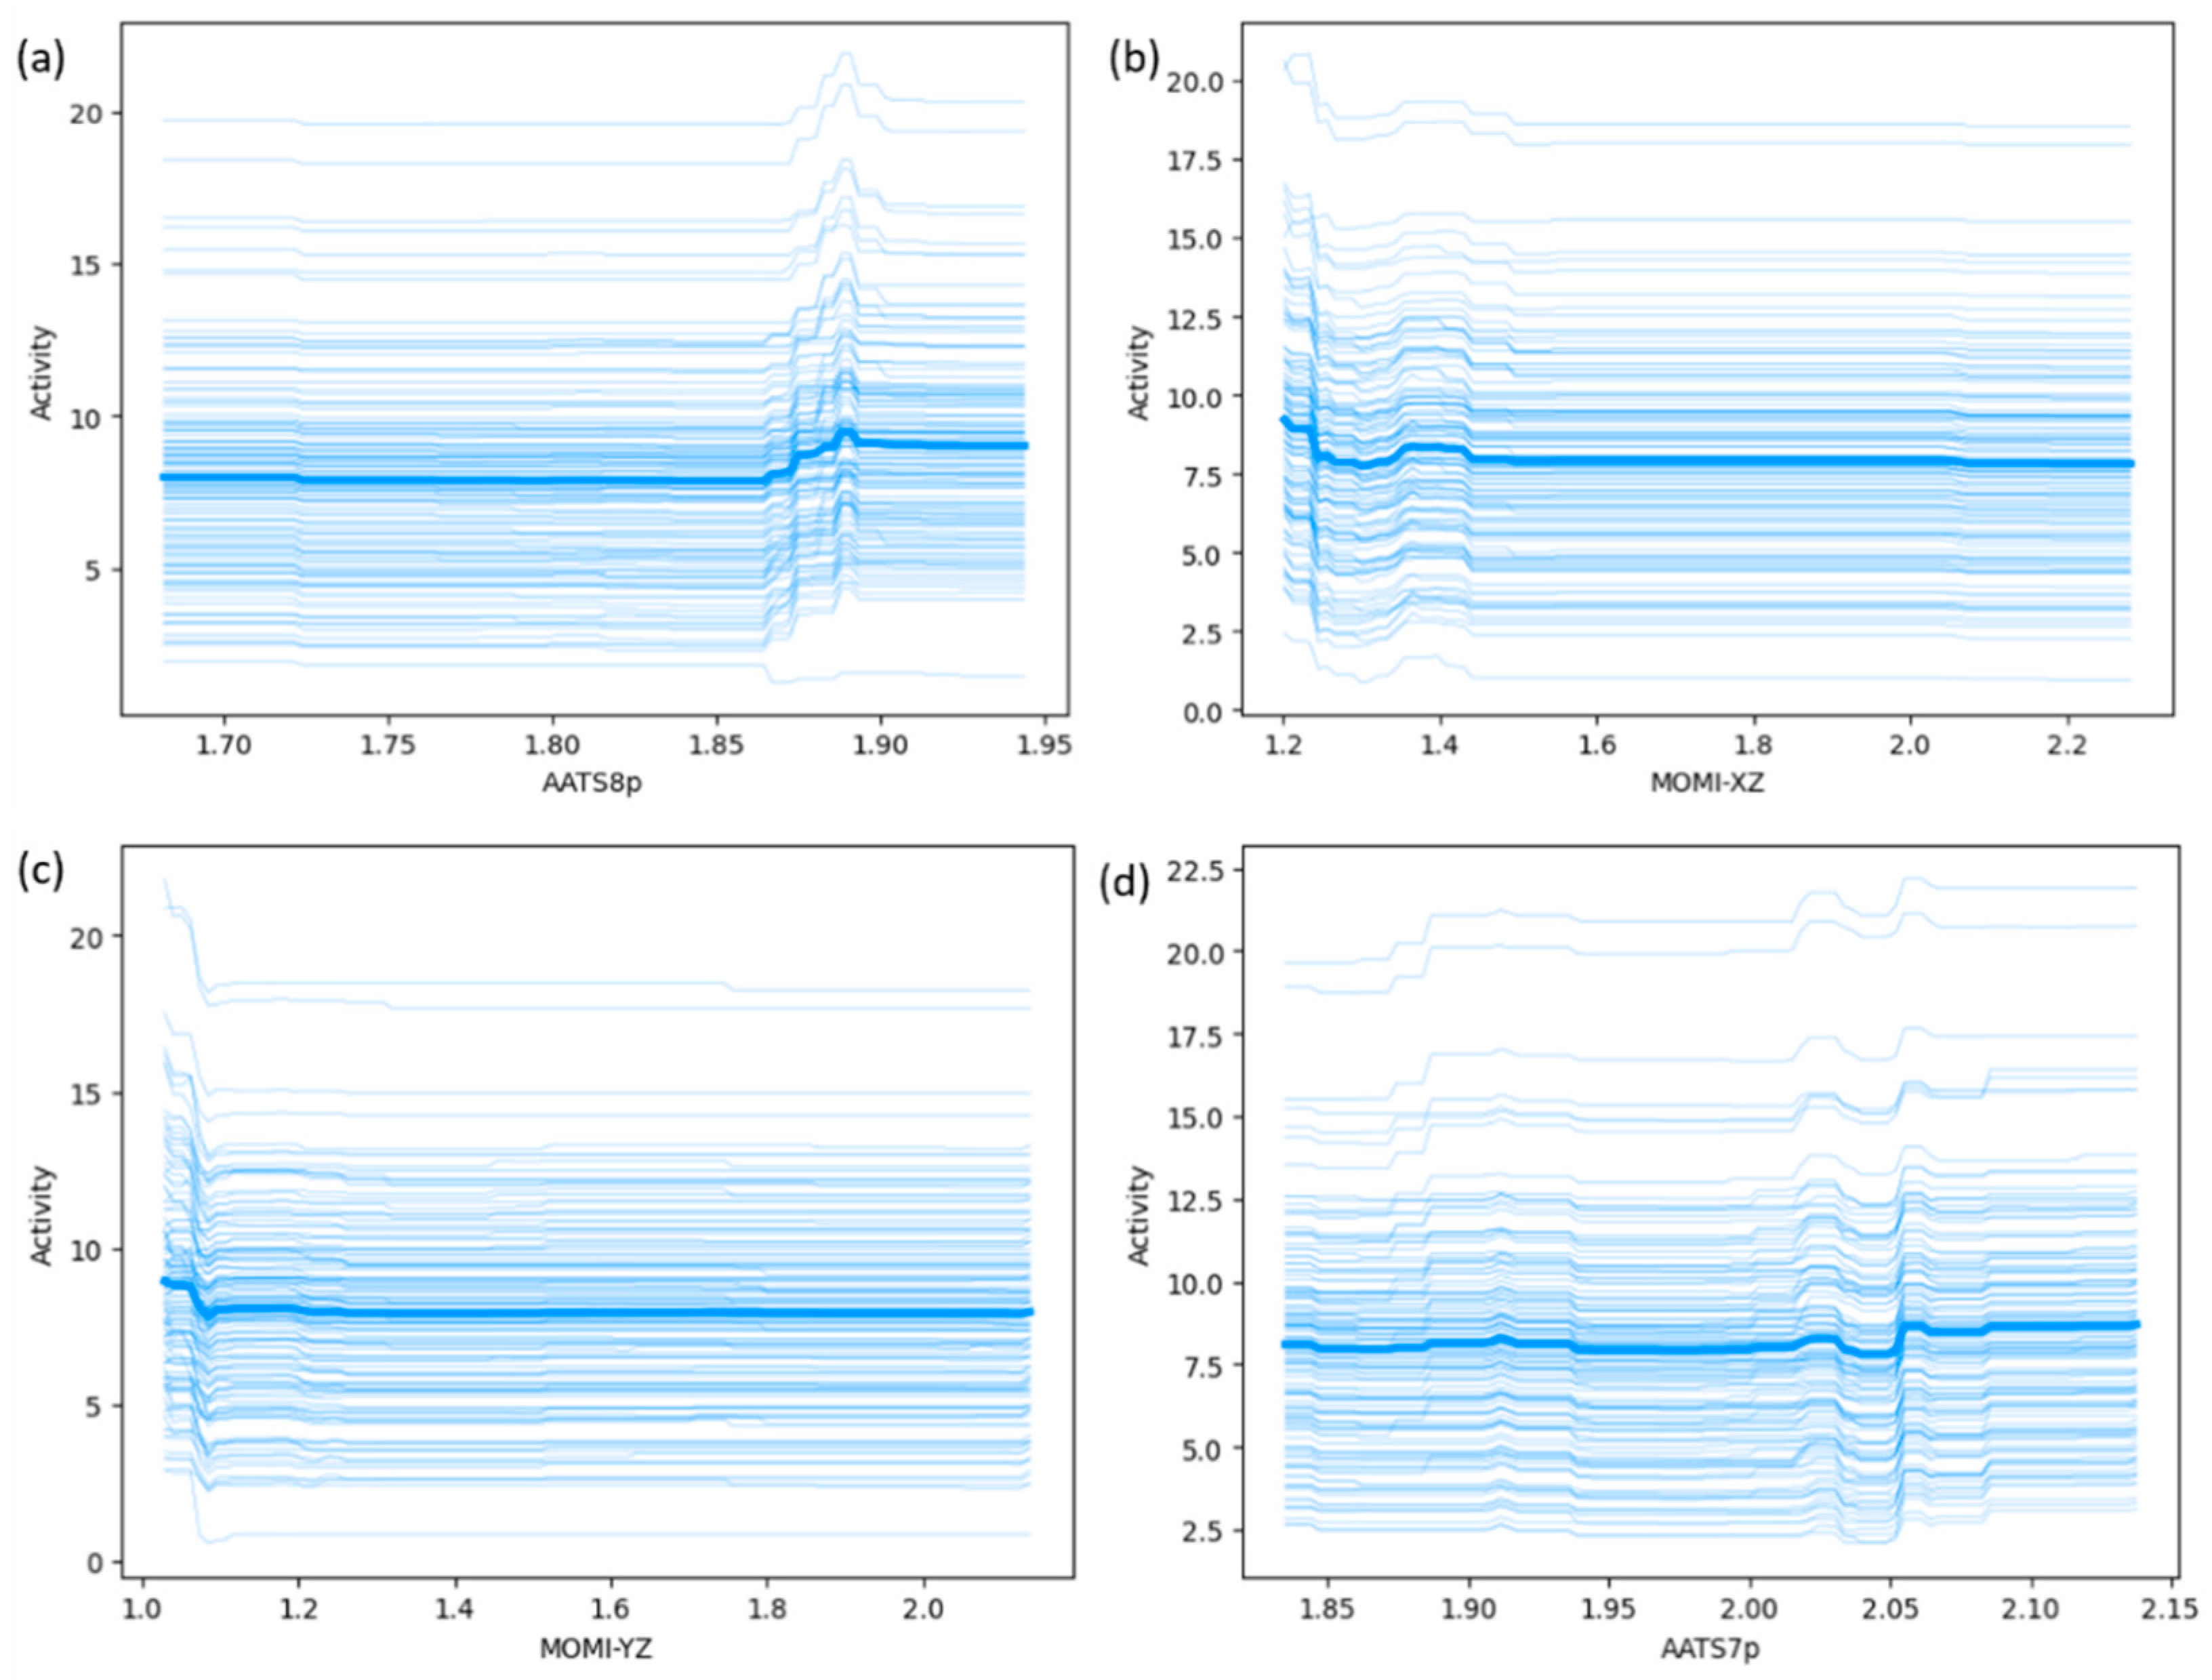
Figure 5.
The orientations of the xyz axes relative to the structure of the α-diimino Ni complex.

Table 1.
Performance evaluation of the proposed ML models based on R2, Q2, RMSE, and MAE for the training and testing sets.
Table 1.
Performance evaluation of the proposed ML models based on R2, Q2, RMSE, and MAE for the training and testing sets.
| Algorithm | Train R2 | Test Rt2 | Train MAE | Test MAEt | Train RMSE | Test RMSEt | Q2 (n_split = 4) |
|---|---|---|---|---|---|---|---|
| XGBoost | 0.999 | 0.921 | 0.094 | 0.697 | 0.120 | 0.859 | 0.561 |
| CatBoost | 0.991 | 0.896 | 0.285 | 0.714 | 0.346 | 0.978 | 0.537 |
| Extra Trees | 1.00 | 0.841 | 0.00 | 0.914 | 0.00 | 1.285 | 0.542 |
| Random Forest | 0.910 | 0.824 | 0.798 | 0.937 | 1.091 | 1.272 | 0.560 |
| k-Nearest Neighbors | 0.999 | 0.801 | 0.00 | 0.982 | 0.00 | 1.355 | 0.474 |
| LightGBM | 0.923 | 0.761 | 0.729 | 1.284 | 0.986 | 1.705 | 0.437 |
Disclaimer/Publisher’s Note: The statements, opinions and data contained in all publications are solely those of the individual author(s) and contributor(s) and not of MDPI and/or the editor(s). MDPI and/or the editor(s) disclaim responsibility for any injury to people or property resulting from any ideas, methods, instructions or products referred to in the content. |
© 2024 by the authors. Licensee MDPI, Basel, Switzerland. This article is an open access article distributed under the terms and conditions of the Creative Commons Attribution (CC BY) license (https://creativecommons.org/licenses/by/4.0/).
Share and Cite
MDPI and ACS Style
Abbas, Z.; Meraz, M.M.; Yang, W.; Yang, W.; Sun, W.-H. Catalytic Activity Prediction of α-Diimino Nickel Precatalysts toward Ethylene Polymerization by Machine Learning. Catalysts 2024, 14, 195. https://doi.org/10.3390/catal14030195
AMA Style
Abbas Z, Meraz MM, Yang W, Yang W, Sun W-H. Catalytic Activity Prediction of α-Diimino Nickel Precatalysts toward Ethylene Polymerization by Machine Learning. Catalysts. 2024; 14(3):195. https://doi.org/10.3390/catal14030195
Chicago/Turabian StyleAbbas, Zaheer, Md Mostakim Meraz, Wenhong Yang, Weisheng Yang, and Wen-Hua Sun. 2024. "Catalytic Activity Prediction of α-Diimino Nickel Precatalysts toward Ethylene Polymerization by Machine Learning" Catalysts 14, no. 3: 195. https://doi.org/10.3390/catal14030195
Note that from the first issue of 2016, this journal uses article numbers instead of page numbers. See further details here.