
Solar and Visible Light Illumination on Immobilized Nano Zinc Oxide for the Degradation and Mineralization of Orange G in Wastewater

Institute of Environmental Engineering, Hungkuang University, Taichung 433, Taiwan
*
Author to whom correspondence should be addressed.
Catalysts 2017, 7(5), 164; https://doi.org/10.3390/catal7050164
Submission received: 4 March 2017
/
Revised: 2 May 2017
/
Accepted: 10 May 2017
/
Published: 20 May 2017
(This article belongs to the Special Issue Heterogeneous Catalysis for Environmental Remediation)
Abstract
:An advanced oxidation process (AOP) utilizing immobilized zinc oxide (ZnO) photocatalyst was employed to decolorize and mineralize orange G (OG) azo dye in wastewater under solar and visible light irradiation. This AOP employed visible light and ZnO in a so-called Vis/ZnO process. Operating parameters, including ZnO dosage, initial OG concentration, pH, visible-light intensity, catalyst loaded area, and treatment volume were investigated to illustrate their influences on OG degradation and mineralization. From the results, neither visible light alone, nor the ZnO adsorption process could degrade or remove OG from wastewater. However, for the Vis/ZnO process, the higher ZnO dosage and visible light intensity are two major parameters to improve the OG degradation and total organic carbons (TOC) mineralization. The initial pH of 11 was the most effective pH condition on the OG degradation. The first-order rate constant is exponentially decreased from 0.025 to 0.0042 min−1 with the increase of the initial OG concentration and an empirical equation can be derived to estimate the first-order rate constant with a known initial OG concentration. In contrast, the first-order rate constant is linearly increased from 0.0027 to 0.0083 min−1 by increasing the visible light intensity. The results present that the Vis/ZnO process is an effective AOP for the degradation of OG in wastewater.
1. Introduction
Textile industrial wastewater demonstrates one of the most important categories of water pollution around the world because the demand for textile products has increased remarkably. The textile industry discharges more than 17%–20% of industrial water pollution, as reported by The World Bank [1]. Moreover, textile manufacturing utilizes more than 8000 chemicals among all processes. Many of these chemicals are poisonous and damaging to human health [1]. Usually, textile wastewater containing residues of spent dyes and chemicals shows high color, high chemical oxygen demand (COD), and is refractory to biological processes, mainly due to its high organic loads and recalcitrant dyes.
Generally, traditional wastewater treatment facilities utilizing coagulation and activated sludge processes are in charge of treating dyeing wastewater with residual dyestuff. Unfortunately, coagulation processes can decolorize dyestuff poorly resulting in serious sludge treatment problems. Biomass in the activated sludge process suffers from dyestuff toxicity and complication compositions of wastewater and the function of the biological process is limited [2]. Therefore, studies of more effective technologies with low environmental impact are needed.
The target pollutant, Orange G (OG), is categorized as an azo dye, which is the largest class among textile industry-applied commercial dyestuffs. The most important characteristic of azo dye is that it contains one or more nitrogen double bonds (–N=N–). Technologies dealing with the treatment of azo dyes in wastewater have been developed recently. Various physical, biological, and chemical methods treating dye-contaminated wastewater, including adsorption [3,4], coagulation [5], membrane filtration [6,7], biological treatment [8,9], chemical oxidation [10,11], as well as photocatalytic degradation [12], have been investigated. Chemical oxidation technology utilizing persulfate and activated by Fe(II), Fe(III), and zero valent iron (ZVI) was demonstrated to completely remove orange G azo dye and identified the reaction intermediates, such as aniline, phenol, catechol, maleic acid, etc. [10]. For the case of photocatalytic oxidation, lanthanum and vanadium co-doped TiO2 catalysts were shown to have larger specific surface area and mesopore volume than a pure TiO2 catalyst. The photodegradation of reactive blue 52 by La and V co-doped TiO2 was presented as being effective [12].
A very powerful environmental technology family, named advanced oxidation processes (AOPs), with various arrangements including UV irradiation, oxidants (ozone and hydrogen peroxide), Fenton reagents, and photocatalysts (titanium dioxide (TiO2) and zinc oxide (ZnO)), has been developed to degrade all different kinds of pollutants into carbon dioxide, water, and intermediates. The abovementioned AOPs are based on the production of the hydroxyl radical, which is a very strong oxidant and can react with wide range of pollutants non-selectively [13]. Among AOPs, a heterogeneous photocatalytic oxidation process, is very promising in the treatment of environmental pollutants. The light irradiation on the surface of the semiconductor causes the formation of electron/hole pairs. The reaction between the hole exists in the valence band and water absorbed on the surface of semiconductor forms hydroxyl radicals. The adsorbed oxygen is reduced by electrons in the conduction band to form superoxide radicals. Further reactions also form hydrogen peroxide and singlet oxygen, as well [14].
Photocatalytic processes utilizing TiO2 and ZnO are extensively applied in pollution treatment. The photochemical properties of ZnO, such as energy levels of conduction and valence bands, the electron affinity, are similar to TiO2. The ZnO catalyst is stable and nontoxic, as well as environmentally benign, and it absorbs a larger fraction of the solar spectrum than TiO2. Nevertheless, due to its large band width of 3.2 eV (λ = 380 nm) the ZnO catalyst shows significant photocatalytic activity in the UV region. Thus, coupling or doping techniques have been developed to enhance the photocatalytic reaction to cover the visible light region by reducing the band gap, extending the absorbance range to the visible region, and leading electron-hole pair separation. The most common dopants used for this purpose are transition metals, such as iron [14,15], copper [16,17], tungsten [18], cerium [19], manganese [20], and chromium [21]. Recently, a graphene oxide nanosheet was introduced to photocatalyst nanocomposites for its low light blocking, and high surface area, mechanical strength, and thermal conductivity. The nanocomposites supporting ZnO, CeO2, AgI, and CuI were applied to degrade various organic dyes efficiently under visible light irradiation [22,23,24,25]. However, the ZnO catalyst without metal oxide coupling and transition metal doping still maintains effective visible light photocatalytic power. Therefore, immobilizing the ZnO photocatalyst and proper design of the photoreactor may enhance the visible light ZnO photocatalytic (Vis/ZnO process) degradation of pollutants. Furthermore, researchers used carriers to immobilize the ZnO catalyst on the surfaces of chitosan and diatomite to facilitate the separation and recycling of the photocatalyst after reaction [26,27].
The aims of this study are to develop an immobilization technique for ZnO and an alternative reactor setup to improve the visible light operation for the Vis/ZnO process. Operating parameters, including ZnO dosage, initial OG concentration, pH, visible-light intensity, loaded area of the catalyst, and treatment volume were evaluated to present their effects on the degradation and mineralization of OG. Sampling and measurement of OG concentration, total organic carbons (TOC), pH, and oxidation reduction potential (ORP) were used to assess the effectiveness of this Vis/ZnO process.
2. Results and Discussion
2.1. Characteristics of Immobilized ZnO and the Synergic Effect of Visible Light/ZnO Photocatalyst
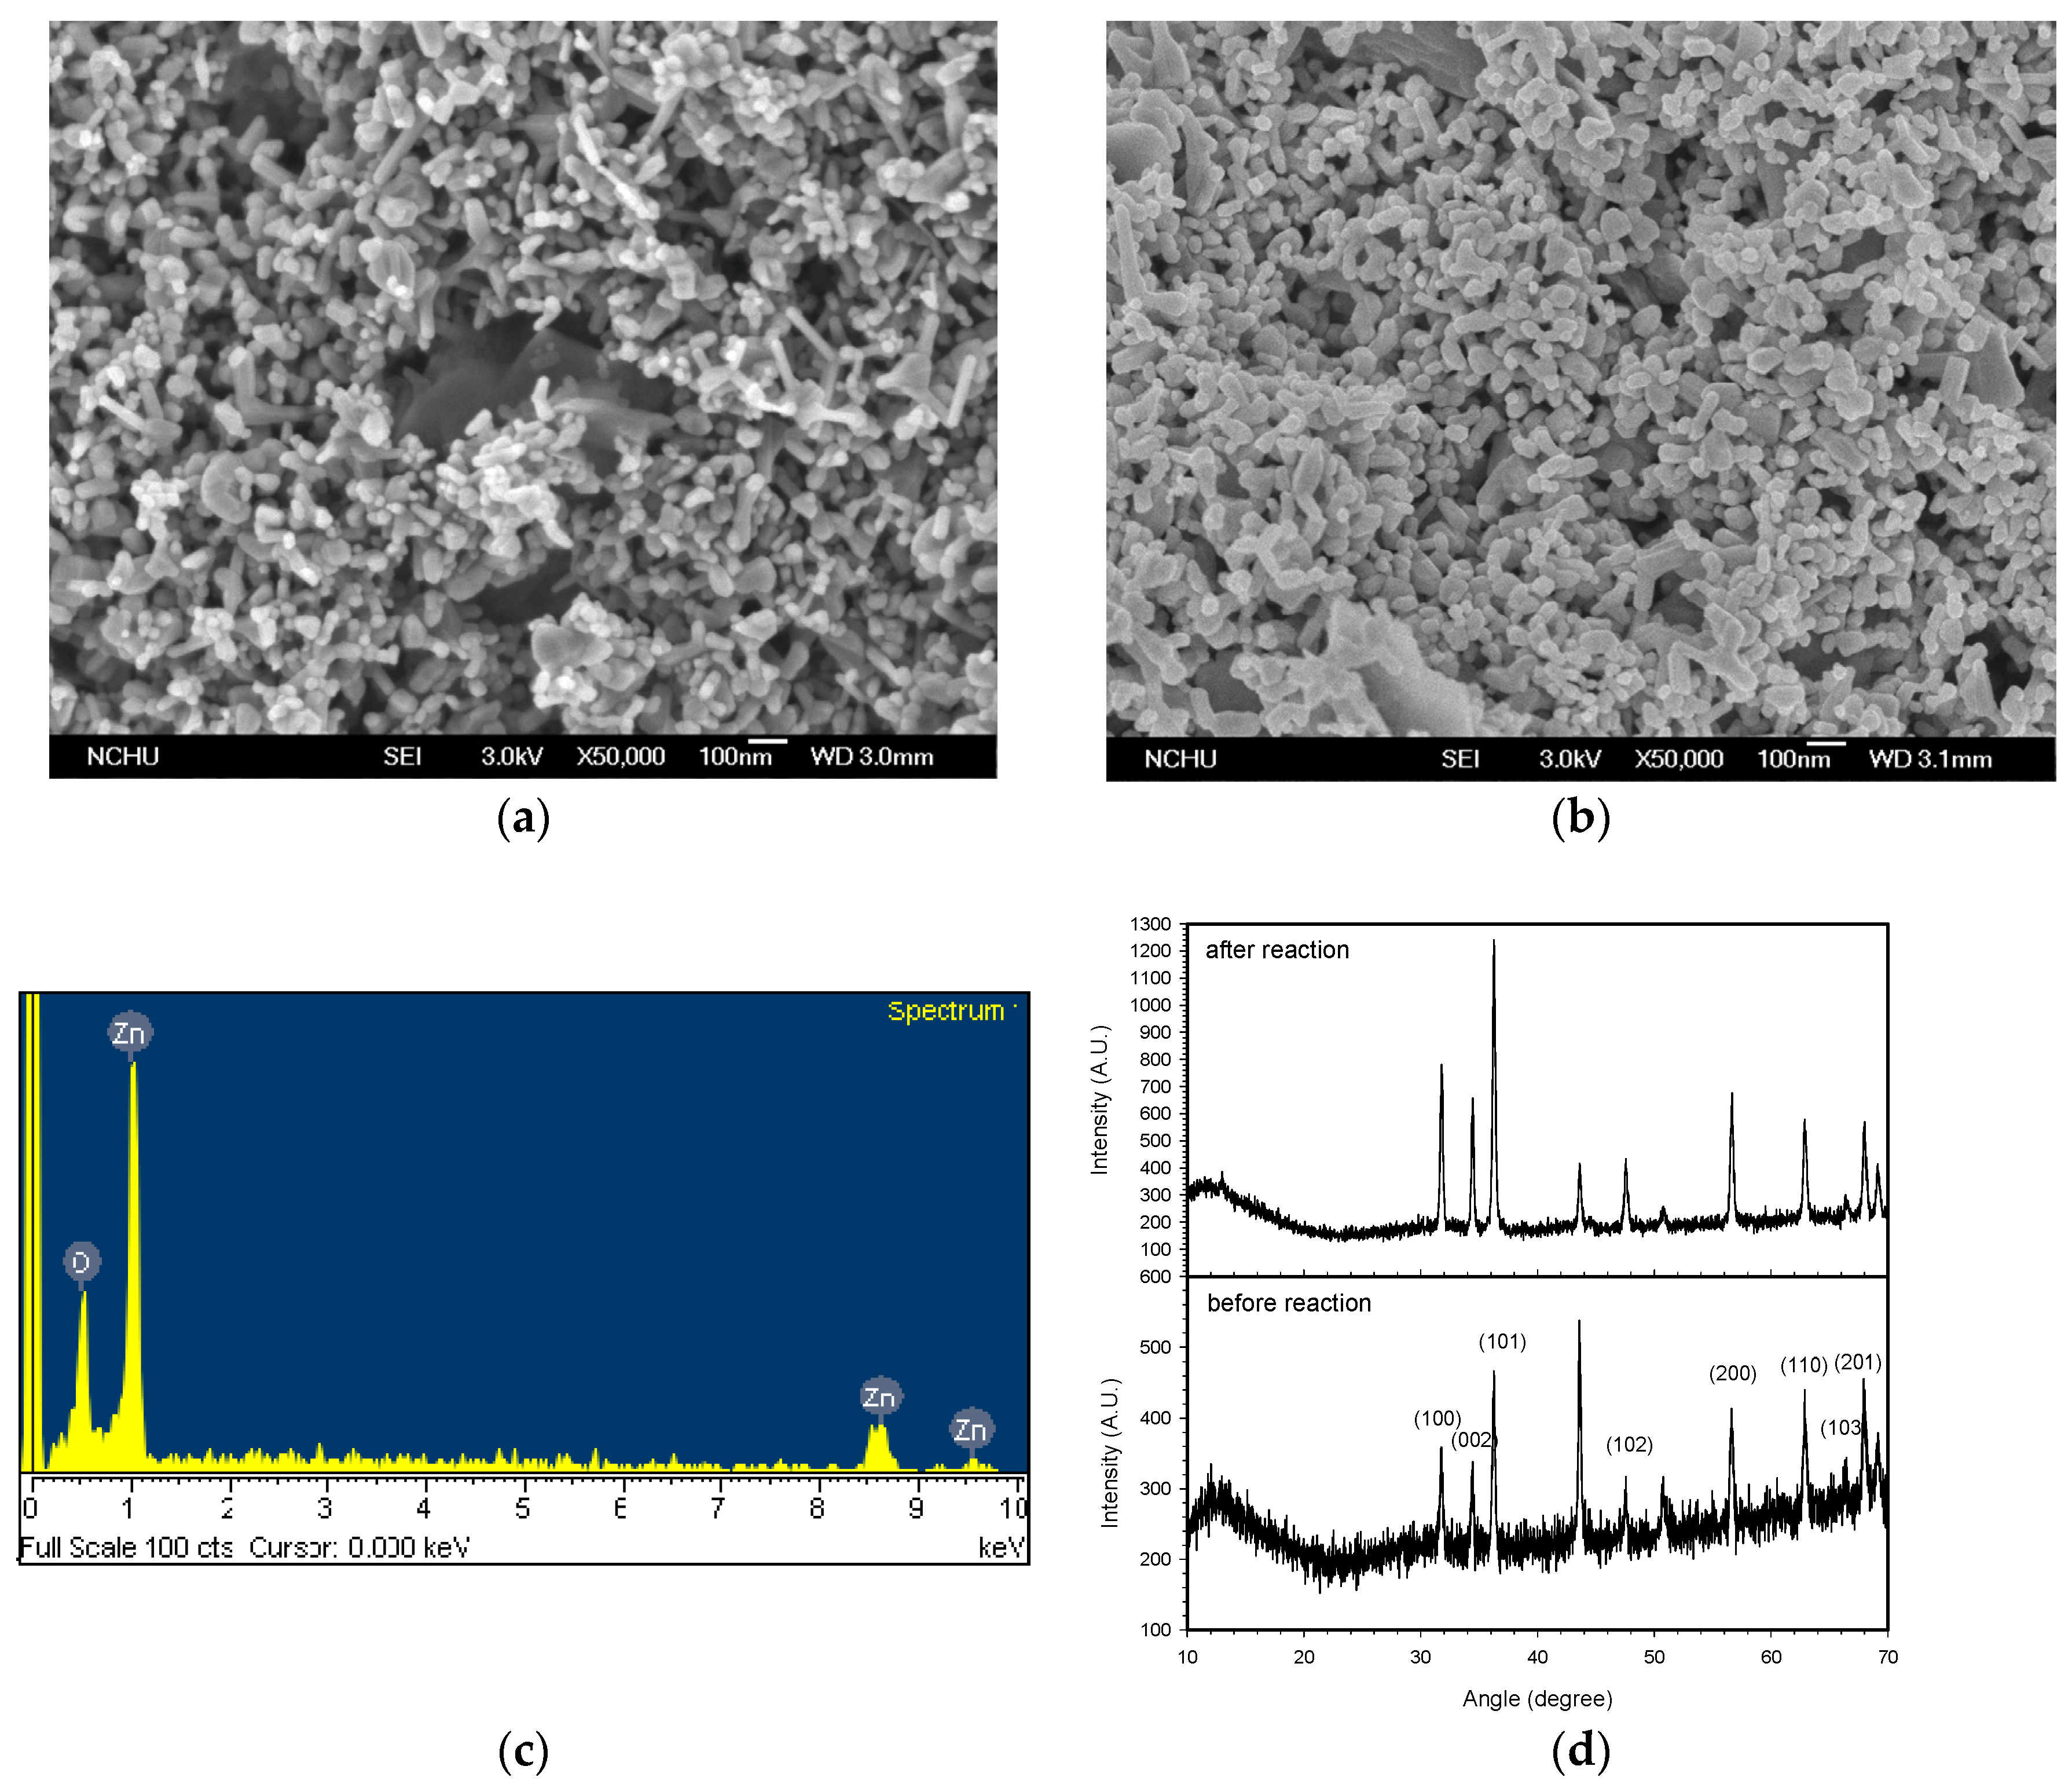
The characteristics of the immobilized ZnO photocatalyst on the steel mesh were determined by various instruments and reported to have a Brunauer-Emmett-Teller (BET) specific surface area of 7.14 m2 g−1, porosity of 5.69 Å, and an average particle size of 43 nm. By adjusting the weight ratio of ZnO and the steel mesh, i.e., 1.5 g ZnO was immobilized on 9.3 g steel mesh, the specific surface area contributed by ZnO particles was calculated to be 51.41 m2 g−1. From field emission scanning electron microscope (FESEM) imagery (Figure 1a), uniform distribution of ZnO particles on the steel mesh surface and space within the mesh eyes can be observed. From the figure, the shape of the ZnO particles is observed to be cylindrical, and the particle size of ZnO is about 30–50 nm for the cylindrical diameter. The FESEM image after the photocatalytic reaction is presented in Figure 1b and demonstrates a similar size and shape of ZnO particles on the steel mesh. The changes are slightly larger in size and slightly curvier in shape. EDS scanning gives 76.25% of Zn and 23.75% of oxygen by weight percentage (Figure 1c). A thin-film X-ray diffractometer (XRD), X-RAY/TF, was utilized to obtain the XRD spectra before and after the photocatalytic reaction. Both spectra in Figure 1d show a similarity to the standard ZnO spectrum with only 44 degree higher absorbance, as shown in Figure 1d, before and after the photocatalytic reaction. The XRD spectra of immobilized ZnO on the steel mesh are perfectly matched with the standard ZnO spectrum and show the stability of the immobilized ZnO catalyst. Furthermore, the stability of the immobilized ZnO catalyst was tested in our previous work under UV 365 irradiation for 10 cycles and found that OG removal efficiency at the end of the reaction for 10 runs can all reach 100% in 120 min [28]. However, the TOC removal efficiency dropped from 90% to 78% after repeating 10 runs. Meanwhile, there was almost no ZnO catalyst loss (0.04%) after 10 runs, as verified by Atomic Absorption Spectroscopy (AA) measurement of the Zn solution concentration. Thus, the loss of the TOC-mineralization capability may be caused by surface poisoning of the ZnO catalyst after 10 runs.
To differentiate the decolorization effects from visible light irradiation, ZnO adsorption, and photocatalytic degradation, a set of control experiments were performed by using visible light irradiation alone, ZnO catalyst-coated steel mesh alone, and combining both visible light and the ZnO catalyst for degrading OG in wastewater (data not shown). The operating conditions were preset at an initial OG concentration of 50 mg L−1, ZnO dosage of 60 g m−2, and six cold cathode fluorescent lamps (CCFL) with measured light intensity of 9600 Lux in the visible region, with a 300 min reaction duration. The decolorization and degradation of OG was evaluated through the change in American Dye Manufacturers’ Institute (ADMI) color units, because ADMI color units represent the overall absorbance of various color regions. It is not a surprise that the control set of visible light irradiation alone and ZnO catalyst alone experiments are not able to even decolorize OG at observable levels. Accordingly, visible light irradiation on the ZnO catalyst surface generates electron-hole pairs and further produces hydroxyl radicals, superoxide radicals, hydrogen peroxide, and singlet oxygen for the synergic degradation of OG in aqueous solution. Thus, the combined Vis/ZnO system demonstrated effective degradation of OG and obtained 84.3% ADMI removal efficiency with a 300 min reaction time.
The pseudo-first-order kinetics are widely adapted for AOP studies. The kinetic equations can be expressed as follows:
where COG,0 designates the initial concentration of OG and COG is the concentration of OG at time t in mg L−1. k1 denotes the pseudo-first-order reaction rate constant in min−1 and t is the reaction time in min. In this work, ADMI color units were used to represent the OG concentration.
Furthermore, through first-order kinetics treatment of the experimental data, the pseudo-first order rate constant of the Vis/ZnO process is obtained as 0.0105 min−1, which is 2.23 times higher than that of Vis/TiO2 (utilizing P25 TiO2) at 0.0047 min−1. A similar observation was revealed by Sakthivel et al. [24]; they concluded that the higher photo-activity of ZnO is caused by the large fraction of the solar spectrum and more light quanta absorption by ZnO than TiO2. At the same time, Akyol et al. [25] also reported that the ZnO is more active than TiO2 for the decolorization of Remazol Red RR dye in a suspension system, and the reasons are due to the beneficial effects on the band gap energy, the charge carrier density, and the crystal structure of ZnO to reflect its great quantum efficiency.
2.2. Effect of ZnO Dosage
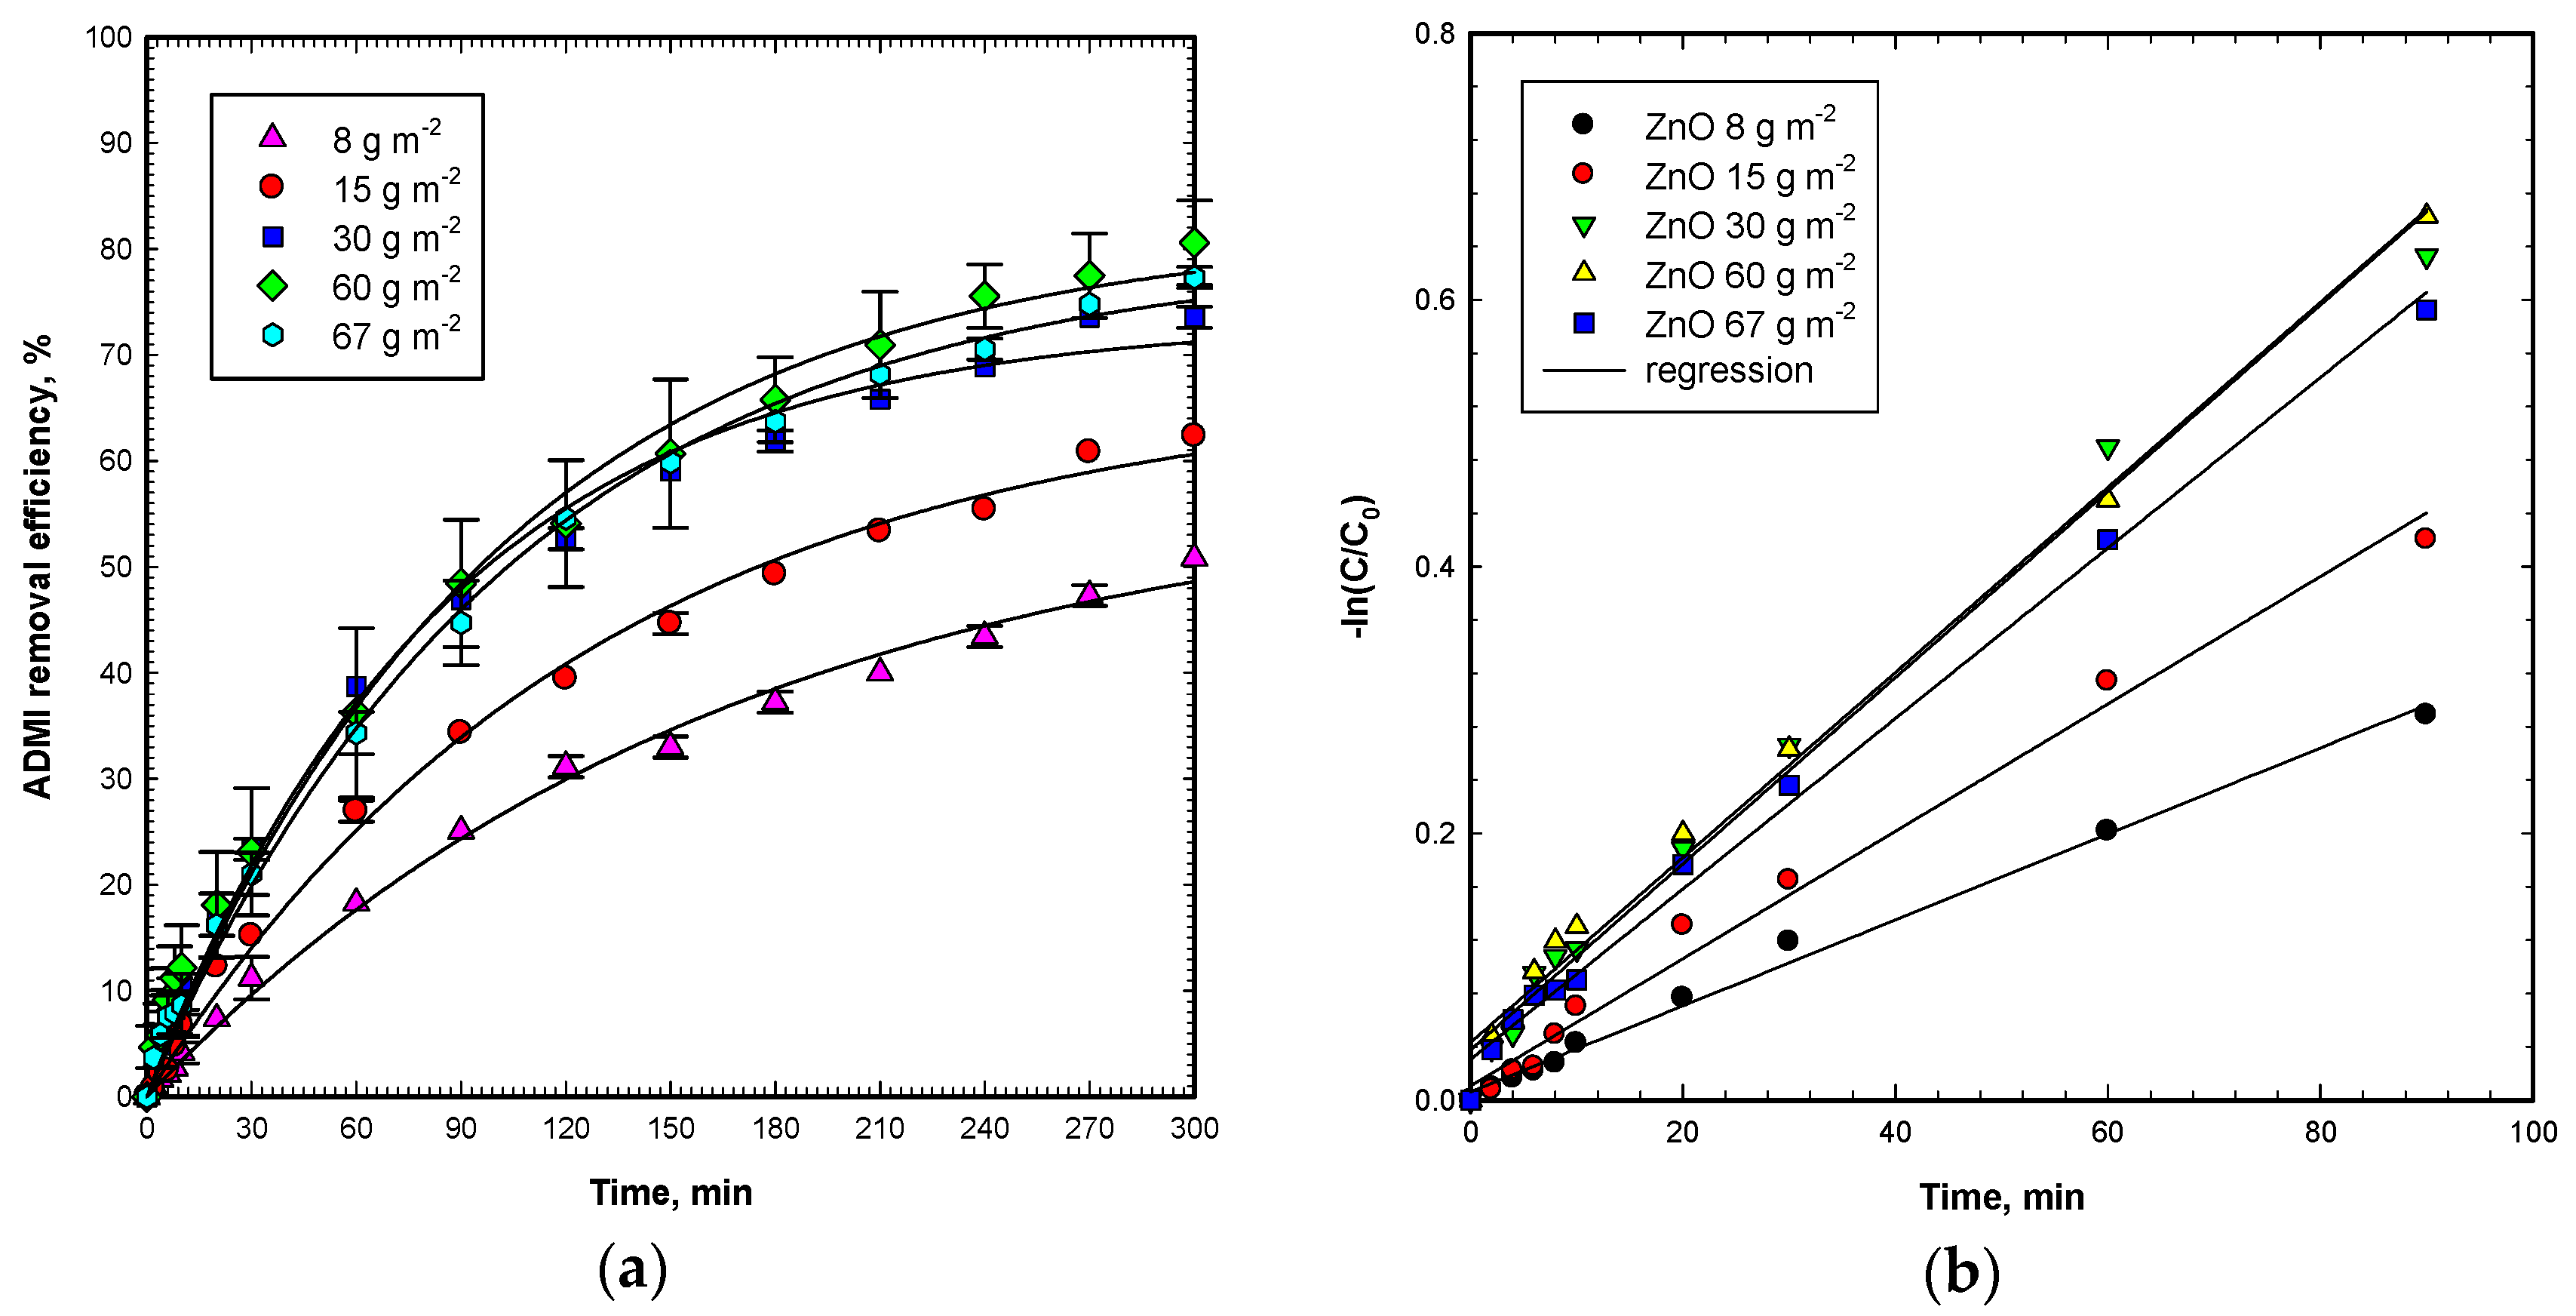
The ADMI color removal was tested under various ZnO catalyst dosages of 8–67 g m−2, initial OG concentration of 50 mg L−2, and visible light intensity 9600 Lux for a period of 300 min. The results in Figure 2a present that the ADMI removal improves from 50.8% to 80.6% in 300 min when the surface loading of ZnO particles increases from 8 to 60 g m−2. Moreover, the ADMI removal then reduces from 80.6% to 77.3% when the surface loading of ZnO further increases from 60 to 67 g m−2, respectively. Thus, an optimal ZnO dosage for OG degradation is observed to occur at 60 g m−2. For surface loading of ZnO higher than 60 g m−2, the ZnO catalyst on the top layers will shield the visible light from the ZnO catalyst at the lower layer to reduce the photocatalytic activity, thus moderating the ADMI removal efficiency and reaction rate. For the suspension system, Sakthivel et al. [24] reported an optimum ZnO loading of 2.5 g L−1 for solar irradiation on the ZnO suspension. They further explained that the increase in turbidity reduces the light transmission through the solution, once over this optimum ZnO loading, and it moderates the photocatalytic activity of ZnO. Akyol et al. [25] also obtained an optimum ZnO loading of 1.0 g L−1 for methyl orange degradation. Similarly, Akyol et al. concluded that the photon absorption rate is affected by the scattering of the photocatalyst particles to reduce the photocatalytic activity. However, few investigations discuss the effect of photocatalyst loading for immobilized systems. Zhu et al. immobilized SnO2/ZnO in a chitosan matrix and revealed an optimum dosage of 0.7 g L−1 [22]. In this case, the immobilized catalyst was operated as a traditional suspension system. For various supported ZnO reactors, the ZnO loadings were reported by Akyol and Bayramoglu [26] between 0.19 to 0.27 mg cm−2 depending on the geometry and type of support. Therefore, no investigation on ZnO optimum loading for the immobilized form was reported.
The rate constants of OG degradation through the Vis/ZnO process for various ZnO loadings follow a similar trend as the ADMI removal. By applying pseudo-first-order reaction kinetics, the rate constants are calculated through linear regression for the first 90 min period. As shown in Figure 2b, the rate constants are calculated to be 3.2, 4.8, 7.0, 6.9, and 6.4 (×10−3 min−1) at the surface ZnO loading dosages of 8, 15, 30, 60, and 67 g m−2, respectively. The regressions are with good agreement (r2 = 0.987–0.995). It is worth noting that the maximum rate constant occurred at a ZnO loading of 30 g m−2, but it is almost the same with that at 60 g m−2. In conclusion, the higher surface loading of ZnO reaches higher ADMI removal efficiencies and rate constants. Moreover, the rate constants for the Vis/ZnO process are 0.0032 and 0.0070 min−1 at an OG initial concentration of 50 mg L−1 and ZnO dosage of 8 and 60 g m−2, respectively. It is about a two times increase of the first-order rate constant for a 7.5 times increase in the ZnO dosage. The rate constants are in the same order of magnitude as reported by Zhu et al. of 0.00559 min−1 for 50 mg L−1 methyl orange decolorization by visible light irradiation on SnO2/ZnO-immobilized chitosan film [22]. Likewise, the rate constants reported by Mittal et al. of 0.00306 to 0.00746 min−1 for 10 mg L−1 crystal violet decolorization by visible light irradiation on Cu-doped ZnO were in the same range [20]. The results imply that the higher surface loading of ZnO under visible light irradiation can give more electron/hole pairs, as well as hydroxyl and superoxide radicals, singlet oxygen, and hydrogen peroxide, which contribute to the degradation of OG molecules and its chromophores. Therefore, the removal efficiency and degradation rate increase with the increase of ZnO surface loading before reaching the optimal surface loading of ZnO.
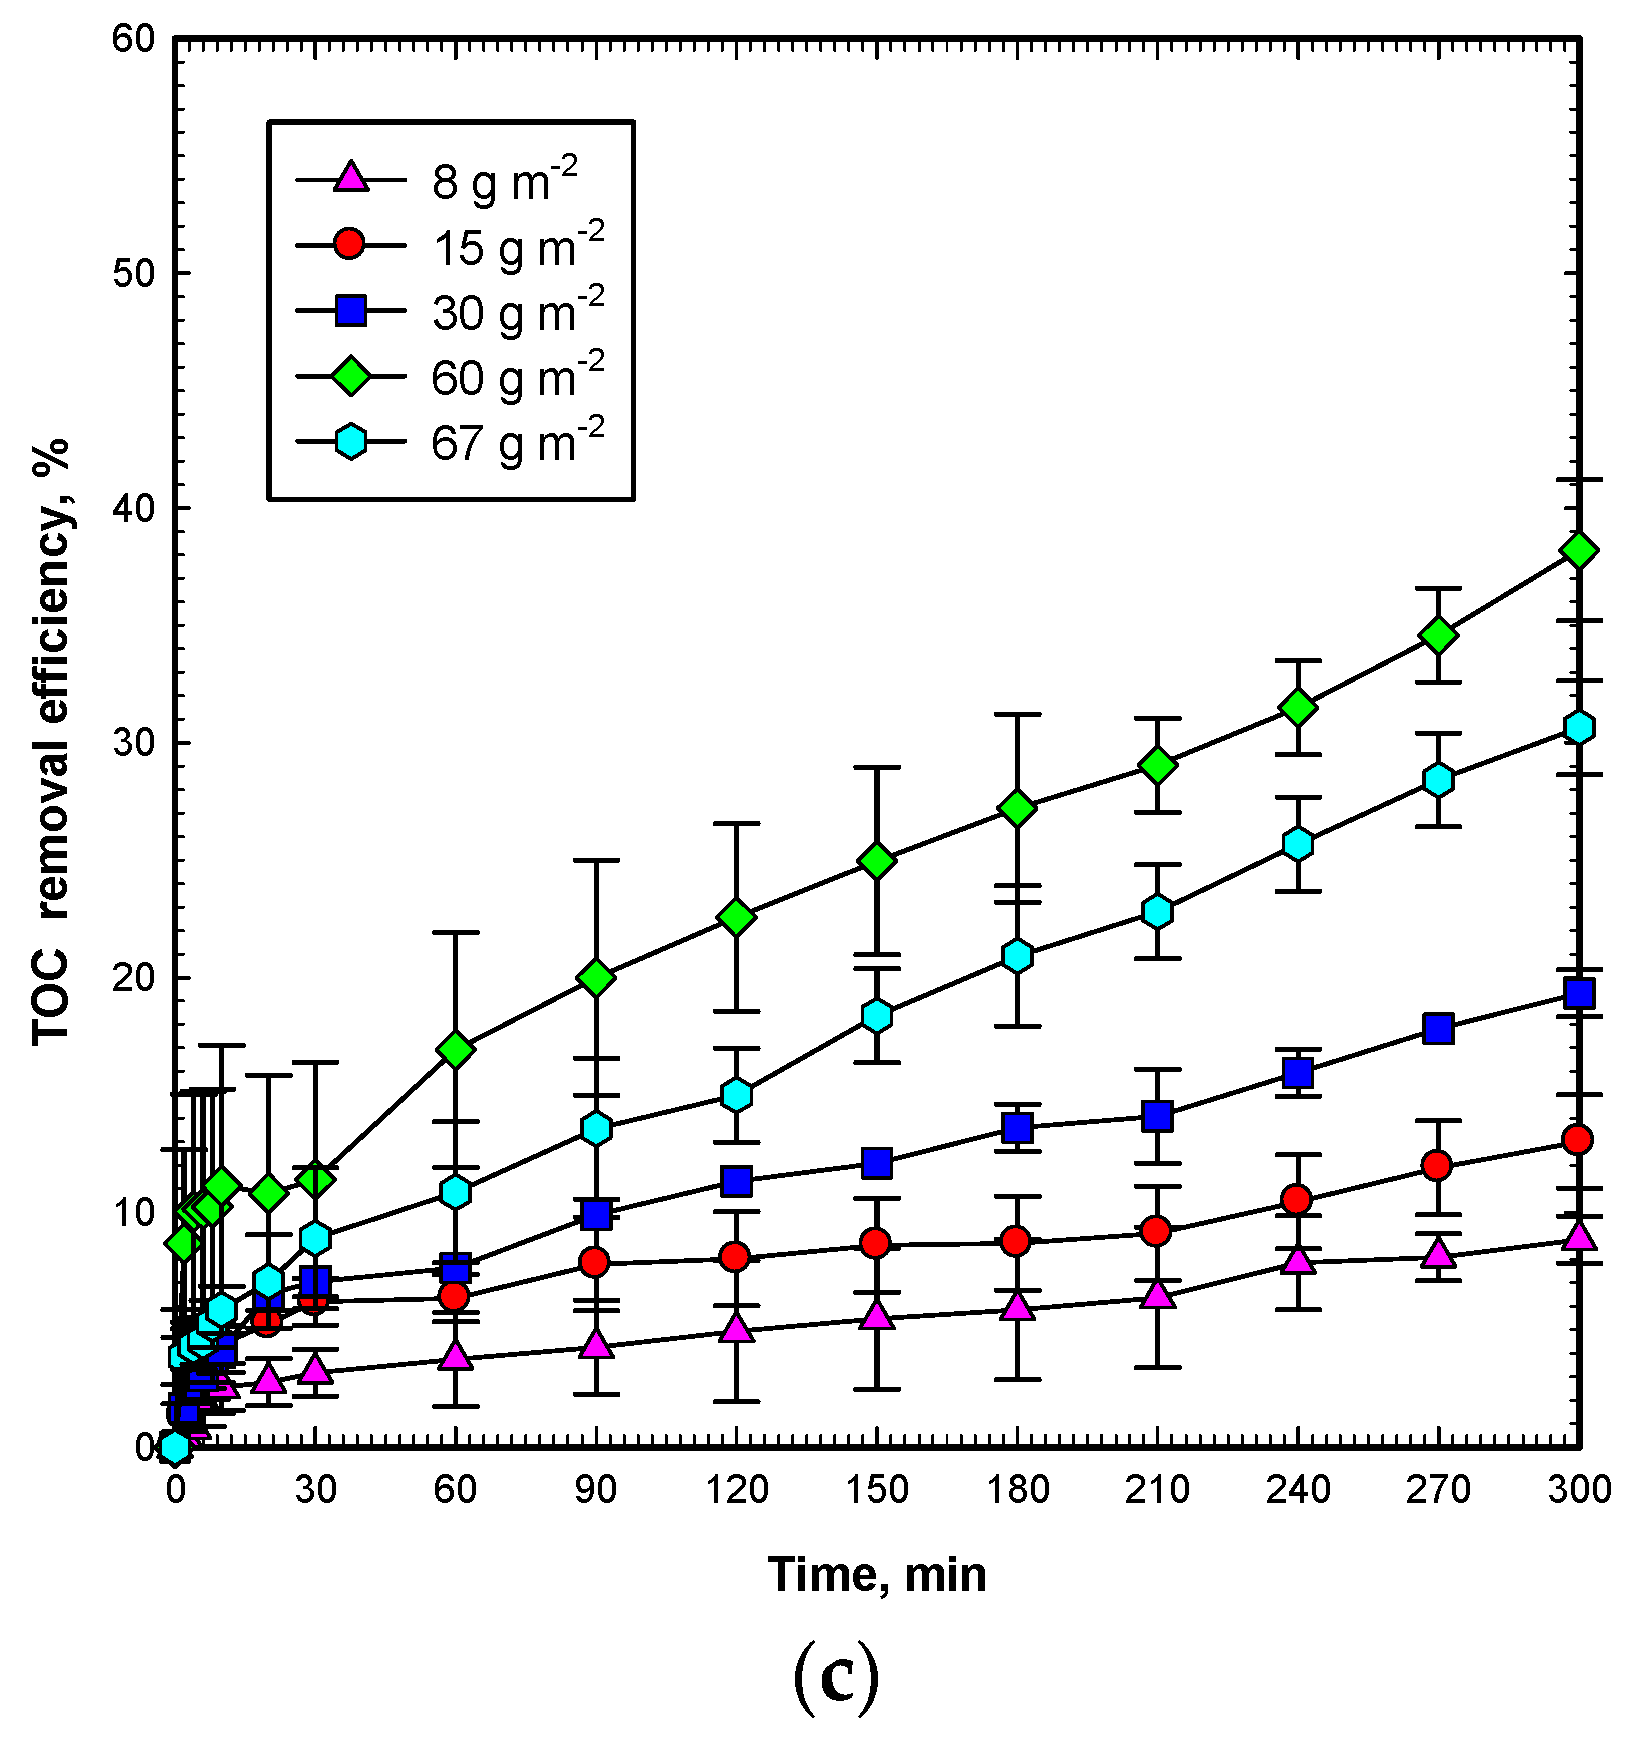
The TOC value represents the total organic carbons concentration in the solution. It is an important indicator of mineralization. At the beginning of the oxidation reaction by the oxidation species, such as hydroxyl radicals, superoxide radicals, hydrogen peroxide, and singlet oxygen, the solution TOC is hardly diminished. In the time region of less than 10 min, OG molecules are destroyed to lower molecular weight intermediates with a contribution to the TOC measurement. Therefore, in this region, TOC removal efficiency may persist slightly changed. After this lag phase (10 min), TOC can be diminished to the end of the reaction. In Figure 2c, under a low ZnO dosage as 8 g m−2, the results show that TOC is hardly mineralized by the Vis/ZnO process. For a higher ZnO dosage of 60 g m−2, TOC removal efficiency increases to about 38.2% in 300 min. For the highest dosage of 67 g m−1, the TOC mineralization efficiency drops from 38.2% to 30.6% for a reaction time of 300 min. It is correlated to the ADMI removal, and the optimal ZnO dosage is at 60 g m−2. In general, AOPs with long reaction times can mineralize the TOC from pollutants effectively. However, for the case of the visible light photocatalytic process, the Vis/ZnO process shows weakness in mineralizing OG. It is concluded that TOC mineralization is more difficult than that of OG decolorization by the Vis/ZnO process. In order to decolorize OG, as well as mineralize TOC, higher light intensity and longer irradiation time are required.
The results in Figure 3a show that the rate constant increases proportionally to the ZnO dosage for OG degradation by Vis/ZnO. The rate constant increases with the increase of the ZnO dosage up to 30 g m−2, and from the ZnO dosage of 30–60 g m−2, the rate constant remains almost unchanged. For the highest ZnO dosage, the rate constant dropped from 0.069 to 0.064 min−1, slightly. The comparison of TOC removal efficiencies for various ZnO dosages on the Vis/ZnO process is illustrated in Figure 3b. The figure illustrates that TOC removal efficiency increases linearly with the ZnO dosage for OG mineralization by the Vis/ZnO process. The TOC removal rises with the increase of the ZnO dosage up to 60 g m−2. In contrast, for the ZnO dosages of 60–67 g m−2, the TOC removal efficiency drops from 38.3% to 30.6%, significantly. The decolorization rate is observed to be higher than that of demineralization rate. This implies that the bonding of the OG dye chromophore is easier to destroy than that the organic carbons.
2.3. Effect of Initial OG Concentration
Experiments were implemented at OG initial concentrations of 12.5–75 mg L−1, ZnO dosage of 60 g m−2, and 9600 Lux visible light intensity for a period of 300 min. Results in Figure 4a demonstrate that the degradation of OG is fast and complete in OG concentrations less than 25 mg L−1. For OG concentrations of 50 and 75 mg L−1, The ADMI removal efficiencies are 84.3% and 72.0%, respectively. The decolorization capability of the Vis/ZnO process is fairly good for initial OG concentration ranges from 12.5 to 75 mg L−1.
As summarized in Figure 4b, the pseudo-first-order rate constant declines with the increase of the initial OG concentration exponentially. Furthermore, the correlation of the rate constant and initial OG concentration can be expressed as follows (COG,0 denotes the OG initial concentration):
In Figure 5b, the first-order rate constants for all initial OG concentrations by the Vis/ZnO process are summarized. In the figure, the first-order rate constant, k1, declines exponentially by increasing the initial OG concentration from 12.5 to 75 mg L−1. The results are consistent with the observations by previous work that the pseudo-first-order rate constant declines with an increase in the initial dye concentration reported by Zhu et al. [22]. The observation can be explained that when irradiating under visible light, the limited numbers of active sites on the ZnO catalyst surface controls OG decolorization, while increasing the OG initial concentration, the path length of photons entering the reaction solution declines, which also reduces the formation of hydroxyl radicals, superoxide radicals, hydrogen peroxide and singlet oxygen at the same time.
2.4. Effect of Visible Light Intensity
Light intensity is an important operating parameter to affect the treatment efficiency of a UV- or visible light-based AOP. As reported in our previous work, the higher UV intensity that was applied, the faster the pollutant degradation is conducted. Therefore, the rate constant rises as UV intensity increases, while the same persulfate dosage is applied [29]. Similarly, the higher the power of visible light irradiation applied to the ZnO catalyst, the more abundant the hydroxyl radicals, superoxide radicals, hydrogen peroxide, and singlet oxygen that are produced to react with the target pollutants. Therefore, this implies that the higher the visible light intensity employed, the faster the OG degradation and mineralization. Results in Figure 5a demonstrate that the higher visible light intensity ensures faster OG degradation. The effect of visible light intensity on the rate constant is summarized in Figure 5b. This demonstrates that the rate constant increases with light intensity linearly in the Vis/ZnO process. Sakthivel et al. reported the treatment of acid brown 14 by a solar/ZnO process in a 100 mL batch reactor with a light intensity of 1.32–1.37 × 10⁵ Lux. They suggested that the decolorization rate of dye rises with the light intensity, which is consistent with this work [24]. Furthermore, the correlation of the rate constant and visible light intensity can be expressed as follows (I denotes the visible light intensity in Lux):
2.5. Effect of pH
pH is an important operating parameter which affects the photocatalytic degradation process. The effect of the pH value on the degradation of OG by the Vis/ZnO process was investigated in the pH range of 2–11 at a constant initial OG concentration (50 mg L−1), ZnO dosage (60 g m−2), and visible light intensity (9600 Lux). Results in Figure 6a indicate that at an original pH of 5.3, the OG removal efficiency reaches 84.3% in 300 min of the Vis/ZnO reaction. At acidic pH of 2 and 3, and alkaline pH of 9, the OG degradation efficiencies reach 72.4%–77.3%, with lower reaction rates. This concludes that adjusting pH by either HCl or NaOH will result in hindering effects on OG degradation by the Vis/ZnO process. On the other hand, the pH 11 condition shows the highest OG degradation efficiency of 88.2% and the maximum rate of degradation. Figure 6b summarizes the rate constants for all pH conditions and the rate constants are in the range of 0.0059–0.0136 min−1. In this figure, the pH 11 condition presents the highest rate constant among all conditions. Sakthivel et al. also reported the maximum degradation rate at alkaline pH 10 [24]. The pH condition shows two effects on ZnO catalytic degradation of OG. Firstly, the zero point of charge (zpc) of ZnO is 9.0 and the surface is positively charged in the acidic condition. In contrast, the surface of the ZnO catalyst is negatively charged in the alkaline condition when pH > pHzpc. Thus, for OG as an anionic dye, the adsorption of OG on the ZnO surface is not favored in the alkaline pH 11 condition. Secondly, in the alkaline condition, the presence of a large quantity of hydroxyl ions on the ZnO surface in the alkaline solution favors the formation of hydroxyl radicals, which enhances the degradation of OG in the Vis/ZnO process [28].
2.6. Effect of the Loaded Area of the Catalyst and Treatment Volume
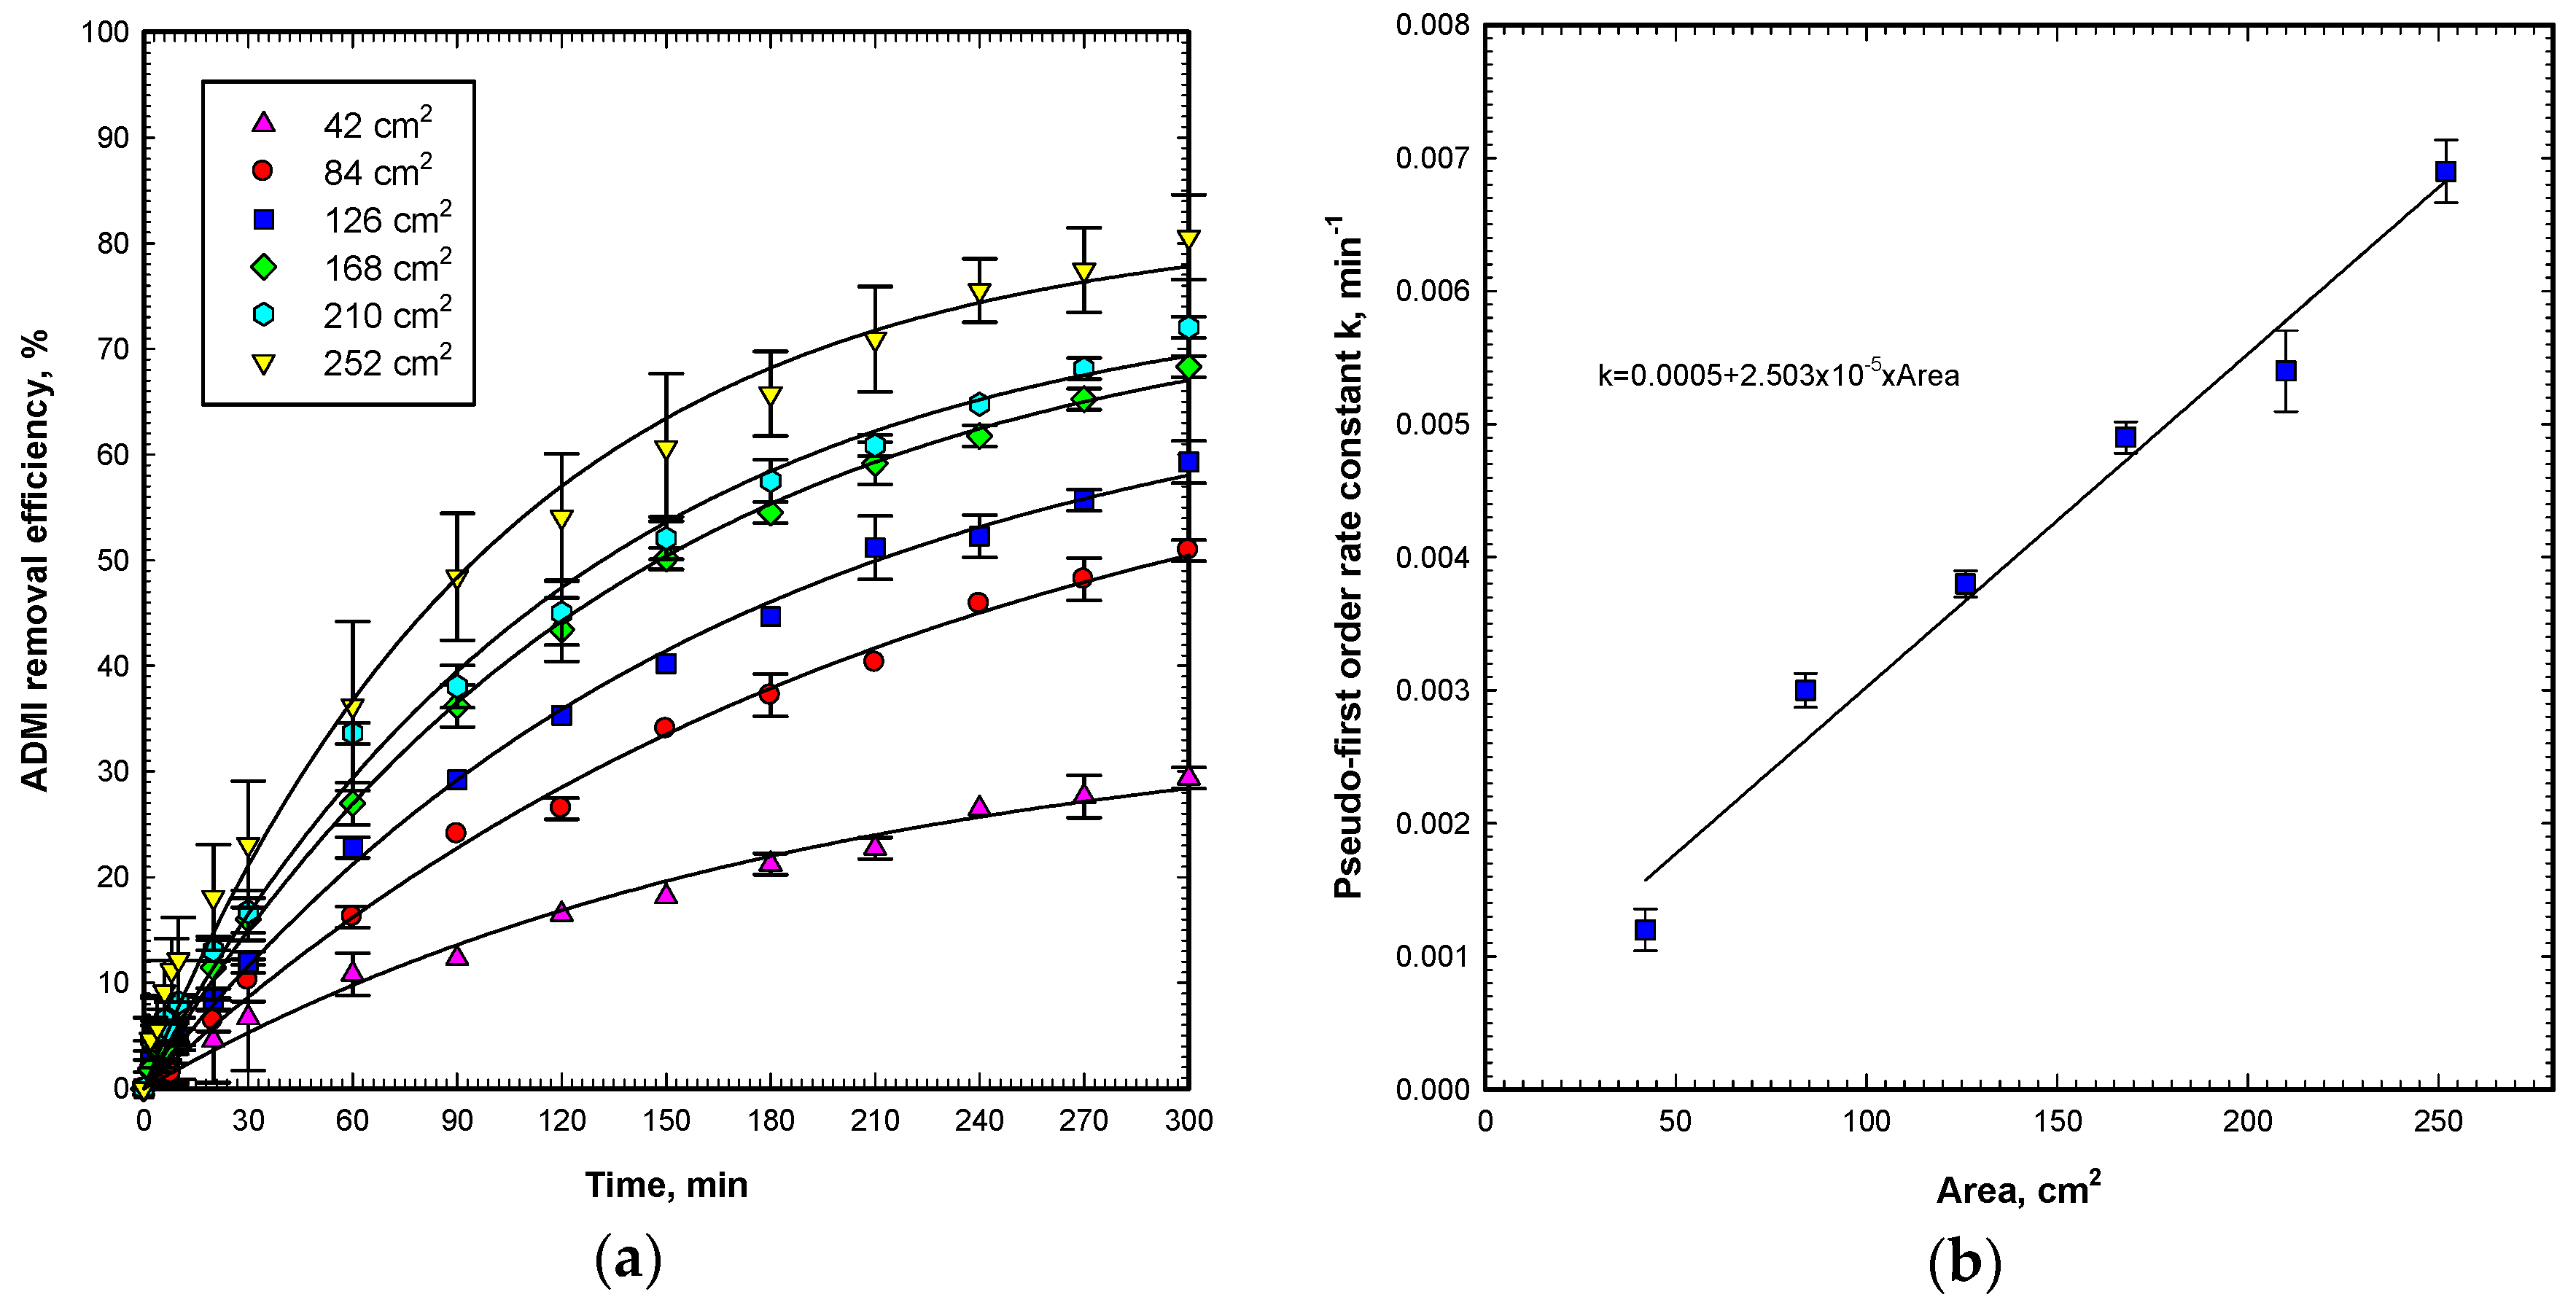
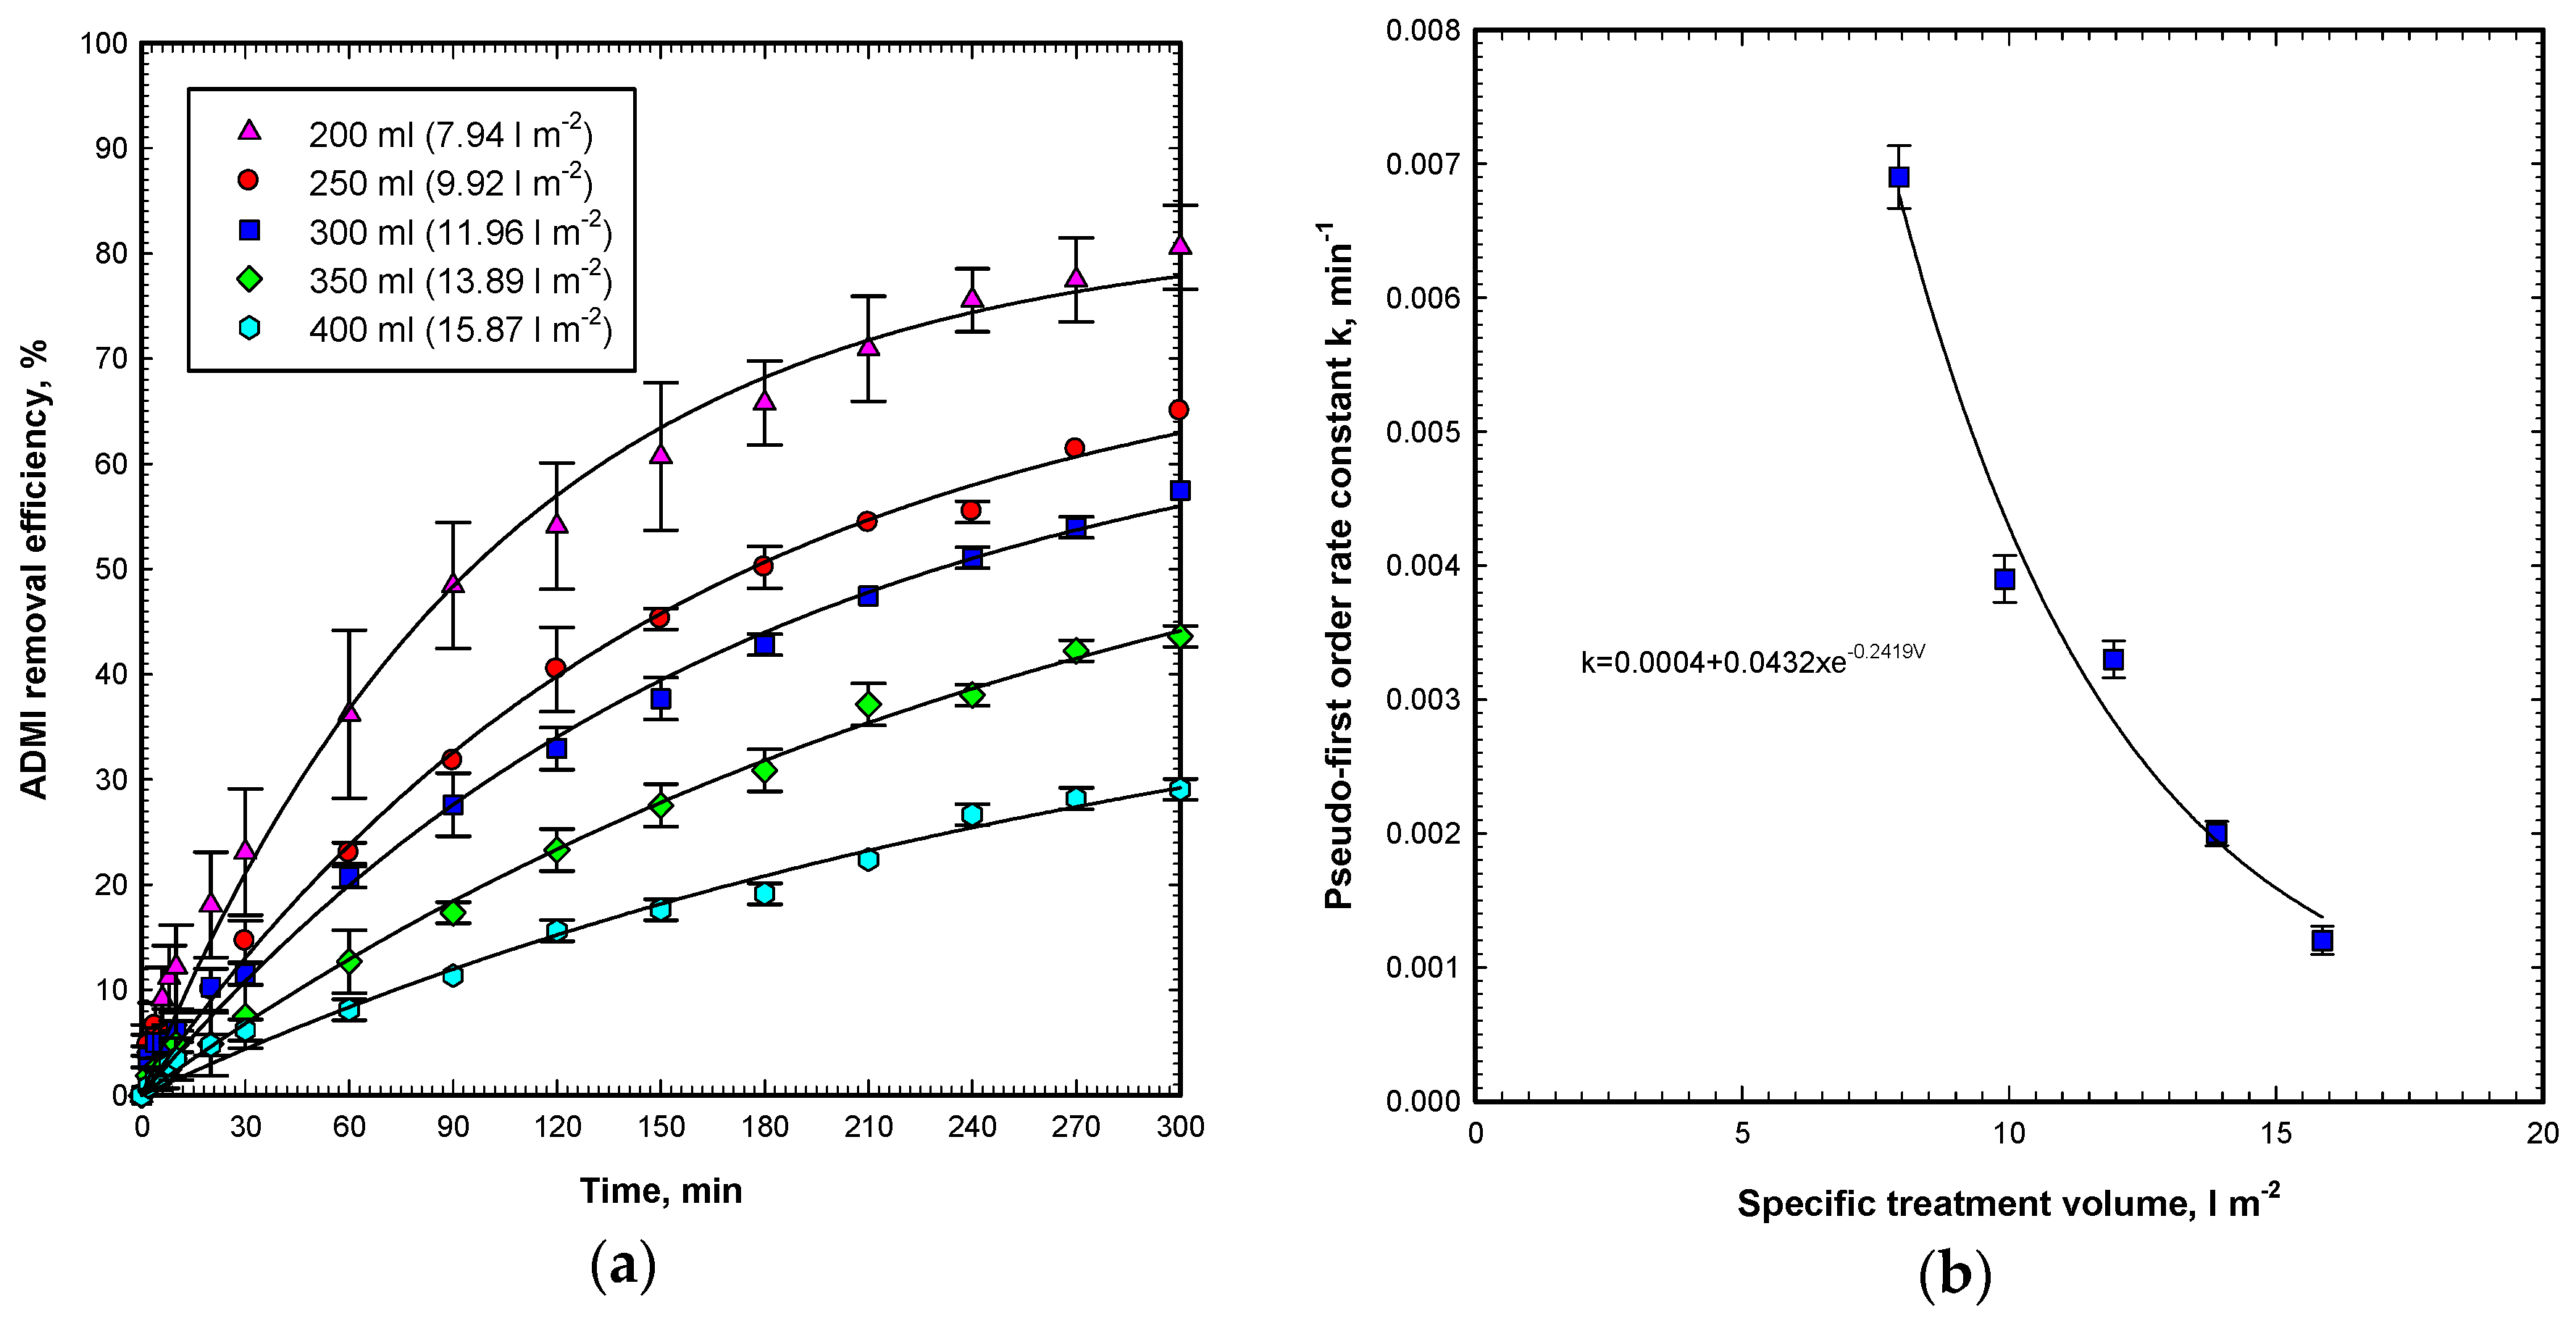
Although ZnO dosage (in g m−2) is a very important operating parameter of the Vis/ZnO process, the loaded area of the catalyst is also as important to provide sufficient area for receiving visible light irradiation. Therefore, the immobilized ZnO catalyst steel mesh was trimmed to various sizes (42–252 cm2) to perform the OG degradation under visible light irradiation. As shown in Figure 7a, the degradation of OG (in ADMI removal efficiency) by the Vis/ZnO process with various loaded areas of catalyst for the same ZnO dosage shows that the higher loaded area of the catalyst demonstrates higher OG removal efficiency during the reaction. The first-order rate constants for various loaded areas are summarized in Figure 7b. It is reasonable that the rate constant increases as the loaded area of catalyst increases linearly. Furthermore, for up-scaling purposes, the same reactor with 252 cm2 of loaded ZnO catalyst was conducted for treating a greater volume of wastewater, up to 400 mL. Figure 8a shows OG degradation by the Vis/ZnO process at various treatment volumes. Results reveal that the OG removal efficiencies reach 29.1%–80.6% in 300 min for 200–400 mL treatment volumes. The results present that the higher treatment volume represents lower OG removal efficiency during the photocatalytic reaction. The rate constants for various treatment volumes are summarized in Figure 8b and shows that rate constant exponentially decays with an increase of the treatment volume, and an empirical equation can be derived as follows:
where, k1 denotes the pseudo first-order rate constant of Vis/ZnO in min−1 for various treatment volumes. V denotes the specific treatment volume in L m−2.
For the purpose of scaling up and real case application, it is important to evaluate the effects of the treatment volume per specific catalyst area, i.e., specific treatment volume (STV) (L m−2), on the first-order rate constant. Under the same visible light irradiation and OG initial concentration, the experiments of adjusting the catalyst area from 42 to 252 cm2 to treat 200 mL OG wastewater can obtain rate constants from 0.0012 to 0.0069 min−1. Further calculating the specific treatment volume (STV) by deriving the treatment volume with the catalyst area obtains 47.6–7.9 L m−2 for the catalyst area of 42–252 cm2. This can be used to plot the decreasing trend of the first-order rate constant versus the specific treatment volume shown in Figure 9. Similarly, the experiments of adjusting the treatment volume from 200 to 400 mL with a 252 cm2 catalyst area to treat 200 mL of OG wastewater can also obtain rate constants from 0.0012 to 0.0069 min−1. The specific treatment volume (STV), by deriving the treatment volume with the catalyst area can obtain 7.9–15.9 L m−2 for the treatment volume of 200–400 mL. From Figure 9, adjusting the catalyst area to the same STV can maintain the higher first-order rate constant than that of adjusting the treatment volume. For the same STV of 15.9 L m−2, the rate constants are 0.0038 and 0.0012 min−1 for adjusting the catalyst area and treatment volume, respectively. The difference is significant. This is due to the increase of the treatment volume at the same catalyst resulting in the increase of the water depth and the increase of the path length of photons entering the solution to activate the ZnO surface. Therefore, from this figure, it is suggested that the catalyst area be adjusted to enhance the degradation of OG in the Vis/ZnO process.
2.7. Application of Solar Light to the Vis/ZnO Process
According to the previous light intensity study, it is ensured that the higher the intensity of visible light applied, the faster the OG degradation can be achieved. Therefore, this set of experiments was performed under natural solar light. Three experiments were conducted for 8:00–13:00, 10:00–15:00, and 14:00–19:00, for various solar irradiation conditions. As shown in Figure 10, the degradation of OG under solar light is demonstrated far faster than that of the laboratory visible light run. The first-order rate constants of solar light experiments are in the range of 0.0294–0.0694 min−1. Furthermore, the natural solar light of 10:00–15:00 shows the highest degradation rate (k = 0.0694 min−1) and requires the shortest irradiation time (60 min) to reach 100% OG removal. The first-order rate constant of natural solar light of 10:00–15:00 is 8.4 times higher than that of the laboratory visible light run. The visible light intensity of the natural solar light tested was 17,290–79,147 Lux, which was 1.8–8.2 times higher than 9600 Lux of the laboratory visible light run. This set of experiments demonstrated that the ZnO catalyst has the potential to be scaled up and utilized for a solar photocatalytic oxidation system.
2.8. Product Analysis by FTIR and IC
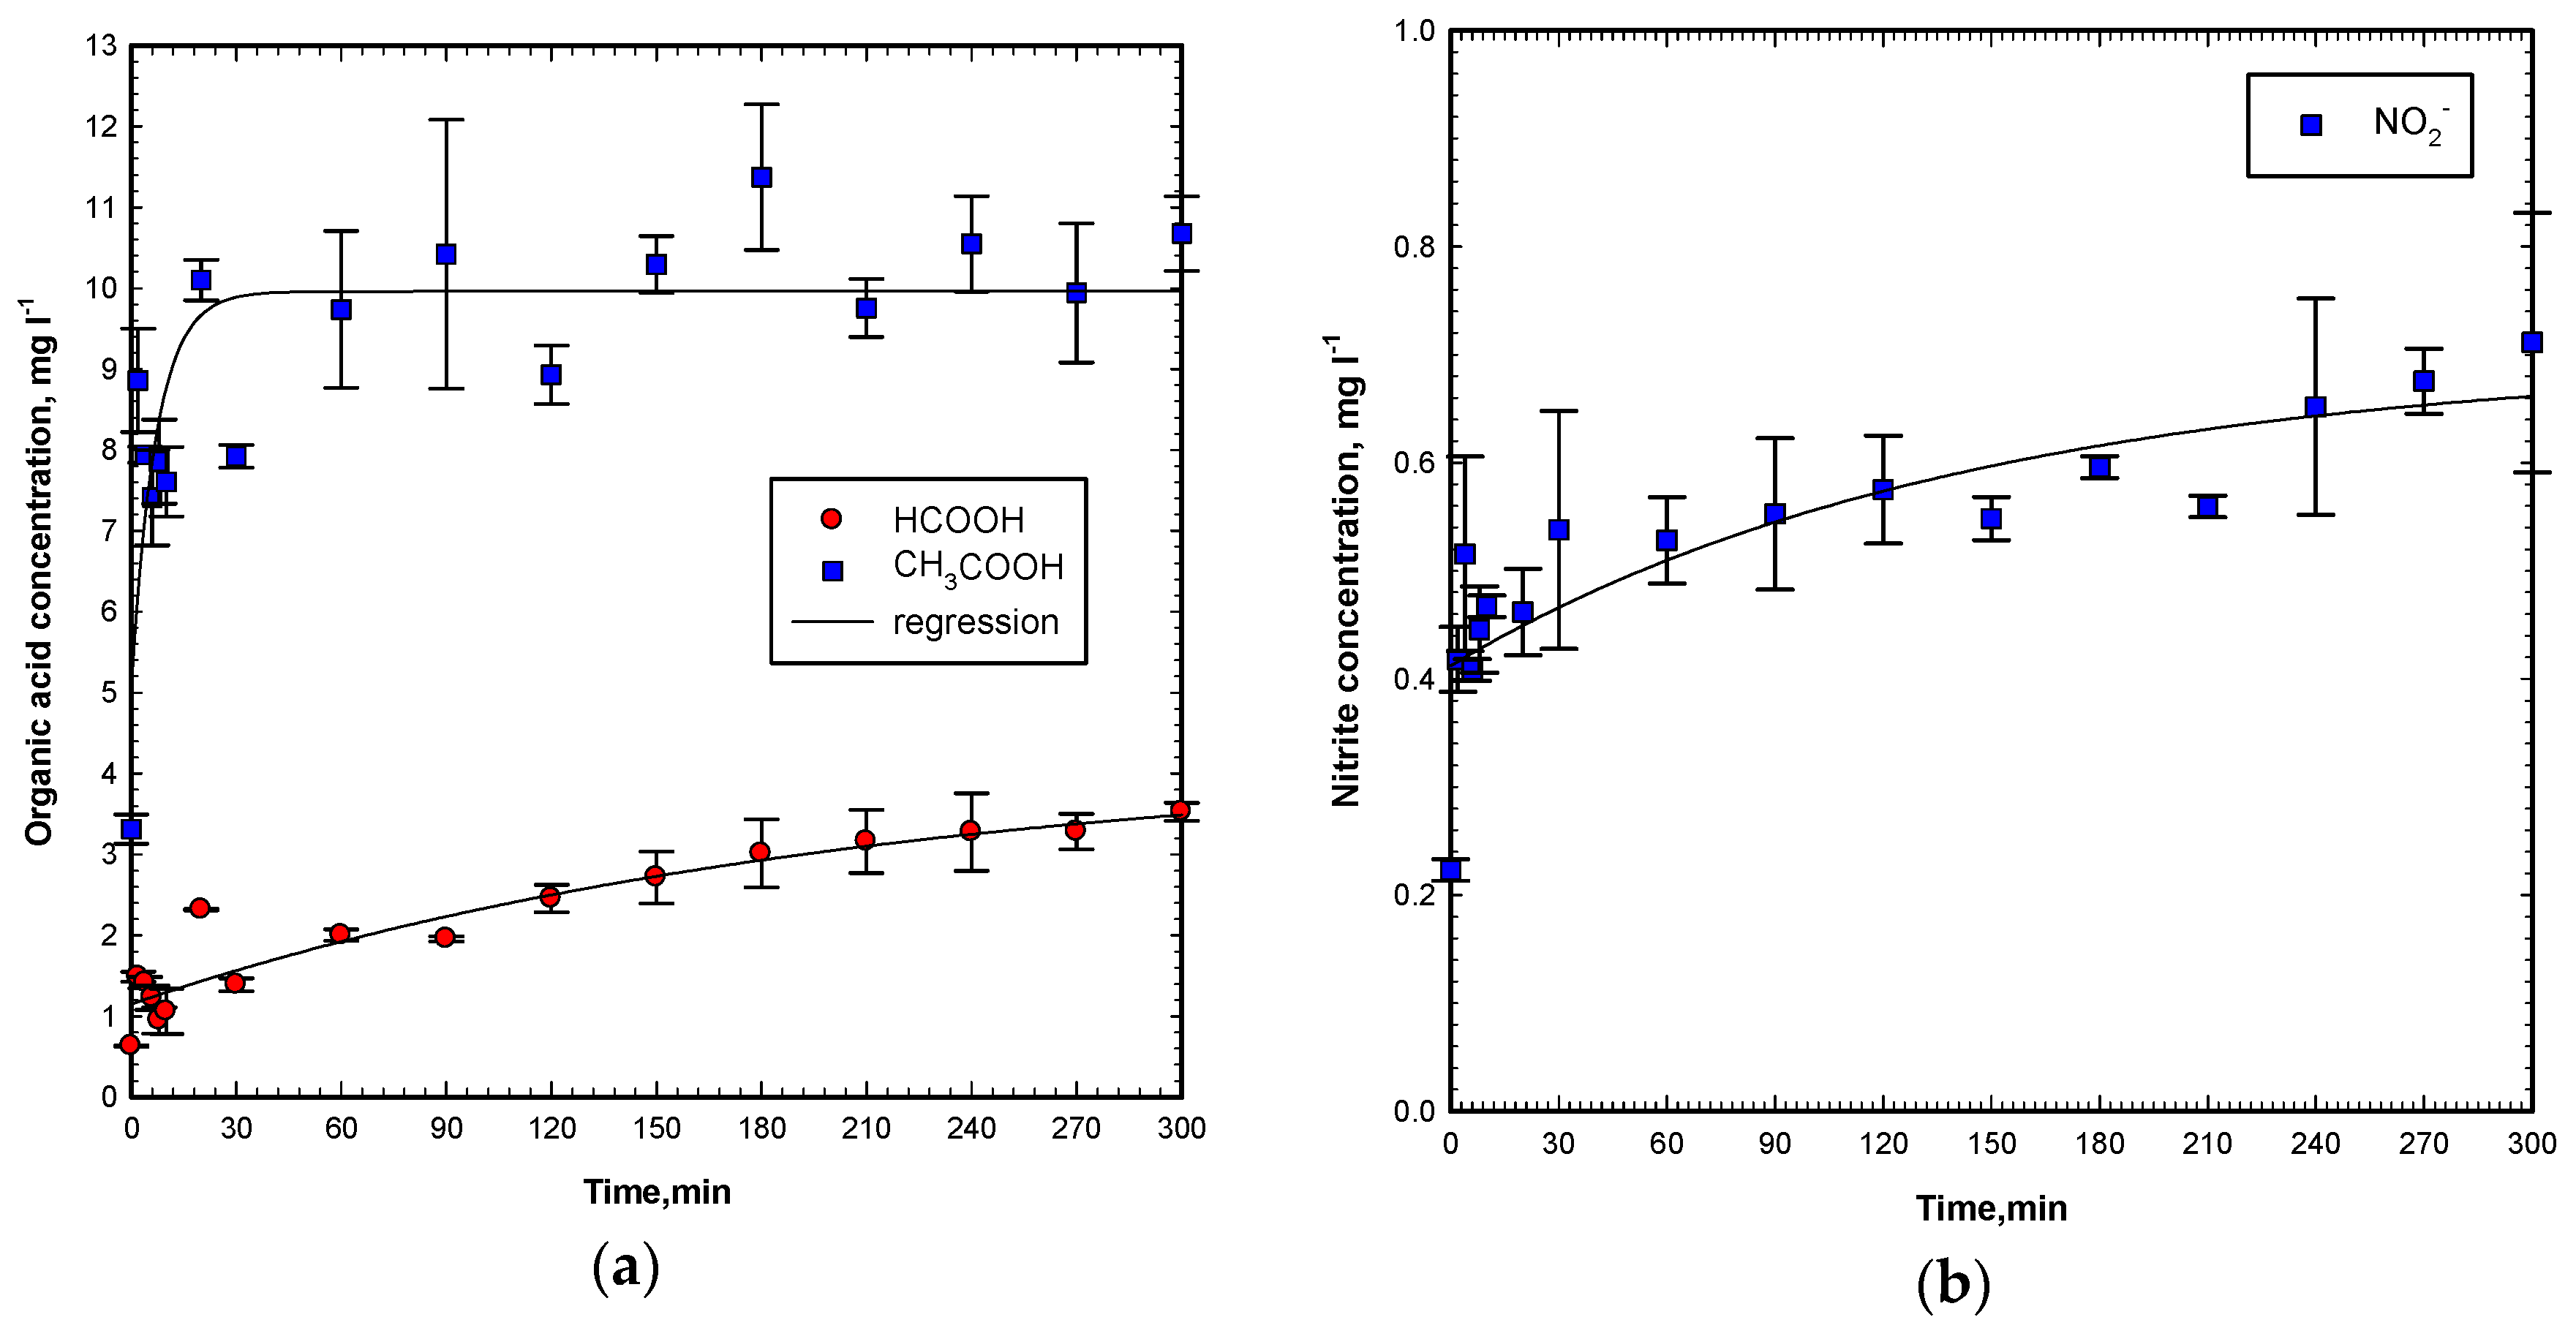
After treatment by the Vis/ZnO process, the effluent was collected and freeze-dried by a freeze dryer. The dry solid was then mixed with KBr and pressed into a tablet for Fourier transform infrared spectrometry (FTIR) examination. The scan spectra (data not shown) showed the disappearance of the azo link (–N=N–) and the formation of the carboxyl group (–C=O). This is due to the hydroxyl radicals, superoxide radicals, hydrogen peroxide, and singlet oxygen attack that cleaves the azo double bond and oxidizes the carbon in organic molecules. While the OG molecule was degraded and decolorized, ion chromatography (IC) can determine the formation of nitrate, nitrite, and organic acids. From Figure 11a, organic acids, such as formic acid and acetic acid, are formed during the reaction. The acetic acid concentration increases very fast to 10 mg L−1 for a 20 min reaction and remains stable. The formic acid increases to about 3 mg L−1 during a 300 min reaction, slowly. Nitrate is not found in this Vis/ZnO experiment. However, the nitrite concentration is very low, only 0.2 to 0.7 mg L−1, as shown in Figure 11b. From the above FTIR and IC results, the fate of the OG molecule in the Vis/ZnO process is proposed to be, firstly, the degradation of OG started from the cleavage of the azo bond and the loss of chromophores to diminish the color. Secondly, the oxidation of OG and intermediates by hydroxyl radicals, superoxide radicals, hydrogen peroxide, and singlet oxygen performs the degradation of benzene and naphthalene compounds, which contribute to TOC. Therefore, the TOC measurement starts to reduce. With certain conditions, the TOC can be totally mineralized. Furthermore, formic acid and acetic acid are formed and identified by IC. The inorganic ions, such as nitrite, also form during the reaction.
3. Materials and Methods
3.1. Materials and Apparatus
The C.I. Orange G (OG, C16H10N2Na2O7S2) is an azo dye used as the target pollutant of this work and was obtained from Sigma-Aldrich, Inc (St. Louis, MO, USA). The characteristics of OG dye are a molecular weight of 452.38 and a characteristic wavelength (λ max) of 479 nm. The photocatalyst, zinc oxide (ZnO), was purchased from Aldrich. The properties of the immobilized ZnO are a specific surface area of 51.41 m2 g−1 (measured by Micrometritics Gemini V, Norcross, GA, USA) and an average particles size of 43 nm. The crystallinity of ZnO particles was given by Aldrich to be a wurtzite structure. In this work, the photocatalyst (ZnO nanoparticle) was dip-coated on a stainless steel mesh to be immobilized for better recovery of spent photocatalyst. The #140 (0.106 mm) steel mesh was obtained from a local hardware store and trimmed into 36 × 7 cm pieces. The details of preparing the immobilized ZnO catalyst on the stainless steel mesh was presented in our previous works [28,30]. Briefly, pretreated stainless steel mesh was dipped into 250 mL of a designated ZnO/water mixture and then dried at 150 °C for one hour. Thereafter, the dried mesh was washed to remove unattached ZnO particles. The abovementioned procedure was repeated three times to obtain the specific dosages of the immobilized ZnO photocatalyst on the meshes for various parameter tests of the Vis/ZnO process.
The morphology of the immobilized ZnO was taken by a field emission scanning electron microscope (FESEM, model JEOL 6330CF, JEOL, Peabody, MA, USA). A thin-film X-ray diffractometer, X-RAY/TF (Rigaku, model RU-H3R, Tokyo, Japan), was utilized to obtain the XRD spectrum for immobilized ZnO.
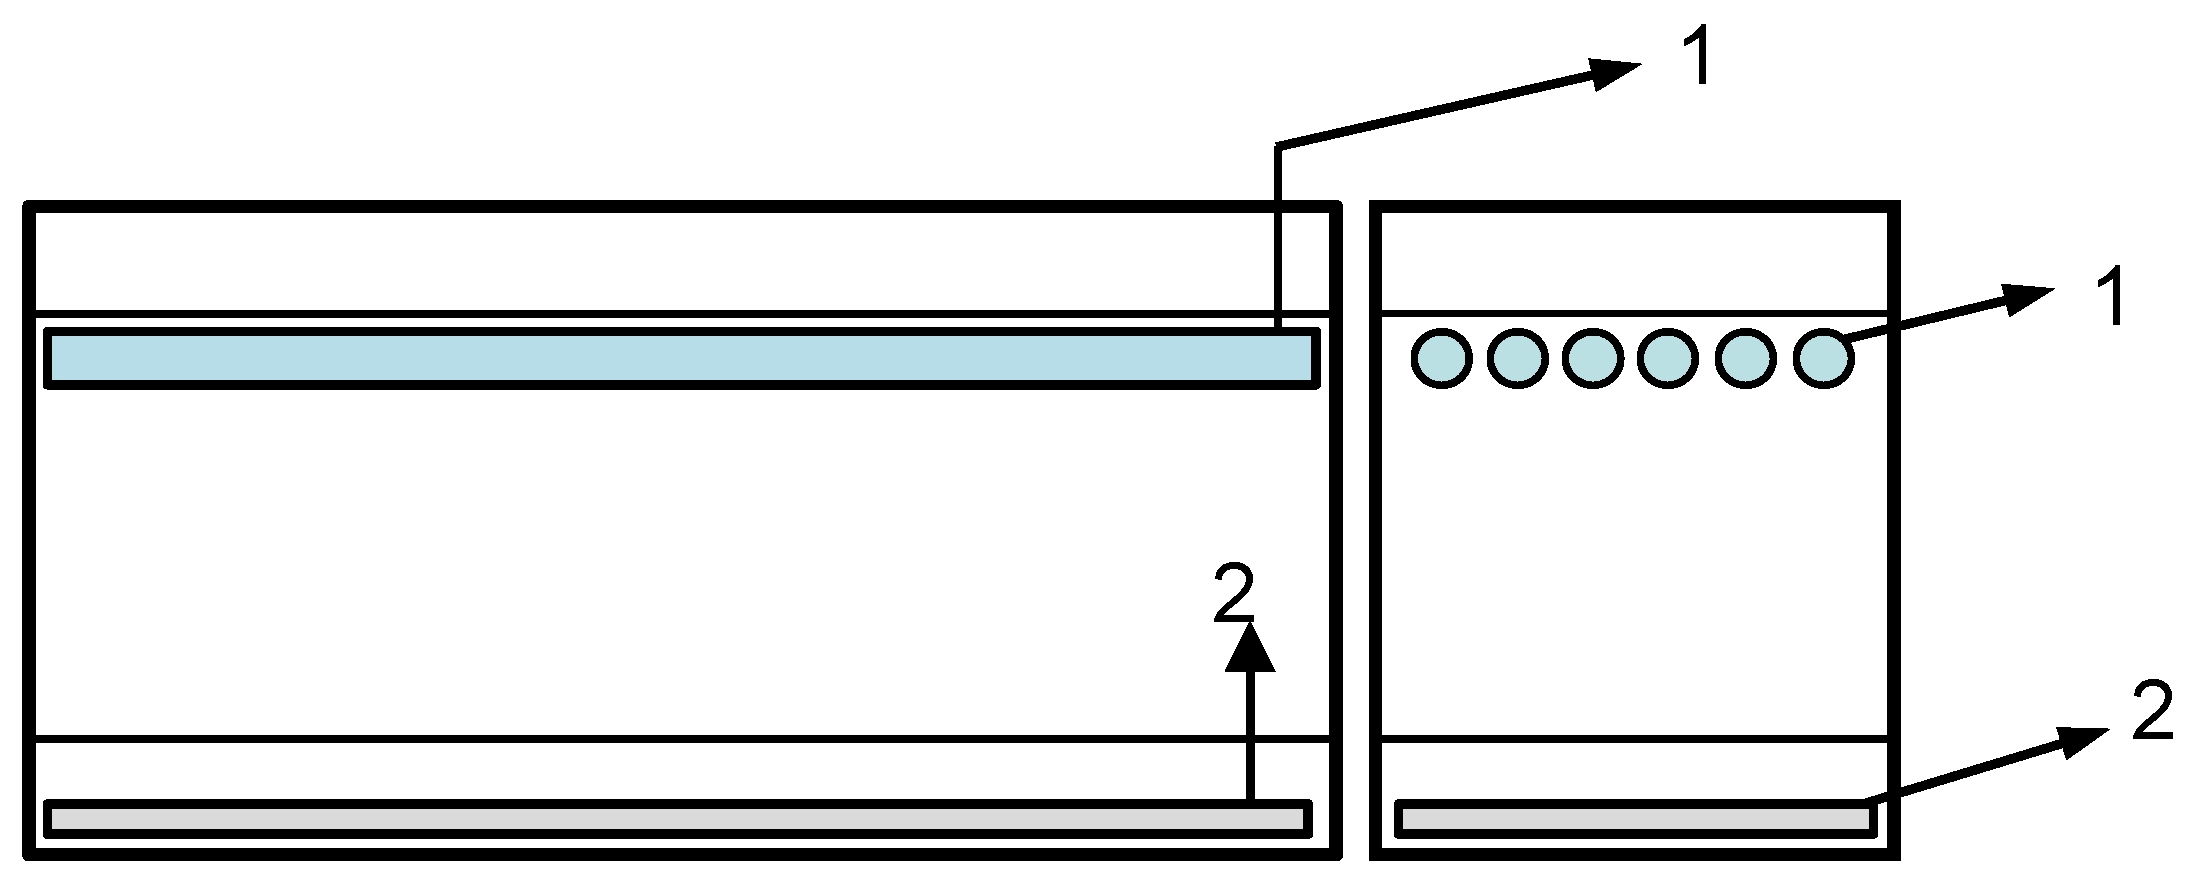
The visible light sources used in this work were cold cathode fluorescent lamps (CCFL, Bosstar, Miaoli, Taiwan) in the visible light irradiation region. Each lamp is 0.25 cm diameter and 30 cm length and its power input is 4 Watts. The proposed photocatalytic reactor was an acrylic resin rectangular black tank 360 × 70 × 78 mm in dimension. The top of the reactor was equipped with a removable upper cover. Underneath this cover, six visible light lamps, CCFLs, were mounted to irradiate visible light to the wastewater and ZnO photocatalyst. The scheme diagram of this proposed photocatalytic reactor is presented in Figure 12. During the photocatalytic reaction, 200 mL OG dye solution was poured into the reactor. The ZnO immobilized steel mesh with 252 cm2 catalyst area was fixed at the bottom of the reactor. The total light energy of 9600 Lux by six CCFL lamps mounted 6.0 cm above the surface of the dye solution was monitored by a photometer sensor at the position of the immobilized ZnO photocatalyst.
3.2. Experimental Procedure and Analysis
OG azo dye solutions were prepared with de-ionized water in various initial concentrations. The operating parameters, including ZnO dosage, initial OG concentration, pH, visible light intensity, loaded area of the catalyst, and treatment volume, were evaluated to demonstrate their influences on OG degradation and TOC mineralization.
An aliquot of the treated OG solution was withdrawn and analyzed for residual OG concentration, TOC, and ADMI color at assigned reaction times. The OG concentration was measured by reading the 479 nm absorbance using a Hitachi U-2000 spectrophotometer (Hitachi, Tokyo, Japan). The TOC value was determined using a total organic carbon analyzer from O.I. Analytical Aurora (model 1030, Xylem Analytics, Queensland, Australia,). The measurement of color intensity followed the American Dye Manufacturers Institute (ADMI, NY, USA) standard color measurement and further applied the Adams-Nickerson color difference formula, which was documented in method 2120E of the Standard Methods. The pH and redox potential (ORP) were monitored by a Eutech PH5500 dual channel pH/ion meter with specific probes (Thermo Fisher Scientific, Waltham, MA, USA). A Perkin Elmer FT-IR spectrophotometer (model Spectrum One, Perkin Elmer, Boston, MA, USA) was utilized to determine the changes of OG functional groups. Moreover, the degradation of organic and inorganic products in ionic form were identified by ion chromatography (IC) using a Dionex ICS-1000 system (Thermo Fisher Scientific, Waltham, MA, USA).
4. Conclusions
A visible light-induced immobilized ZnO photocatalytic reactor was developed to degrade orange G (OG) azo dye in wastewater. In this reactor, the ZnO catalyst was immobilized on a steel mesh and irradiated with six CCFL lamps in the visible light region. In this proposed Vis/ZnO process, OG and its TOC were effectively degraded and mineralized. An optimal ZnO surface loading of 60 g m−2 exhibited the highest color removal, as well as the fastest rate constant of 0.070 min−1. The initial pH of 11 was the most effective pH condition on the OG degradation. The first order rate constant exponentially declined from 0.025 to 0.0042 min−1 with an increase of the initial OG concentration and an empirical equation can be derived to estimate the first-order rate constant with a known initial OG concentration. In contrast, the first-order rate constant is linearly improved from 0.0027 to 0.0083 min−1 with intensifying of the visible light intensity. The utilization of natural solar light for the proposed Vis/ZnO process is successful. Since the intensity of natural solar light is up to 79,147 Lux, the first-order rate constant of natural solar light from 10:00–15:00 is 8.4 times higher than that of the laboratory visible light run.
Acknowledgments
The authors appreciate the research funding granted by the Taiwan Ministry of Science and Technology (MOST 98-2221-E-241-006-MY3).
Author Contributions
H.Y. and M.C. designed the experiments; T.H. and H.Y. performed the experiments; M.C. analyzed the data; T.H. contributed reagents/materials/analysis tools; and H.Y. wrote the paper.
Conflicts of Interest
The authors declare no conflict of interest.
References
- Kant, R. Textile dyeing industry an environmental hazard. Nat. Sci. 2012, 4, 22–26. [Google Scholar] [CrossRef]
- Kao, C.M.; Chou, M.S.; Fang, W.L.; Liu, B.W.; Huang, B.R. Regulating colored textile wastewater by 3/31 wavelength admi methods in Taiwan. Chemosphere 2001, 44, 1055–1063. [Google Scholar] [CrossRef]
- Toor, M.; Jin, B.; Dai, S.; Vimonses, V. Activating natural bentonite as a cost-effective adsorbent for removal of Congo-red in wastewater. J. Ind. Eng. Chem. 2015, 21, 653–661. [Google Scholar] [CrossRef]
- Yang, S.; Wang, L.; Zhang, X.; Yang, W.; Song, G. Enhanced adsorption of Congo red dye by functionalized carbon nanotube/mixed metal oxides nanocomposites derived from layered double hydroxide precursor. Chem. Eng. J. 2015, 275, 315–321. [Google Scholar] [CrossRef]
- Verma, A.K.; Bhunia, P.; Dash, R.R. Reclamation of wastewater using composite coagulants: A sustainable solution to the textile industries. Chem. Eng. Trans. 2014, 42, 175–180. [Google Scholar] [CrossRef]
- Srivastava, H.P.; Arthanareeswaran, G.; Anantharaman, N.; Starov, V.M. Performance of modified poly(vinylidene fluoride) membrane for textile wastewater ultrafiltration. Desalination 2011, 282, 87–94. [Google Scholar] [CrossRef]
- Chen, X.N.; Wan, L.S.; Wu, Q.Y.; Zhi, S.H.; Xu, Z.K. Mineralized polyacrylonitrile-based ultrafiltration membranes with improved water flux and rejection towards dye. J. Membr. Sci. 2013, 441, 112–119. [Google Scholar] [CrossRef]
- Franca, R.D.G.; Vieira, A.; Mata, A.M.T.; Carvalho, G.S.; Pinheiro, H.M.; Lourenço, N.D. Effect of an azo dye on the performance of an aerobic granular sludge sequencing batch reactor treating a simulated textile wastewater. Water Res. 2015, 85, 327–336. [Google Scholar] [CrossRef] [PubMed]
- Murali, V.; Ong, S.A.; Ho, L.N.; Wong, Y.S. Evaluation of integrated anaerobic-aerobic biofilm reactor for degradation of azo dye methyl orange. Bioresour. Technol. 2013, 143, 104–111. [Google Scholar] [CrossRef] [PubMed]
- Rodriguez, S.; Vasquez, L.; Costa, D.; Romero, A.; Santos, A. Oxidation of Orange G by persulfate activated by Fe(II), Fe(III) and zero valent iron (ZVI). Chemosphere 2014, 101, 86–92. [Google Scholar] [CrossRef] [PubMed]
- Lei, Y.; Liu, H.; Shen, Z.; Wang, W. Development of a trickle bed reactor of electro-Fenton process for wastewater treatment. J. Hazard. Mater. 2013, 261, 570–576. [Google Scholar] [CrossRef] [PubMed]
- Nešic, J.; Manojlovic, D.D.; Andelkovic, I.; Dojcinovic, B.P.; Vulic, P.J.; Krstic, J.; Roglic, G.M. Preparation, characterization and photocatalytic activity of lanthanum and vanadium co-doped mesoporous TiO2 for azo-dye degradation. J. Mol. Catal. A: Chem. 2013, 378, 67–75. [Google Scholar] [CrossRef]
- Shu, H.Y.; Chang, M.C.; Fan, H.J. Decolorization of azo dye acid black 1 by the UV/H2O2 process and optimization of operating parameters. J. Hazard. Mater. 2004, 113, 201–208. [Google Scholar] [CrossRef] [PubMed]
- Priyanka; Srivastava, V.C. Photocatalytic oxidation of dye bearing wastewater by iron doped zinc oxide. Ind. Eng. Chem. Res. 2013, 52, 17790–17799. [Google Scholar] [CrossRef]
- Farrokhi, M.; Hosseini, S.C.; Yang, J.K.; Shirzad-Siboni, M. Application of ZnO-Fe3O4 nanocomposite on the removal of azo dye from aqueous solutions: Kinetics and equilibrium studies. Water Air Soil Pollut. 2014, 225, 2113. [Google Scholar] [CrossRef]
- Arab Chamjangali, M.; Bagherian, G.; Bahramian, B. Fahimi Rad, B. Synthesis and application of multiple rods gold–zinc oxide nanostructures in the photocatalytic degradation of methyl orange. Int. J. Environ. Sci. Technol. 2015, 12, 151–160. [Google Scholar] [CrossRef]
- Saravanan, R.; Karthikeyan, S.; Gupta, V.K.; Sekaran, G.; Narayanan, V.; Stephen, A. Enhanced photocatalytic activity of ZnO/CuO nanocomposite for the degradation of textile dye on visible light illumination. Mater. Sci. Eng. C 2013, 33, 91–98. [Google Scholar] [CrossRef] [PubMed]
- Buvaneswari, K.; Karthiga, R.; Kavitha, B.; Rajarajan, M.; Suganthi, A. Effect of FeWO4 doping on the photocatalytic activity of ZnO under visible light irradiation. Appl. Surf. Sci. 2015, 356, 333–340. [Google Scholar] [CrossRef]
- Choi, Y.I.; Jung, H.J.; Shin, W.G.; Sohn, Y. Band gap-engineered ZnO and Ag/ZnO by ball-milling method and their photocatalytic and Fenton-like photocatalytic activities. Appl. Surf. Sci. 2015, 356, 615–625. [Google Scholar] [CrossRef]
- Mittal, M.; Sharma, M.; Pandey, O.P. Fast and quick degradation properties of doped and capped ZnO nanoparticles under UV-Visible light radiations. Sol. Energy 2016, 125, 51–64. [Google Scholar] [CrossRef]
- Saravanan, R.; Mansoob Khan, M.; Gupta, V.K.; Mosquera, E.; Gracia, F.; Narayanan, V.; Stephen, A. ZnO/Ag/CdO nanocomposite for visible light-induced photocatalytic degradation of industrial textile effluents. J. Colloid Interface Sci. 2015, 452, 126–133. [Google Scholar] [CrossRef] [PubMed]
- Zhu, H.Y.; Xiao, L.; Jiang, R.; Zeng, G.M.; Liu, L. Efficient decolorization of azo dye solution by visible light-induced photocatalytic process using SnO2/ZnO heterojunction immobilized in chitosan matrix. Chem. Eng. J. 2011, 172, 746–753. [Google Scholar] [CrossRef]
- Zhu, Q.; Zhang, Y.; Zhou, F.; Lv, F.; Ye, Z.; Fan, F.; Chu, P.K. Preparation and characterization of Cu2O-ZnO immobilized on diatomite for photocatalytic treatment of red water produced from manufacturing of TNT. Chem. Eng. J. 2011, 171, 61–68. [Google Scholar] [CrossRef]
- Sakthivel, S.; Neppolian, B.; Shankar, M.V.; Arabindoo, B.; Palanichamy, M.; Murugesan, V. Solar photocatalytic degradation of azo dye: Comparison of photocatalytic efficiency of ZnO and TiO2. Sol. Energy Mater. Sol. Cells 2003, 77, 65–82. [Google Scholar] [CrossRef]
- Akyol, A.; Yatmaz, H.C.; Bayramoglu, M. Photocatalytic decolorization of Remazol Red RR in aqueous ZnO suspensions. Appl. Catal. B: Environ. 2004, 54, 19–24. [Google Scholar] [CrossRef]
- Akyol, A.; Bayramoglu, M. Performance comparison of ZnO photocatalyst in various reactor systems. J. Chem. Technol. Biotechnol. 2010, 85, 1455–1462. [Google Scholar] [CrossRef]
- Vignesh, K.; Rajarajan, M.; Suganthi, A. Visible light assisted photocatalytic performance of Ni and Th co-doped ZnO nanoparticles for the degradation of methylene blue dye. J. Ind. Eng. Chem. 2014, 20, 3826–3833. [Google Scholar] [CrossRef]
- Chang, M.C.; Shu, H.Y.; Tseng, T.H.; Hsu, H.W. Supported zinc oxide photocatalyst for decolorization and mineralization of orange G dye wastewater under UV365 irradiation. Int. J. Photoenergy 2013, 2013, 595031. [Google Scholar] [CrossRef]
- Shu, H.Y.; Chang, M.C.; Huang, S.W. UV irradiation catalyzed persulfate advanced oxidation process for decolorization of Acid Blue 113 wastewater. Desalin. Water Treat. 2015, 54, 1013–1021. [Google Scholar] [CrossRef]
- Chang, M.C.; Huang, C.P.; Shu, H.Y.; Chang, Y.C. A new photocatalytic system using steel mesh and cold cathode fluorescent light for the decolorization of azo dye orange G. Int. J. Photoenergy 2012, 2012, 303961. [Google Scholar] [CrossRef]
Figure 1.
The FESEM images of immobilized ZnO on the steel mesh (a) before and (b) after the photocatalytic reaction. The (c) EDS spectrum and (d) XRF spectra before and after the photocatalytic reaction.
Figure 1.
The FESEM images of immobilized ZnO on the steel mesh (a) before and (b) after the photocatalytic reaction. The (c) EDS spectrum and (d) XRF spectra before and after the photocatalytic reaction.

Figure 2.
Effect of ZnO dosage on (a) OG degradation, (b) first-order kinetics, and (c) TOC removal by the Vis/ZnO process. The operating conditions were: initial OG concentration of 50 mg L−1, ZnO dosage of 8–67 g m−2, visible light intensity of 9600 Lux, and reaction time duration of 300 min.
Figure 2.
Effect of ZnO dosage on (a) OG degradation, (b) first-order kinetics, and (c) TOC removal by the Vis/ZnO process. The operating conditions were: initial OG concentration of 50 mg L−1, ZnO dosage of 8–67 g m−2, visible light intensity of 9600 Lux, and reaction time duration of 300 min.


Figure 3.
Effect of ZnO dosage on (a) the pseudo-first-order rate constant and (b) the TOC removal efficiency by the Vis/ZnO process. The operating conditions were same as in Figure 3.
Figure 3.
Effect of ZnO dosage on (a) the pseudo-first-order rate constant and (b) the TOC removal efficiency by the Vis/ZnO process. The operating conditions were same as in Figure 3.
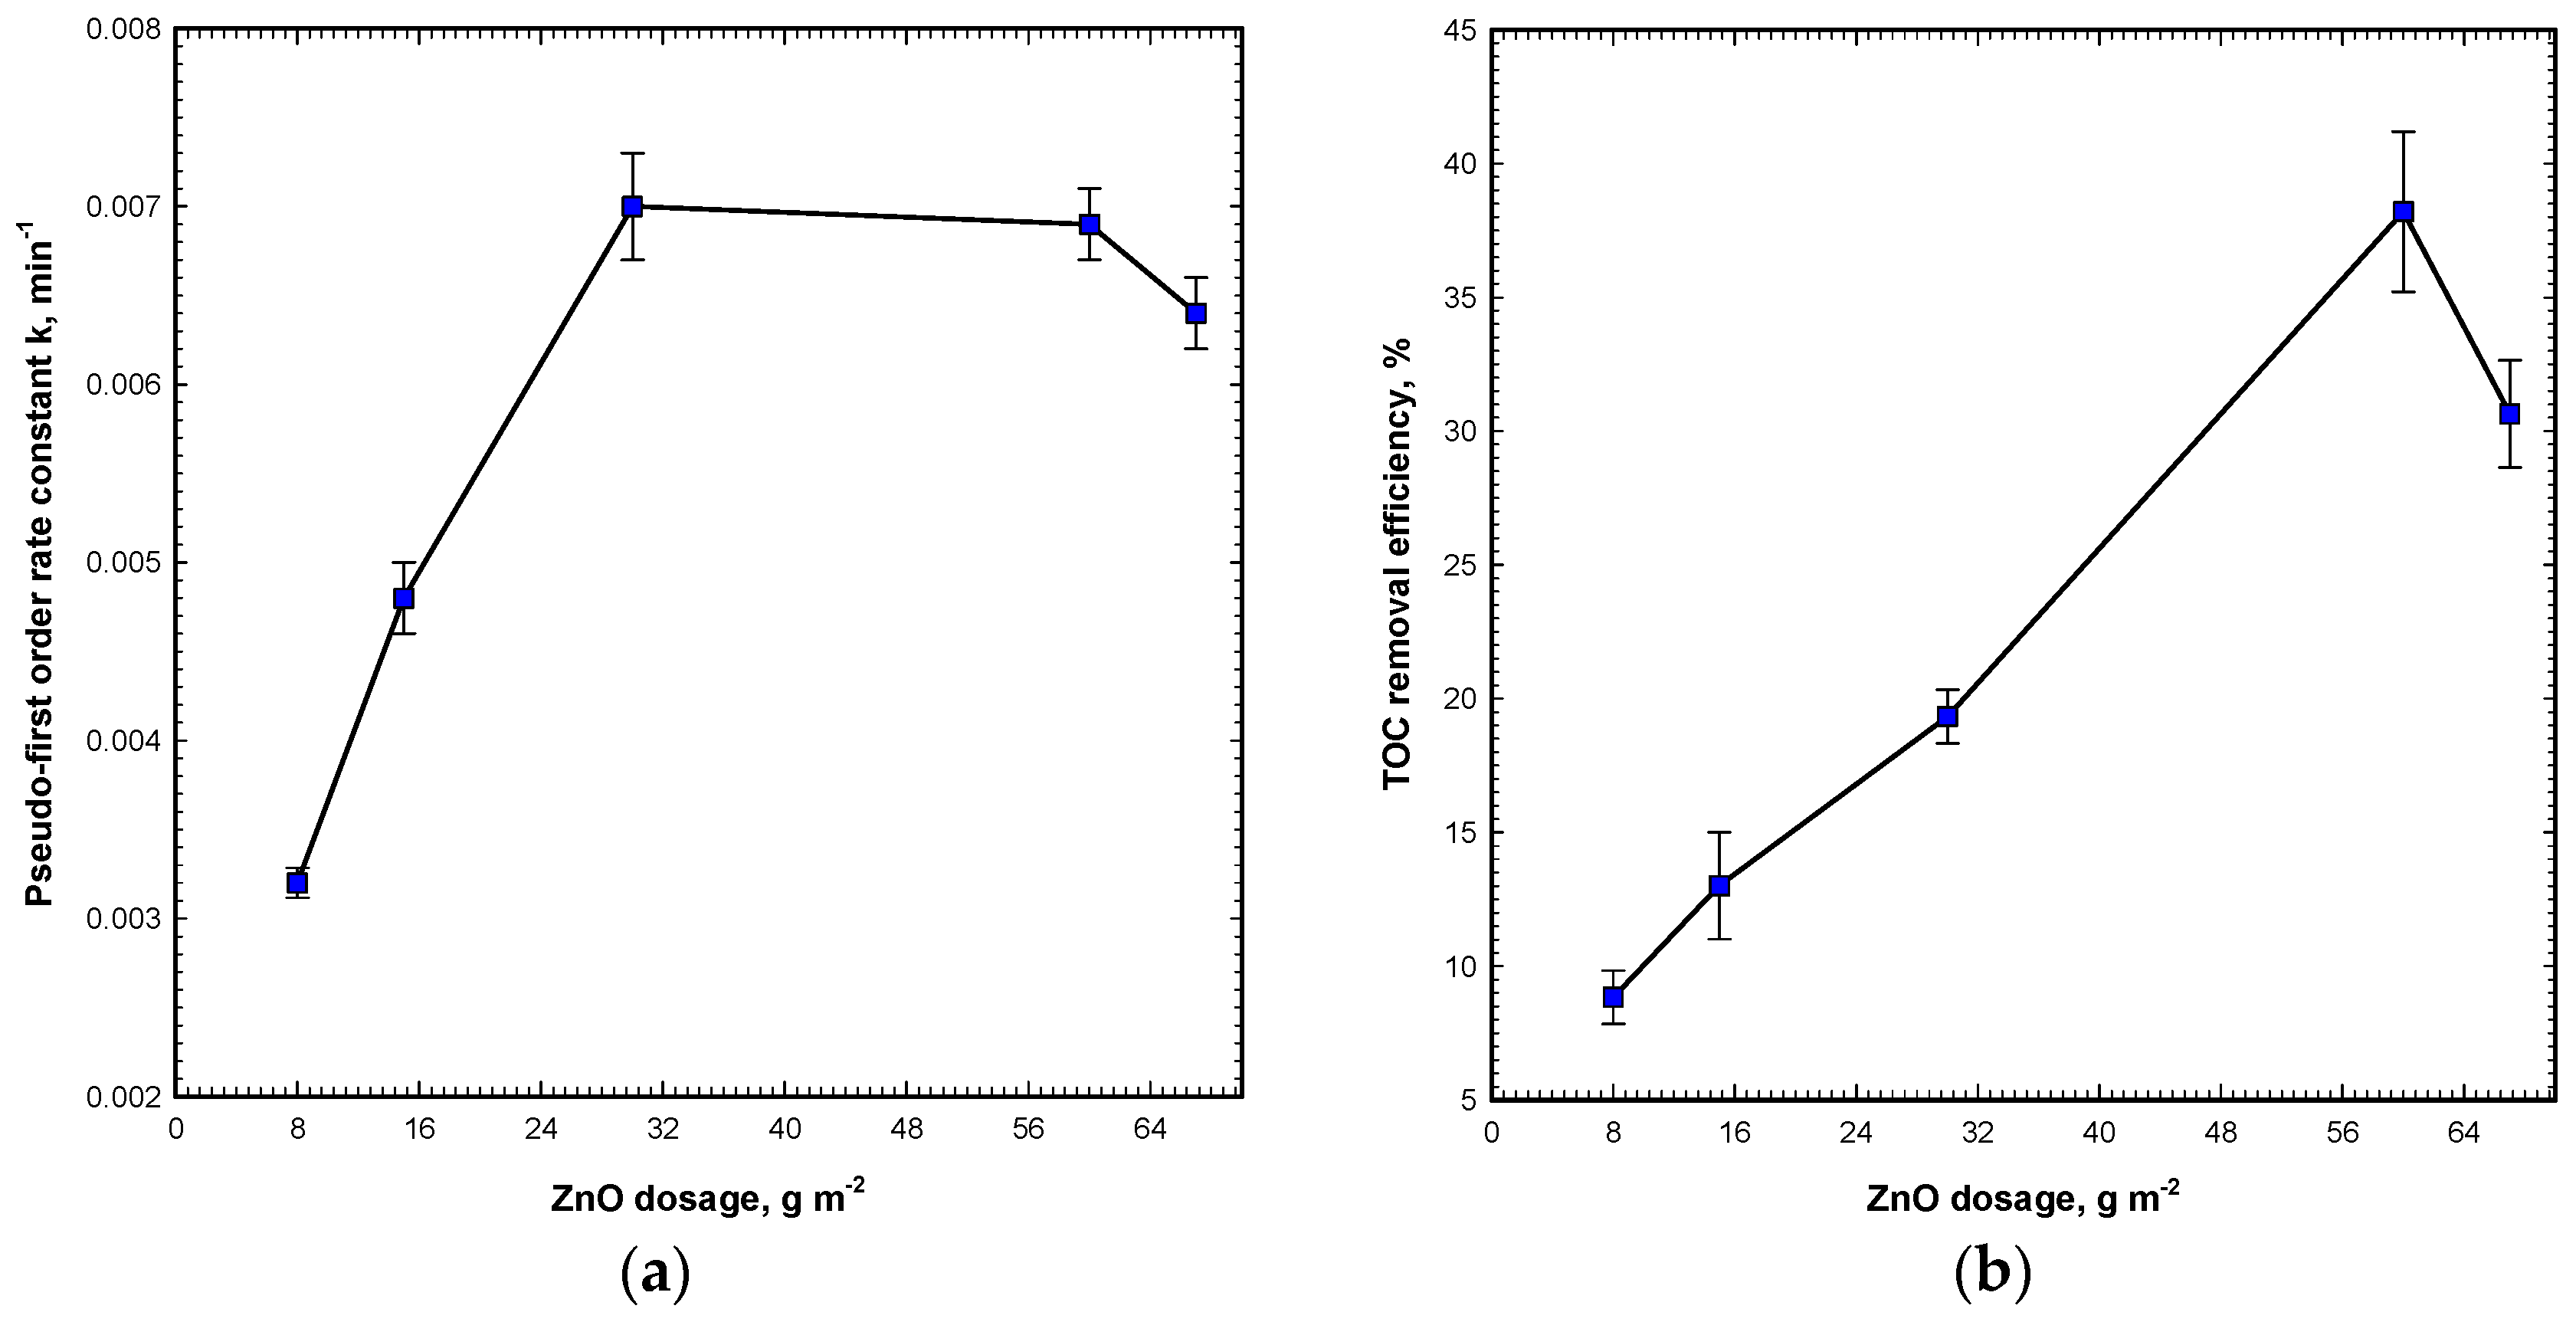
Figure 4.
Effect of initial OG concentration on (a) OG degradation and (b) the pseudo-first-order rate constant by the Vis/ZnO process. The operating conditions were: initial OG concentration of 12.5–75 mg L−1, ZnO dosage of 60 g m−2, visible light intensity of 9600 Lux, and reaction time duration of 300 min.
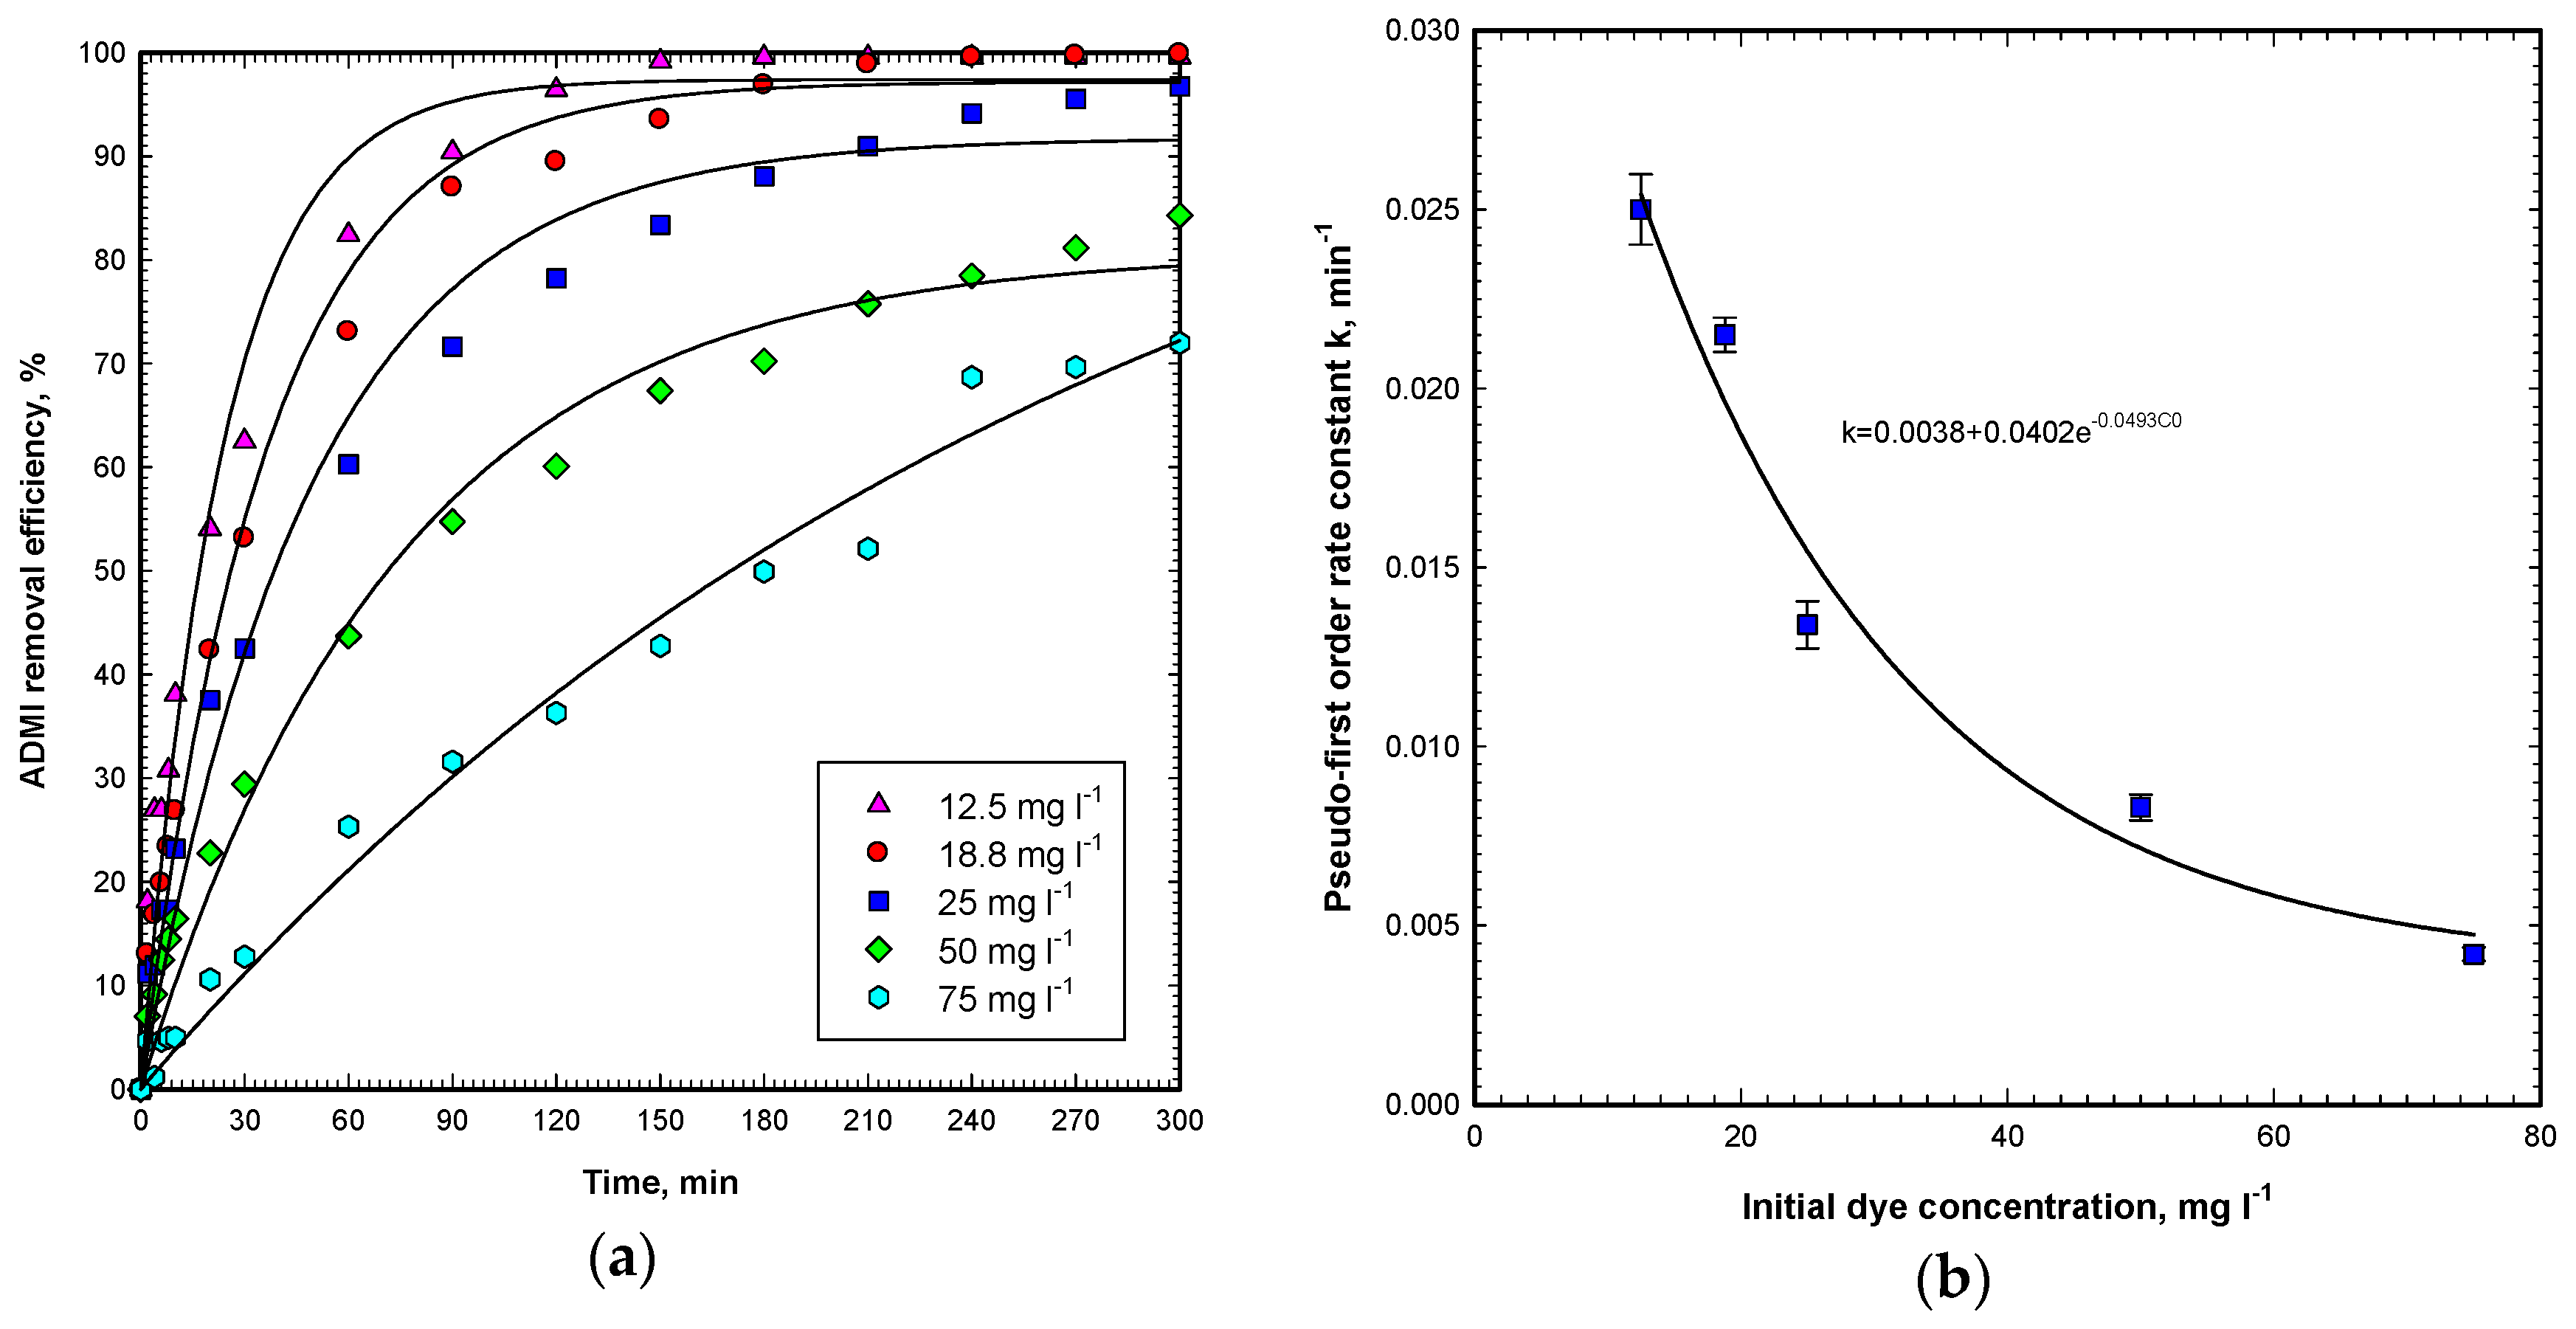
Figure 5.
Effect of visible light intensity on (a) OG degradation and (b) the first-order rate constant, by the Vis/ZnO process. The operating conditions were: initial OG concentration of 50 mg L−1, ZnO dosage of 60 g m−2, Visible light intensity of 1600–9600 Lux, and reaction time duration of 300 min.
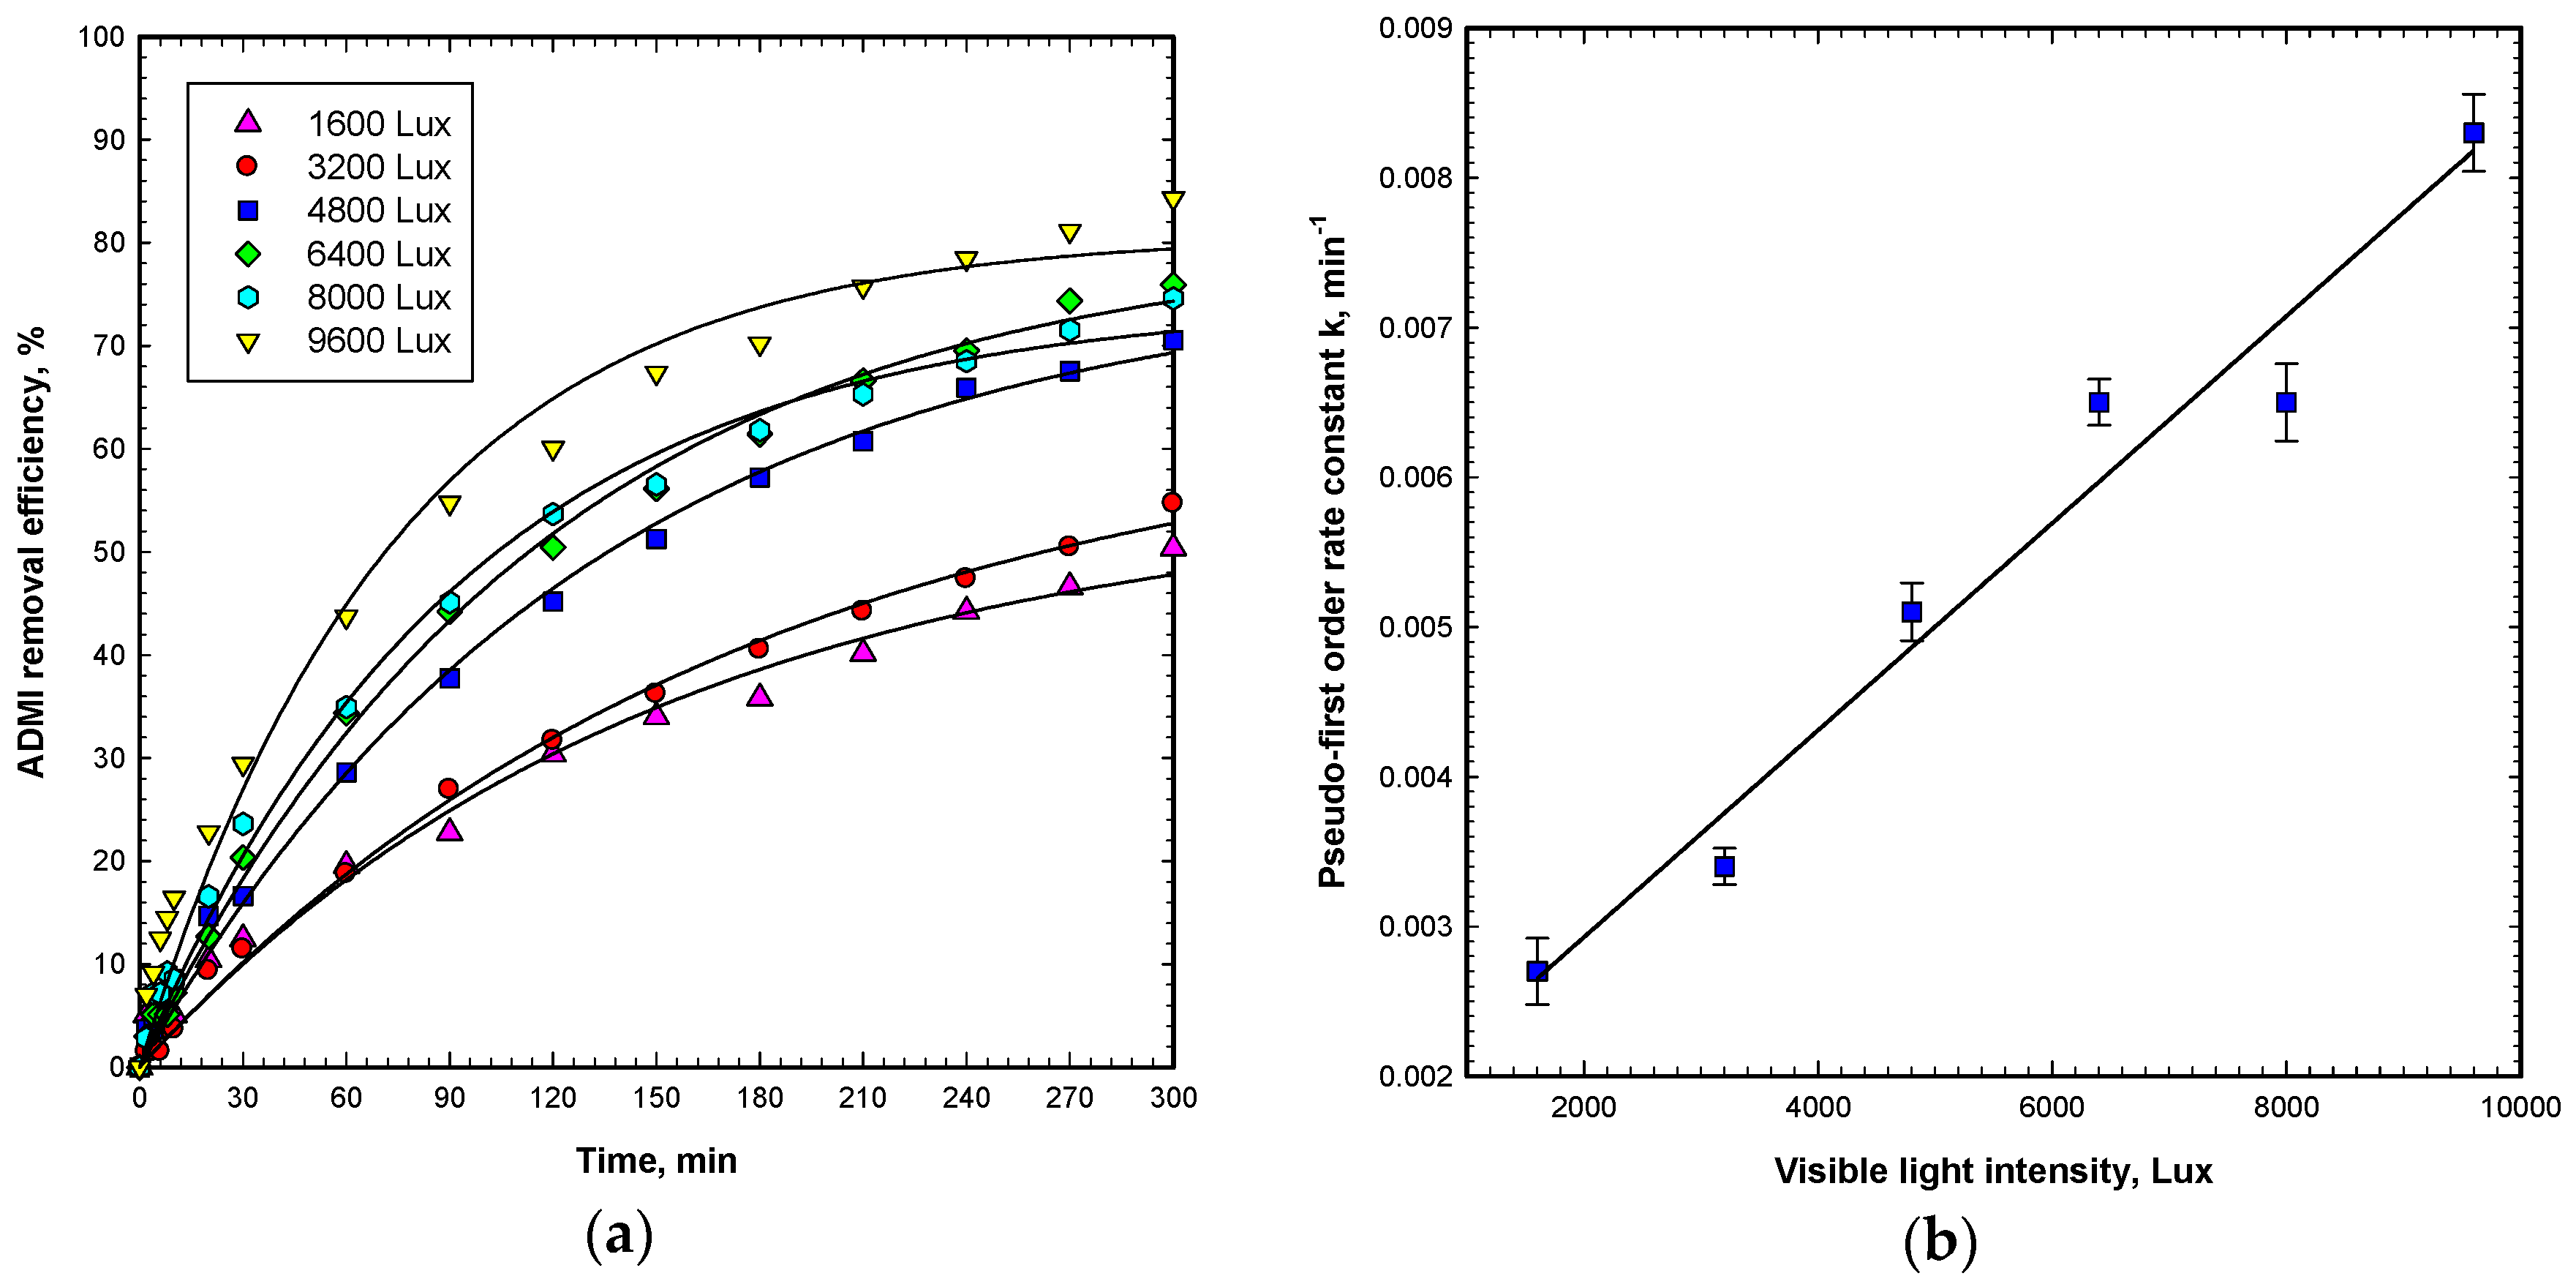
Figure 6.
Effect of pH on (a) OG degradation and (b) the first-order rate constant by the Vis/ZnO process. The operating conditions were: initial OG concentration of 50 mg L−1, ZnO dosage of 60 g m−2, visible light intensity of 9600 Lux, pH 2–11, and reaction time duration of 300 min.
Figure 6.
Effect of pH on (a) OG degradation and (b) the first-order rate constant by the Vis/ZnO process. The operating conditions were: initial OG concentration of 50 mg L−1, ZnO dosage of 60 g m−2, visible light intensity of 9600 Lux, pH 2–11, and reaction time duration of 300 min.
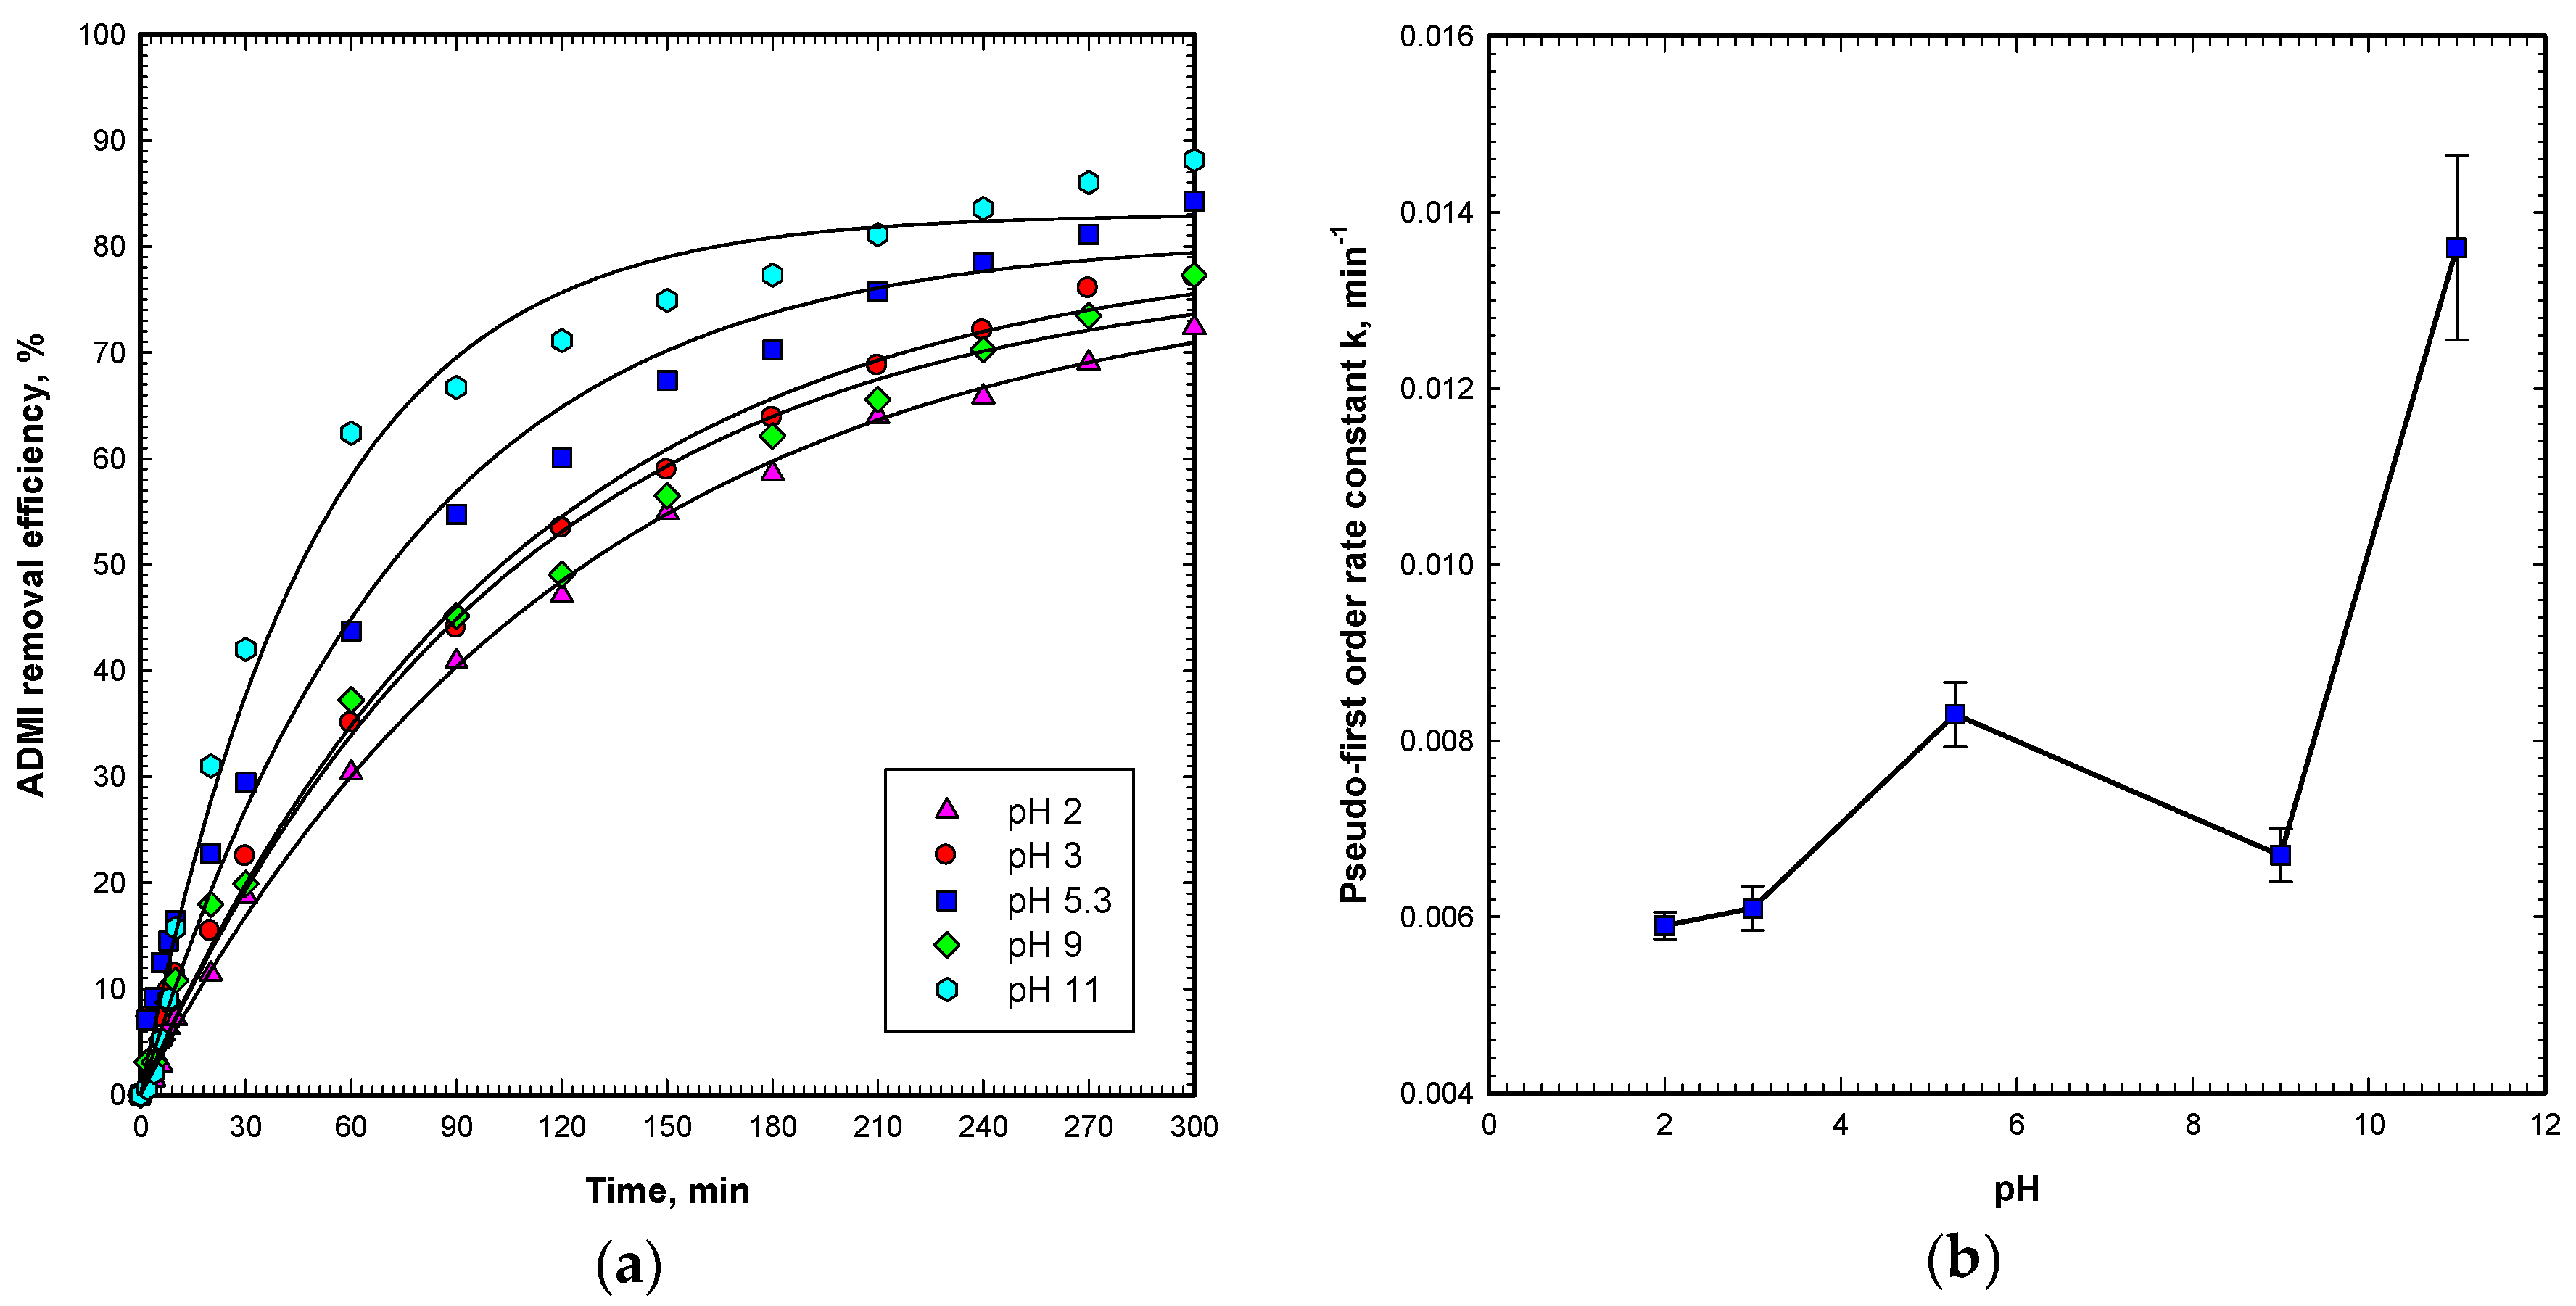
Figure 7.
Effect of the loaded area of the catalyst on (a) OG degradation and (b) the first-order rate constant by the Vis/ZnO process. The operating conditions were: initial OG concentration of 50 mg L−1, ZnO dosage of 60 g m−2, visible light intensity of 9600 Lux, and reaction time duration of 300 min.

Figure 8.
Effect of the treatment volume on (a) OG degradation and (b) the first-order rate constant, by the Vis/ZnO process. The operating conditions were: initial OG concentration of 50 mg L−1, ZnO dosage of 60 g m−2, visible light intensity of 9600 Lux, treatment volume of 200–400 mL, and a reaction time during of 300 min.

Figure 9.
Effect of unit treatment volume on the first-order rate constant by the Vis/ZnO process. The operating conditions were the same as in Figure 7 and Figure 8.
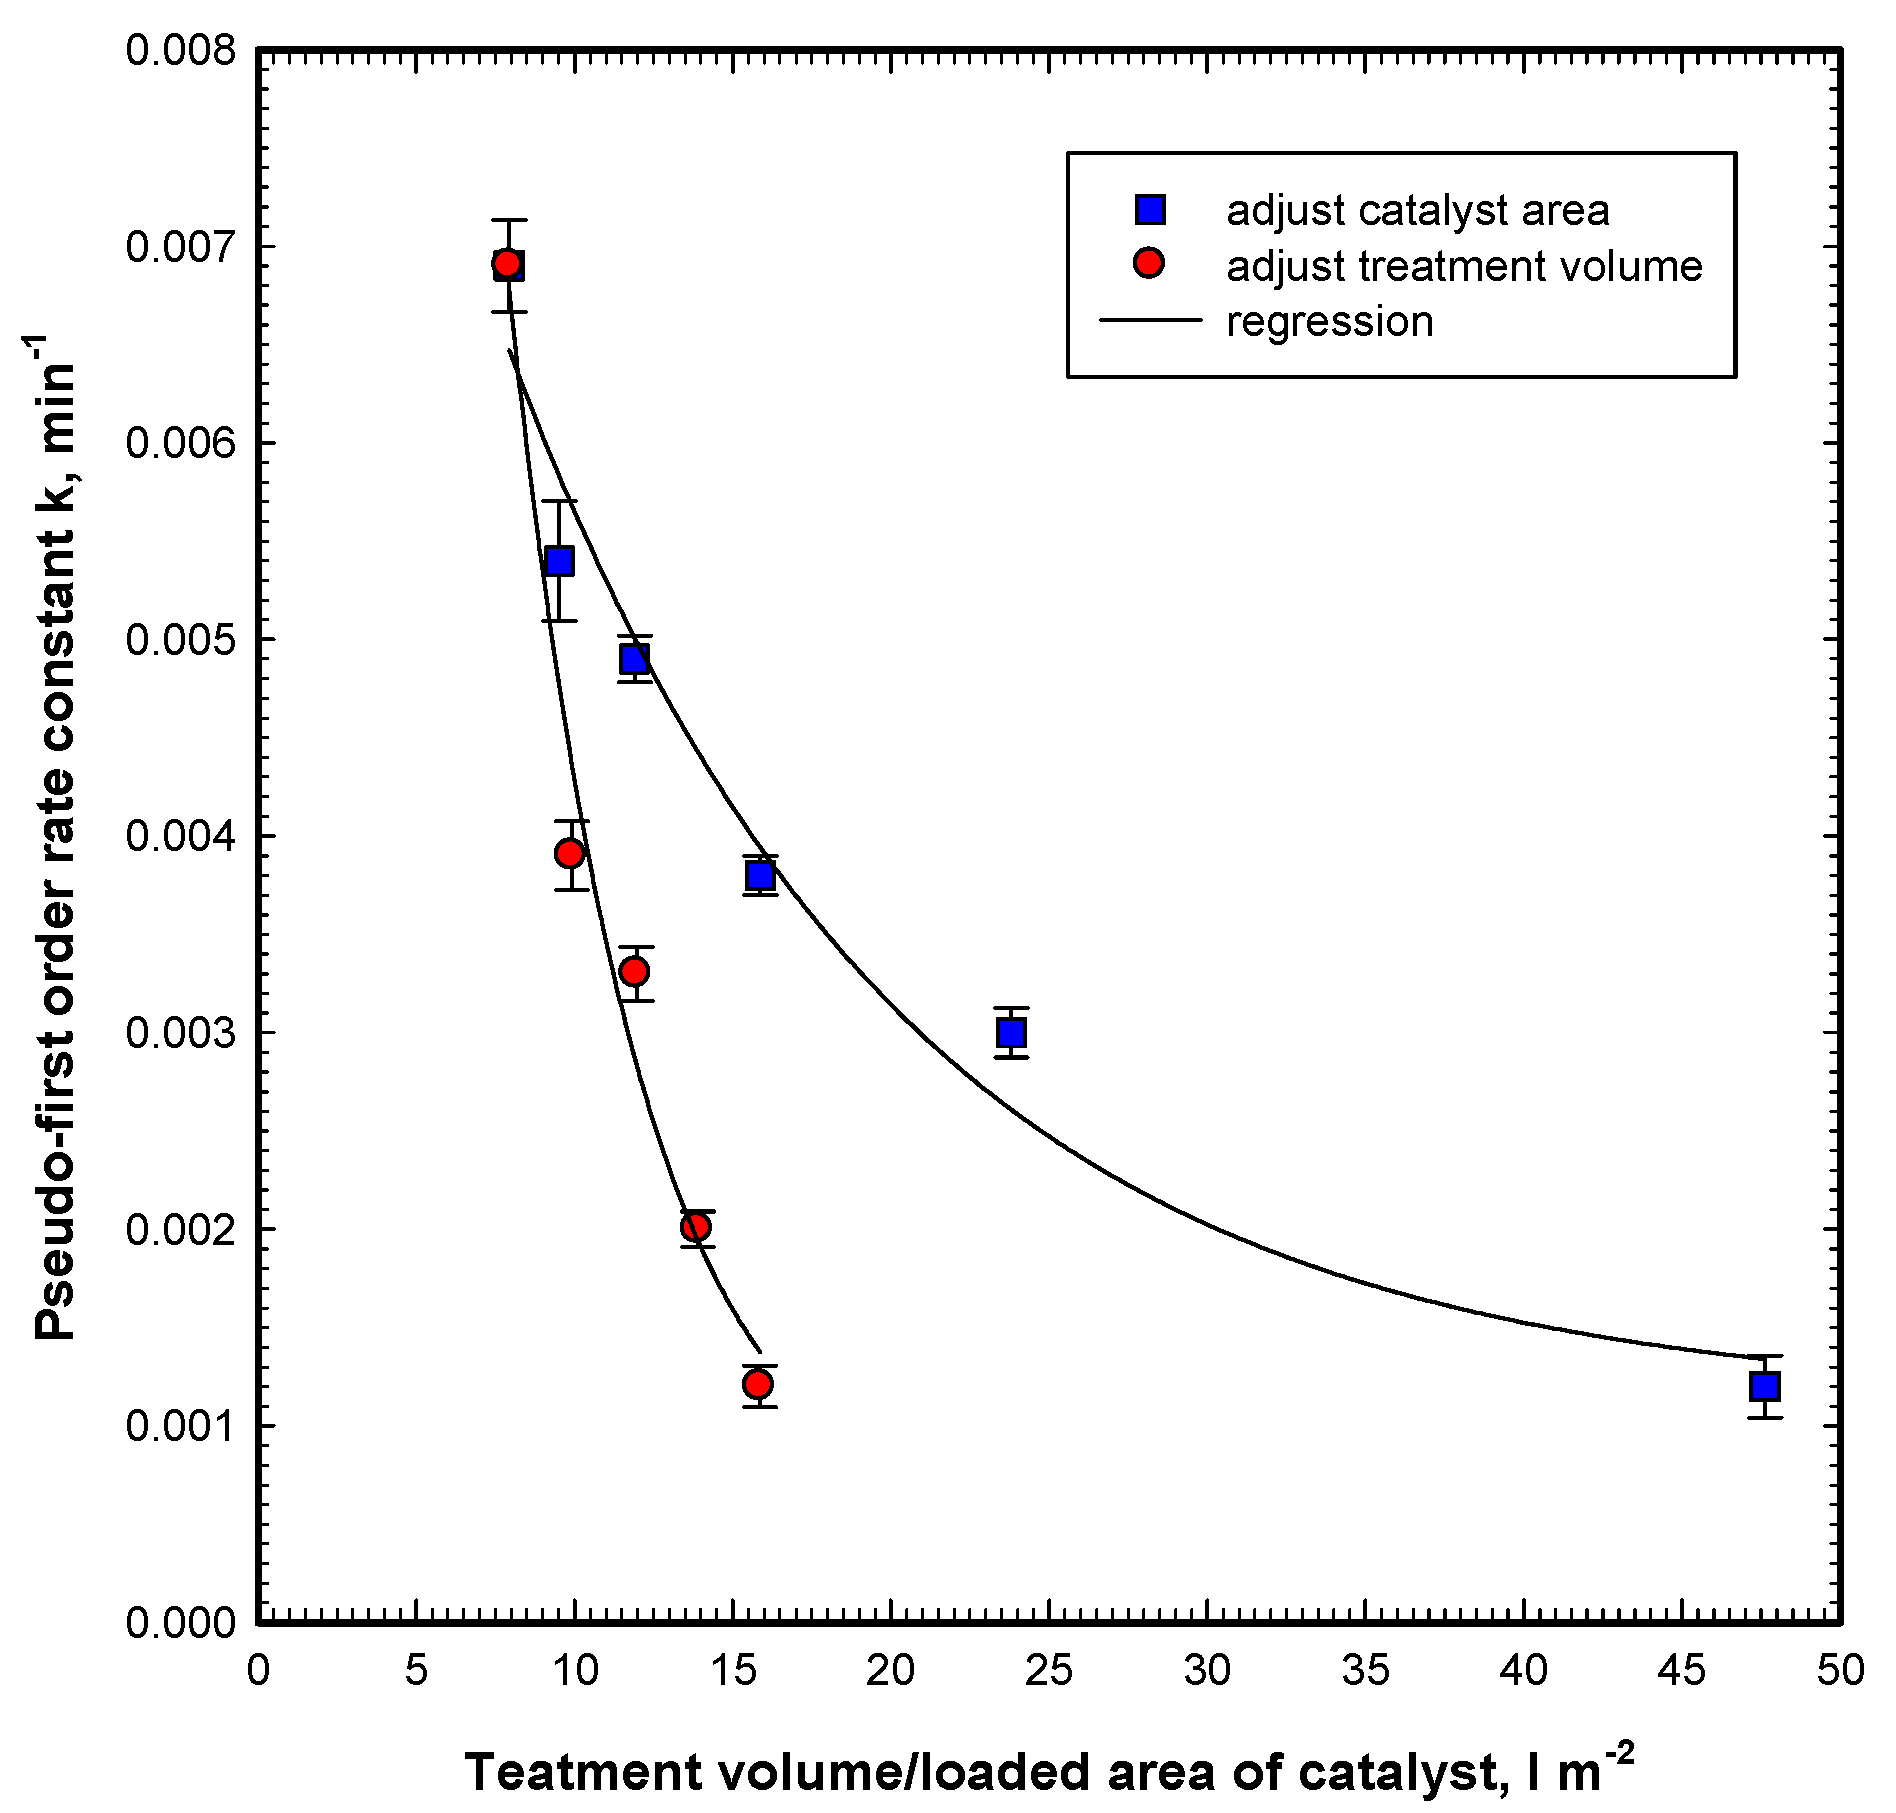
Figure 10.
The comparisons of OG degradation (in ADMI removal efficiency) for various visible light sources by the Vis/ZnO process. The operating conditions were: initial OG concentration of 50 mg L−1, ZnO dosage of 60 g m−2, and reaction time duration of 300 min.
Figure 10.
The comparisons of OG degradation (in ADMI removal efficiency) for various visible light sources by the Vis/ZnO process. The operating conditions were: initial OG concentration of 50 mg L−1, ZnO dosage of 60 g m−2, and reaction time duration of 300 min.
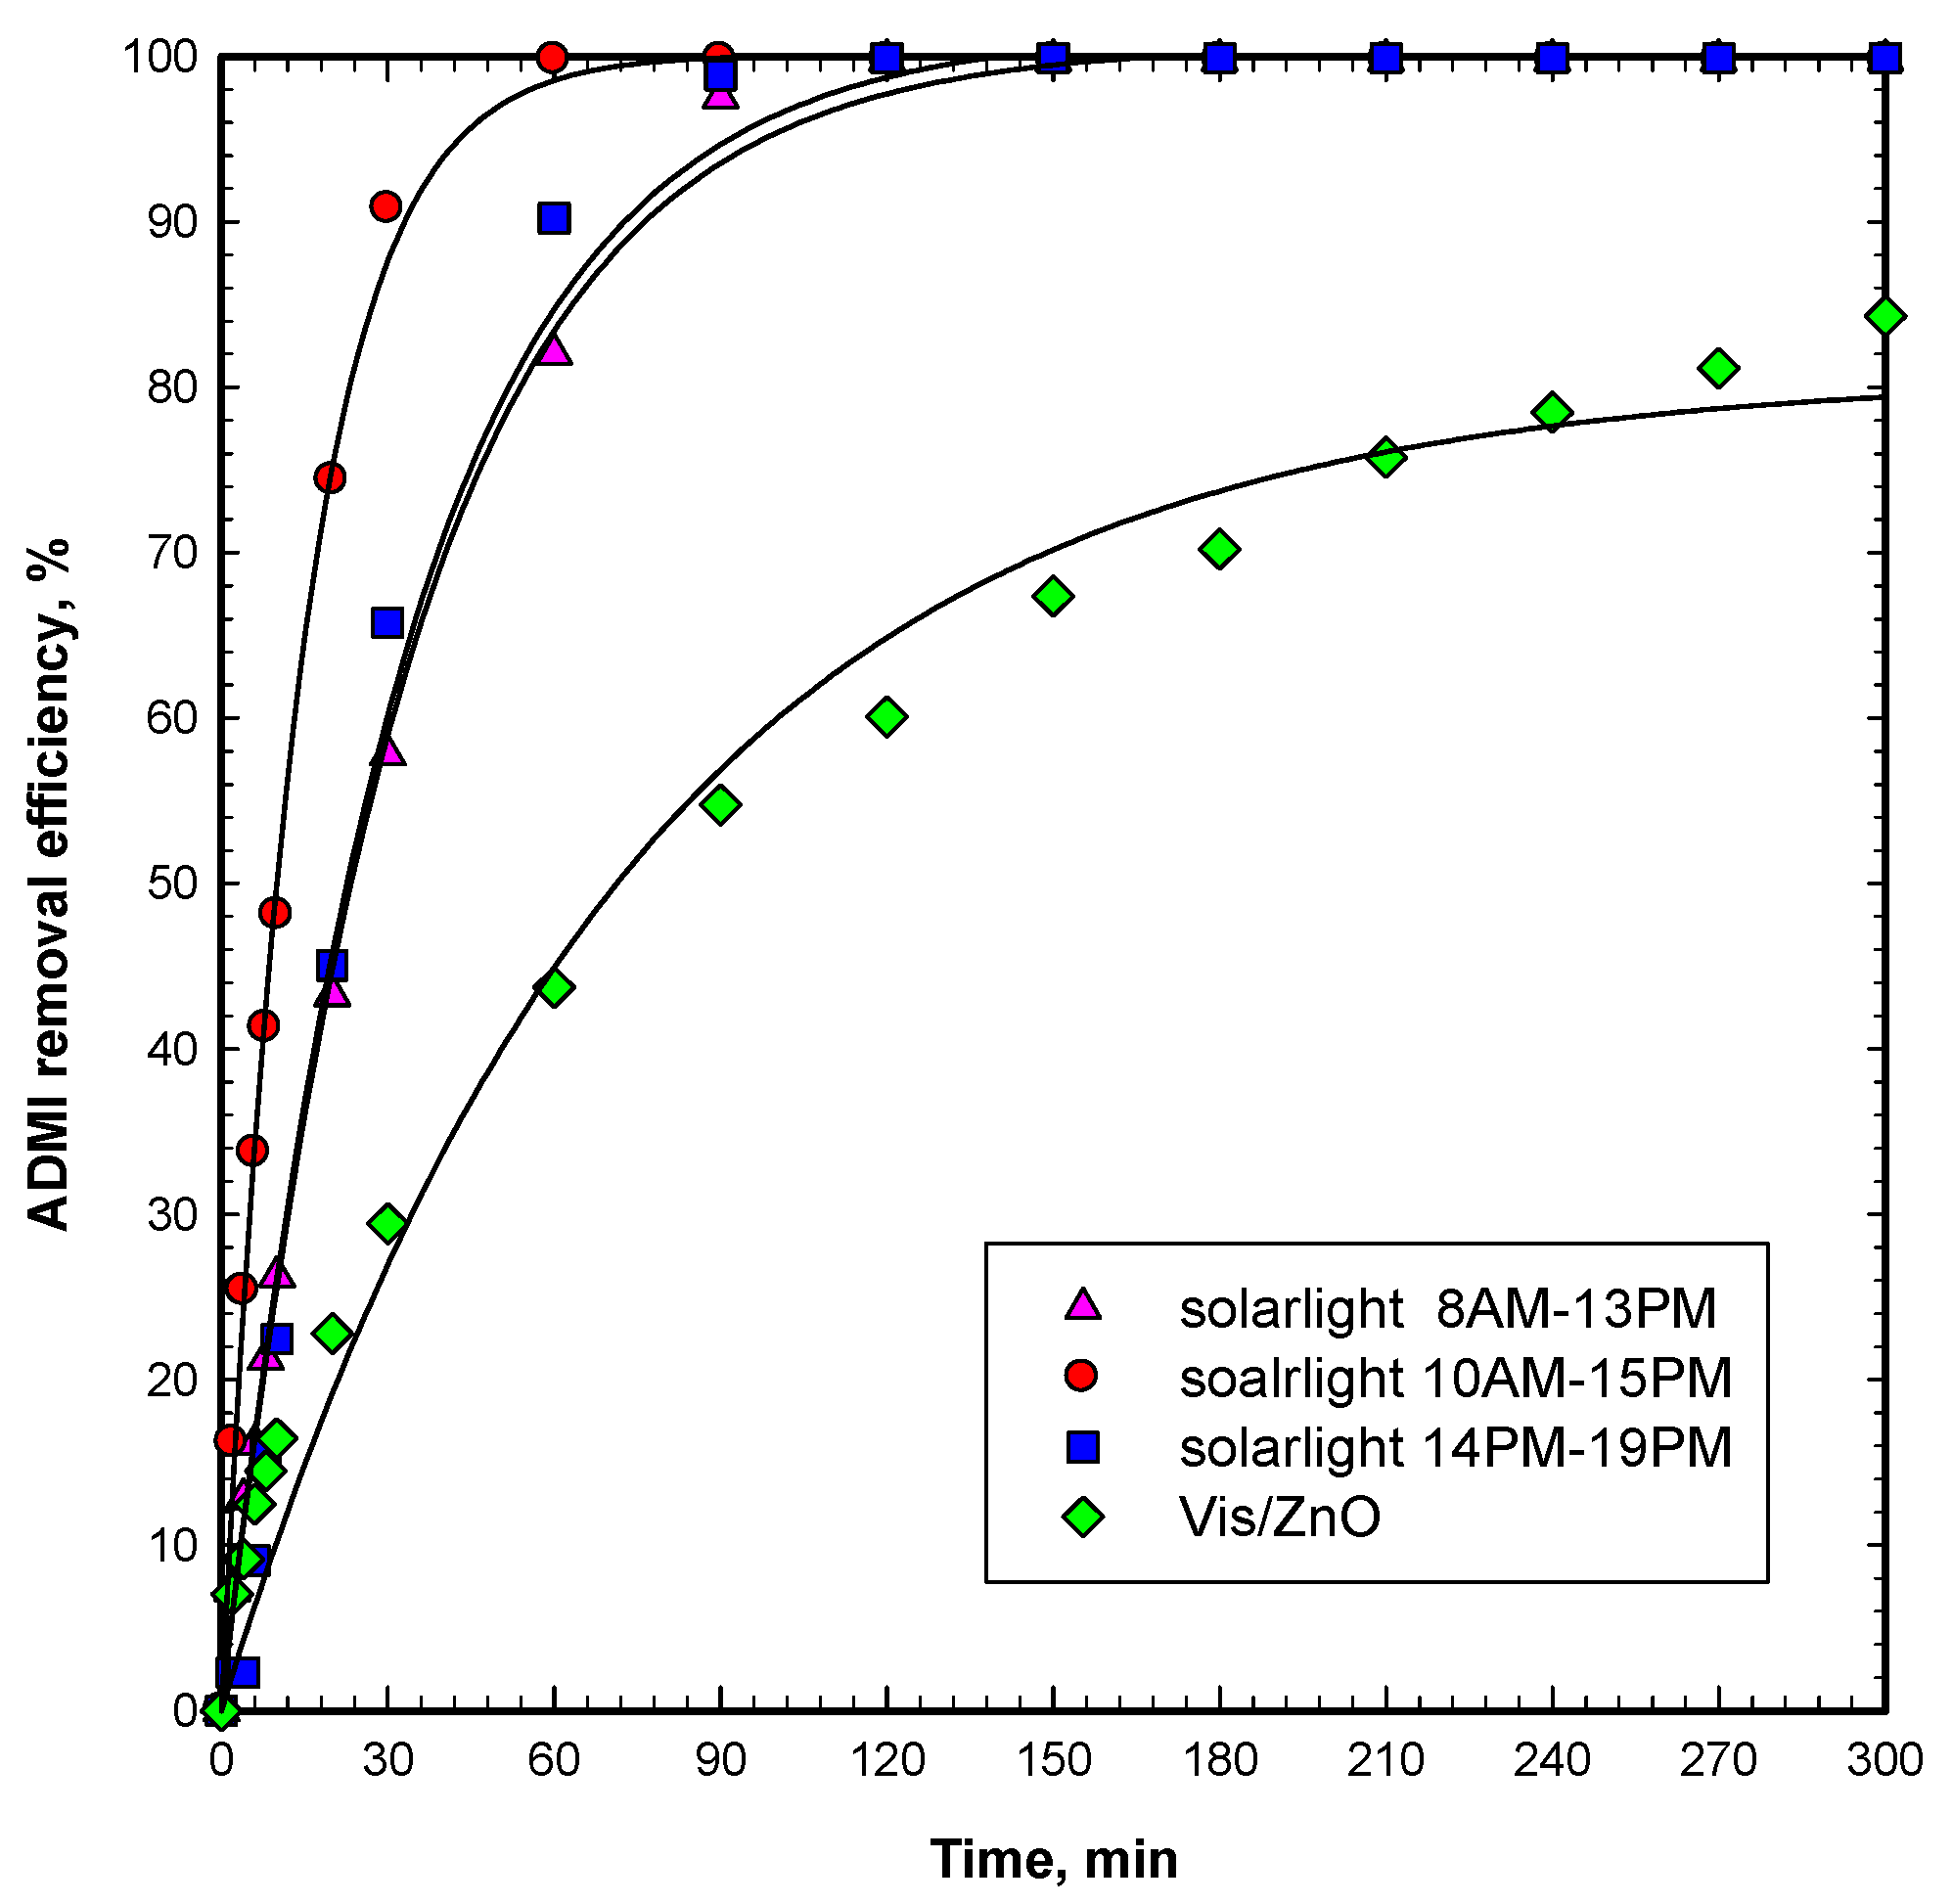
Figure 11.
The mineralization products, (a) organic acids and (b) nitrite, formed under the Vis/ZnO process. The operating conditions were initial OG concentration of 50 mg L−1, ZnO dosage of 60 g m−2, visible light intensity of 9600 Lux, and a reaction time duration of 300 min.
Figure 11.
The mineralization products, (a) organic acids and (b) nitrite, formed under the Vis/ZnO process. The operating conditions were initial OG concentration of 50 mg L−1, ZnO dosage of 60 g m−2, visible light intensity of 9600 Lux, and a reaction time duration of 300 min.

Figure 12.
The diagram of the proposed photocatalytic reaction used in this work (1: CCFL visible light lamps, 2: immobilized ZnO catalyst mesh).
Figure 12.
The diagram of the proposed photocatalytic reaction used in this work (1: CCFL visible light lamps, 2: immobilized ZnO catalyst mesh).
© 2017 by the authors. Licensee MDPI, Basel, Switzerland. This article is an open access article distributed under the terms and conditions of the Creative Commons Attribution (CC BY) license (http://creativecommons.org/licenses/by/4.0/).
Share and Cite
MDPI and ACS Style
Shu, H.-Y.; Chang, M.-C.; Tseng, T.-H. Solar and Visible Light Illumination on Immobilized Nano Zinc Oxide for the Degradation and Mineralization of Orange G in Wastewater. Catalysts 2017, 7, 164. https://doi.org/10.3390/catal7050164
AMA Style
Shu H-Y, Chang M-C, Tseng T-H. Solar and Visible Light Illumination on Immobilized Nano Zinc Oxide for the Degradation and Mineralization of Orange G in Wastewater. Catalysts. 2017; 7(5):164. https://doi.org/10.3390/catal7050164
Chicago/Turabian StyleShu, Hung-Yee, Ming-Chin Chang, and Tien-Hsin Tseng. 2017. "Solar and Visible Light Illumination on Immobilized Nano Zinc Oxide for the Degradation and Mineralization of Orange G in Wastewater" Catalysts 7, no. 5: 164. https://doi.org/10.3390/catal7050164
Note that from the first issue of 2016, this journal uses article numbers instead of page numbers. See further details here.