Co-Deposition of a Hydrogel/Calcium Phosphate Hybrid Layer on 3D Printed Poly(Lactic Acid) Scaffolds via Dip Coating: Towards Automated Biomaterials Fabrication

Abstract
:
1. Introduction
2. Materials and Methods
2.1. Materials
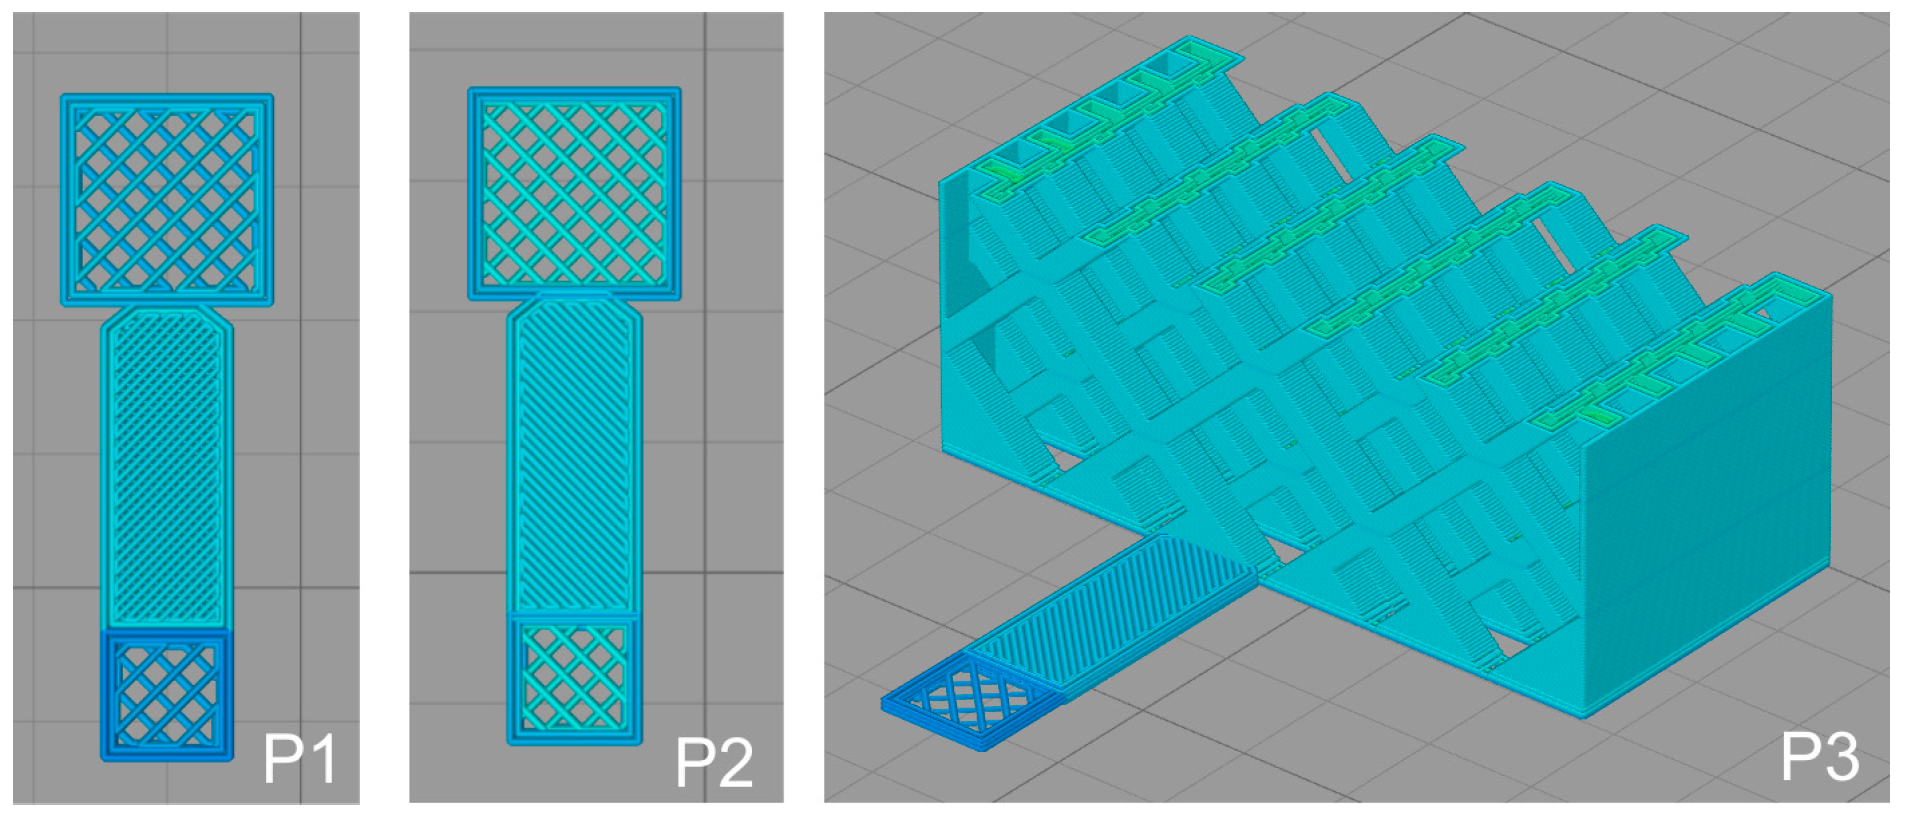
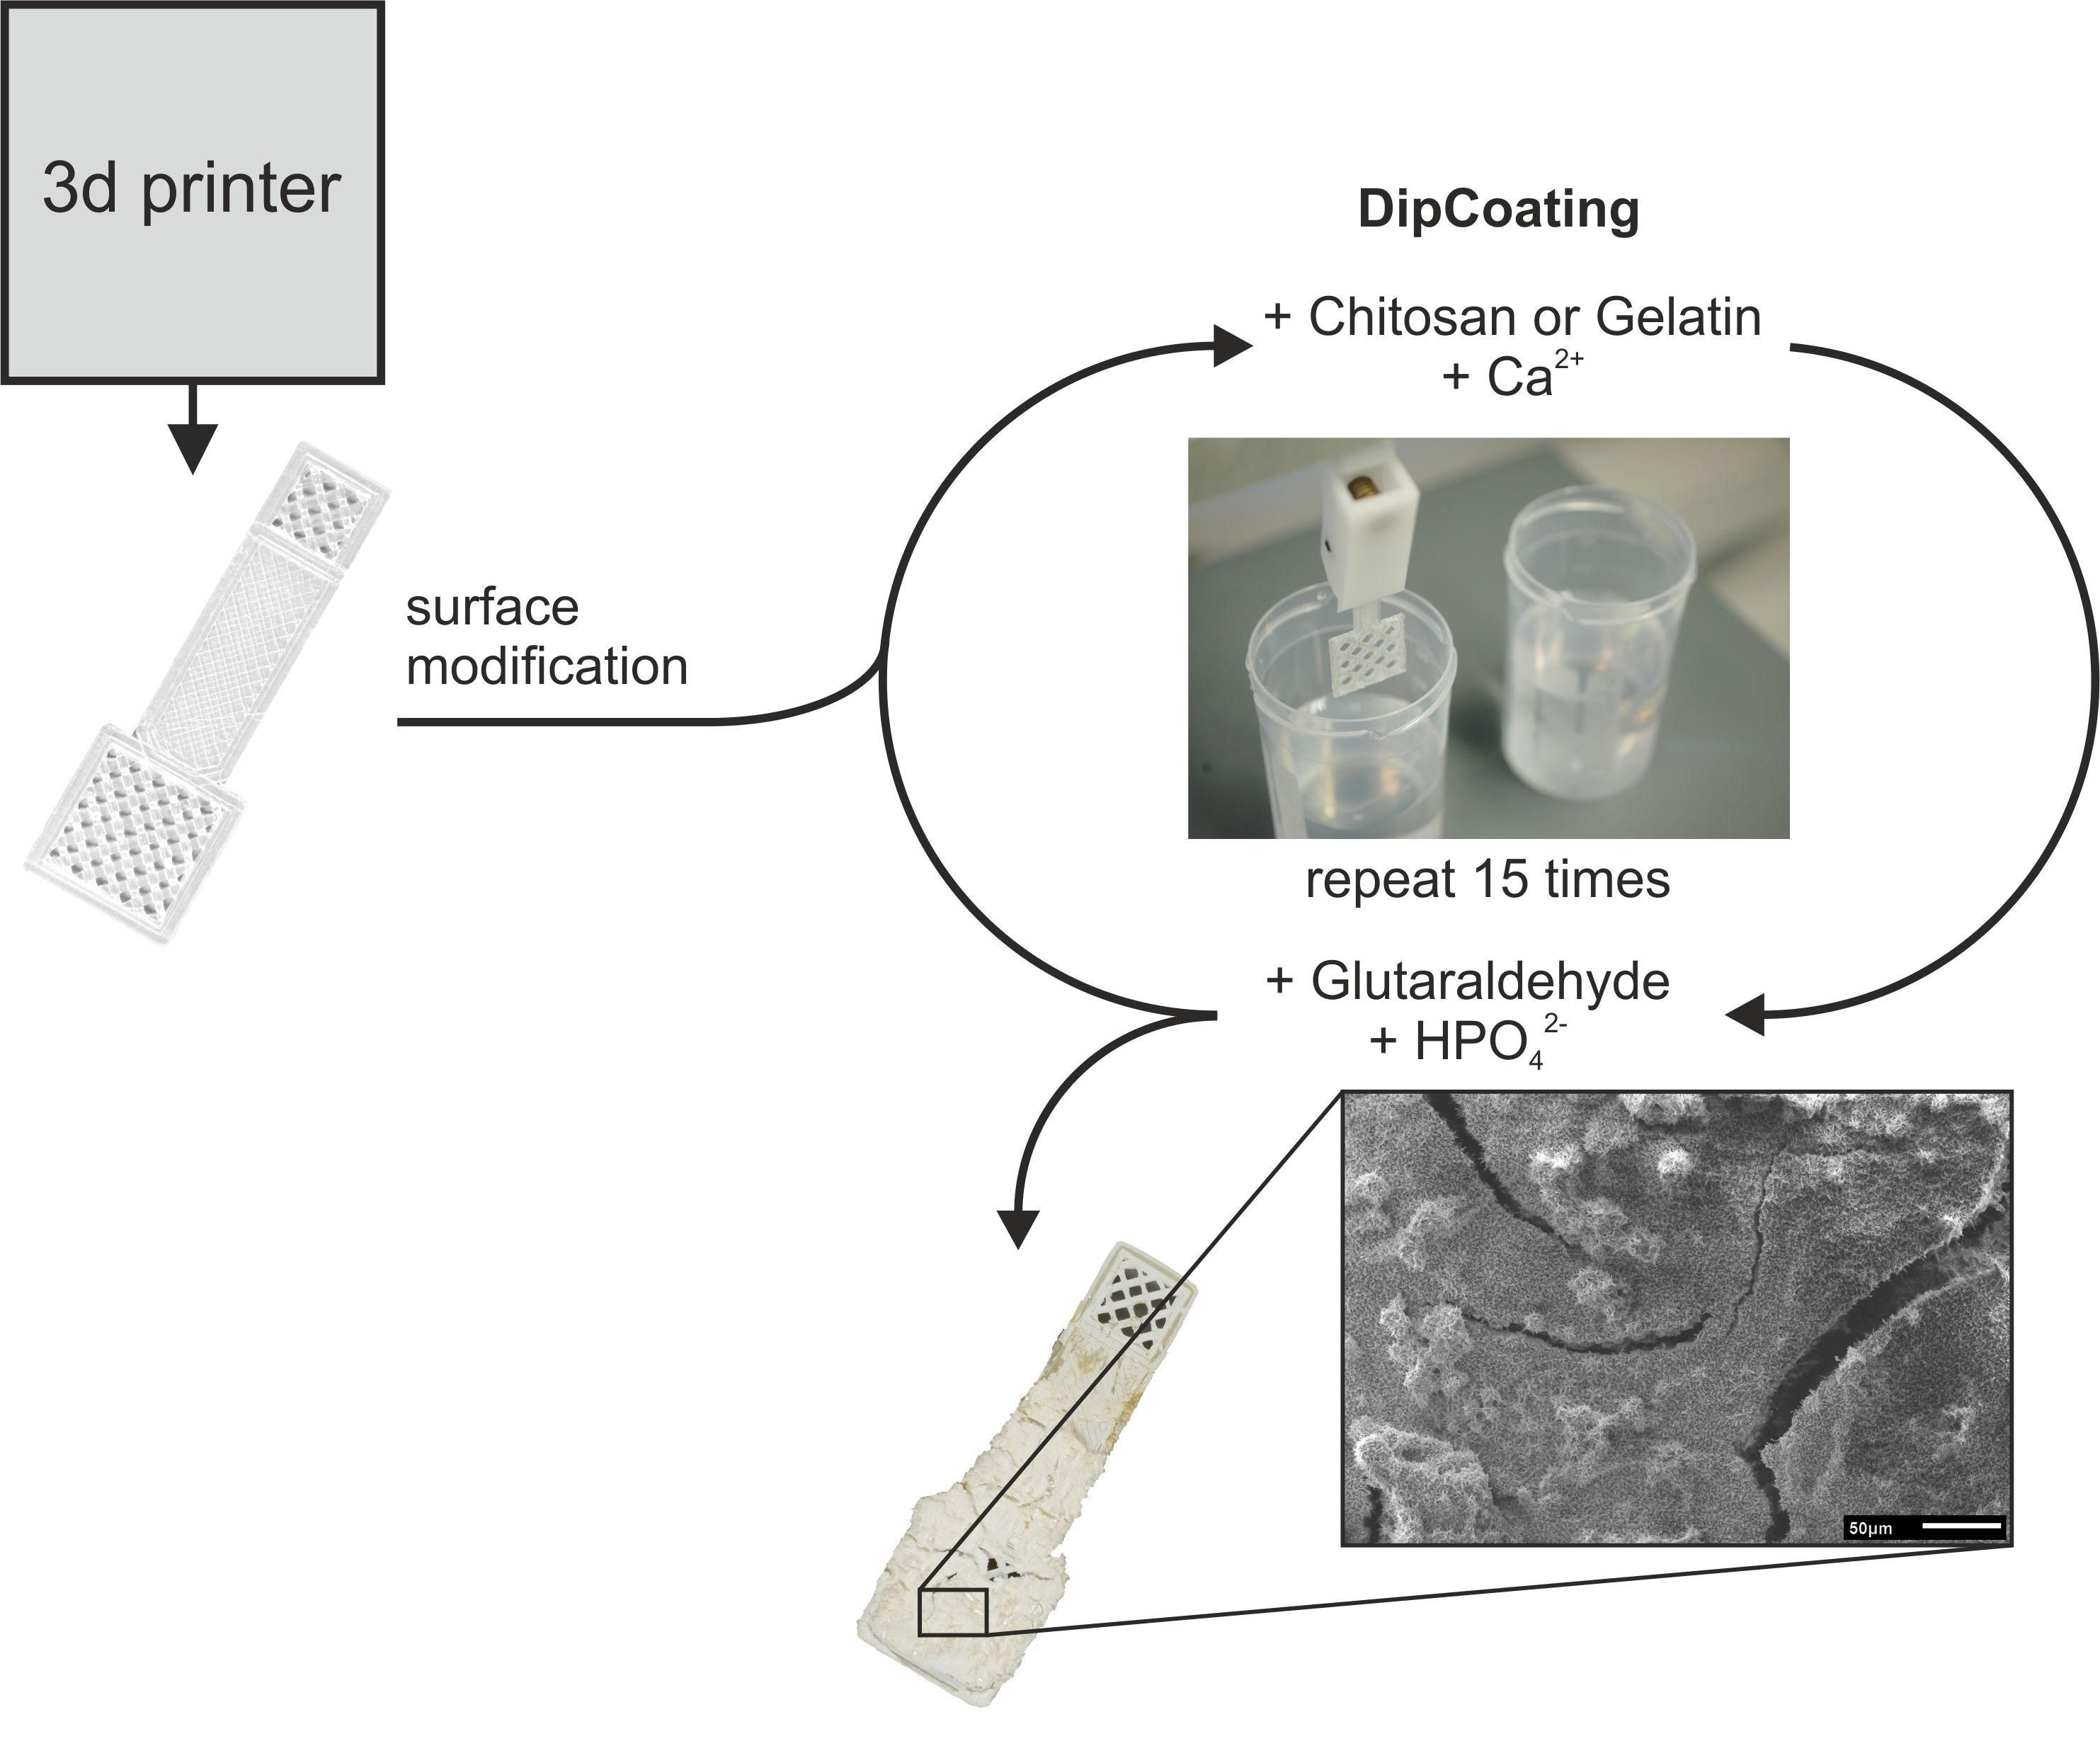
2.2. 3D Printing of PLA Scaffolds
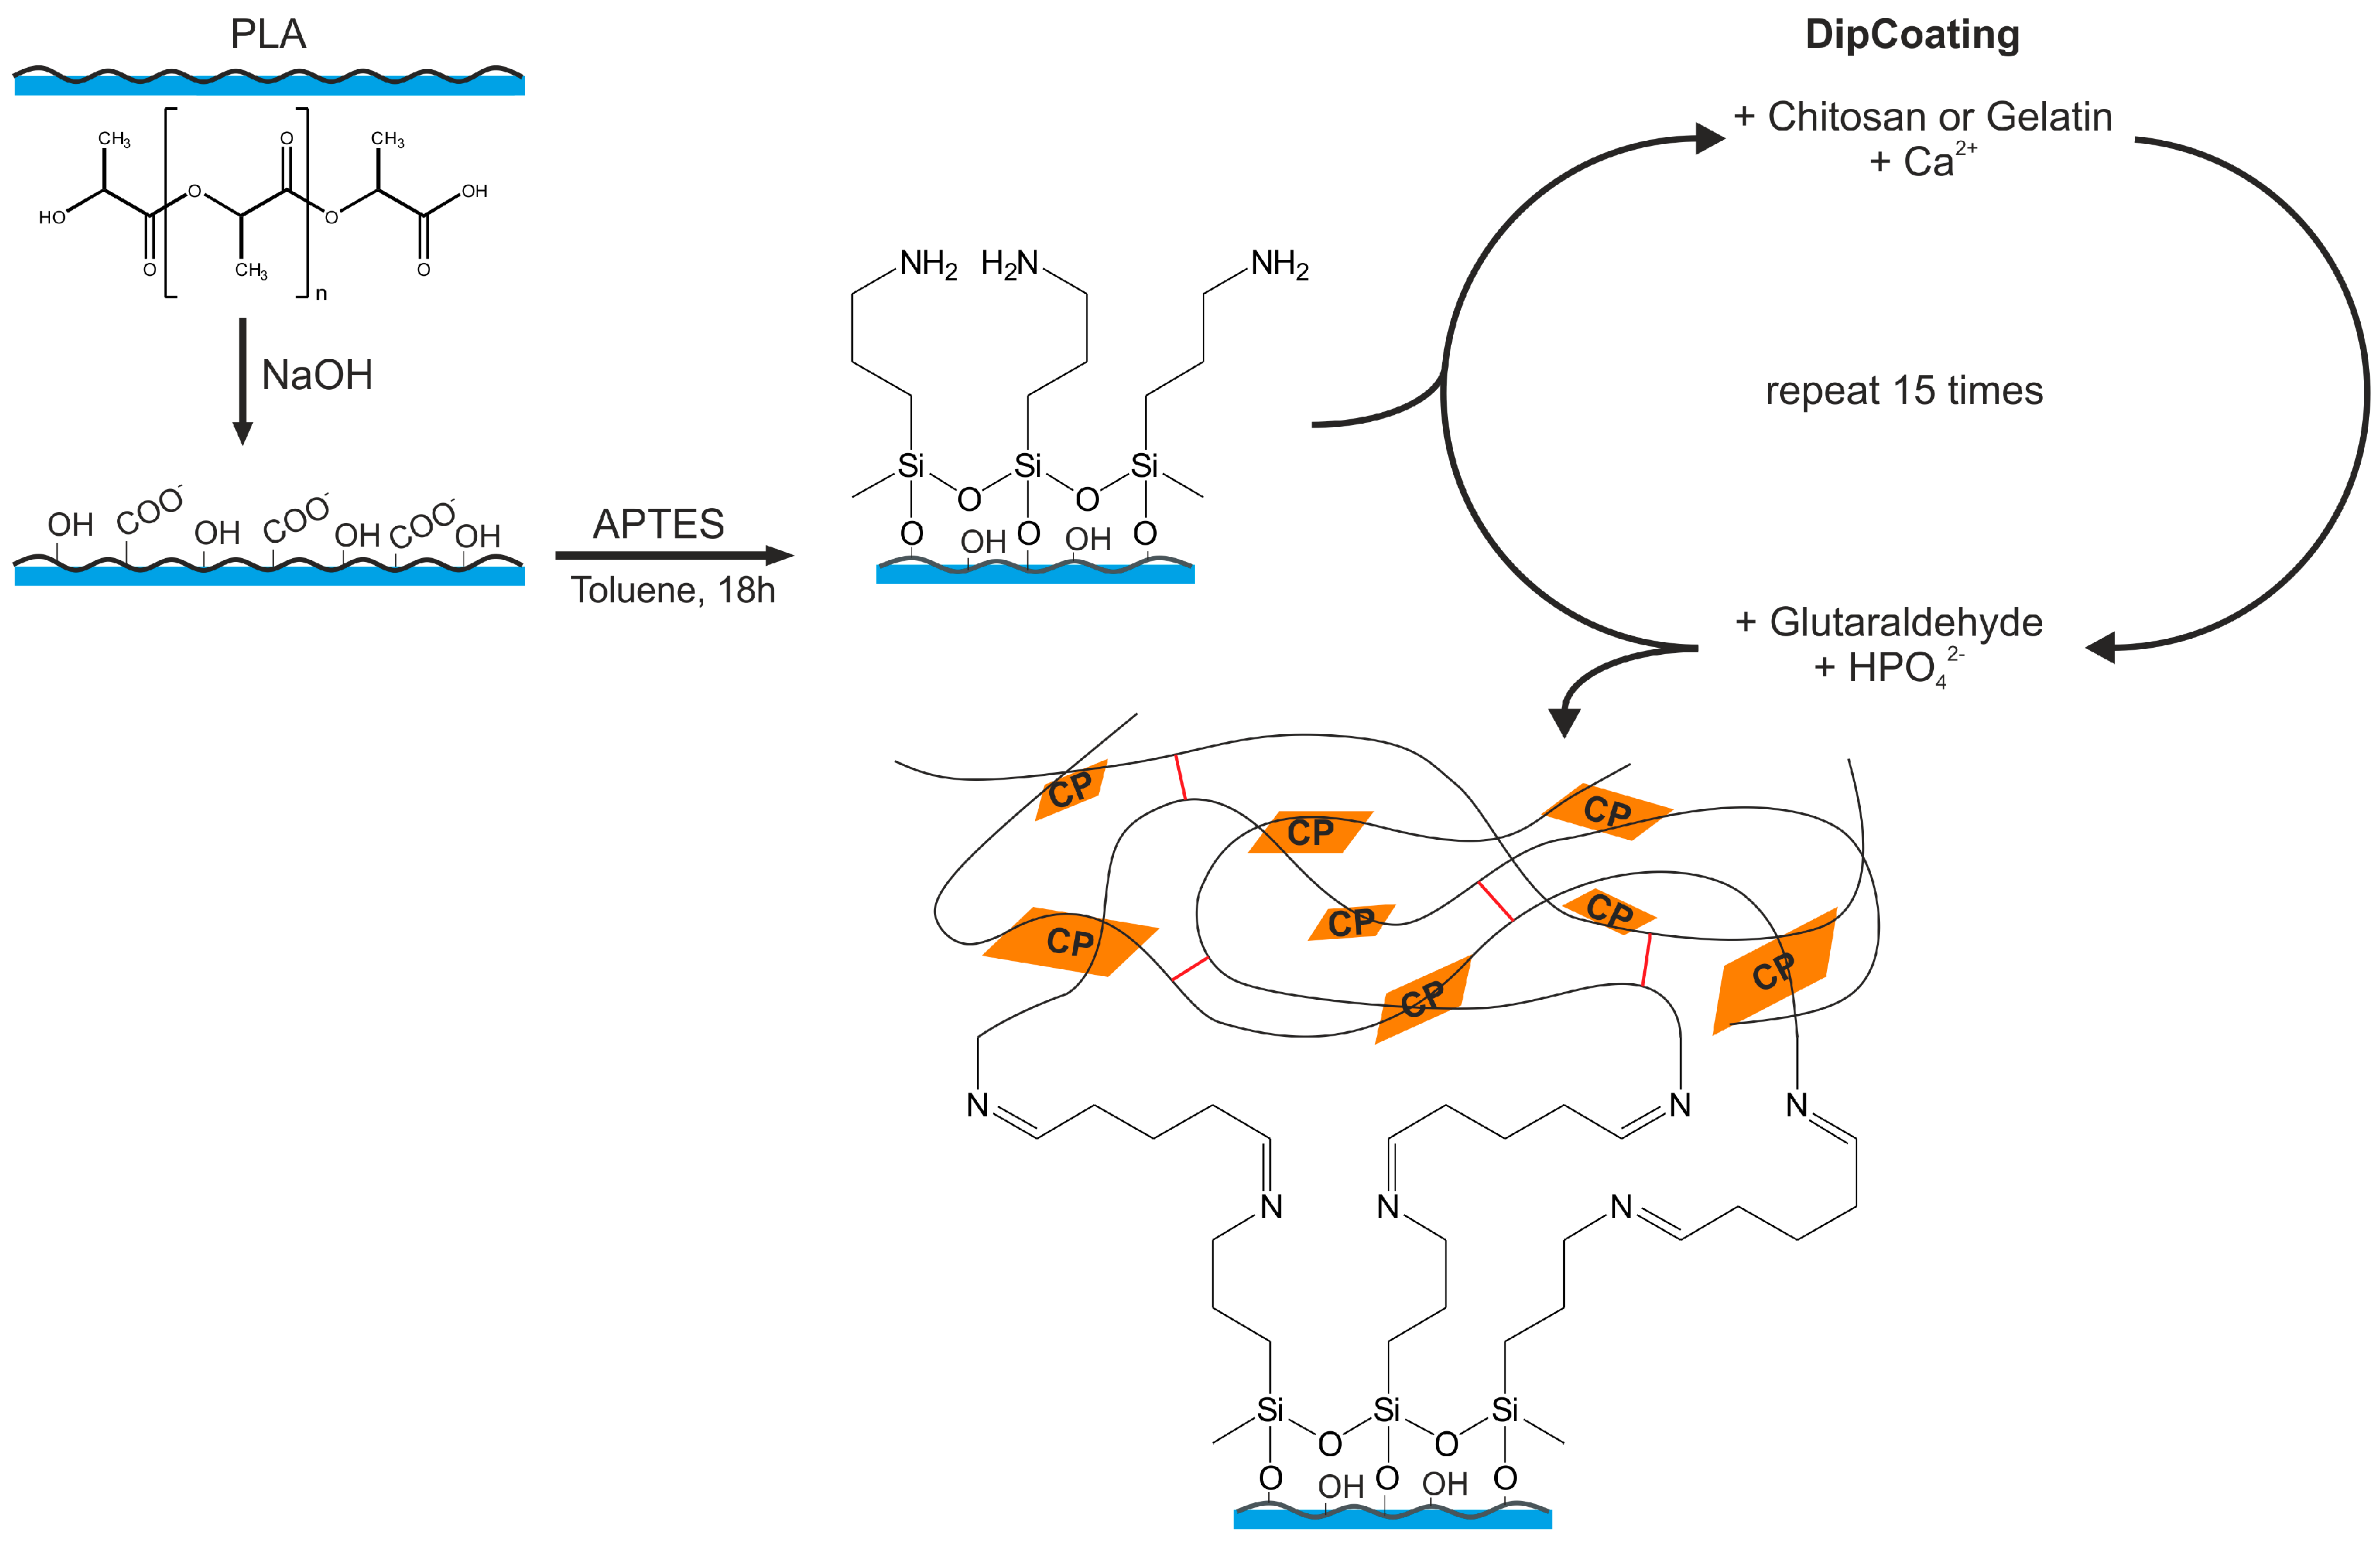
2.3. Modification of PLA Scaffolds
2.4. Combined Hydrogel Deposition and Calcium Phosphate Mineralization
2.5. Characterization
3. Results
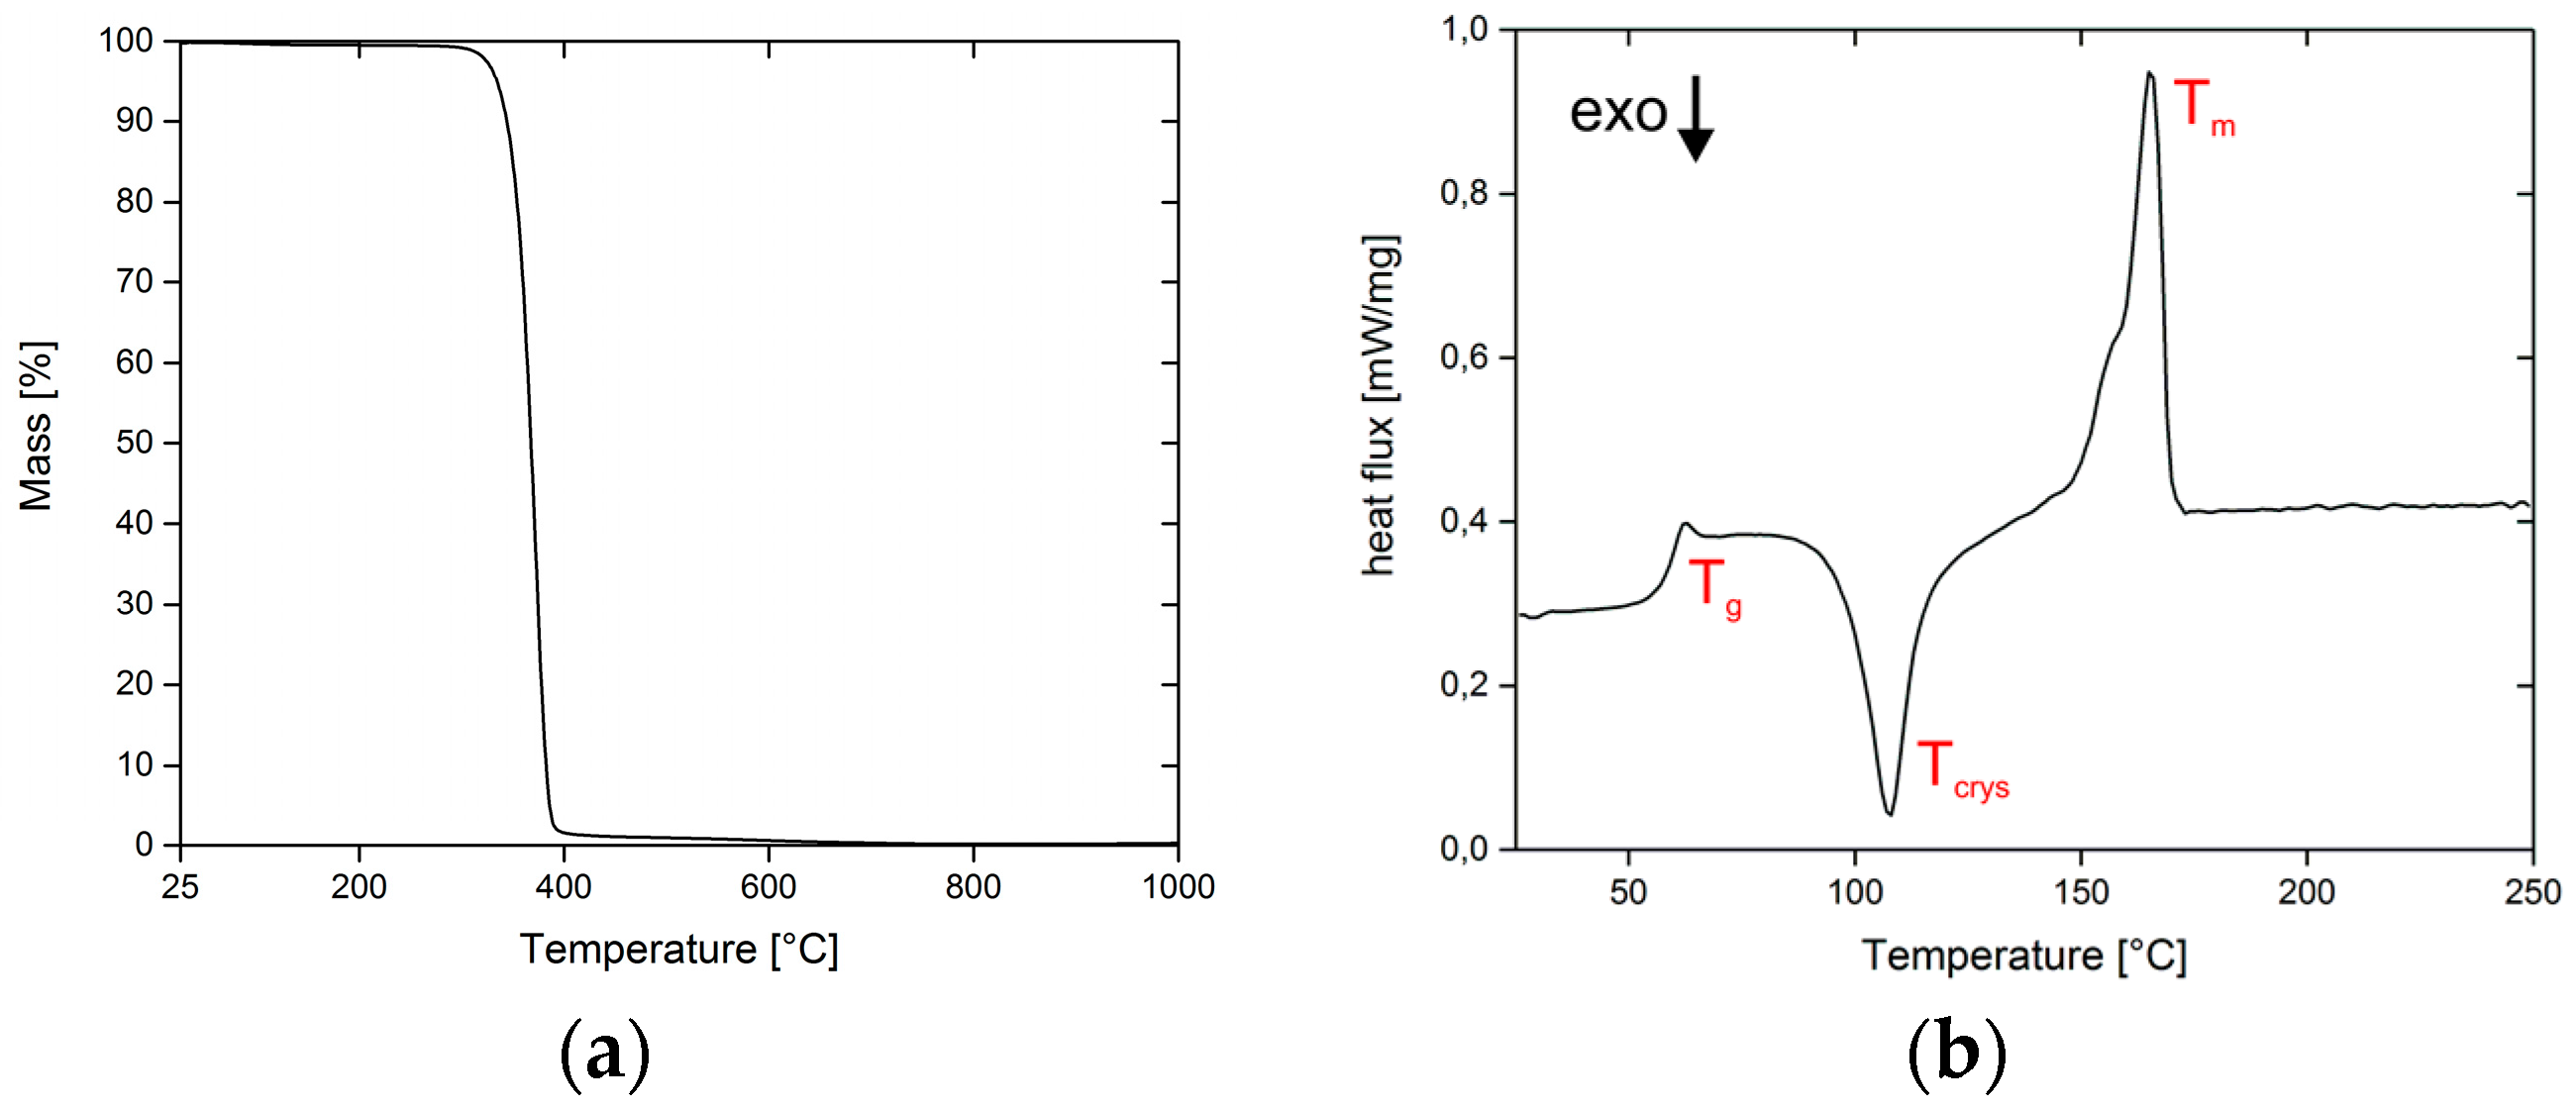
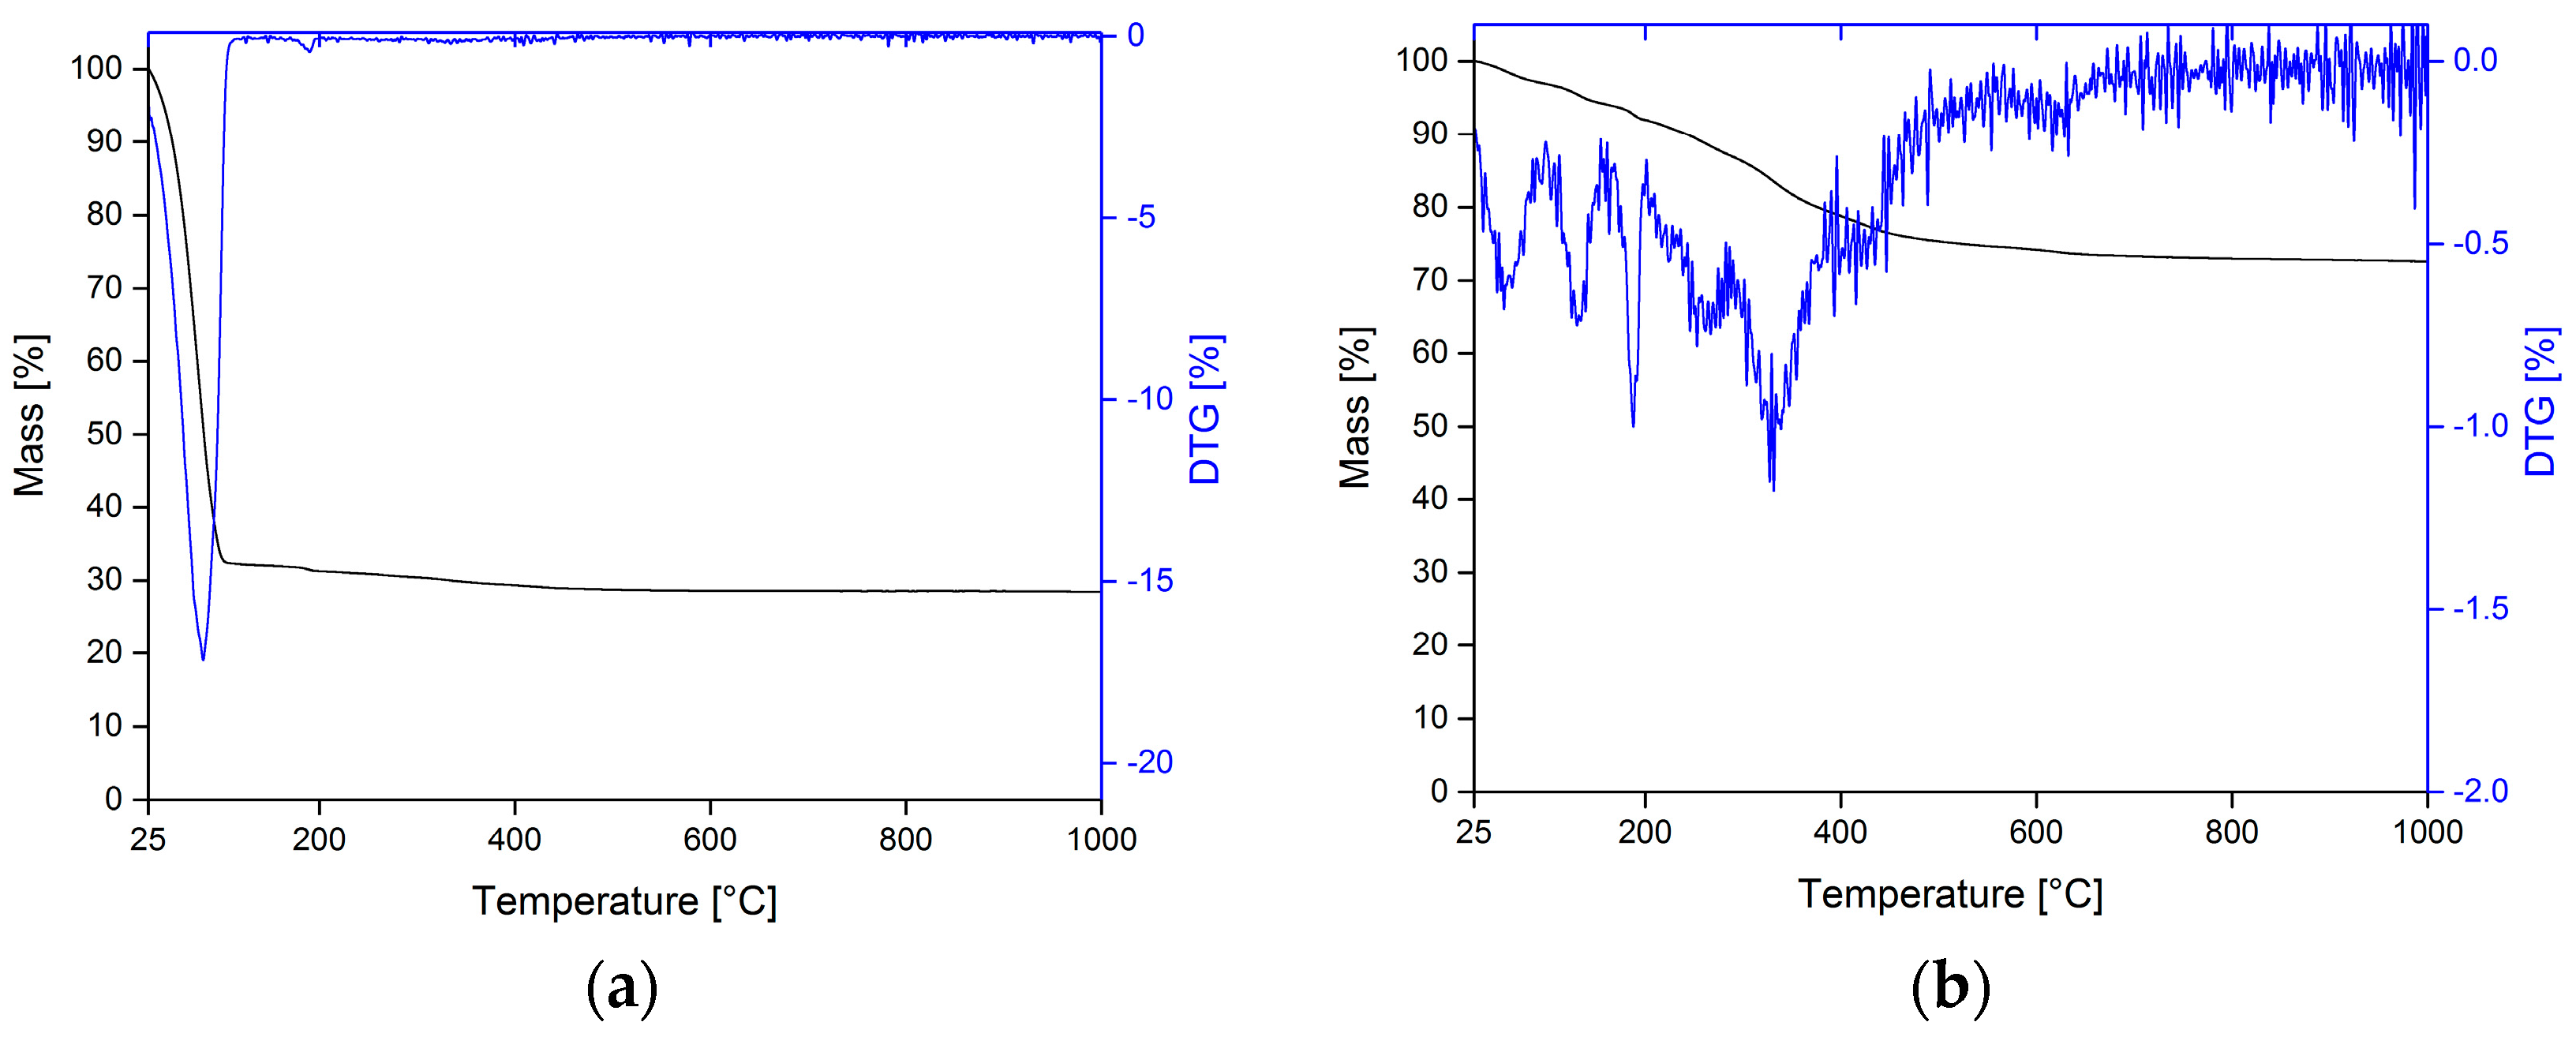
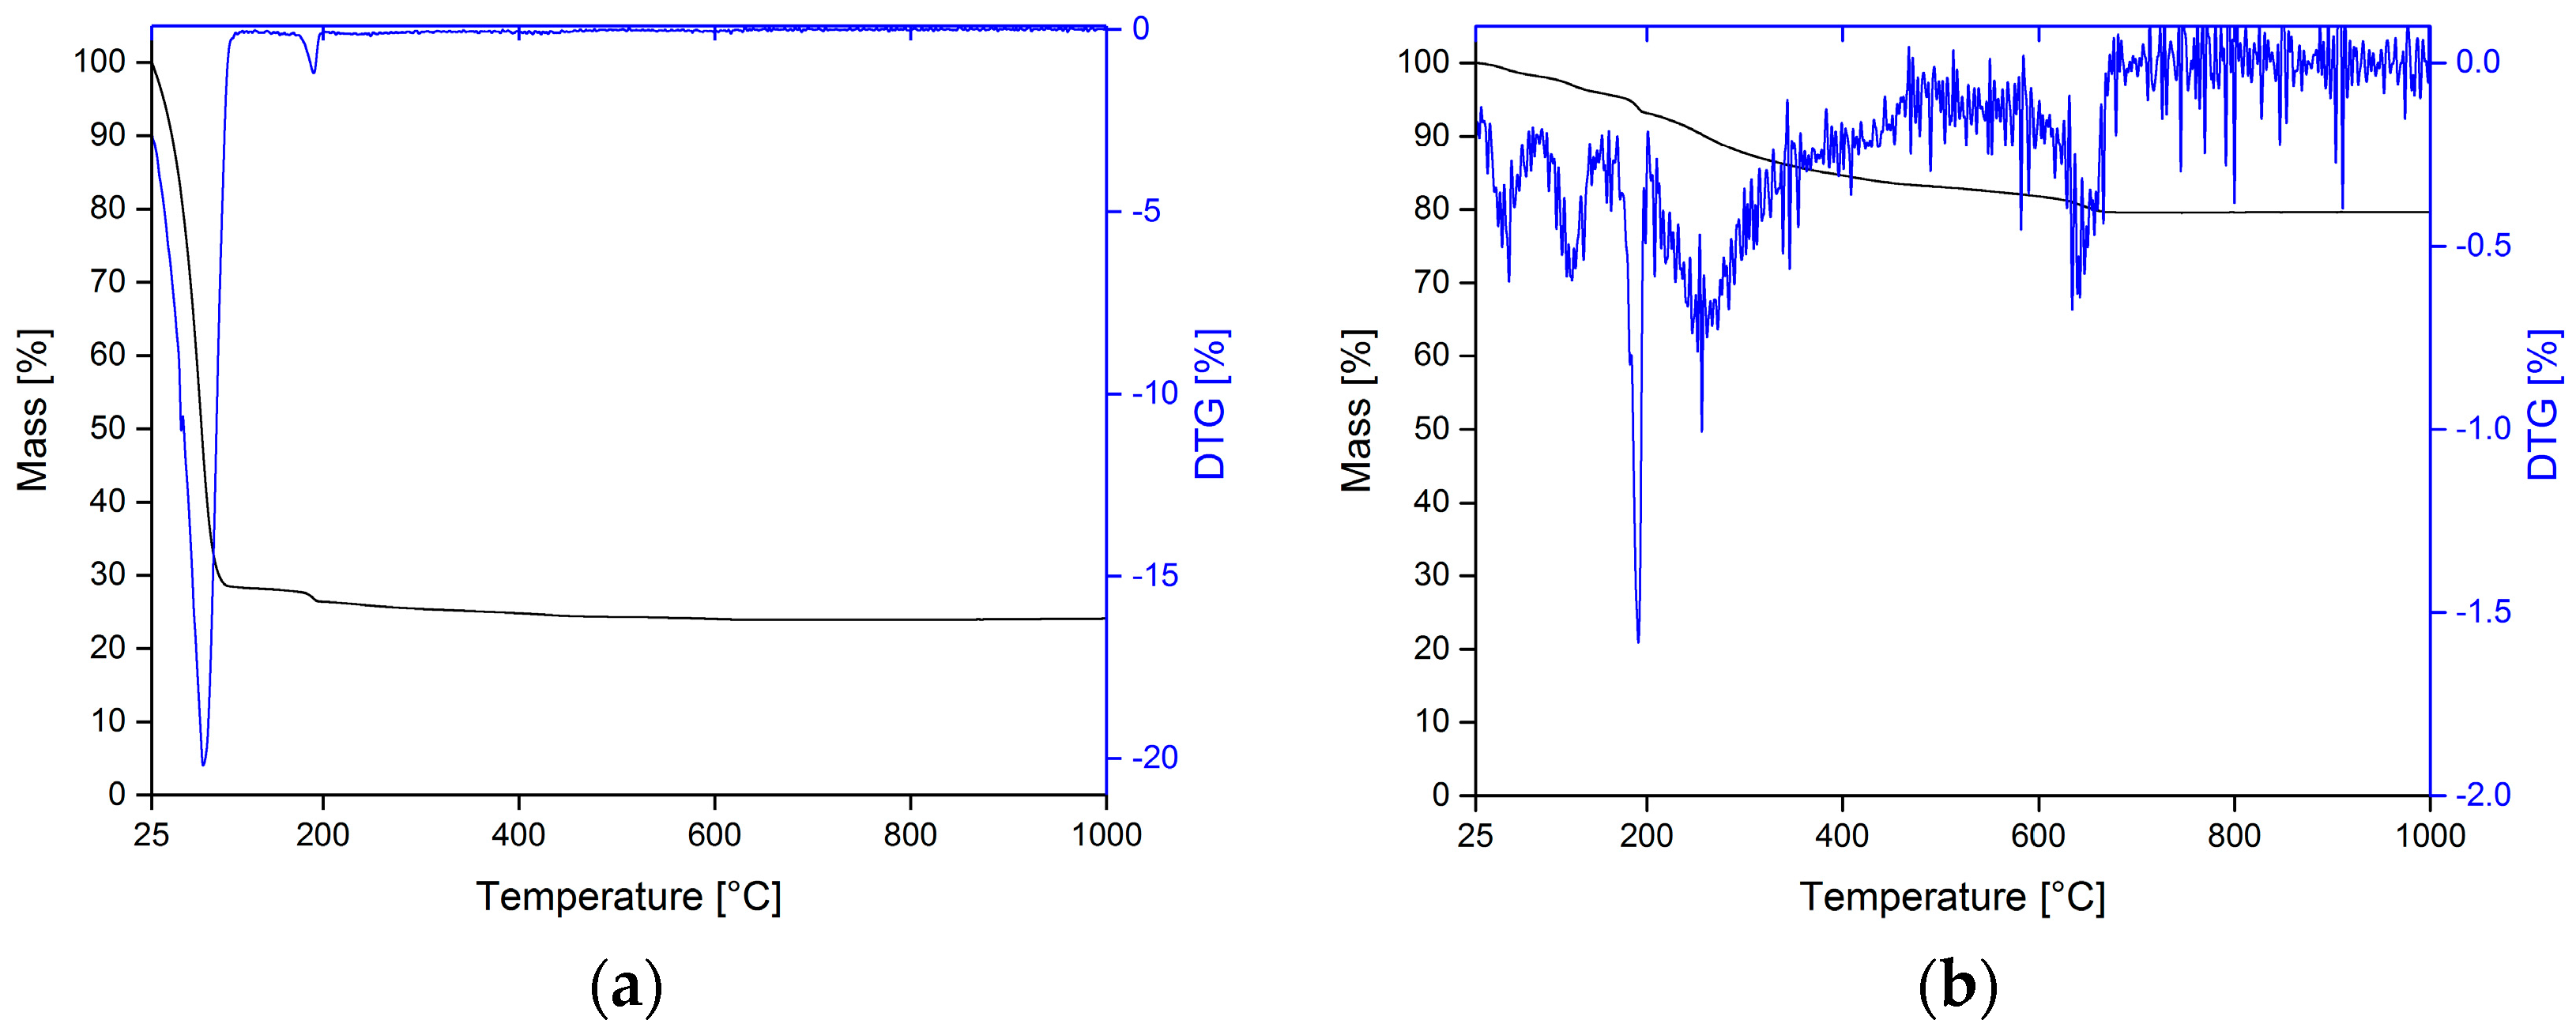
3.1. Thermal Analysis of PLA Filaments
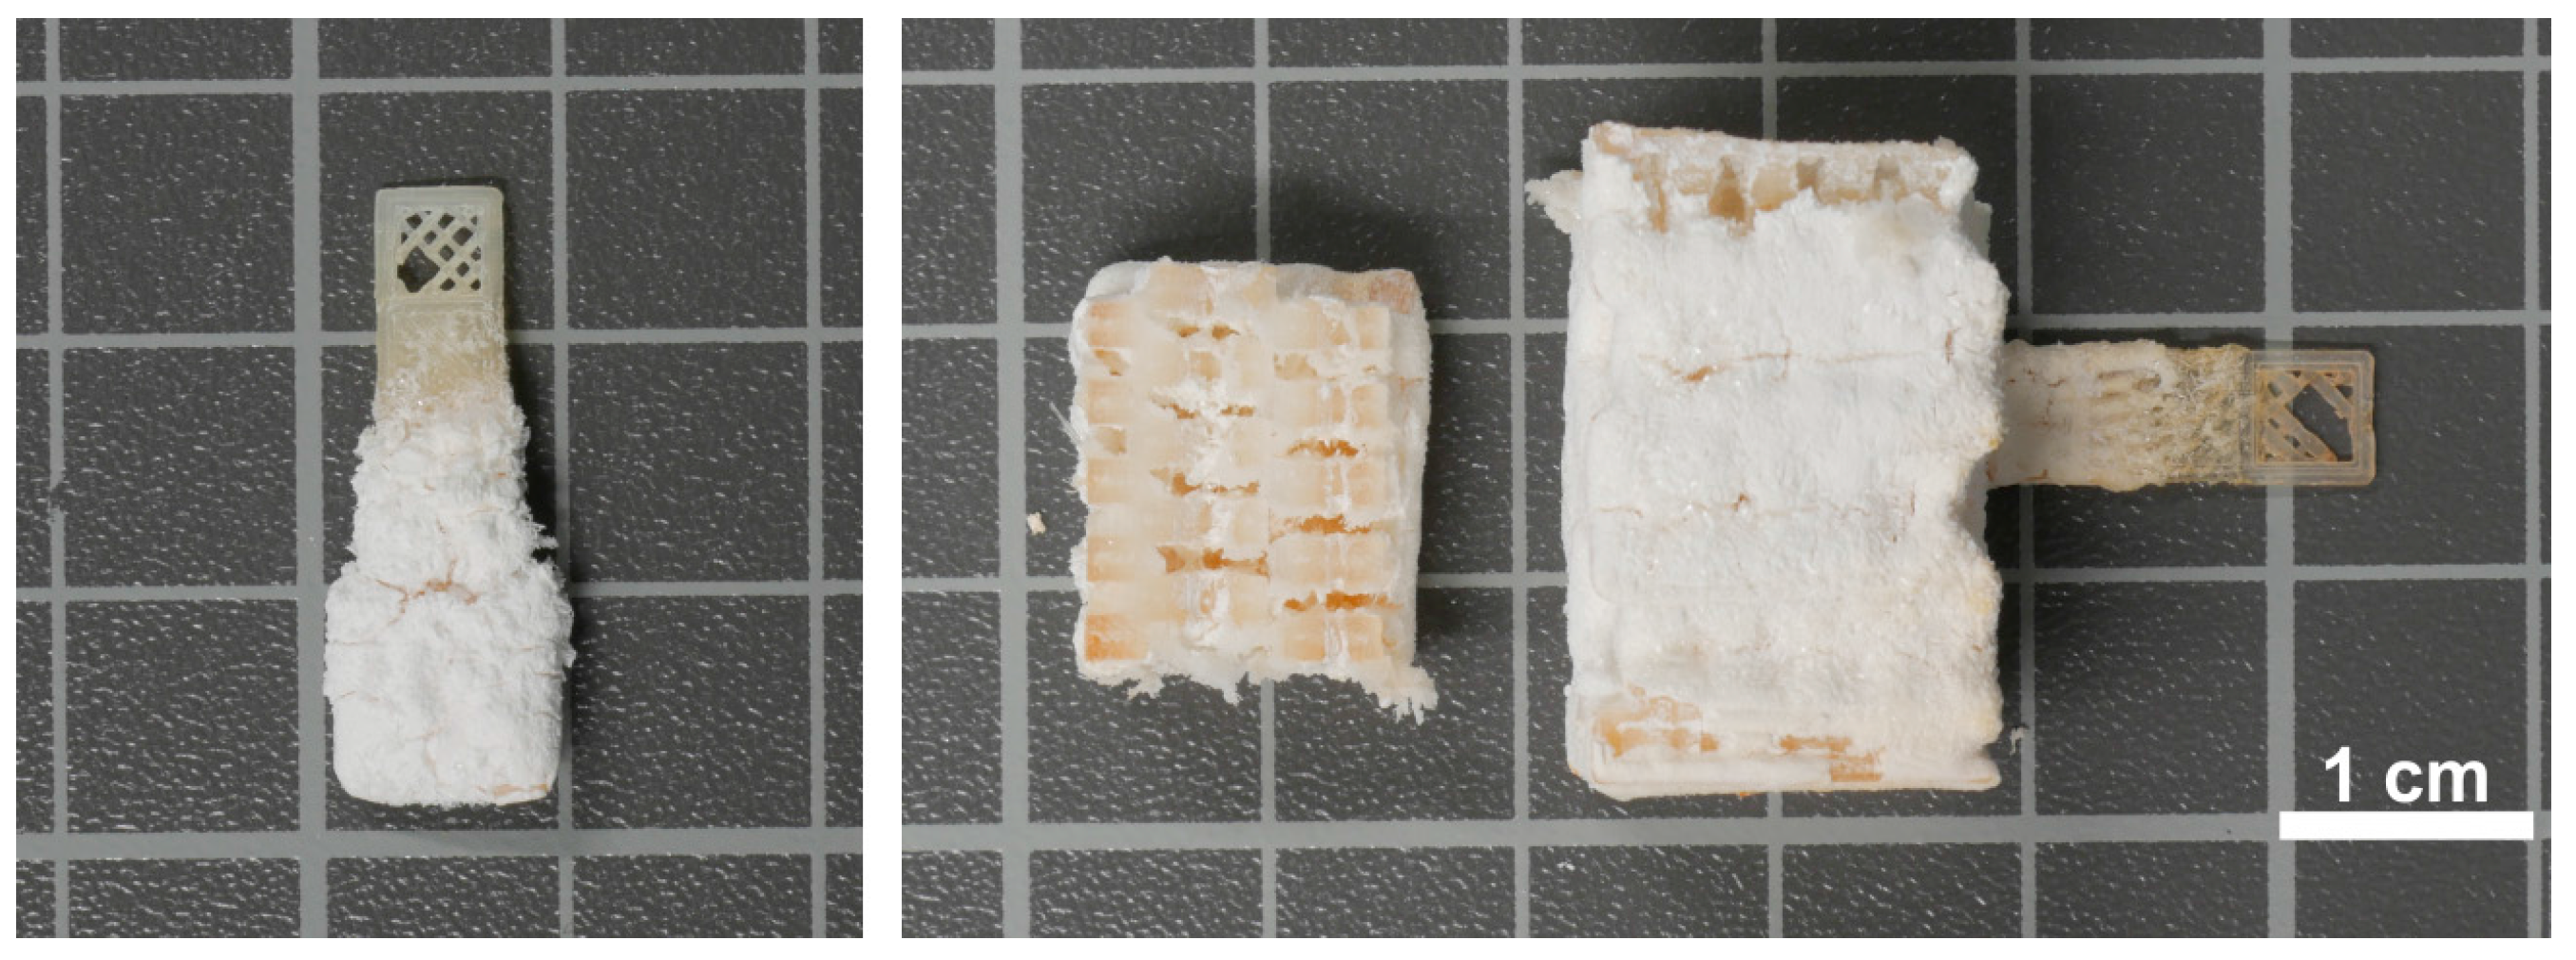
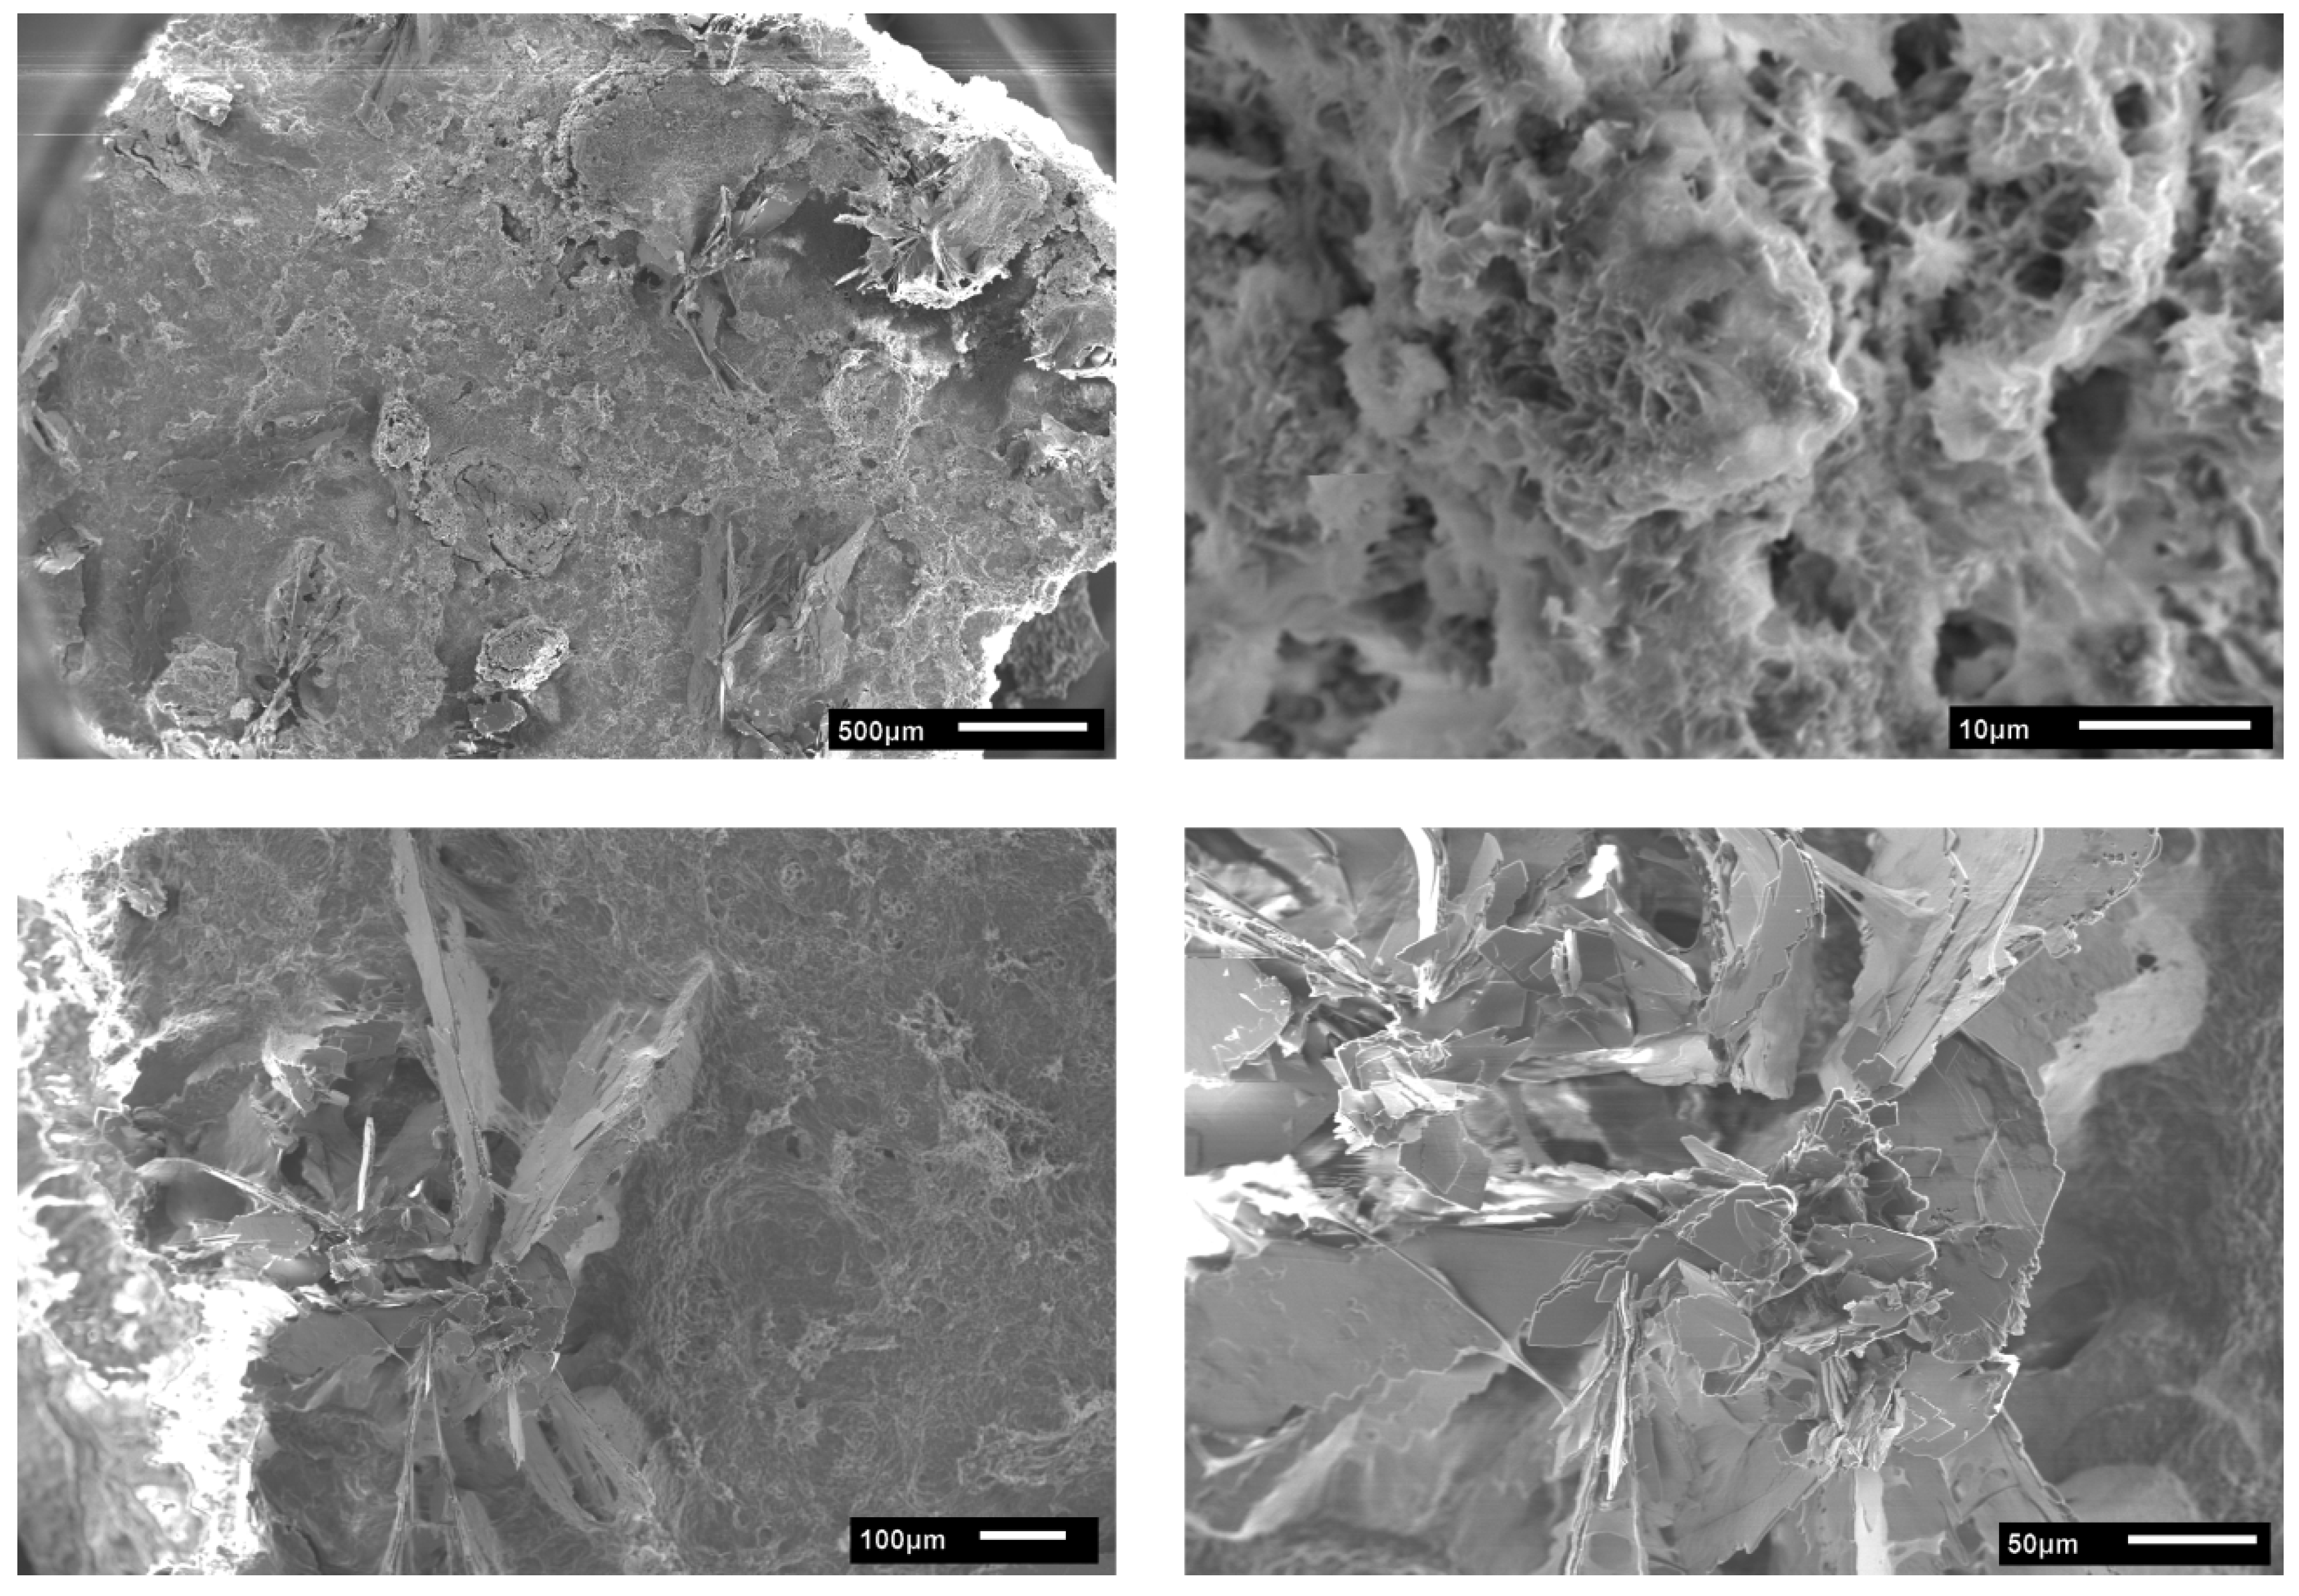
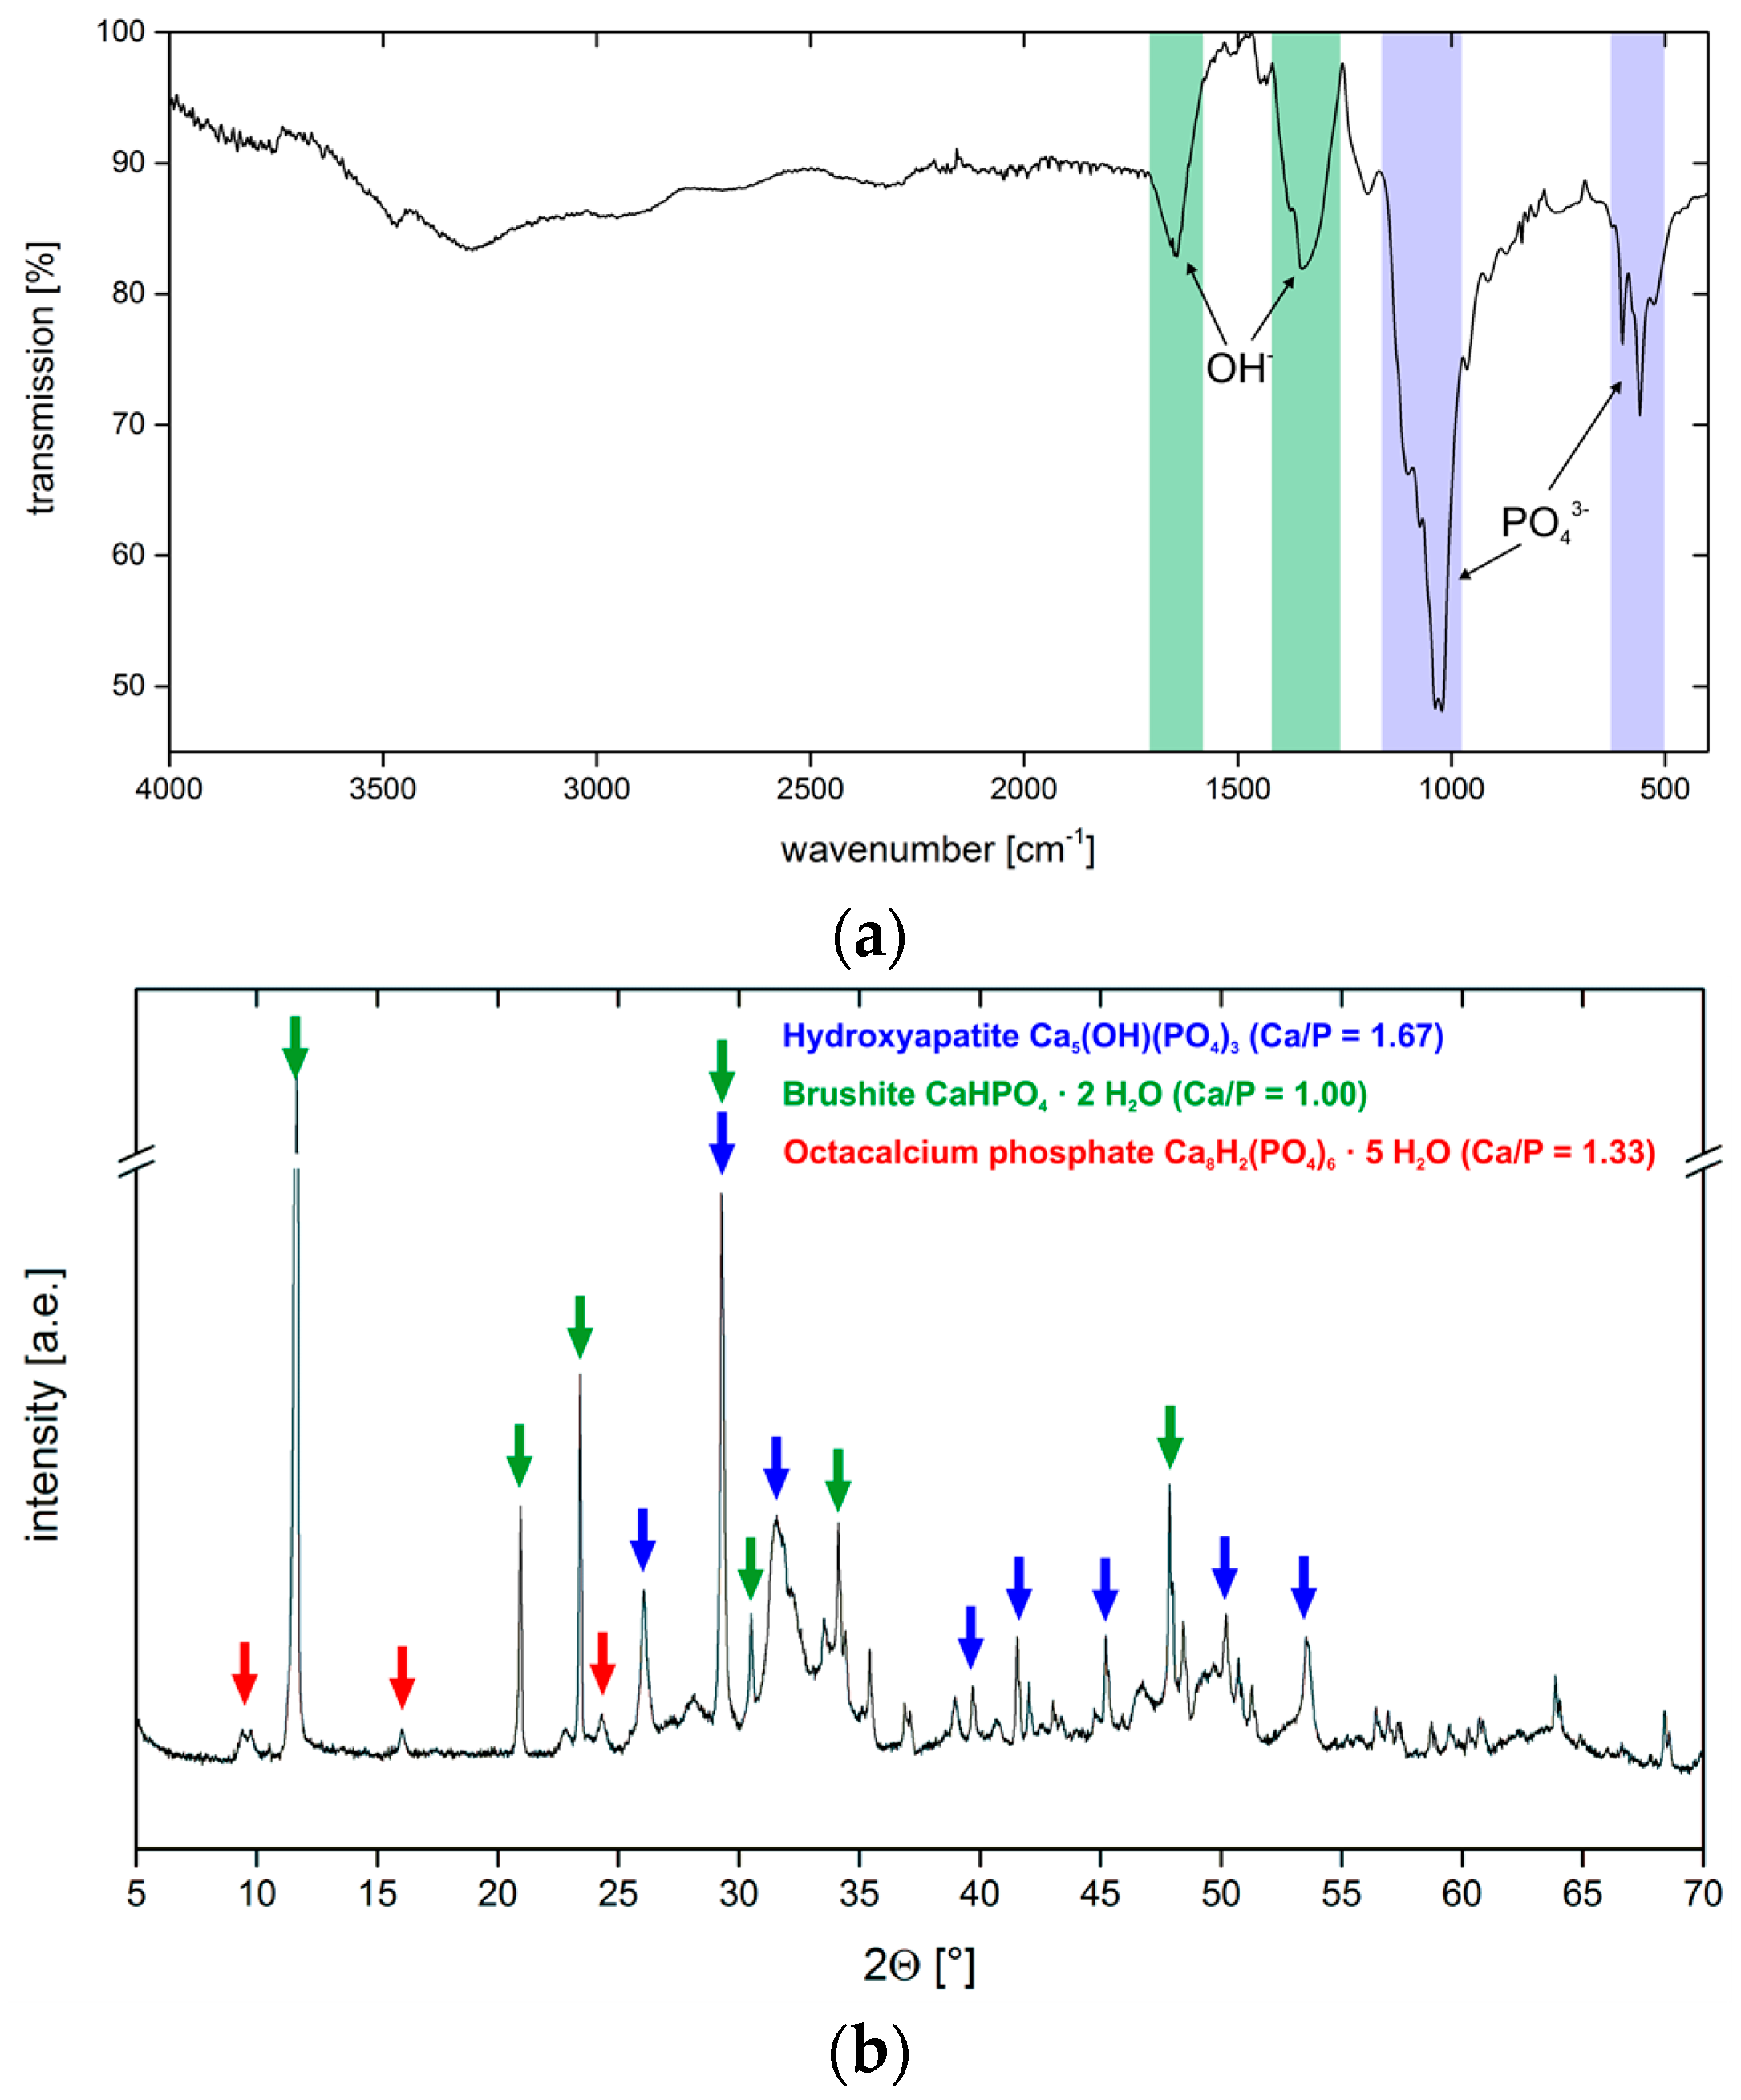
3.2. Calcium Phosphate Mineralization on Unmodified PLA Scaffolds
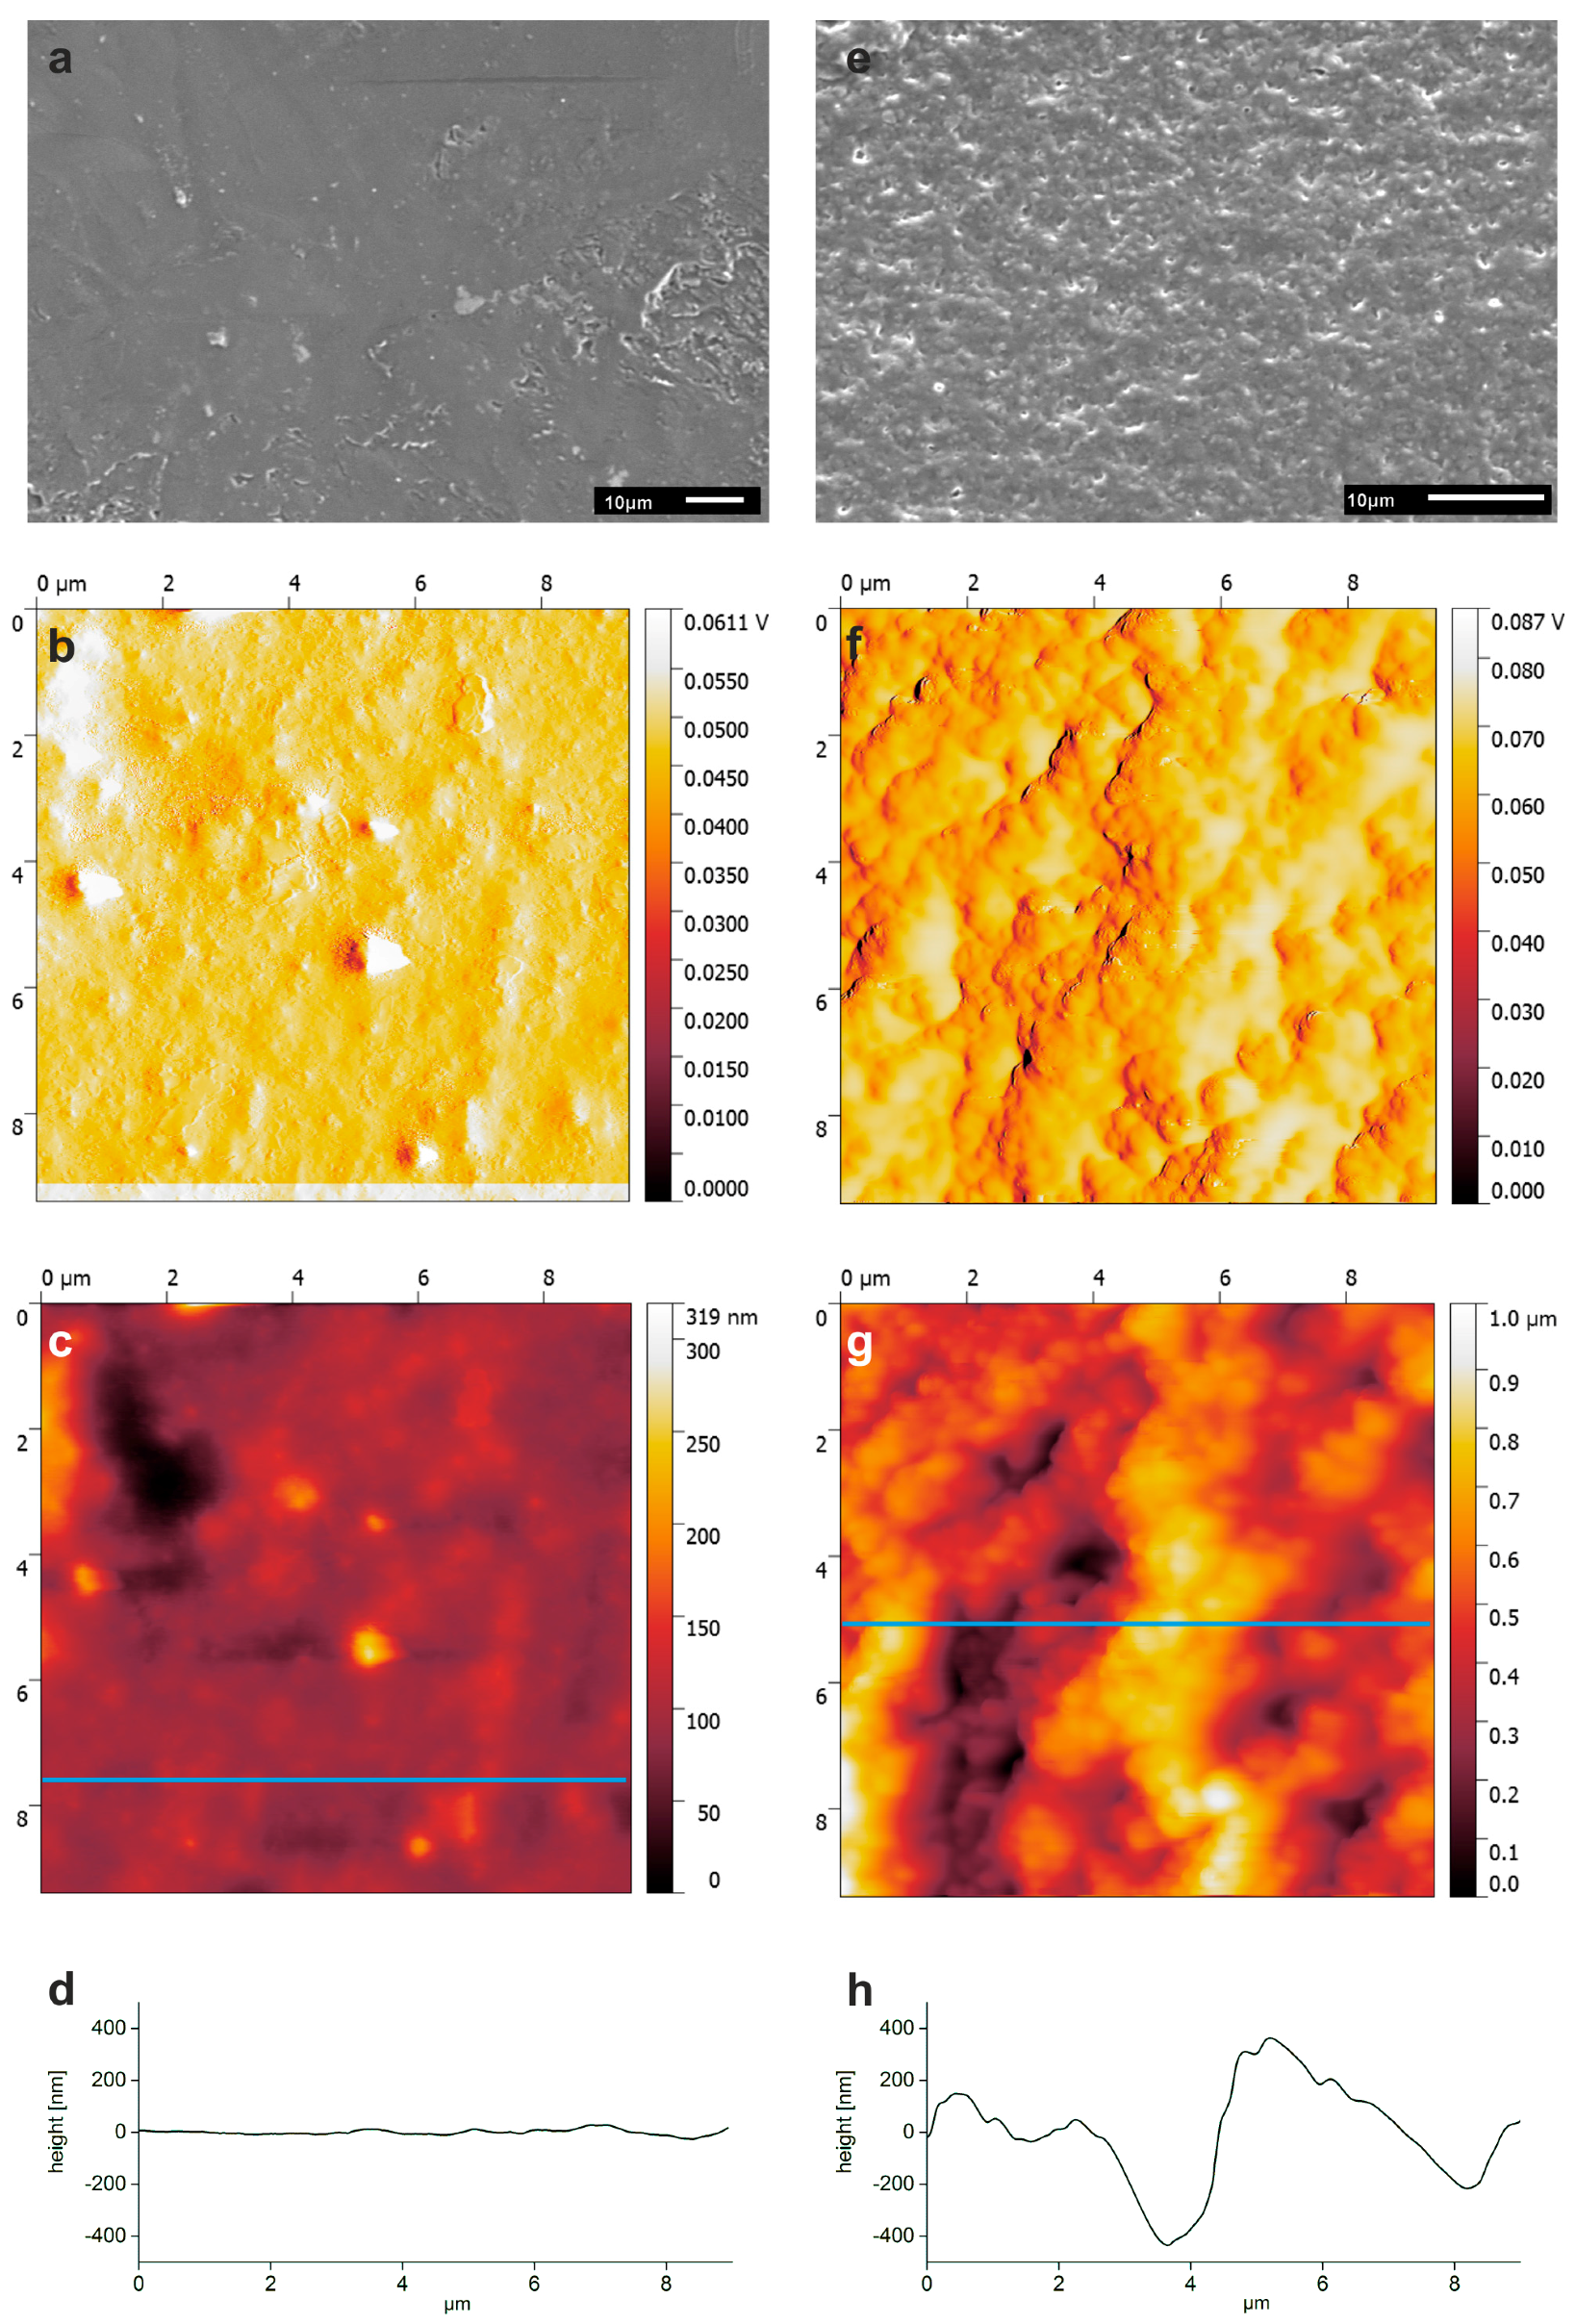
3.3. Surface Modification of PLA Scaffolds
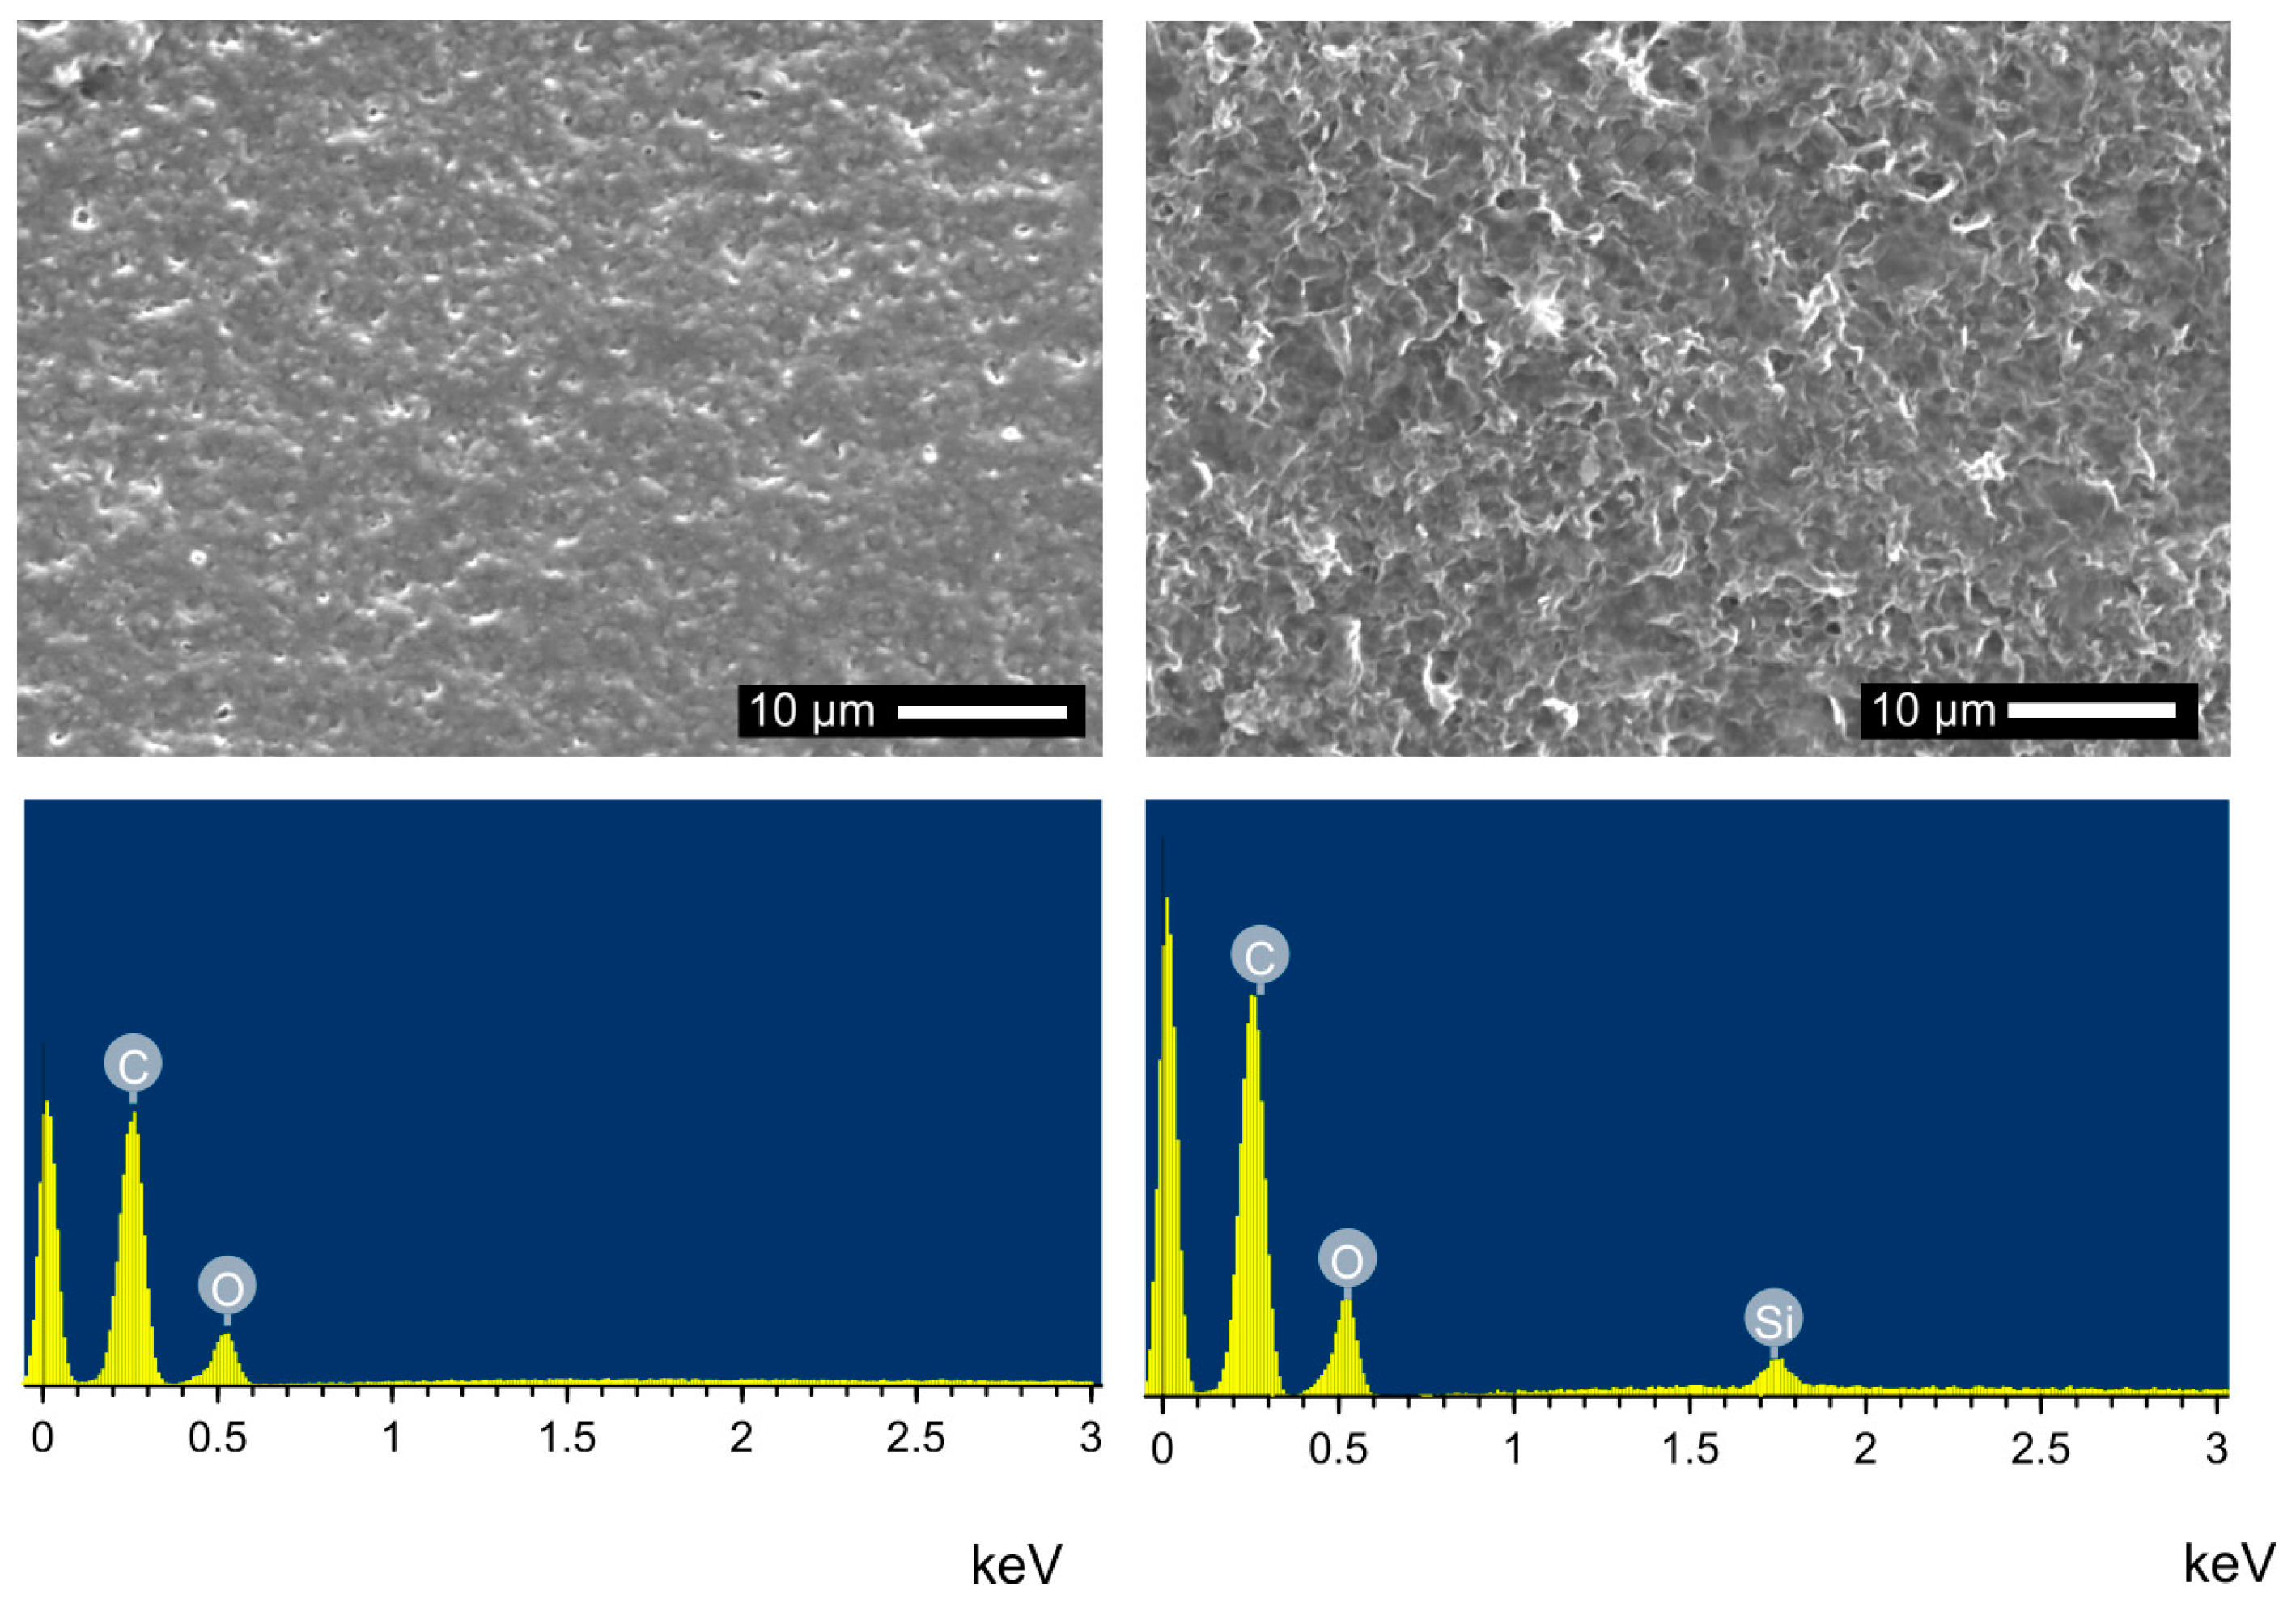
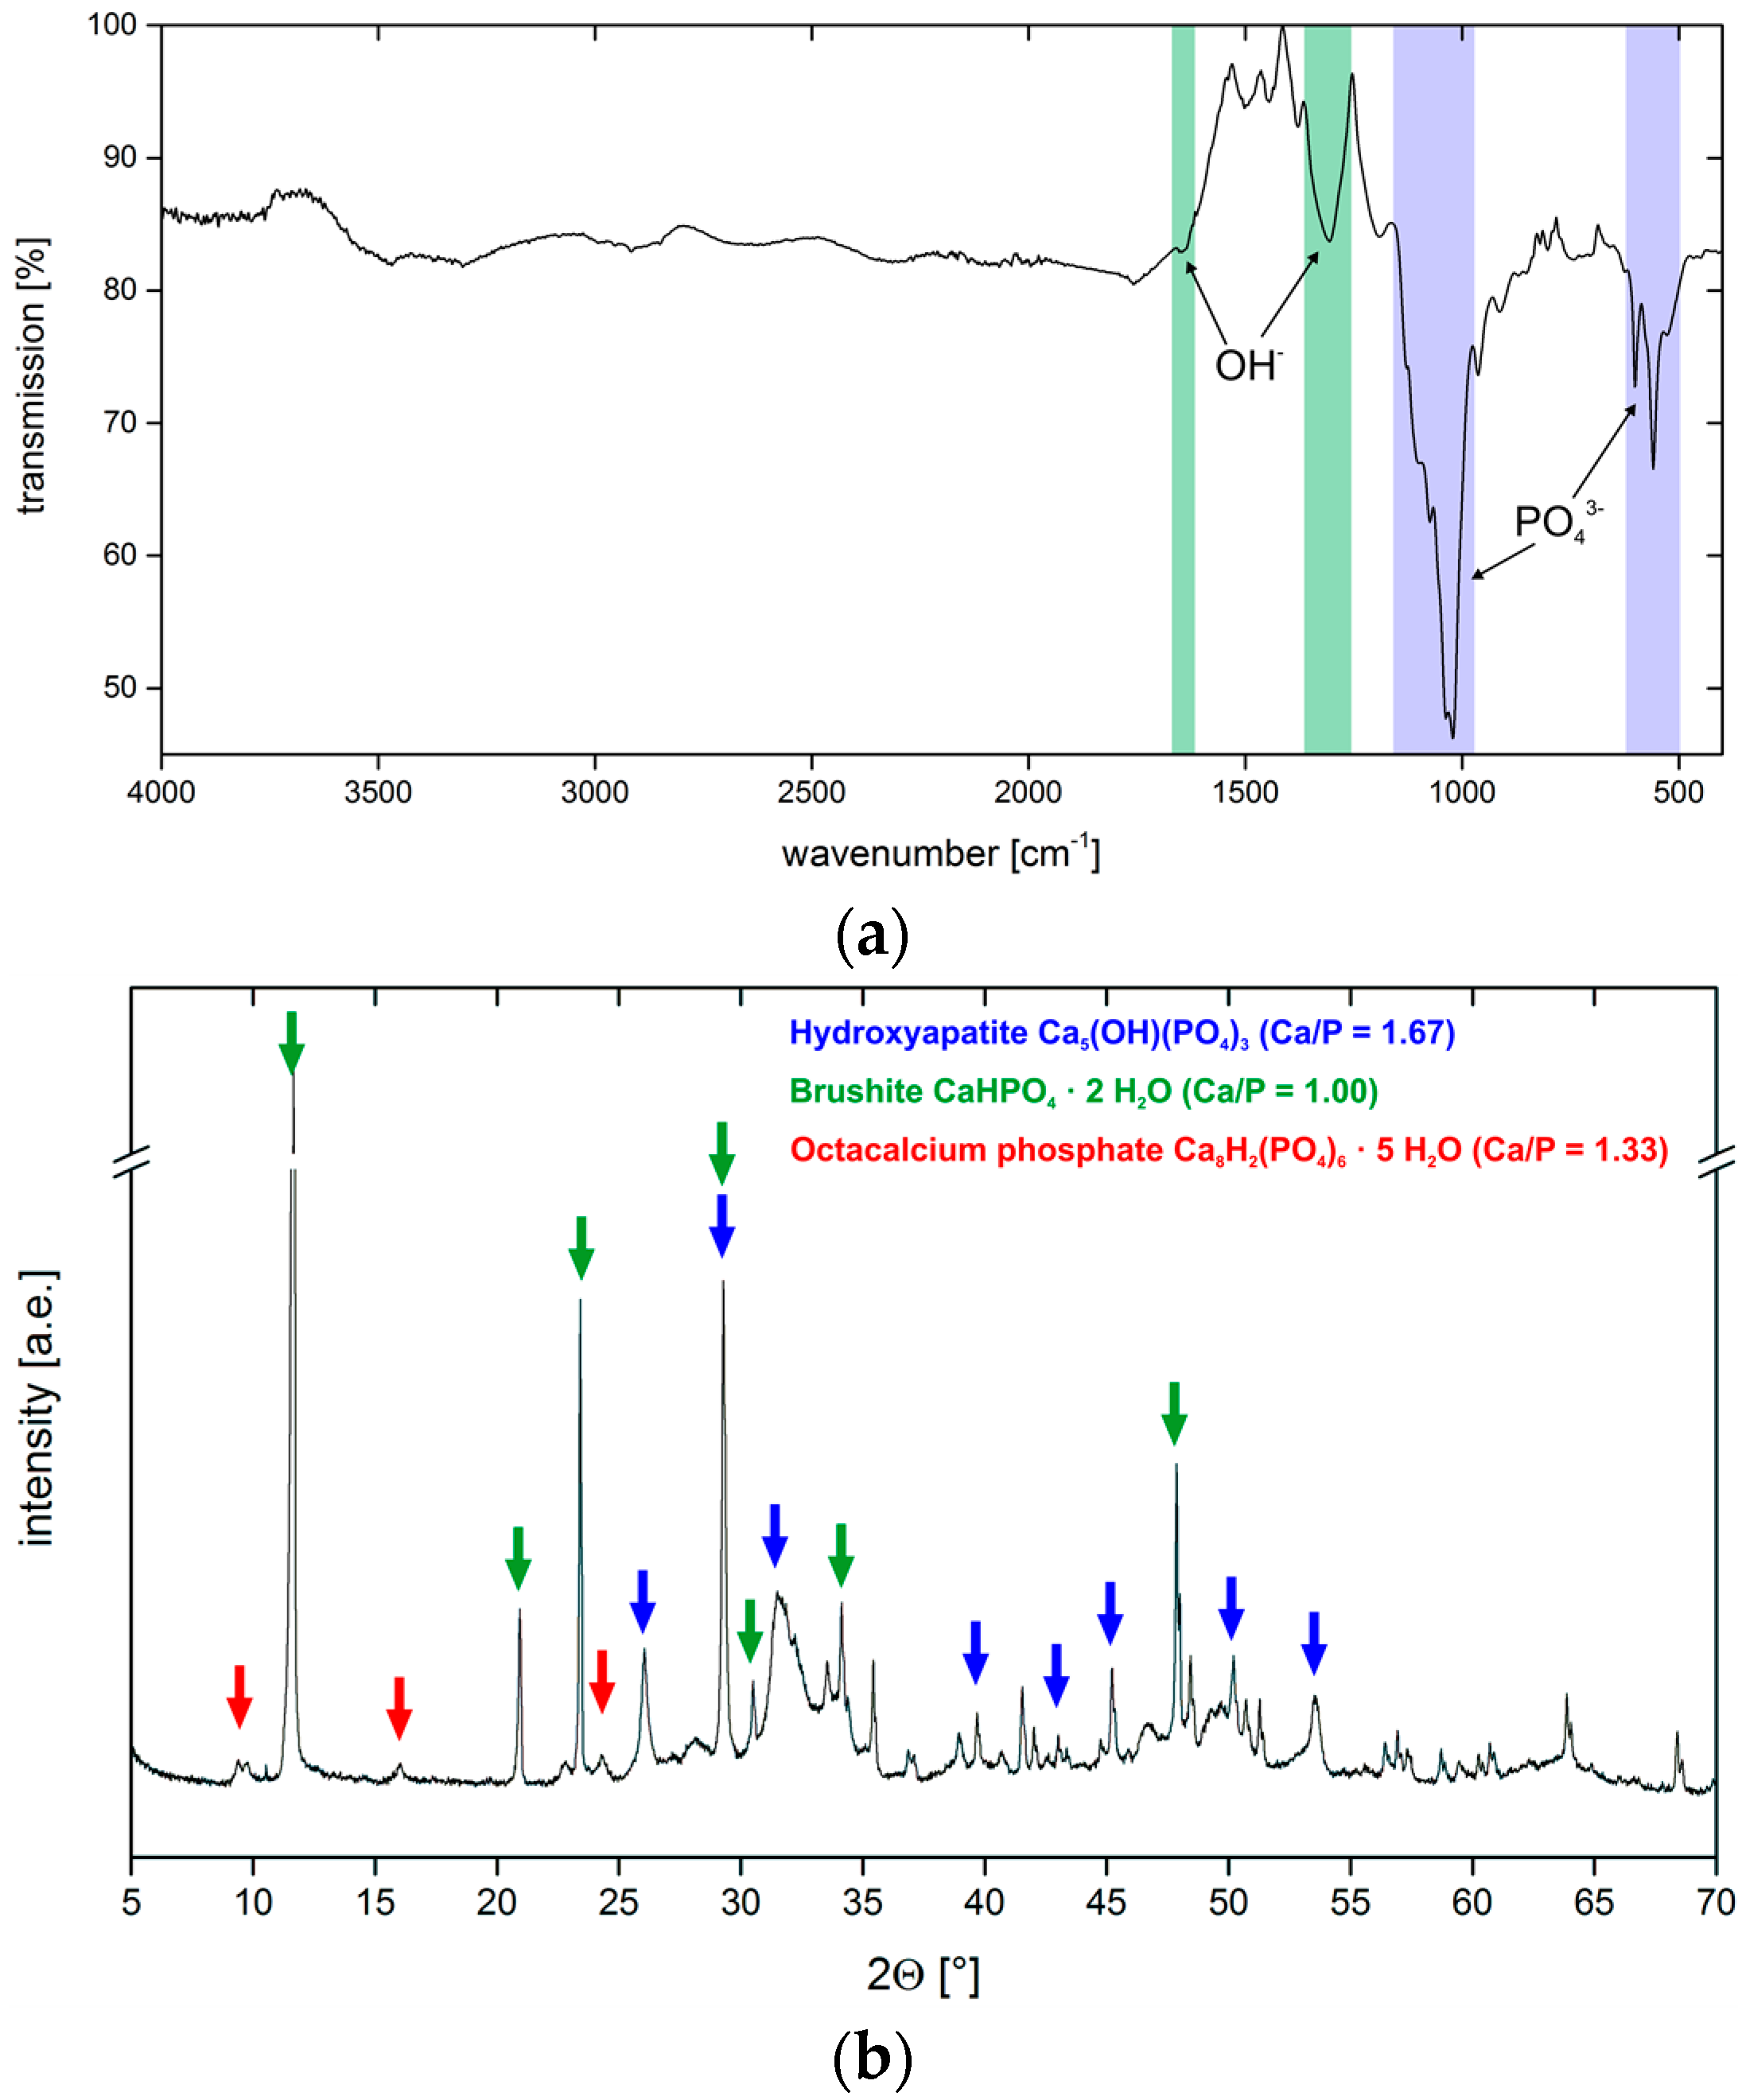
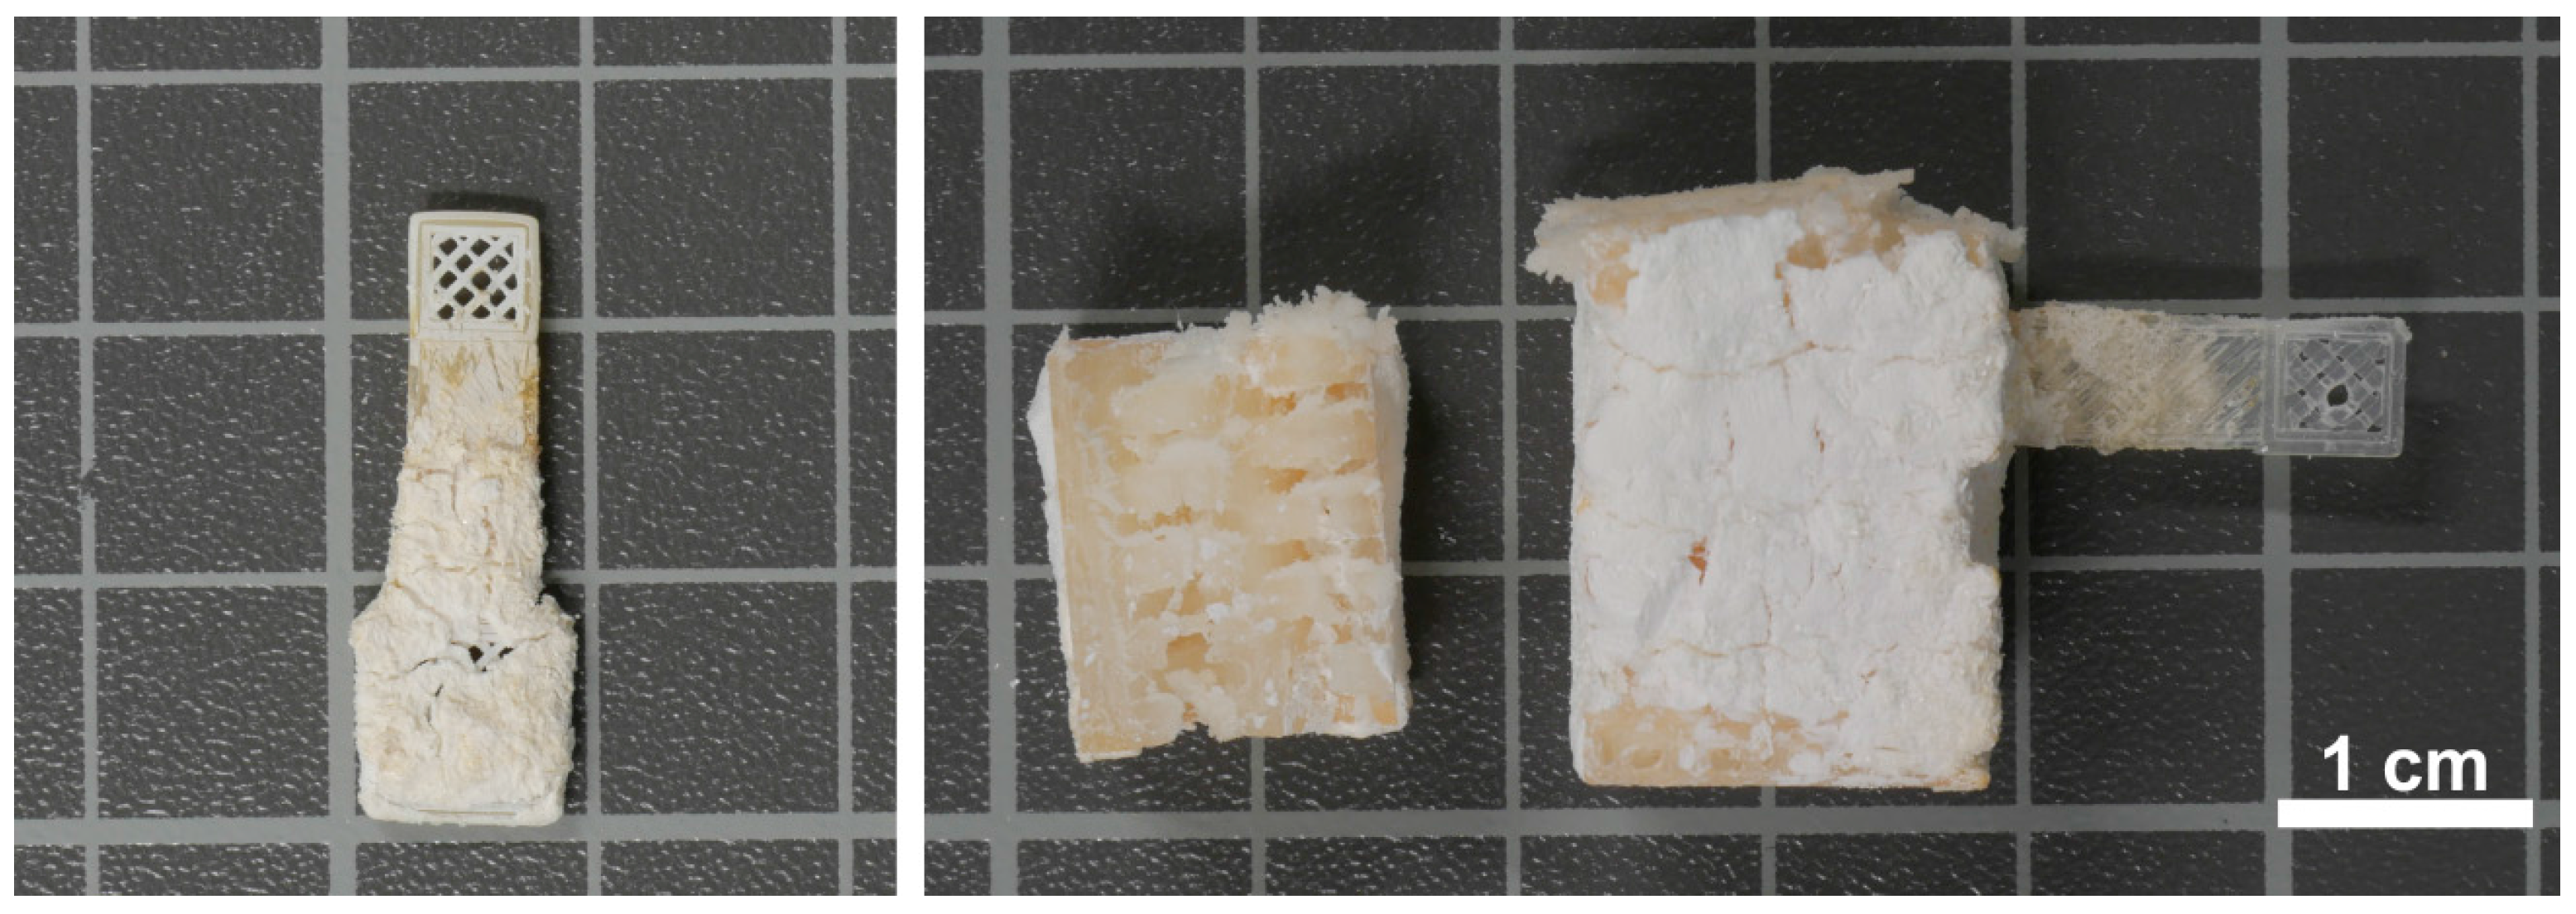
3.4. Hydrogel-Calcium Phosphate Composites
4. Discussion
5. Conclusions
Acknowledgments
Author Contributions
Conflicts of Interest
Appendix A


References
- Habraken, W.; Habibovic, P.; Epple, M.; Bohner, M. Calcium phosphates in biomedical applications: Materials for the future? Mater. Today 2016, 19, 69–87. [Google Scholar] [CrossRef]
- Garlotta, D. A Literature Review of Poly(Lactic Acid). J. Polym. Environ. 2001, 9, 63–84. [Google Scholar] [CrossRef]
- Meng, Z.X.; Li, H.F.; Sun, Z.Z.; Zheng, W.; Zheng, Y.F. Fabrication of mineralized electrospun PLGA and PLGA/gelatin nanofibers and their potential in bone tissue engineering. Mater. Sci. Eng. C 2013, 33, 699–706. [Google Scholar] [CrossRef] [PubMed]
- Palmer, L.C.; Newcomb, C.J.; Kaltz, S.R.; Spoerke, E.D.; Stupp, S.I. Biomimetic Systems for Hydroxyapatite Mineralization Inspired By Bone and Enamel. Chem. Rev. 2008, 108, 4754–4783. [Google Scholar] [CrossRef] [PubMed]
- Russias, J.; Saiz, E.; Nalla, R.K.; Gryn, K.; Ritchie, R.O.; Tomsia, A.P. Fabrication and mechanical properties of PLA/HA composites: A study of in vitro degradation. Mater. Sci. Eng. C 2006, 26, 1289–1295. [Google Scholar] [CrossRef] [PubMed]
- Senatov, F.S.; Niaza, K.V.; Zadorozhnyy, M.Y.; Maksimkin, A.V.; Kaloshkin, S.D.; Estrin, Y.Z. Mechanical properties and shape memory effect of 3D-printed PLA-based porous scaffolds. J. Mech. Behav. Biomed. Mater. 2016, 57, 139–148. [Google Scholar] [CrossRef] [PubMed]
- Dhandayuthapani, B.; Yoshida, Y.; Maekawa, T.; Kumar, D.S. Polymeric Scaffolds in Tissue Engineering Application: A Review. Int. J. Polym. Sci. 2011, 2011, 290602. [Google Scholar] [CrossRef]
- Schweizer, S.; Taubert, A. Polymer-Controlled, Bio-Inspired Calcium Phosphate Mineralization from Aqueous Solution. Macromol. Biosci. 2007, 7, 1085–1099. [Google Scholar] [CrossRef] [PubMed]
- Dorvee, J.R.; Boskey, A.L.; Estroff, L.A. Rediscovering hydrogel-based double-diffusion systems for studying biomineralization. CrystEngComm 2012, 14, 5681–5700. [Google Scholar] [CrossRef] [PubMed]
- Laronda, M.; Rutz, A.; Xiao, S.; Whelan, K.; Duncan, F.; Roth, E.; Woodruff, T.; Shah, R. A bioprosthetic ovary created using 3D printed microporous scaffolds restores ovarian function in sterilized mice. Nat. Commun. 2017, 8, 15261. [Google Scholar] [CrossRef] [PubMed]
- Bleek, K.; Taubert, A. New developments in polymer-controlled, bioinspired calcium phosphate mineralization from aqueous solution. Acta Biomater. 2013, 9, 6283–6321. [Google Scholar] [CrossRef] [PubMed]
- Dorozhkin, S.V. Calcium orthophosphates in nature, biology and medicine. Materials (Basel) 2009, 2, 399–498. [Google Scholar] [CrossRef]
- Kokubo, T.; Kushitani, H.; Sakka, S.; Kitsugi, T.; Yamamuro, T. Solutions able to reproduce in vivo surface-structure changes in bioactive glass-ceramic A-W3. J. Biomed. Mater. Res. 1990, 24, 721–734. [Google Scholar] [CrossRef] [PubMed]
- Taguchi, T.; Muraoka, Y.; Matsuyama, H.; Kishida, A.; Akashi, M. Apatite coating on hydrophilic polymer-grafted poly(ethylene) films using an alternate soaking process. Biomaterials 2000, 22, 53–58. [Google Scholar] [CrossRef]
- Xiao, L.; Wang, B.; Yang, G.; Gauthier, M. Poly(Lactic Acid)-Based Biomaterials: Synthesis, Modification and Applications. Biomed. Sci. Eng. Technol. 2012, 36, 731–742. [Google Scholar]
- Ambrosi, A.; Pumera, M. 3D-printing technologies for electrochemical applications. Chem. Soc. Rev. 2016, 45, 2740–2755. [Google Scholar] [CrossRef] [PubMed]
- Cao, Y.; Croll, T.I.; Cooper-White, J.J.; O’Connor, A.J.; Stevens, G.W. Production and Surface Modification of Polylactide-Based Polymeric Scaffolds for Soft-Tissue Engineering. In Biopolymer Methods in Tissue Engineering; Humana Press: New York, NY, USA, 2004; Volume 238, pp. 87–112. [Google Scholar]
- Li, H.; Xia, Y.; Wu, J.; He, Q.; Zhou, X.; Lu, G.; Shang, L.; Boey, F.; Venkatraman, S.S.; Zhang, H. Surface Modification of Smooth Poly(l-lactic acid) Films for Gelatin Immobilization. ACS Appl. Mater. Interfaces 2012, 4, 687–693. [Google Scholar] [CrossRef] [PubMed]
- Landoulsi, J.; Genet, M.J.; Kirat, K.E.; Richard, C.; Pulvin, S.; Rouxhe, P.G. Silanization with APTES for Controlling the Interactions Between Stainless Steel and Biocomponents: Reality vs. Expectation. Biomater. Phys. Chem. 2011, 5, 99–126. [Google Scholar]
- Kumar, B.S.; Hemalatha, T.; Deepachitra, R.; Raghavan, R.N.; Prabu, P.; Sastry, T.P. Biphasic calcium phosphate—Casein bone graft fortified with Cassia occidentalis for bone tissue engineering and regeneration. Bull. Mater. Sci. 2015, 38, 259–266. [Google Scholar] [CrossRef]
- Taubert, A.; Balischewski, C.; Hentrich, D.; Elschner, T.; Eidner, S.; Günter, C.; Behrens, K.; Heinze, T. Water-Soluble Cellulose Derivatives Are Sustainable Additives for Biomimetic Calcium Phosphate Mineralization. Inorganics 2016, 4, 33. [Google Scholar] [CrossRef]
- Croll, T.I.; O’Connor, A.J.; Stevens, G.W.; Cooper-White, J.J. Controllable Surface Modification of Poly(lactic-co-glycolic acid) (PLGA) by Hydrolysis or Aminolysis I: Physical, Chemical, and Theoretical Aspects. Biomacromolecules 2004, 5, 463–473. [Google Scholar] [CrossRef] [PubMed]
- Quéré, D. Rough ideas on wetting. Phys. A Stat. Mech. Appl. 2002, 313, 32–46. [Google Scholar] [CrossRef]
- Nakae, H.; Inui, R.; Hirata, Y.; Saito, H. Effects of surface roughness on wettability. Acta Mater. 1998, 46, 2313–2318. [Google Scholar] [CrossRef]
- Delahaye, E.; Göbel, R.; Löbbicke, R.; Guillot, R.; Sieber, C.; Taubert, A. Silica ionogels for proton transport. J. Mater. Chem. 2012, 22, 17140–17146. [Google Scholar] [CrossRef]
- Göbel, R.; Hesemann, P.; Friedrich, A.; Rothe, R.; Schlaad, H.; Taubert, A. Modular thiol-ene chemistry approach towards mesoporous silica monoliths with organically modified pore walls. Chem. A Eur. J. 2014, 20, 17579–17589. [Google Scholar] [CrossRef] [PubMed]
- Lin, C.-C.; Fu, S.-J.; Lin, Y.-C.; Yang, I.-K.; Gu, Y. Chitosan-coated electrospun PLA fibers for rapid mineralization of calcium phosphate. Int. J. Biol. Macromol. 2014, 68, 39–47. [Google Scholar] [CrossRef] [PubMed]
- Kildeeva, N.R.; Perminov, P.A.; Vladimirov, L.V.; Novikov, V.V.; Mikhailov, S.N. About mechanism of chitosan cross-linking with glutaraldehyde. Russ. J. Bioorg. Chem. 2009, 35, 360–369. [Google Scholar] [CrossRef]
- Pauliukaite, R.; Ghica, M.E.; Fatibello-Filho, O.; Brett, C.M.A. Comparative Study of Different Cross-Linking Agents for the Immobilization of Functionalized Carbon Nanotubes within a Chitosan Film Supported on a Graphite−Epoxy Composite Electrode. Anal. Chem. 2009, 81, 5364–5372. [Google Scholar] [CrossRef] [PubMed]
- Liu, C.; Thormann, E.; Claesson, P.M.; Tyrode, E. Surface Grafted Chitosan Gels. Part II. Gel Formation and Characterization. Langmuir 2014, 30, 8878–8888. [Google Scholar] [CrossRef] [PubMed]
- Liu, Y.; Luo, D.; Wang, T. Hierarchical Structures of Bone and Bioinspired Bone Tissue Engineering. Small 2016, 12, 4611–4632. [Google Scholar] [CrossRef] [PubMed]
- Liu, D.; Nikoo, M.; Boran, G.; Zhou, P.; Regenstein, J.M. Collagen and gelatin. Annu. Rev. Food Sci. Technol. 2015, 6, 527–557. [Google Scholar] [CrossRef] [PubMed]


| Sample Number | Scaffold Type | Solution 1 | Solution 2 | Weight Change |
|---|---|---|---|---|
| R01 | P2 | 0.10 M Ca(NO3)2 | 0.10 M Na2HPO4 | +0.0117 g (+27.9%) |
| R02 | P2 | 0.20 M Ca(NO3)2 | 0.20 M Na2HPO4 | +0.0327 g (+81.8%) |
| Parameter | Before Hydrolysis | After Hydrolysis |
|---|---|---|
| Weight of Type P2 [g] | 0.0863 ± 0.0019 | 0.0782 ± 0.0019 (−(9 ± 1)%) |
| Weight of Type P3 [g] | 2.575 ± 0.008 | 2.427 ± 0.032 (−(6 ± 2)%) |
| Contact angle [°] | 78.0 ± 17.7 | 102.9 ± 9.2 |
| Sample Number | Scaffold Type | Solution 1 | Solution 2 | Weight Change |
|---|---|---|---|---|
| G01 | P2 a | 0.20 M Ca(NO3)2 + 1.0% gelatin | 0.20 M Na2HPO4 + 0.5% GA | +0.0483 g (+57.4%) |
| G02 | P2 a | 0.20 M Ca(NO3)2 + 0.2% gelatin | 0.20 M Na2HPO4 + 0.5% GA | +0.0522 g (+62.0%) |
| G03 | P2 a | 0.20 M Ca(NO3)2 + 0.1% gelatin | 0.20 M Na2HPO4 + 0.5% GA | +0.0542 g (+64.8%) |
| G04 | P2 a | 0.30 M Ca(NO3)2 + 0.2% gelatin | 0.30 M Na2HPO4 + 0.1% GA | +0.1043 g (+125.7%) |
| G05 | P2 a | 0.20 M Ca(NO3)2 + 0.2% gelatin | 0.20 M Na2HPO4 + 0.1% GA | +0.0526 g (+60.7%) |
| G06 | P2 b | 0.20 M Ca(NO3)2 + 1.0% gelatin | 0.20 M Na2HPO4 + 0.5% GA | +0.0571 g (+72.9%) |
| G07 | P3 b | 0.20 M Ca(NO3)2 + 1.0% gelatin | 0.20 M Na2HPO4 + 0.5% GA | +0.4052 g (+16.7%) |
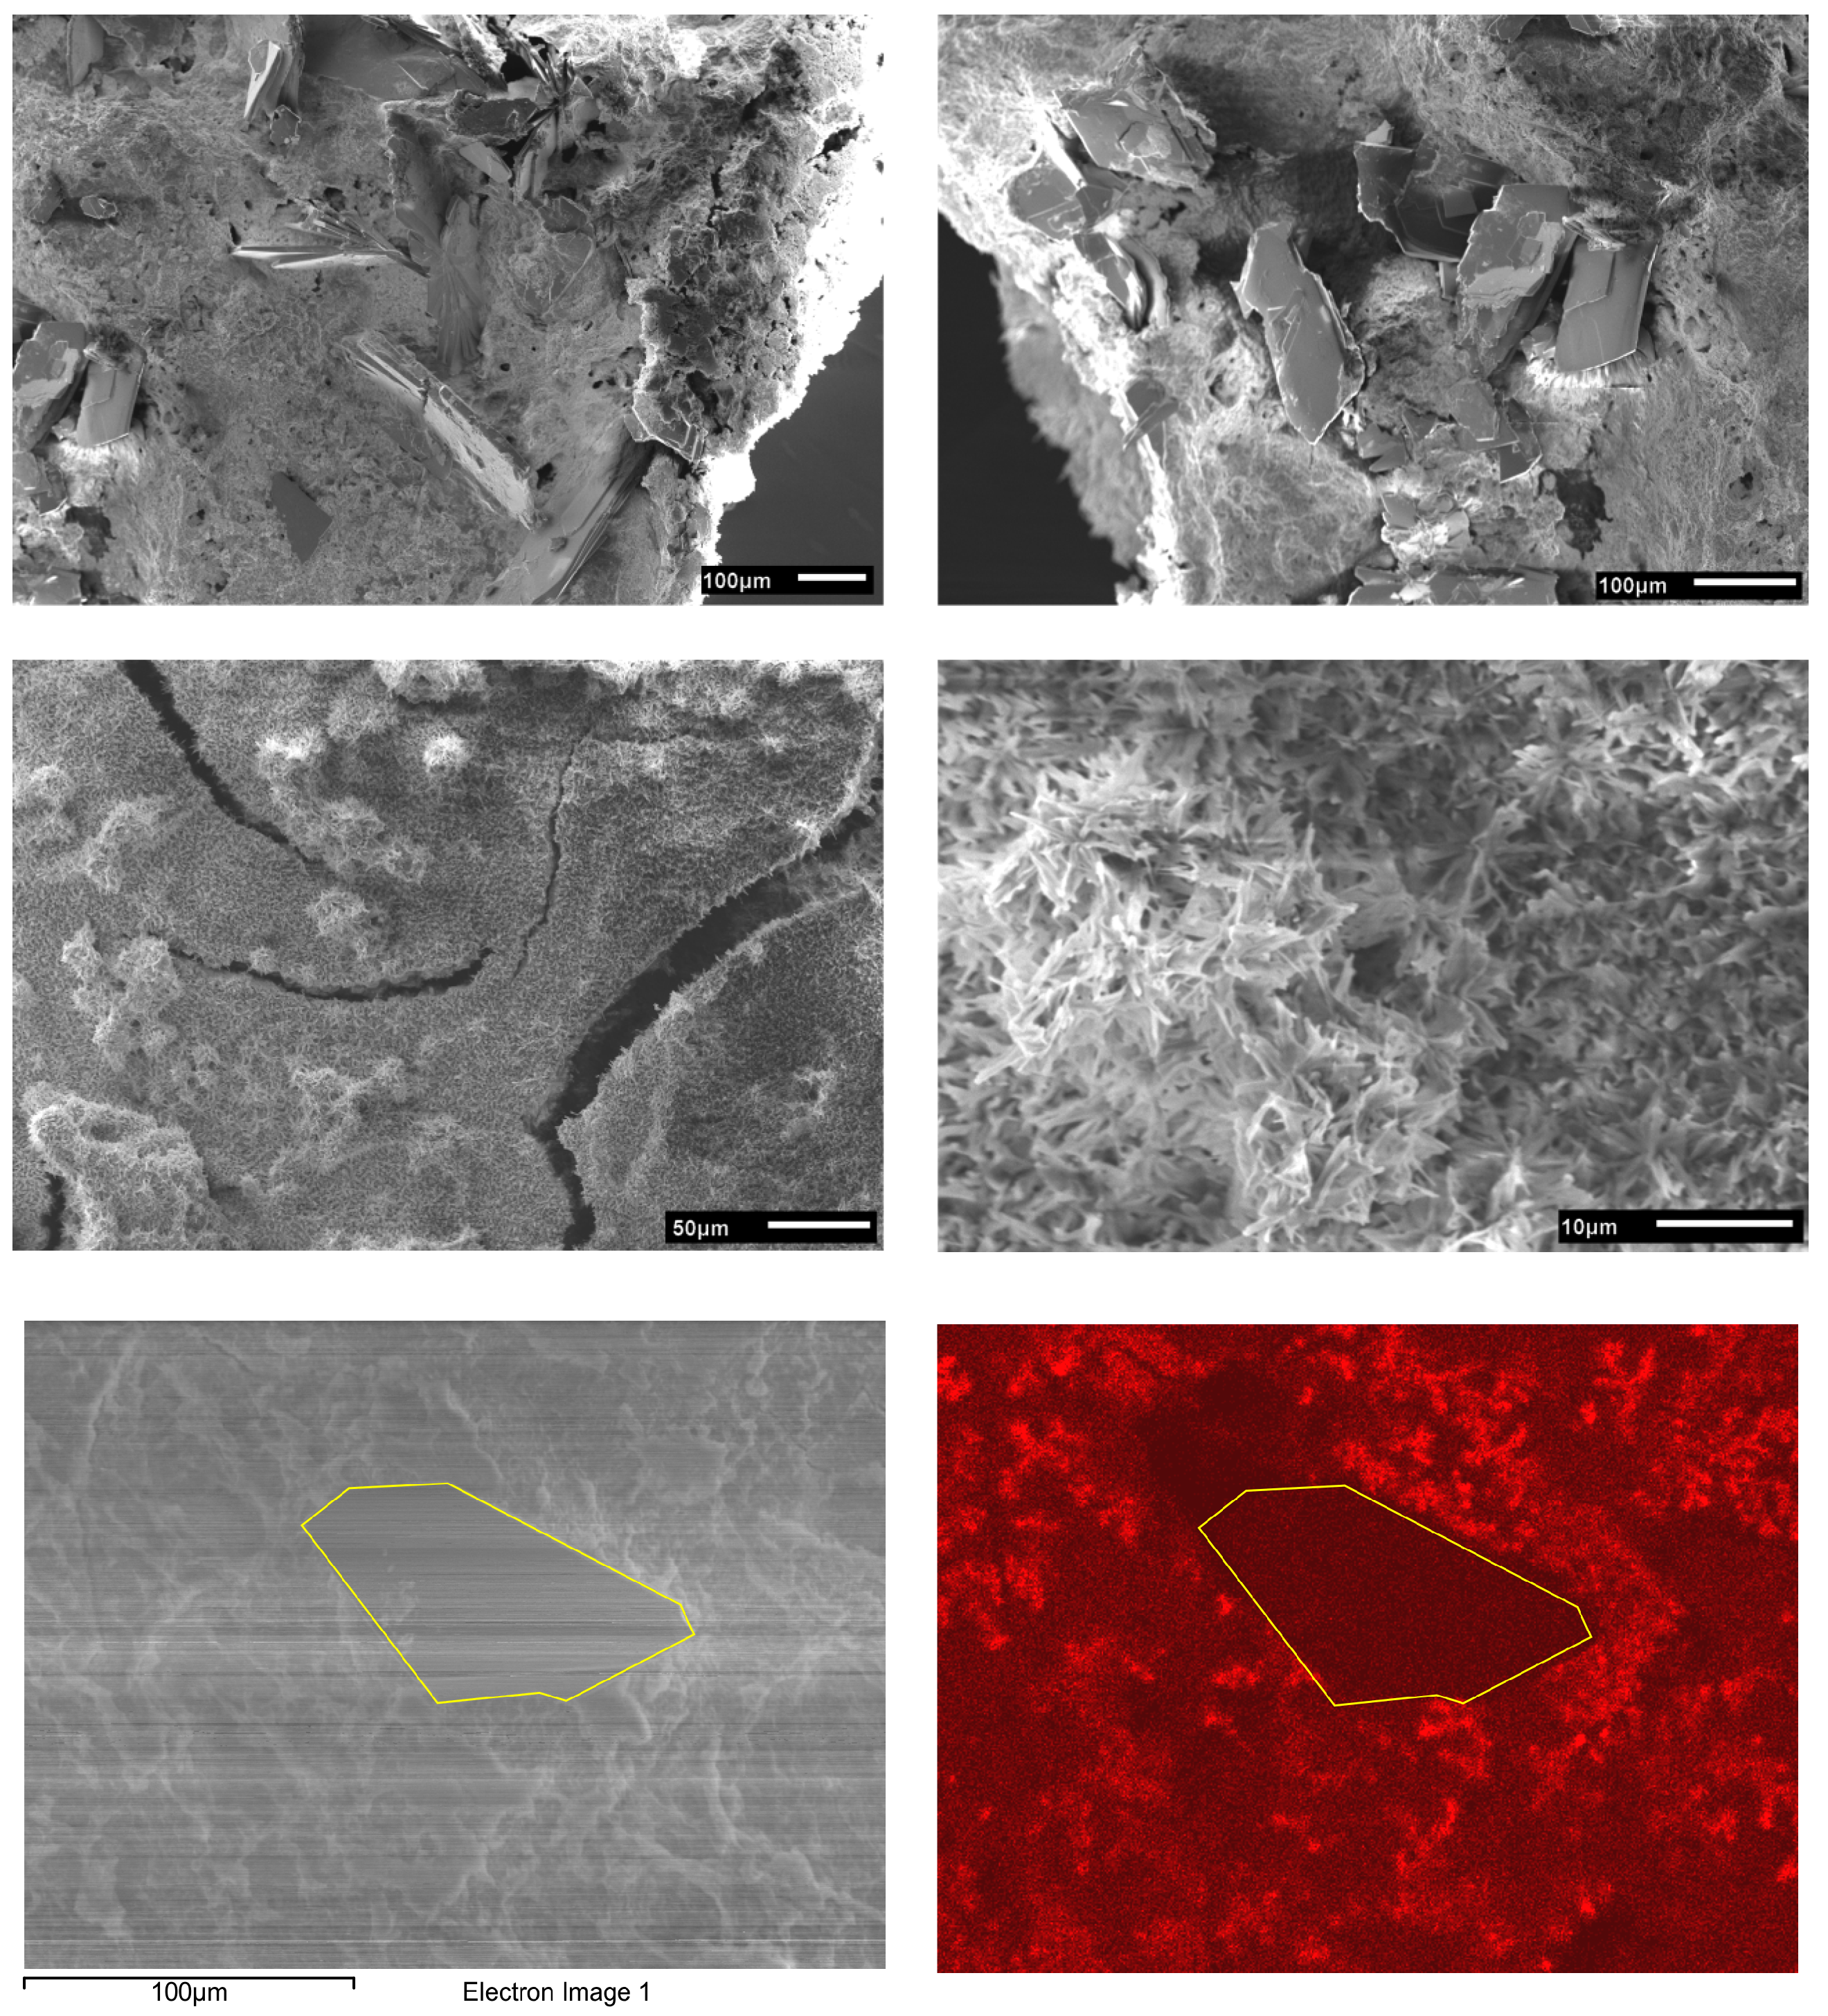
| Element | Plates [atom %] | Disordered Area [atom %] |
|---|---|---|
| O | 67.81 | 49.72 |
| Na | 0.00 | 1.54 |
| P | 16.39 | 20.16 |
| Ca | 15.81 | 28.58 |
| Ca/P | 0.96 | 1.42 |
| Sample Number | Scaffold Type | Solution 1 | Solution 2 | Weight Change |
|---|---|---|---|---|
| C01 | P1 | 0.10 M Ca(NO3)2 + 1.0% chitosan | 0.10 M Na2HPO4 + 1.0% GA | - c |
| C02 | P1 | 0.10 M Ca(NO3)2 + 0.1% chitosan | 0.10 M Na2HPO4 + 1.0% GA | +0.0036 g (+11.2%) |
| C03 | P1 | 0.10 M Ca(NO3)2 + 0.1% chitosan | 0.10 M Na2HPO4 + 1.0% GA | +0.0064 g (+18.4%) |
| C04 | P1 | 0.20 M Ca(NO3)2 + 0.1% chitosan | 0.20 M Na2HPO4 + 1.0% GA | +0.0358 g (+118.9%) |
| C05 | P1 | 0.20 M Ca(NO3)2 + 0.1% chitosan | 0.20 M Na2HPO4 + 0.1% GA | +0.0358 g (+118.9%) |
| C06 | P2 | 0.20 M Ca(NO3)2 + 1.0% chitosan | 0.20 M Na2HPO4 + 1.0% GA | - c |
| C07 | P2 | 0.20 M Ca(NO3)2 + 1.0% chitosan | 0.20 M Na2HPO4 + 0.1% GA | - c |
| Sample Number | Scaffold Type | Solution 1 | Solution 2 | Weight Change |
|---|---|---|---|---|
| C10 | P2 a | 0.10 M Ca(NO3)2 + 0.1% chitosan | 0.10 M Na2HPO4 + 1.0% GA | +0.0311 g (+16.9%) |
| C11 | P2 a | 0.15 M Ca(NO3)2 + 0.2% chitosan | 0.15 M Na2HPO4 + 0.5% GA | +0.0232 g (+27.8%) |
| C12 | P2 a | 0.20 M Ca(NO3)2 + 0.1% chitosan | 0.20 M Na2HPO4 + 0.1% GA | +0.0372 g (+44.4%) |
| C13 | P2 a | 0.20 M Ca(NO3)2 + 0.1% chitosan | 0.20 M Na2HPO4 + 1.0% GA | +0.0428 g (+52.5%) |
| C14 | P2 a | 0.30 M Ca(NO3)2 + 0.1% chitosan | 0.30 M Na2HPO4 + 1.0% GA | +0.1180 g (+146.0%) |
| C15 | P2 a | 0.20 M Ca(NO3)2 + 0.2% chitosan | 0.20 M Na2HPO4 + 1.0% GA | +0.0508 g (+62.5%) |
| C16 | P2 a | 0.15 M Ca(NO3)2 + 0.1% chitosan | 0.15 M Na2HPO4 + 1.0% GA | +0.0199 g (+24.4%) |
| C17 | P2 a | 0.15 M Ca(NO3)2 + 0.2% chitosan | 0.10 M Na2HPO4 + 1.0% GA | +0.0237 g (+28.5%) |
| C18 | P2 a | 0.15 M Ca(NO3)2 + 0.1% chitosan | 0.15 M Na2HPO4 + 0.5% GA | +0.0254 g (+30.4%) |
| C19 | P3 b | 0.20 M Ca(NO3)2 + 0.1% chitosan | 0.20 M Na2HPO4 + 0.1% GA | +0.3973 g (+16.2%) |
| C20 | P2 b | 0.20 M Ca(NO3)2 + 0.1% chitosan | 0.20 M Na2HPO4 + 0.1% GA | +0.0343 g (+44.3%) |
| Element | Plates [atom %] | Disordered Area [atom %] |
|---|---|---|
| O | 67.75 | 56.30 |
| Na | 0.00 | 5.26 |
| P | 17.43 | 15.17 |
| Ca | 14.82 | 23.26 |
| Ca/P | 0.85 | 1.53 |
© 2018 by the authors. Licensee MDPI, Basel, Switzerland. This article is an open access article distributed under the terms and conditions of the Creative Commons Attribution (CC BY) license (http://creativecommons.org/licenses/by/4.0/).
Share and Cite
Schneider, M.; Günter, C.; Taubert, A. Co-Deposition of a Hydrogel/Calcium Phosphate Hybrid Layer on 3D Printed Poly(Lactic Acid) Scaffolds via Dip Coating: Towards Automated Biomaterials Fabrication. Polymers 2018, 10, 275. https://doi.org/10.3390/polym10030275
Schneider M, Günter C, Taubert A. Co-Deposition of a Hydrogel/Calcium Phosphate Hybrid Layer on 3D Printed Poly(Lactic Acid) Scaffolds via Dip Coating: Towards Automated Biomaterials Fabrication. Polymers. 2018; 10(3):275. https://doi.org/10.3390/polym10030275
Chicago/Turabian StyleSchneider, Matthias, Christina Günter, and Andreas Taubert. 2018. "Co-Deposition of a Hydrogel/Calcium Phosphate Hybrid Layer on 3D Printed Poly(Lactic Acid) Scaffolds via Dip Coating: Towards Automated Biomaterials Fabrication" Polymers 10, no. 3: 275. https://doi.org/10.3390/polym10030275