1. Introduction
The atmosphere is a complex system characterized by nonlinear interactions across wide scales [
1,
2], including planetary waves, synoptic systems, secondary circulations, mesoscale systems, turbulent eddies, cloud microphysics, and molecular diffusion. The mathematical representation of these atmospheric phenomena in numerical models is often streamlined, depending on the model’s intended purpose, resolution, and emphasis [
3]. The dynamical core of the weather prediction model effectively solves the governing equations within a discretized grid, neglecting terms of relative insignificance. Unresolved physical elements, such as radiation, deep and shallow cumulus convection, cloud microphysics, precipitation, and turbulence, are always represented by parameterization in models [
4,
5,
6,
7,
8,
9].
In meteorological models, the horizontal grid spacing ranging approximately from 3 to 10 km is often called the convective gray-zone resolution (hereinafter referred to as gray-zone resolution). In this resolution, the model can identify organized mesoscale convective systems, while it cannot resolve individual convective cells; thus, this grid spacing lacks the precision to represent distinct convective features, yet it is too detailed for convective parameterizations [
10,
11,
12,
13,
14]. Previous studies indicate that simulations at gray-zone resolution reproduce fewer convective clouds; they succeed in reproducing the statistical characteristics of convection [
15,
16,
17]. Thus, simulations at the gray-zone resolution are a valuable and cost-effective methodology for investigating the impact of convection in regional climate models [
11,
12,
18,
19,
20,
21].
Among the complex atmospheric processes influencing precipitation simulation, convective cumulus parameterization schemes play a crucial role [
22,
23], which serve the purpose of representing sub-grid scale convective processes that elude explicit resolution. These schemes are designed to encapsulate the vertical transport phenomena, including the heat, moisture, and momentum associated with convective clouds, thereby influencing the precipitation simulation.
A lot of previous studies investigated the sensitivity of precipitation to the choice of cumulus parameterization schemes; for example, in simulating heavy rainfall events for the Indian monsoon region using the WRF model, the Betts Miller Janjic (BMJ) cumulus scheme outperformed other schemes [
24], while the Kain–Fritsch (KF) cumulus scheme indicated the best performance in simulating precipitation for three flood events in Alberta, Canada [
25]. The study over the Basque Country of Spain indicated that the KF scheme yielded superior results in simulating extreme precipitation events compared to other available cumulus schemes [
26]. Other studies indicated that the model sensitivity to the cumulus schemes is more pronounced compared with that to the initial conditions [
27], and it was particularly notable in the higher resolution simulations [
28]. At the same time, the microphysics schemes, which deal with cloud microphysical processes, such as moisture evaporation and condensation, can change thermodynamic and dynamic interactions in the atmosphere and influence the precipitation simulation.
Hebei Province in China has distinctive climatic features, characterized by the monsoonal influences, mountainous topography, and urbanization, and the precise forecasting of precipitation poses a great challenge [
29,
30,
31]. Previous studies have explored the impact of cumulus schemes on precipitation simulations at a resolution of approximately 20~30 km. It is imperative to ascertain the most effective physical parameterization schemes tailored to high-resolution precipitation variations to enhance forecast performance for precipitation at regional or local scales, and these studies can identify the optimal combinations of physical parameterization schemes for precipitation forecasting. In this study, as an initial investigation on the influence of physical parameterizations on the model performance on precipitation simulations, several sensitivity experiments with different model configurations, such as the cumulus scheme, the microphysical scheme, and analysis nudging, were conducted using the WRF model at a cumulus gray-zone resolution of 5 km, which will help determine the best model configuration for precipitation simulations, subsequently improving the precipitation forecasting over this region.
2. Materials and Methods
In this study, the Advanced Research WRF (WRF-ARW) version 4.5.1 was employed. The WRF model is a simulation system that was designed for both atmospheric research and operational forecasting applications [
32].
The simulation domain of the WRF model is illustrated in
Figure 1, locating in North China with a horizontal grid spacing of 5 km. Vertically, the WRF model is structured with the model top set at 50 hPa and 51 levels, utilizing a terrain-following, hydrostatic-pressure vertical coordinate. The initial and boundary conditions are from ERA5 reanalysis dataset, which is a newly developed reanalysis product by the European Centre for Medium-range Weather Forecasts and offers a comprehensive record of the global atmosphere, land surface, and ocean waves [
33]. This dataset is widely used as forcing dataset for regional climate simulation over China [
18,
21,
34].
Table 1 lists the physical parameterization schemes used in the sensitivity simulations, with a total of seven sensitivity experiments conducted. Among them, two microphysics schemes, including the WRF single-moment 6-class (WSM6) scheme [
35] and the Thompson scheme [
36], and two cumulus convective schemes, including the Kain–Fritsch scheme [
37] and Tiedtke scheme [
38], were used. The first four sensitivity experiments (Run1–Run4) were configured with different combinations of cumulus and microphysical schemes. Given the horizontal grid spacing of 5 km falls in the cumulus “gray-zone” resolution, two experiments (Run5 and Run6) were configured with the cumulus convective schemes turning off. Furthermore, a sensitivity experiment with analysis nudging (Run7) was configured to investigate its effects on model simulation. Analysis nudging is a grid-based four-dimensional data assimilation technique nudging the model toward data analysis. The model is run with extra nudging terms for horizontal winds, temperature, and water vapor. These terms nudge point by point to a three-dimension space- and time-interpolated analysis field [
32,
39]. Analysis nudging improves the model ability by incorporating observational information into simulation; thus, it should be clarified that the inclusion of analysis nudging in WRF experiments could serve the more accurate estimation of the fallen area mean precipitations but not precipitation forecasts. Except the physical schemes listed in
Table 1, the model configuration of the sensitivity experiments was identical, including the Yonsei University (YSU) scheme [
40], the Rapid Radiative Transfer Model longwave radiation scheme [
41], the Dudhia shortwave radiation scheme [
42], and the community Noah land surface model with multi-parameterization options [
43,
44].
As an initial attempt to explore the differences of model performance in reproducing the precipitation over Hebei Province, which will be helpful in understanding the influence of parameterization schemes on precipitation simulation and selecting the best model configuration for further precipitation forecast application, we chose a whole summer month of July 2017 as the case study period. It is true that for obtaining generally valid conclusions for a given area such as Hebei Province, much longer simulation period instead of one month or one year should be performed; however, the high resolution and consequent small time step require large amount of computational resources for a single sensitivity simulation. Due to the limitation of computational resources, one month simulation period was acceptable in this study, and the results were meaningful to the following application studies. All sensitivity simulations were carried out from 30 June to 31 July 2017, incorporating a 2-day reinitialization period to prevent model drift. Each reinitialization involved a 72 h simulation, along with the first 24 h simulations designated as the spin-up period.
The performances of different sensitivity simulations were determined by comparison of the simulated meteorological variables with the dense station observations over Hebei Province. The observational variables included precipitation, temperature at 2 m, relative humidity at 2 m, and wind speed at 10 m. For the model simulation, the results of the model grids that were geographically closest to the station observations were selected. It is true that in model and observation comparison, the discrepancies arising from non-overlapping is evident, and although some uncertainties may have been introduced during the comparison in this study, these uncertainties were consistent in all the sensitivity experiments; thus, they could be ignored in the comparison and will not change the results of this study. Thus, the flowchart of the methodology in this study can be summarized in
Figure 2.
Three commonly used metrics in previous model evaluation studies, including the Pearson correlation coefficient (CORR), BIAS, and root mean square error (RMSE), were used to evaluate the performances of the model simulations. These statistical scores measure the agreement between simulation and observations and are important in evaluating the performance. Applying these commonly used metrics can also provide references for other evaluation studies using the WRF model. CORR, BIAS, and RMSE measure the performance in different perspectives. CORR indicates the strength as well as the direction of linear relationship between the station observation and model simulation, while BIAS measures the deviation between observation and simulation. RMSE, on the other hand, measures the square root of average of variances between observation and simulations. There are also other metrics, such as R square and relative bias, that can be used; however, they serve the same purpose. Thus, in this study, only these metrics were applied to provide the measurement of performance of the sensitivity simulations.
The definitions of these metrics are as follows:
Here, M is the value of the model output, O is the value of the observation, and N is the number of observations.
3. Results
Figure 3 illustrates the spatial distribution of the mean precipitation for the sensitivity experiments alongside the corresponding observations. The WRF simulations generally capture the spatial features of precipitation over Hebei Province, including more precipitation over the western and central regions characterized by complicated topography (
Figure 1). However, nearly all sensitivity experiments underestimate precipitation compared to station observations, especially over the southwestern regions. Notably, simulations employing the Kain–Fritsch scheme (Run1 and Run2) generate higher precipitation across the simulation domain compared to those using the Tiedtke cumulus scheme (Run3 and Run4). Interestingly, the simulations with cumulus schemes turning off (Run5 and Run6), the same as the Kain–Fritsch scheme, yield more precipitation compared to the Tiedtke scheme, resulting in reduced underestimation and an improved agreement with observations.
Regarding microphysics schemes, the Thompson scheme (Run2, Run4, and Run6) tends to produce more precipitation over Hebei Province compared to the WSM6 scheme (Run1, Run3, and Run5). Analysis nudging, in particular, improves the model simulation significantly, as Run7 reproduces the features of observational precipitation well, in both spatial distribution and amount. For most of the stations, the simulated precipitation of Run7 and observed quantities are fairly comparable, which is likely due to the continuous nudging towards the observed atmospheric conditions that helps to maintain the consistency with real-world observations throughout the simulation period.
Figure 4 represents the time series of average precipitation for both observation and model simulations. For the observation, the average precipitation was calculated by the mean of precipitation for all 142 stations, while for the simulation, we first selected the simulation results of the grid points that are geographically closest to the weather stations, then calculated the precipitation average. This kind of comparison between the observation and simulation may have some error; however, they are consistent for all the stations and the sensitivity experiments and thus will not change the results of this study. Overall, WRF can reproduce the time series of precipitation, capturing the majority of precipitation events occurring over Hebei Province. For instance, the precipitation events on 6 July and 26 July are well reproduced by most of the sensitivity runs. At the same time, most of the WRF simulations overestimate the precipitation events on 14 July and 24 July while underestimating those on 8 and 10 July.
In contrast, analysis nudging shows an overall improvement compared to other experiments, particularly evident in the events on 10 July, 14 July, and 21–22 July. In consequence, the
BIAS scores of the parameterization scheme runs (Run1 to Run6) range from −0.05 to −0.03 mm/day, whereas for the analysis nudging experiment (Run7), the
BIAS approaches zero (
Figure 4c). Furthermore, among the parameterization scheme experiments, the simulation employing the Tiedtke and Thompson scheme (Run4) achieves the highest
CORR (0.45) and lowest
RMSE (0.34 mm/day), which can be considered as the best choice for precipitation simulation over Hebei Province. Moreover, the analysis nudging shows even higher scores of
CORR (0.47) and
RMSE (0.33 mm/day), highlighting the benefits of applying analysis nudging techniques in WRF prediction.
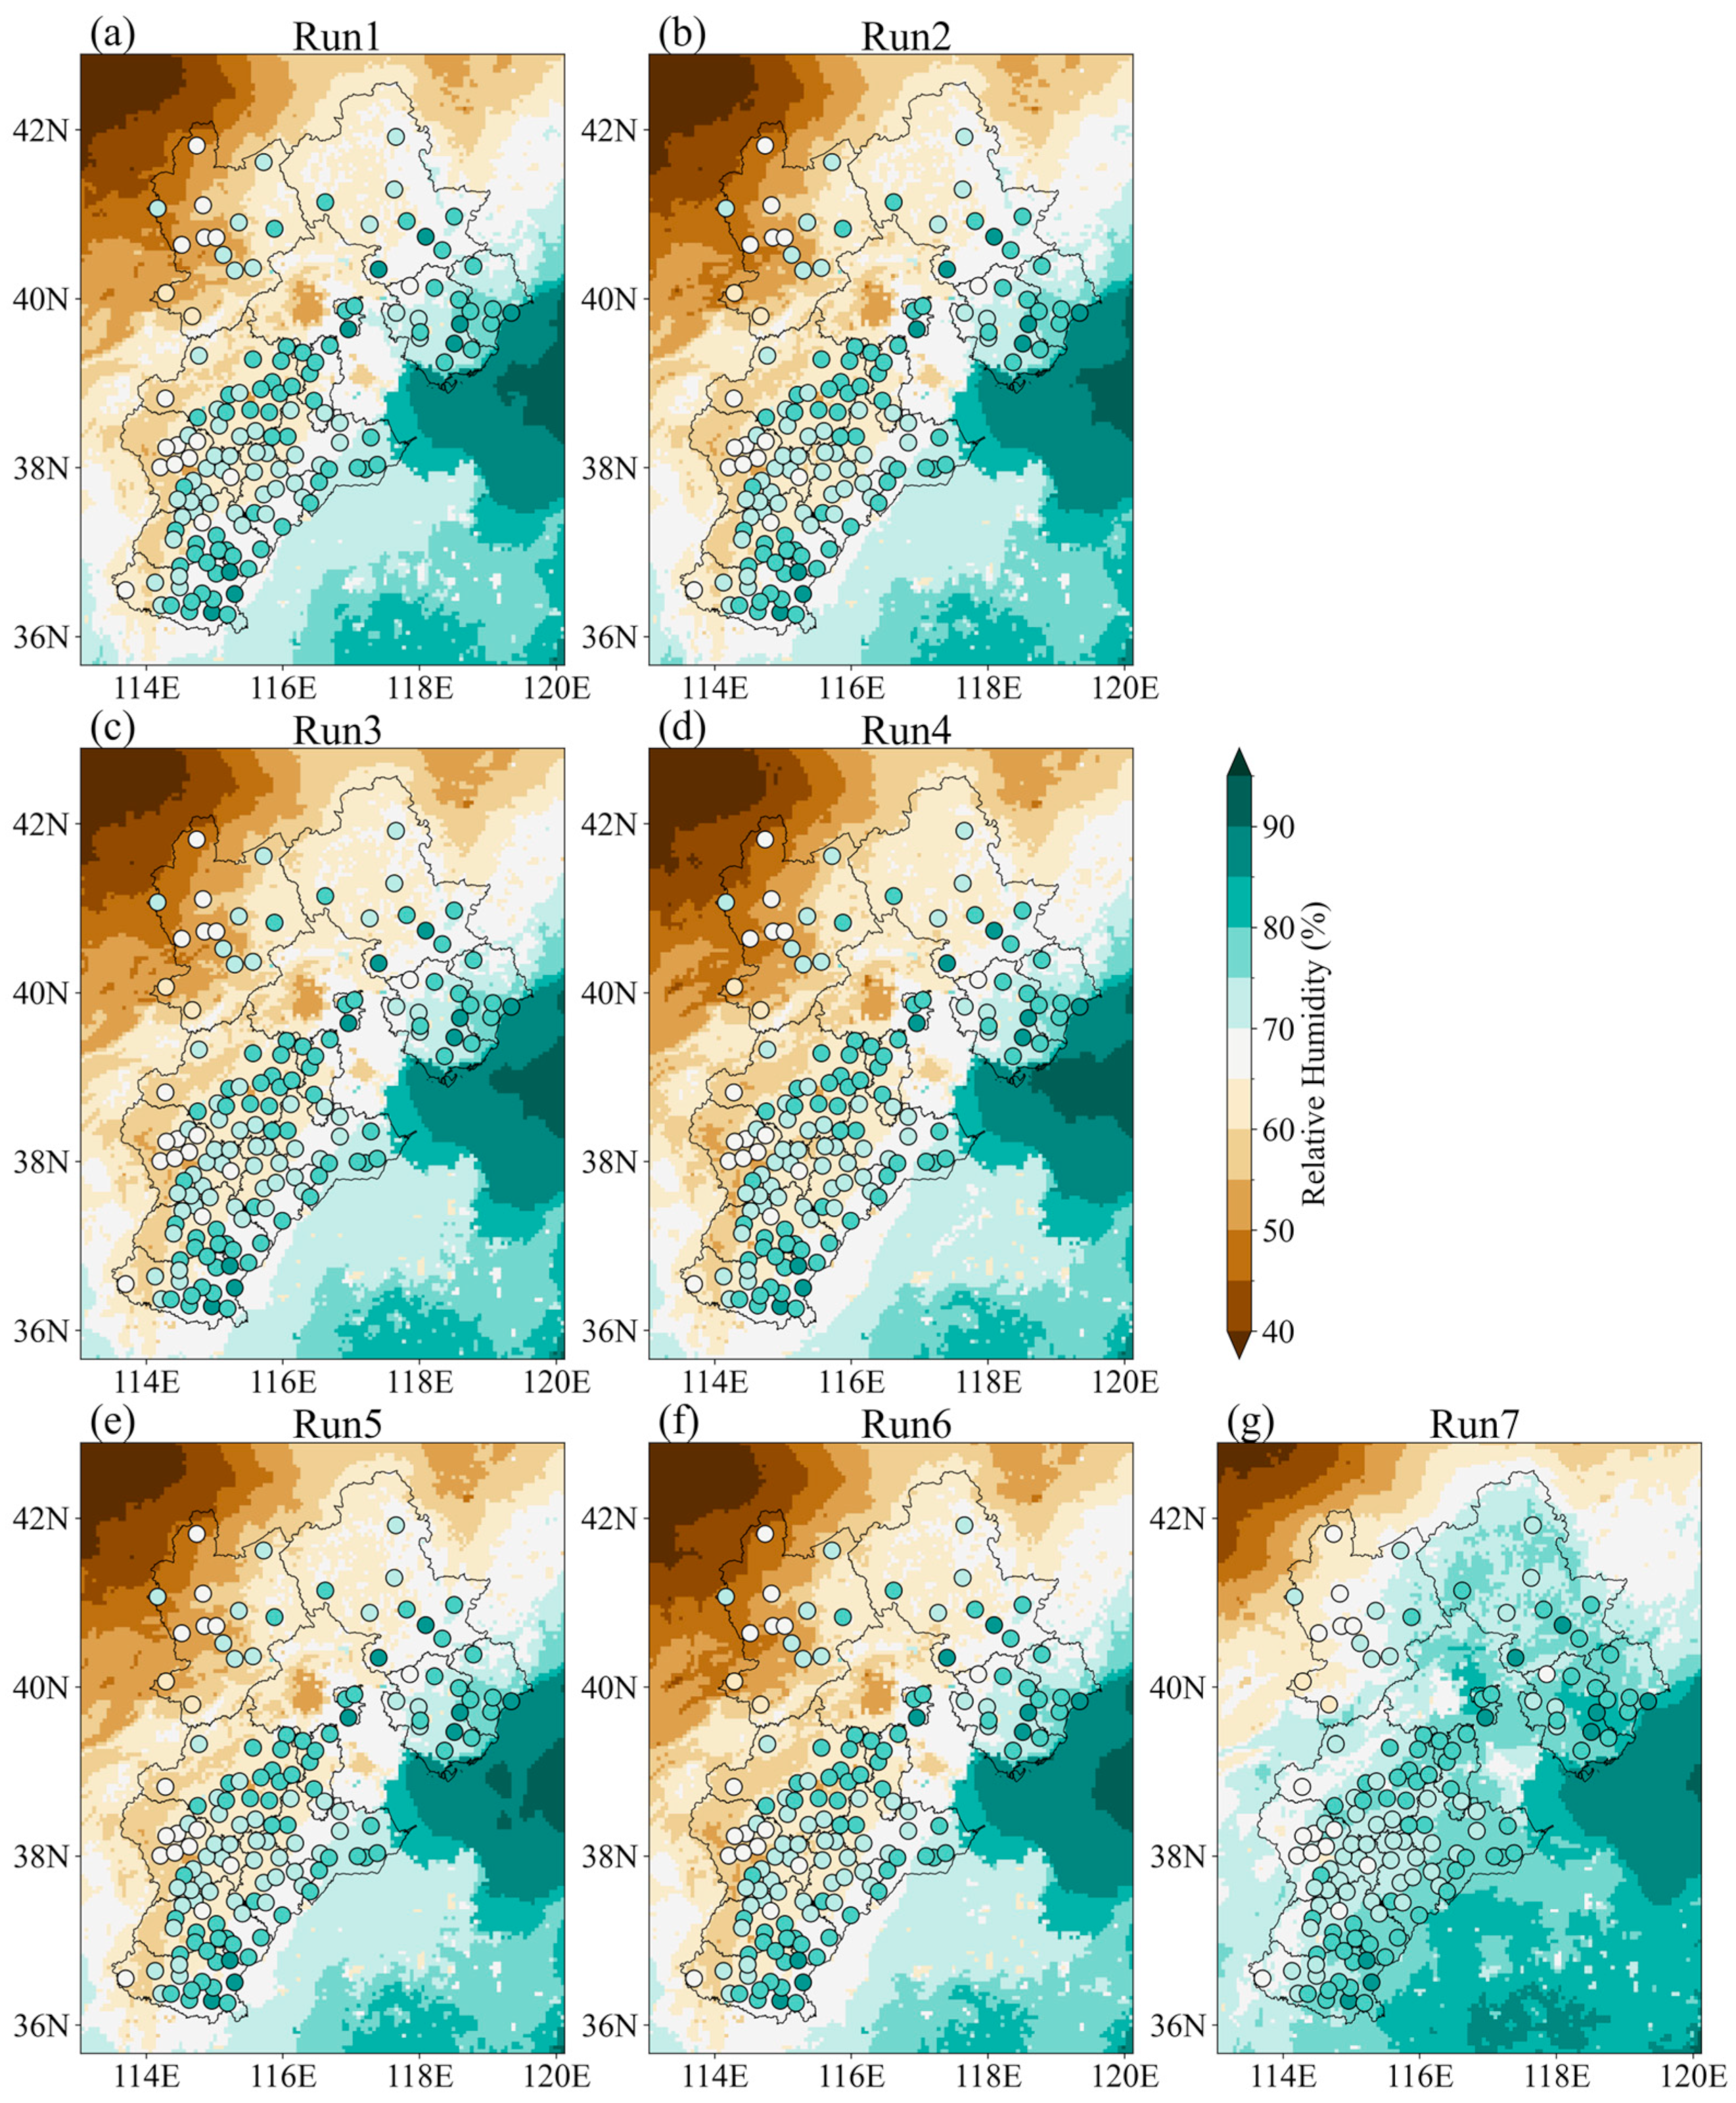
The spatial distribution of observational and simulated surface relative humidity is illustrated in
Figure 5, given its significant influence on precipitation. All WRF simulations reasonably reproduce the decreasing trend from southeast to northwest across Hebei Province, which is consistent with the observations. At the same time, all the sensitivity simulations tend to underestimate the relative humidity compared to the observation; it is particularly clear in the western and central regions of Hebei Province, which is consistent with the bias of precipitation (
Figure 3). The spatial distribution of relative humidity simulated by different parameterization schemes are very similar; thus, the model biases are also quite similar. Notably, the simulation with analysis nudging (Run7) shows distinct improvement compared to other simulations, as it produces much higher relative humidity over the simulation domain, which reduces the model bias and shows better agreement with the observations, especially over the central regions of Hebei Province.
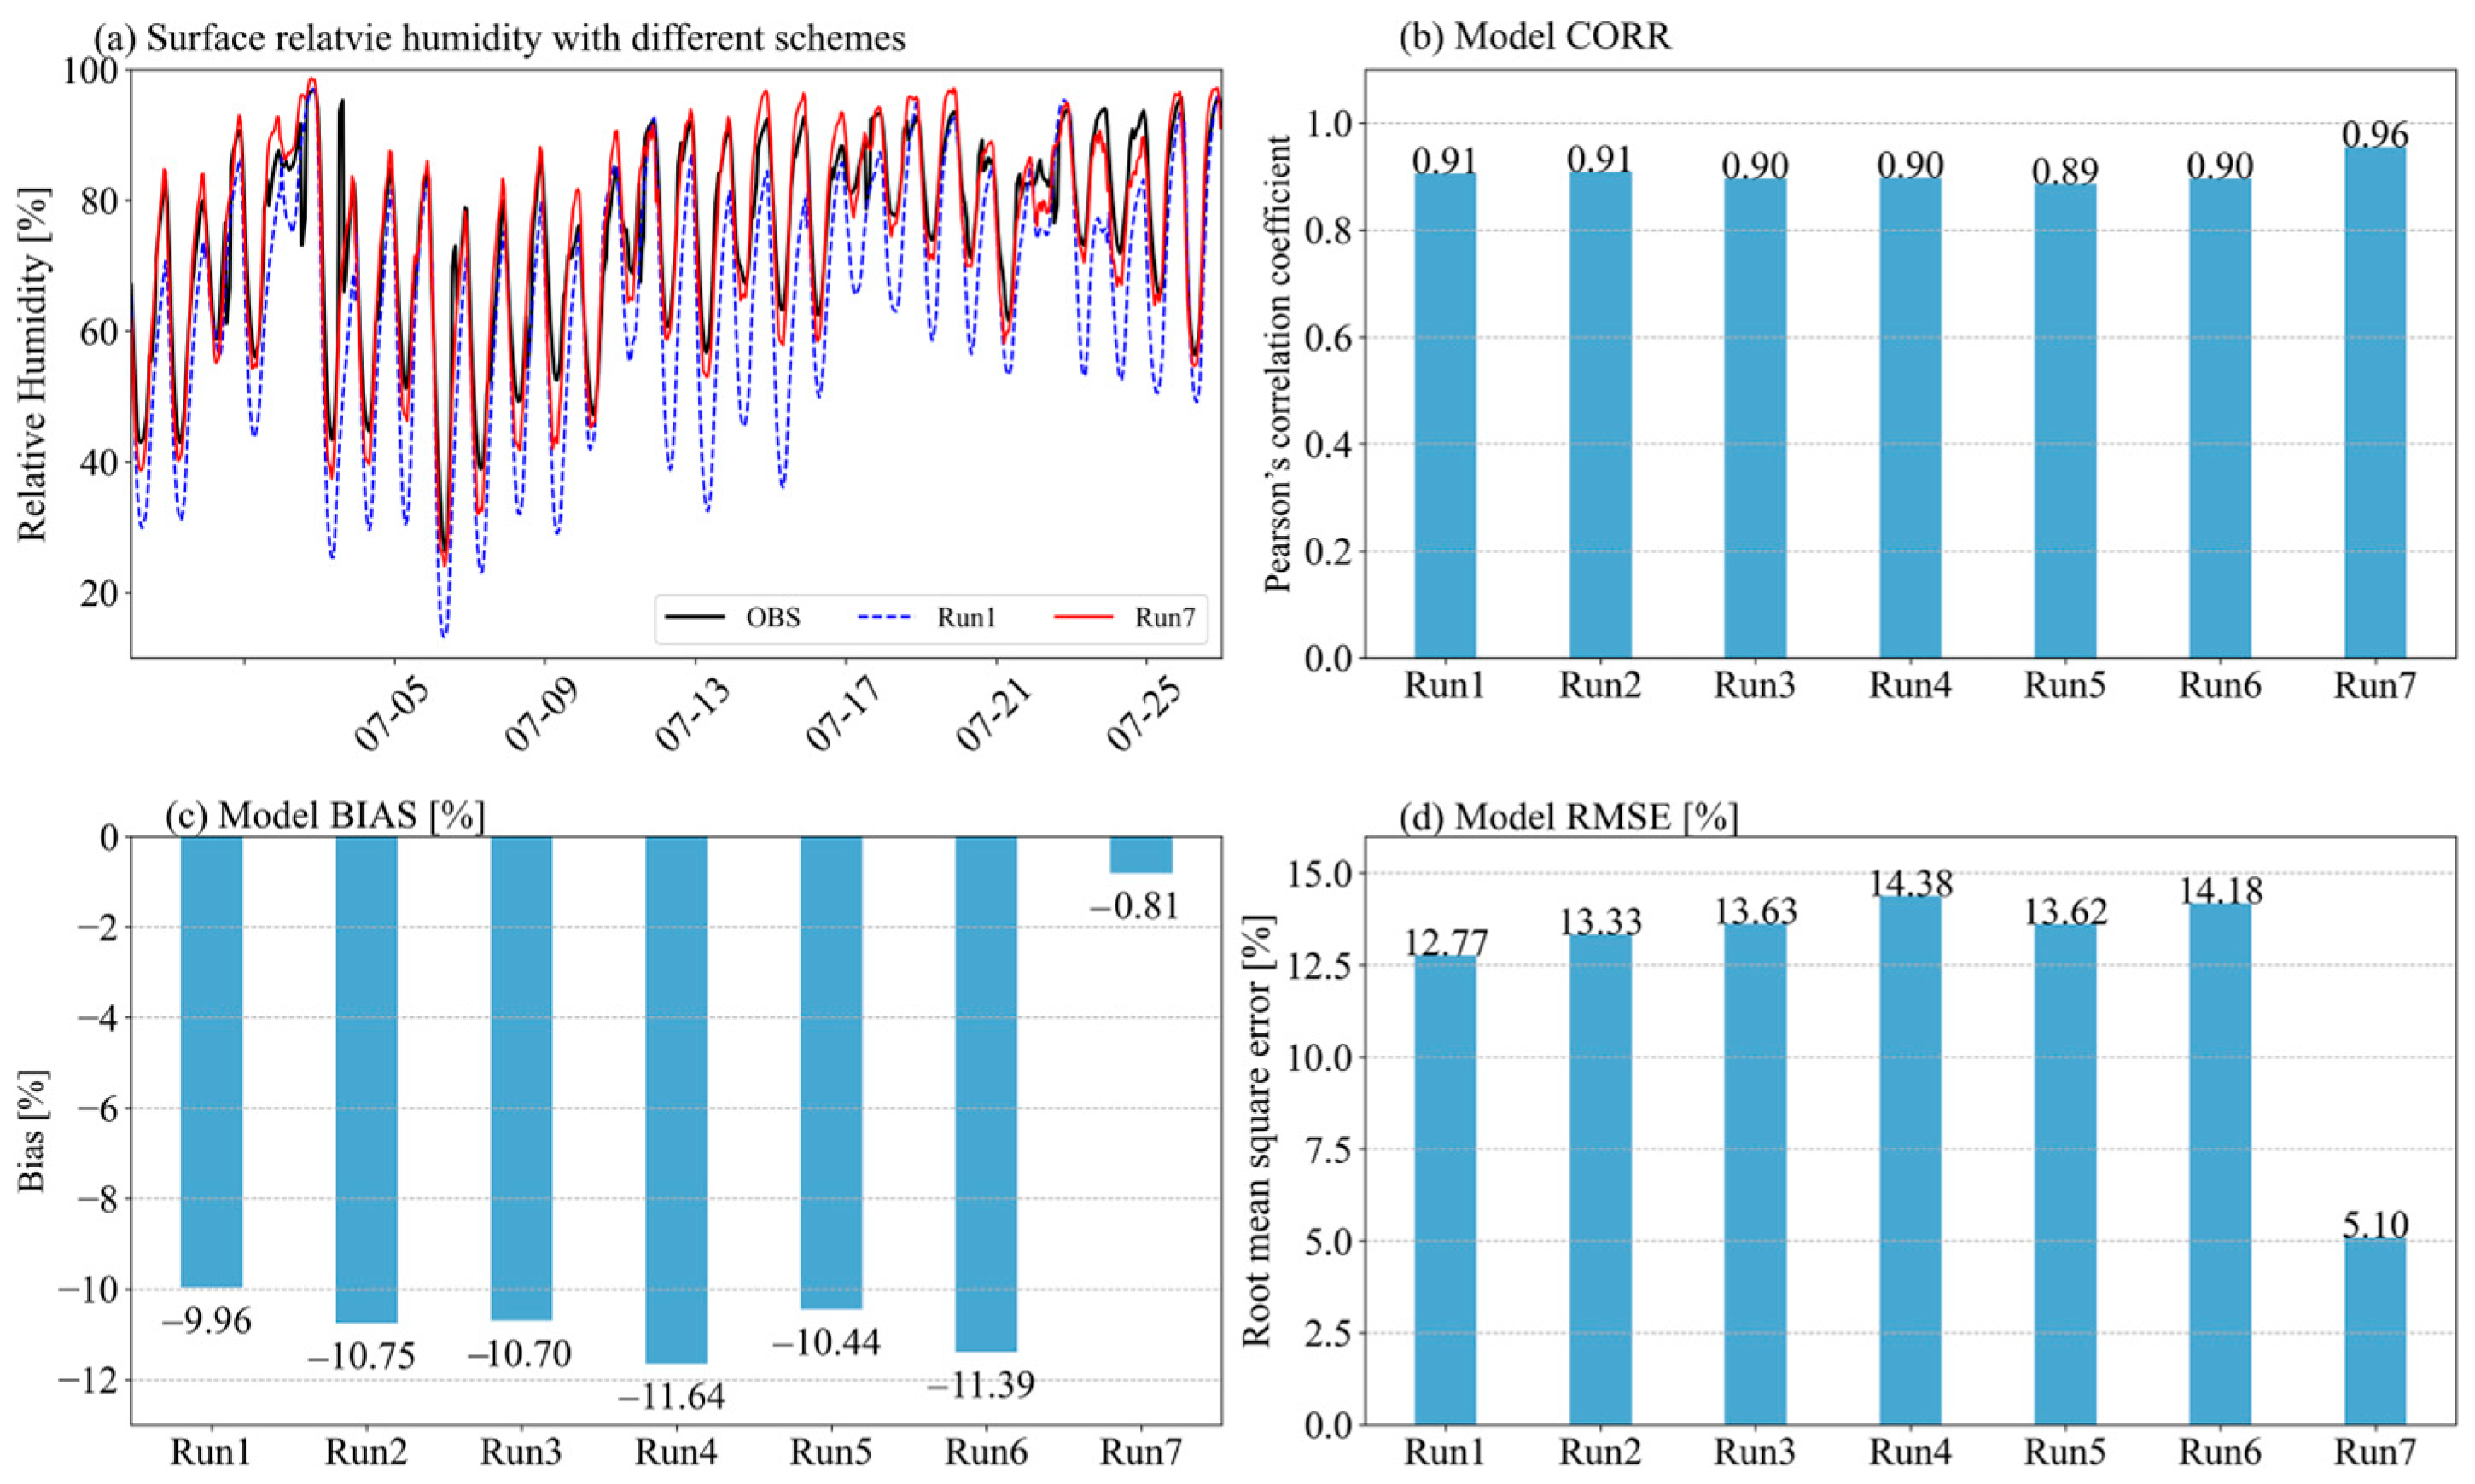
Figure 6 shows the time series of relative humidity from observations and sensitivity simulations. The diurnal cycle of relative humidity can be well reproduced by all the simulations, while almost all parameterization scheme experiments tend to underestimate relative humidity during the daytime hours. Conversely, simulations generally show good agreement with observations during nighttime periods. The differences between the physical scheme experiments are quite minimal, reflected in the statistical metrics of
CORR,
BIAS, and
RMSE. According to the statistical scores, the simulation employing the Kain–Fritsch and WSM6 schemes ranks first among the experiment, with the highest
CORR (0.91) alongside the lowest
BIAS (−9.96%) and
RMSE (12.77%).
However, analysis nudging significantly improve the model simulations, being evident not only in the time series but also in the statistical metrics. The experiment with analysis nudging (Run7) reproduces the time series of relative humidity for both daytime and nighttime periods well, yielding the best scores in CORR (0.96), BIAS (−0.81%), and RMSE (5.10%). This significant improvement may be attributed to the direct nudging of relative humidity during the model simulation; conversely, precipitation is not assimilated during the model simulation.
Figure 7 shows the spatial distribution of the average surface temperature from station observations and model simulations; the WRF model with different physical parameterization schemes generally reproduces the spatial features of temperature, while significant overestimations are observed in the model simulations. The simulations with different physical parameterization schemes are very similar, indicating that cumulus and microphysical schemes have a small effect on the temperature simulation. However, analysis nudging improves the simulation by reducing the overestimation of temperature, and the simulation of Run7 shows better agreement with the station observations.
Figure 8 illustrates the time series of temperature averaged across all stations and the results of corresponding sensitivity experiments. While the WRF model reproduces the diurnal cycle of temperature well, it shows significant overestimation during the daytime hours, which is consistent with the overestimation in
Figure 7. Conversely, WRF reproduces the temperature at nighttime periods well, with good agreement with the observations. Notably, simulation with analysis nudging shows much better performance in reproducing the time series of temperature, with better agreement with observation throughout both nighttime and daytime periods. Consequently, the statistical score of the
BIAS of the analysis nudging experiment (Run7) is 0.35 °C, which is significantly lower than the other sensitivity experiments (2.21~2.70 °C). Regarding the parameterization scheme experiments, the simulation with Kain–Fritsch and WSM6 (Run1) shows the best performance according to
CORR (0.93) and
RMSE (2.85 °C) scores; however, the simulation with the WSM6 scheme and cumulus scheme turning off (Run5) ranks first according to
BIAS (2.21 °C) scores. Analysis nudging (Run7) can further improve the model ability in reproducing temperature, with the best scores of
CORR (0.97) and
RMSE (1.03 °C) among all the sensitivity experiments.
Precipitation can also be influenced by wind speed. Thus, the simulations of wind speed are also investigated.
Figure 9 shows the spatial distribution of wind speed from the observation and model simulations, while WRF captures the spatial features of wind speed over Hebei Province. Overestimations are evident in the model simulations, particularly in the central regions of Hebei Province. For instance, many stations in the central regions record wind speeds of approximately 0.5 m/s, whereas the simulations indicate speeds around 2.5 m/s. The simulation with analysis nudging (Run7) shows better agreement with the observations, with much lower wind speed compared to other sensitivity experiments. Consequently, analysis nudging can further improve the model’s ability in reproducing wind speed.
Figure 10 shows the time series of observed wind speed as well as the corresponding statistical scores. The simulations generally reproduce the variation of wind speed. However, most simulations show large overestimation during all the simulation period, both at daytime and nighttime periods. Nevertheless, analysis nudging improves the model simulation significantly, with much lower wind speed compared to the other sensitivity experiments. For instance, the simulated wind speed of Run7 fits the observation very well during the periods of 1–10 July and 15–20 July. The time series of wind speed simulated by the parameterization schemes are quite similar, indicating similar model biases, ranging from 0.83 m/s to 0.96 m/s. The simulation with Kain–Fritsch and WSM6 (Run1) shows the best performance in terms of
BIAS (0.83 m/s) and
RMSE (1.07 m/s) scores, while the simulations with the Tiedtke scheme and Thompson scheme (Run4) and the Thompson scheme with the cumulus scheme turning off (Run6) show the best model performance according to
CORR (0.73) scores. The simulation with analysis nudging (Run7) further improves the model performance, with much higher
CORR (0.88) alongside lower
BIAS (0.23 m/s) and
RMSE (0.44 m/s) scores.
4. Discussion
As demonstrated in previous investigations over other regions, the performance of WRF in simulating precipitation is influenced by many factors, such as temperature, humidity, and wind, and the relationship among these variables is highly complicated. According to the Clausius–Clapeyron equation, precipitable water content will increase by 7% per degree of warming; however, many studies found that short-term duration precipitation does not increase proportionally [
45,
46]. In this study, for the parameterization scheme experiments, most sensitivity simulations underestimate precipitation over Hebei Province (
Figure 3), which agrees with the negative bias of relative humidity (
Figure 5), and thus, the bias in relative humidity may contribute to that of precipitation; however, it is also possible that the negative bias in relative humidity is caused by the underestimation of precipitation. Concurrently, the negative biases of relative humidity might also be influenced by temperature and wind speed, as the WRF model generally overestimates temperature (
Figure 7) and wind speed (
Figure 9), and the elevated temperatures and intensified wind speeds tend to increase the evaporation, leading to drier air and subsequently lower relative humidity.
It is evident that parameterization schemes significantly influence the model’s performance in reproducing precipitation over Hebei Province, as well as temperature, relative humidity, and wind speed. Nonetheless, it is challenging to find the best parameterization scheme reproducing every precipitation event over Hebei Province well, as each scheme may be successful in reproducing one specific event while it fails in another. It is also challenging to find the best parameterization scheme for all the variables; for instance, the simulation with the Tiedtke and Thompson schemes shows the best performance in reproducing the average precipitation over Hebei Province, with the highest CORR and lowest RMSE, while the simulation with Kain–Fritsch and WSM6 ranks first among the experiments for the simulation of relative humidity. Thus, the determination of best parameterization schemes should rely on a systematic comparison of available combinations of parameterization schemes for a given location.
Moreover, other model configurations, such as analysis nudging, have a strong influence on model performance. In our study, the simulation with analysis nudging shows further improvement compared to the parameterization scheme experiments, indicating its advantage in precipitation simulations. Nevertheless, analysis nudging should be applied with caution, as it alters the dynamical balance by imposing external constraints on the evolution towards observational data. This can potentially impact the model’s ability to simulate certain meteorological phenomena accurately, such as convective processes or boundary layer dynamics, particularly in high-resolution simulations.
It is worth noting that due to the availability of computational resources, the horizontal resolution is configured as 5 km, and the simulation periods of the sensitivity experiments cover only one month, which indicates the main limitation of this study. It is promising that the WRF model can generally reproduce the distribution of precipitation over Hebei Province well, which is consistent with previous studies over Asia or China [
47,
48]. However, the correlations between observed and simulated precipitation are approximately 0.3, which is relatively low compared with previous coarser resolution simulations; thus, further tuning on the physical parameterizations is needed in future work. Despite these limitations, this study is important to Hebei Province, as it provides valuable references for selecting the best model configurations for precipitation forecasting applications, and the availability of better high-resolution numerical simulations has potential for local hydrological simulation, which always requires high-resolution and reliable precipitation data.
5. Conclusions
In this study, we investigate the influence of parameterization schemes and analysis nudging on precipitation simulation over Hebei Province using multiple month-long high-resolution WRF sensitivity simulations. The horizontal resolution of WRF is configured at 5 km, falling in the cumulus “gray-zone” category, which is seldom investigated in prior research. The performances of different parameterization schemes in reproducing precipitation are analyzed using dense station observations recorded by the local Meteorology Administration as a reference. Additionally, further analysis was conducted on temperature, relative humidity, and wind speed to gain a comprehensive understanding of the model’s ability and potential influencing processes associated with precipitation biases.
The sensitivity experiments indicate that the spatial and temporal distributions of precipitation in Hebei Province are well reproduced by the WRF model; however, the model tends to underestimate the precipitation compared with the observational data. The simulation with the Tiedtke cumulus parameterization scheme and Thompson microphysical parameterization scheme shows the best performance, with a CORR of 0.45 and RMSE of 0.34 mm/day; at the same time, the analysis nudging experiment, which assimilates the observational data, achieved a CORR of 0.47 and RMSE of 0.33 mm/day. Thus, the incorporation of observational data can improve the model performance, and it should be emphasized that the Tiedtke cumulus parameterization scheme combined with the Thompson microphysical parameterization scheme reach practically the same accuracy without analysis nudging as the sensitivity experiment with analysis nudging.
Further analysis indicates that the model bias in precipitation may be associated with biases in relative humidity, temperature, and wind speed, as the WRF model tends to underestimate the relative humidity, which will limit the precipitable water, thus consistent with the negative bias in precipitation. At the same time, WRF tends to overestimate temperature and wind speed, and the elevated temperatures and intensified wind speeds will increase the evaporation, resulting in the negative bias in relative humidity. However, further investigation into the detailed processes among these variables should be conducted in future research, which will be informative for the WRF model development.
It is noteworthy that no single scheme demonstrates optimal performance across all meteorological variables, and parameterization schemes possess individual advantages. Therefore, it is crucial to carefully select the most appropriate parameterization schemes for the WRF model in precipitation modeling and operational meteorological forecasting. The simulation with analysis nudging shows additional improvement compared to the parameterization scheme experiments, indicating its advantage in operational hydrological forecasting. However, caution should be paid in the application of analysis nudging, as it can break the dynamical balance by imposing external constraints on the evolution towards observational data.


