Article

Integrating Microseismic Monitoring for Predicting Water Inrush Hazards in Coal Mines

1
Hebei State Key Laboratory of Mine Disaster Prevention, North China Institute of Science and Technology, Beijing 101601, China
2
College of Civil Engineering, Jilin University, Changchun 130012, China
*
Author to whom correspondence should be addressed.
Water 2024, 16(8), 1168; https://doi.org/10.3390/w16081168
Submission received: 11 March 2024 / Revised: 11 April 2024 / Accepted: 17 April 2024 / Published: 20 April 2024
(This article belongs to the Special Issue Risk Analysis in Landslides and Groundwater-Related Hazards)

Abstract

:
The essence of roof water inrush in coal mines fundamentally stems from the development of water-bearing fracture zones, facilitating the intrusion of overlying aquifers and thereby leading to water hazard incidents. Monitoring rock-fracturing conditions through the analysis of microseismic data can, to a certain extent, facilitate the prediction and early warning of water hazards. The water inflow volume stands as the most characteristic type of data in mine water inrush accidents. Hence, we investigated the feasibility of predicting water inrush events through anomalies in microseismic data from the perspective of water inflow volume variations. The data collected from the microseismic monitoring system at the 208 working face were utilized to compute localization information and source parameters. Based on the hydrogeological conditions of the working face, the energy screening range and its calculation grid characteristics were determined, followed by the generation of kernel density cloud maps at different depths. By observing these microseismic kernel density cloud maps, probabilities of roof water-conducting channel formation and potential locations were inferred. Subsequently, based on the positions of these roof water-conducting channels on the planar domain, the extension depth and expansion direction of the water-conducting channels were determined. Utilizing microseismic monitoring data, a quantitative assessment of water inrush risk was conducted, thereby establishing a linkage between microseismic data and water (inrush) data, which are two indirectly related datasets. The height of microseismic events was directly proportional to the trend of water inflow in the working face. In contrast, the occurrence of water inflow events and microseismic events exhibited a specific lag effect, with microseismic events occurring prior to water inrush events. Abnormalities in microseismic monitoring data partially reflect changes in water-conducting channel patterns. When connected with coal seam damage zones, water inrush hazards may occur. Therefore, abnormalities in microseismic monitoring data can be regarded as one of the precursor signals indicating potential floor water inrushes in coal seams.

1. Introduction

Coal seam roof water inrush accidents occur when the roof rock layer ruptures due to mining disturbances or structural influences, leading to the development of water-conducting fracture zones and the release of water from aquifers [1,2]. The microscopic explanation of rock mass rupture manifests as anomalous microseismic activity. By monitoring fluctuations in roadway microseismic events, abnormal rock mass damage can be predicted. Numerous scholars have analyzed the pattern of rock mass damage and disaster-causing mechanisms based on microseismic event data, thus predicting and warning against dynamic disasters [3,4,5,6,7,8,9,10]. In mine water hazard prevention and control, the initial application of microseismic monitoring systems involves studying the rupture and instability process of water-conducting channels. Additionally, it entails dynamically portraying the spatiotemporal evolution process of these channels [11,12,13,14].
Further research has been conducted on the limitations of microseismic monitoring accuracy in seismic source monitoring in different lithological strata, the combination of microseismic monitoring with other methods, and the accuracy of water hazard monitoring [15,16,17,18,19,20,21,22,23,24]. Currently, by combining numerical simulation and techniques such as “well-ground-hole” joint monitoring, microseismic monitoring systems can be constructed. By identifying the law of microfracture in surrounding rock and delineating potential water inrush hazard areas, as well as analyzing the dynamic development of water-conducting fracture zones, predictions and warnings of mine water inrush are created [25,26,27,28,29]. However, changes in the water inrush volume, as the most intuitive data for mine water hazards, lack a correlation analysis studying their relationship with microseismic event data [30].
To this end, this study analyzed the microseismic monitoring data of the roof strata in the 208 working face of the Tinan coal mine based on previous research to investigate the dynamic changes in rock mass failure, the crack propagation range, and the development height of water-bearing fracture zones during different stages of roof mining. By comparing the variations in water inflow during the advancement of the working face, the relationship between microseismic monitoring data and water inflow was analyzed. Furthermore, the feasibility of using abnormal microseismic data as a precursor to predicting water inrush events from the perspective of water inflow variation was explored, laying a technical foundation for future coal mine water hazard early warning based on microseismic data.

2. Materials and Methods

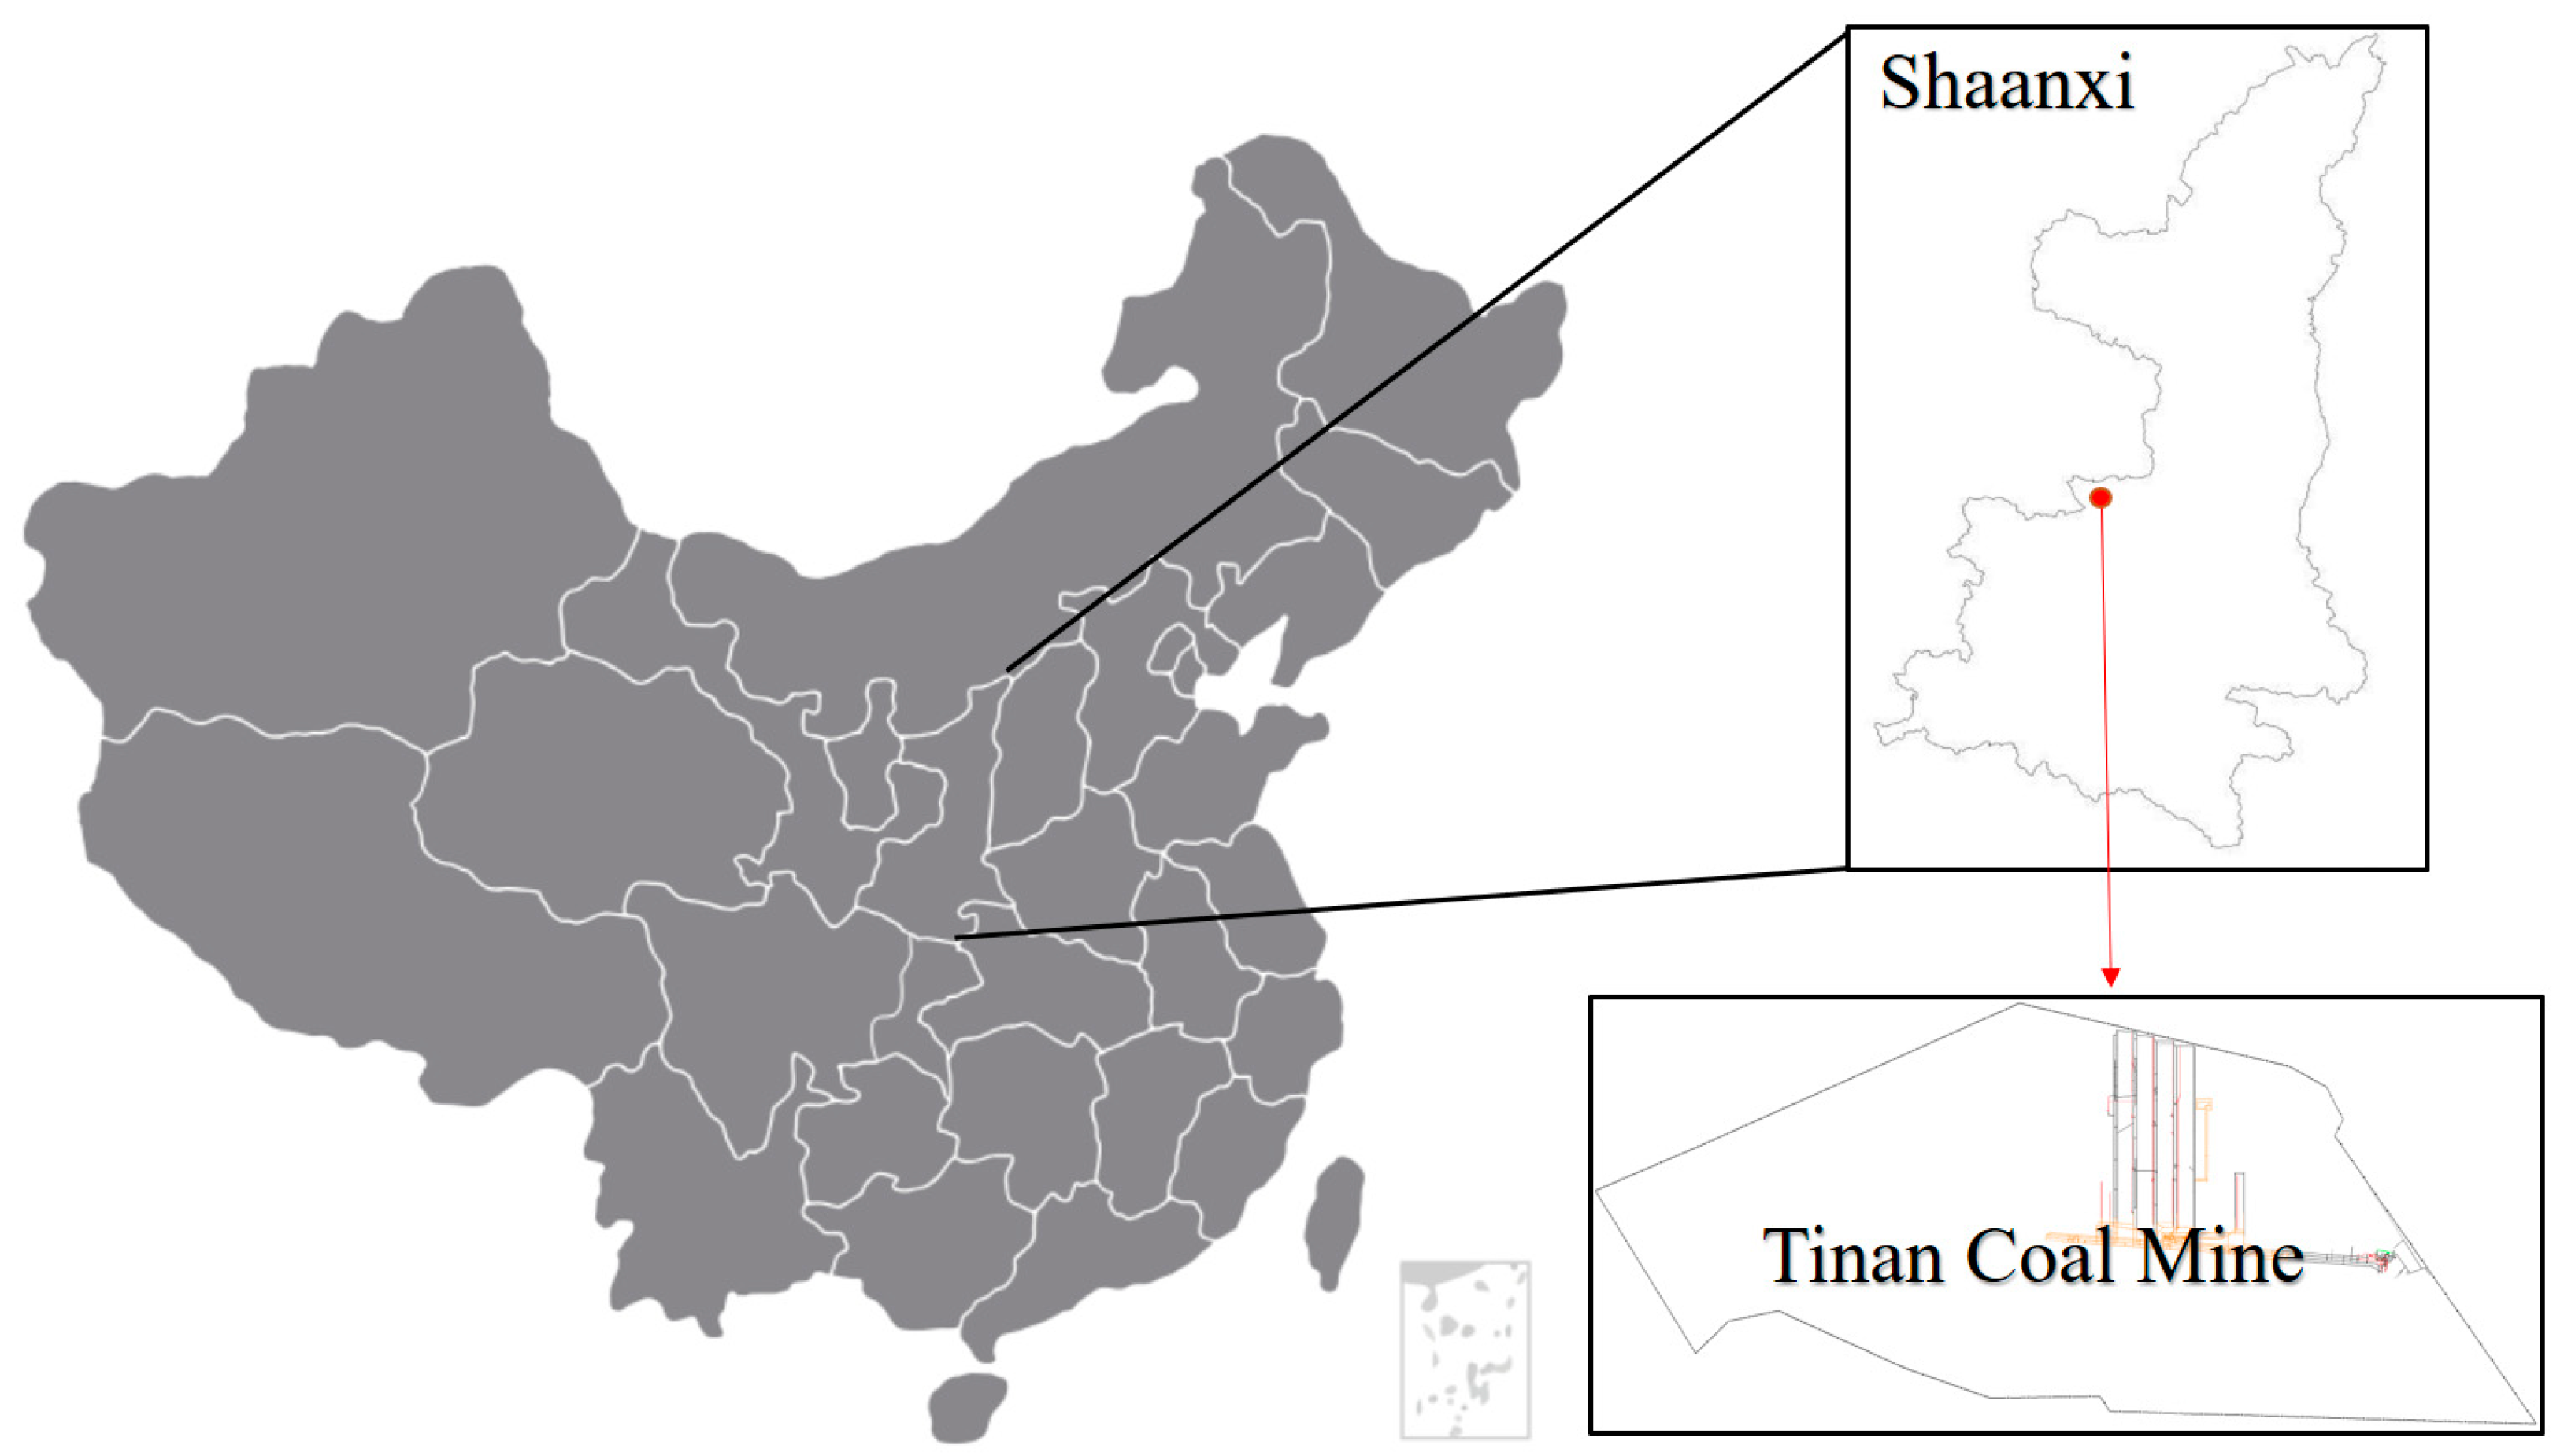
2.1. General Situation

The coal seam mined in the Tinan coal mine is the 4th in the Jurassic Yan’an Formation. The dip angle of the coal seam ranges from 0 to 8 degrees, with a bottom boundary elevation of +380 m, an average thickness of 18.0 m, and an average mining thickness of 7.5 m. The 208 working face is located in the middle of the northern Erpan area of the mine, with the 205, 206, and 207 large goaf areas already mined out on the east side. The working face has a length of 3000 m and a width of 200 m. The comprehensive mechanized caving mining method is used, with natural caving management of the roof. According to existing geological exploration data, the geological structure of the 208 working face is simple, crossing the axis of the Nanyuzi anticline, with no significant faults, magmatic rocks, or collapsed columns found (Figure 1 and Figure 2).
The hydrogeological conditions in this area are complex, and the order of the aquifers and aquitards from top to bottom are as follows: Quaternary and Neogene loose layer porous aquifers; the Cretaceous Huachi Formation aquitard; the Lower Cretaceous Yijun and Luohe Formation porous-to-fractured confined aquifer groups, with Yijun Formation aquifers having weak aquifer properties and Luohe Formation aquifers having moderate aquifer properties, serving as the main water sources for the 208 working face; the Middle Jurassic Anding Formation aquitard; the Middle Jurassic Zhiluo Formation porous-to-fractured confined aquifer groups and Middle to Lower Jurassic Yan’an Formation porous-to-fractured confined aquifer groups, with Zhiluo Formation and Yan’an Formation aquifers having weak aquifer properties and a relatively minor impact on the mine; and the Lower Jurassic Fuxian Group as a relatively impermeable aquifer group. Among them, the confined aquifers of the Yijun and Luohe Formations have a significant impact on the working face and are considered critical aquifers.

2.2. Analysis of Mine Water-Filling Conditions

The sources of water inflow in mines generally include atmospheric precipitation, surface water, roof water, floor water, and old workings water. For the 208 working face, the primary sources of water inflow are the Lower Cretaceous Yixian Formation and the Luohexian Formation, which are buried deep underground and do not outcrop. The Luohexian Formation sandstone aquifer outcrops in steep valleys, making it less conducive to surface water infiltration, thereby minimizing the impact of atmospheric precipitation and surface water on mine water inflow. The coal seam floor in the 208 working face consists of the Middle Jurassic Yan’an Formation and the Lower Jurassic Fuxian Formation, both of which are relatively impermeable layers composed of shale and sandstone, posing no threat of water inflow during mining. Water levels in the 207 goaf area have been controlled within a safe range by implementing water drainage drilling, posing no threat to the safety of mining operations at the working face. However, the pressure aquifers in the Yijun and Luohexian Formations in the roof strata of the 208 working face are the main sources of water inflow, as they significantly influence the working face. Based on the analysis of mining data, the mine field does not have developed fault structures, with only one fault having a throw of 8 m, while the throw of the other faults is less than 4 m, and there are no unclosed or poorly drilled boreholes in the 208 working face. In summary, the primary water hazard faced by the 208 working face is from the pressurized aquifers in the Yijun and Luohexian Formations of the 4th coal seam roof, with the main water-conducting channels being the water-bearing fracture zones, and changes in water inflow are primarily influenced by the degree of development of these water-bearing fracture zones.

2.3. Microseismic Monitoring Plan for the Working Face

2.3.1. Construction of the Microseismic Monitoring System

In coal mine safety monitoring, the application of microseismic monitoring technology involves converting rock mass fracture signals induced by mining into data signals using deployed monitoring equipment. These signals are then processed, and source information is identified based on waveform data to obtain rock mass fracture information. The characteristics and response patterns of fracture source clustering identified by microseismic detection can provide early warning information for dynamic ground pressure, gas outbursts, and floor water hazards. Additionally, microfractures generated by external loads on the rock mass accumulate over time, leading to the initiation and propagation of cracks in different spatiotemporal contexts. These characteristics of microseismic signals can be used to infer the distribution characteristics of fractures within the rock mass.
Therefore, utilizing microseismic technology for the monitoring and early warning of limestone water hazards in coal seam floors requires high demands on the background noise of the monitoring environment (amplitude (voltage) not exceeding 1 × 10⁻⁵ v). The KJ551 microseismic monitoring system features high sensitivity, a wide bandwidth, and low background noise (Table 1), enabling the collection of weak rock mass fracture signals.

2.3.2. Microseismic Monitoring Network

The layout method and density of the seismic network can directly affect the positioning accuracy of the microseismic monitoring system. In order to monitor the occurrence of microseismic events in real time in the 208 working face and adjacent goaf, the principles of uniform coverage, dense arrangement, and reasonable layout were adopted. In the 208 working face, 12 monitoring points were distributed along the upper and lower coal seams (Figure 3), with a detection radius of 1500 m for each seismometer. The seismometers were arranged 9 m below the coal seam roof, with a monitoring positioning accuracy of 10 m horizontally and 20 m vertically. They functioned as vibration sensors, covering the entire operational area of the 208 working face along the upper and lower coal seams (Figure 3).
Before the mining of the working face, the coal rock mass contains concentrated static loads. After the working face begins advancing, microseismic events occur due to the comprehensive mechanized caving mining method, causing the collapse or bending and sinking of the roof when the overlying strata collapse. The ARAMISM\E microseismic monitoring system is used to monitor the coal rock mass fracturing during the mining process of the working face.

3. Results

Microseismicity refers to the phenomenon of rock mass vibration occurring when a certain amount of energy accumulates in localized areas of the rock mass due to mining activities and is subsequently released through mechanisms such as fracturing and vibration. Considering the characteristics of mining activities, it is understood that during the initial stages of mining, the coal rock mass is in a phase of energy absorption and storage. The elastic strain energy stored per unit volume of coal rock mass can be expressed as
U c = σ 1 2 + σ 2 2 + σ 3 2 2 μ ( σ 1 σ 2 + σ 2 σ 3 + σ 3 σ 1 ) 2 E .
In the equation, the following can be observed:
U c —the elastic strain energy per unit volume of the coal rock mass, J;
σ 1 ,   σ 2 ,   a n d   σ 3 —three principal stresses of the coal rock mass, MPa;
E—the elastic modulus of the coal rock mass;
μ —Poisson’s ratio of the coal rock mass.
As mining progresses, the elastic potential energy accumulated in the rock mass is gradually or suddenly released as seismic waves during non-elastic deformation processes. The intensity of this energy release varies as the structure approaches instability, leading to microseismic events within the rock mass.
The monitoring period selected for the 208 working face is from 15 August 2022 to 25 January 2023, with an advancement distance of 500 m. The distribution of microseismic events is between elevations of +343 m and +488 m. Due to the small dip angle of the coal seam and nearly horizontal mining, layers above +400 m are defined as not containing coal seam roofs. The statistical distribution of roof microseismic events divided by the energy level is shown in Figure 4a. Considering the lack of unified standards for grading the magnitude of microseismic events, this study categorizes events with energy levels of 104 joules and above as high-energy microseismic events in this mine. Within the monitoring period, a total of 1572 roof microseismic events occurred, with 276 of them being classified as high-energy microseismic events.

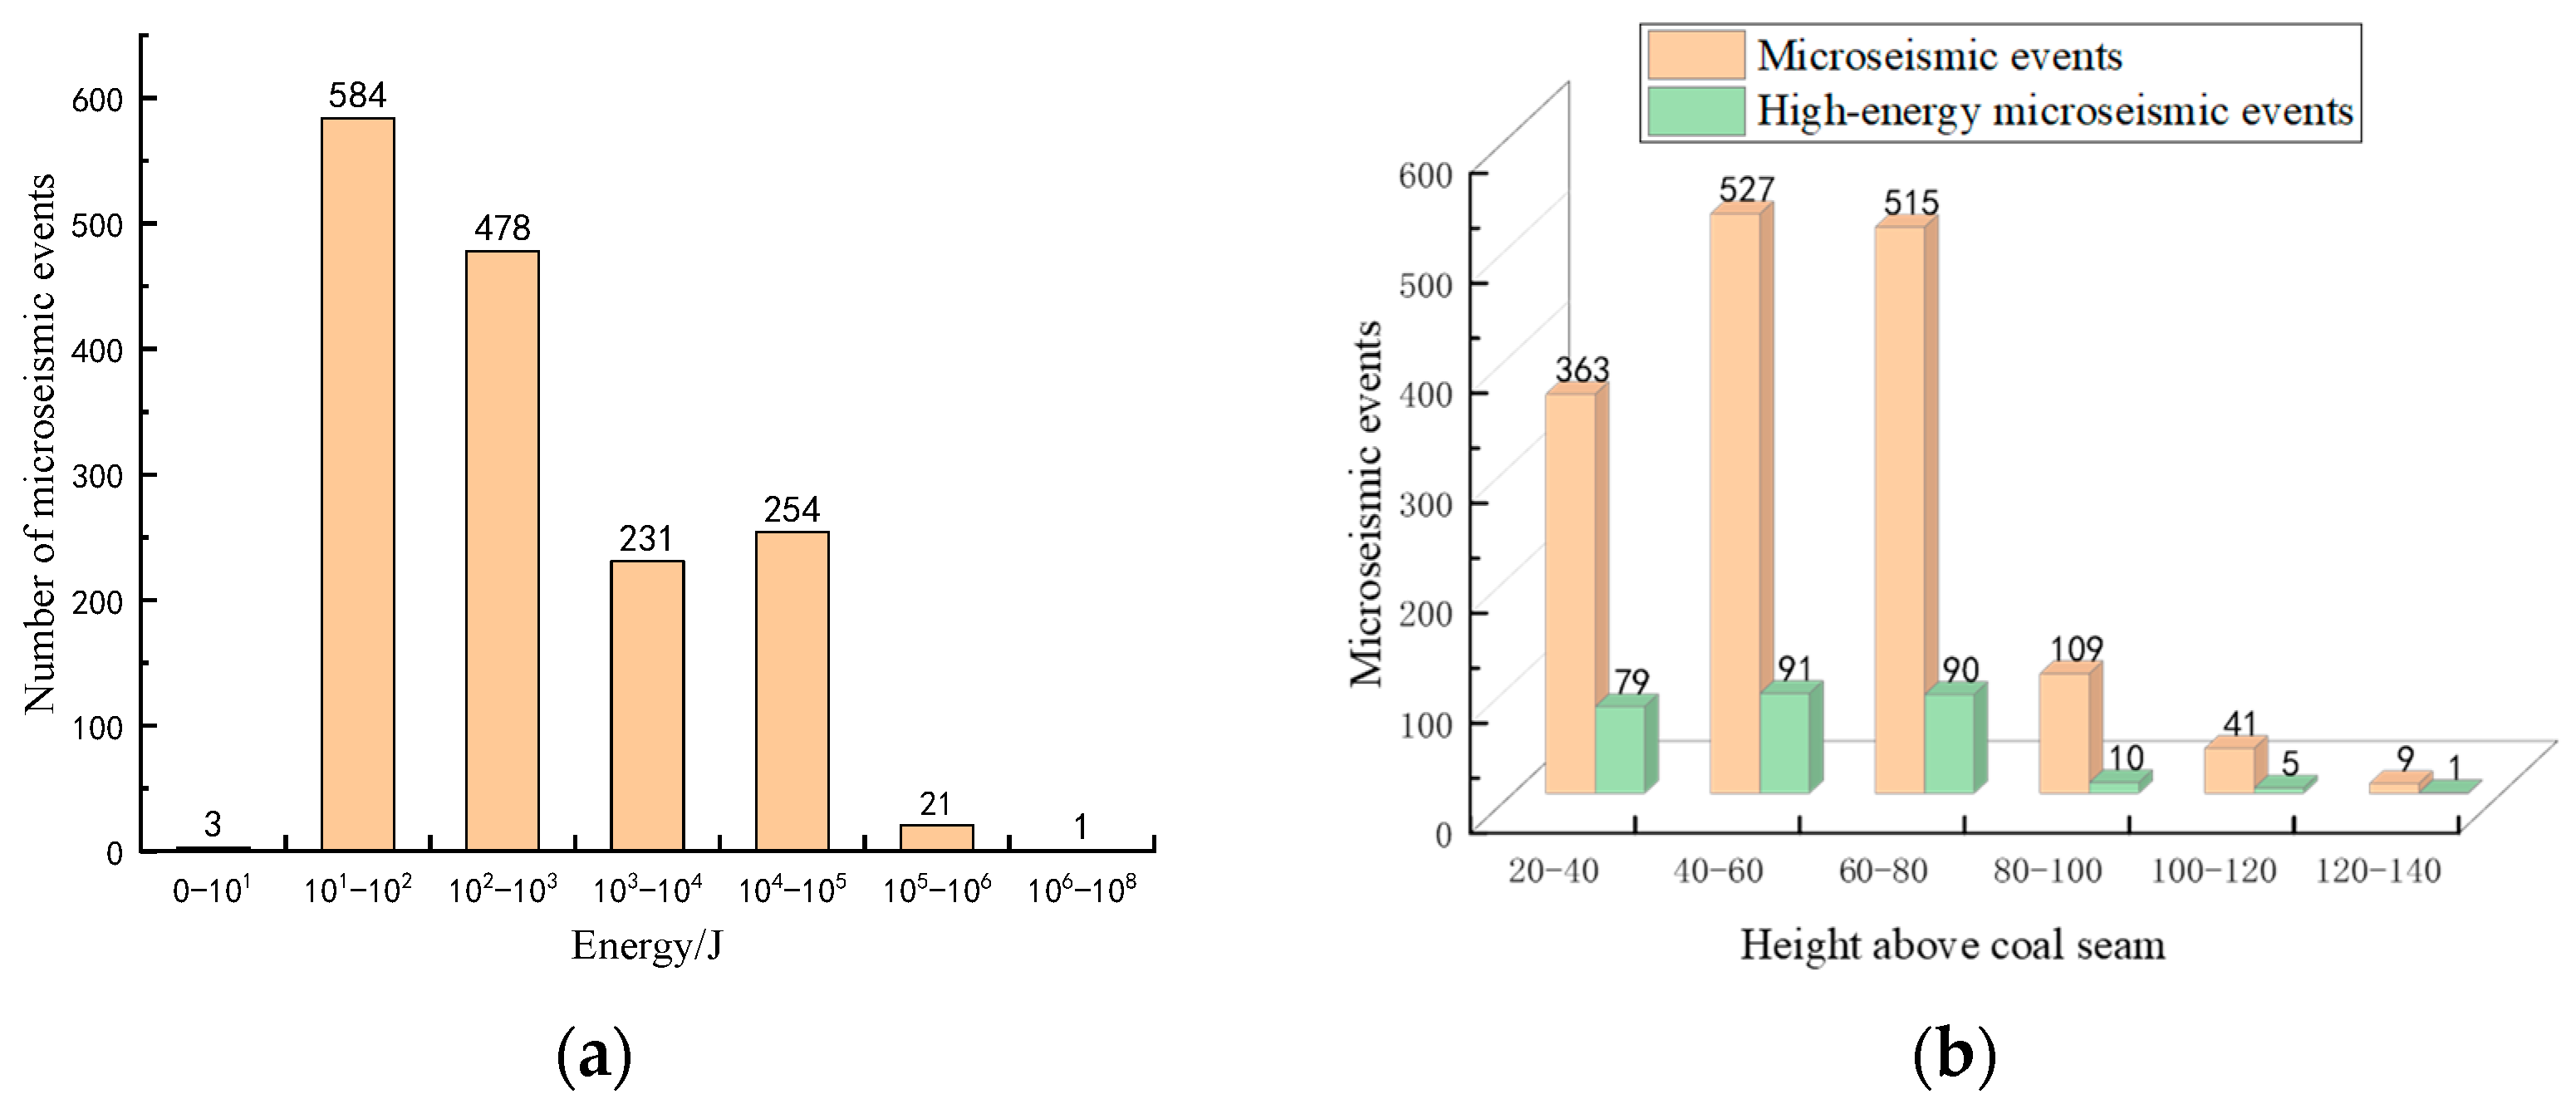
3.1. Grouping Analysis of Microseismic Data Quantity

Each microseismic event can be precisely located in space. The spatial distribution of microseismic events at different heights above the coal seam roof is counted with a vertical interval of 20 m, starting from +400 m. The distribution of microseismic events at various heights above the coal seam roof is shown in Figure 4.
Figure 4b shows that the number of microseismic events are highest between 40 and 60 m above the coal seam roof (527 events), gradually decreasing with increasing height. Between 100 and 120 m, the number decreases to 109 events, with very few events distributed between 120 and 140 m. Both the number of microseismic events and high-energy events are mainly concentrated between 20 and 60 m above the roof, indicating significant influence from mining activities in this range. This corresponds to severe damage to the Yan’an Formation aquifer. In the range between 100 and 140 m above the roof, the numbers of both microseismic events and high-energy events sharply decrease, indicating a smaller influence from mining activities and weaker damage to the overlying strata in this height range.

3.2. Microseismic Data Density Grouping Analysis

The microseismic event density represents the degree of rock mass damage. Based on the spatial locations of high-energy microseismic events during the advancement of the working face, the distribution map of high-energy microseismic events (Figure 5) and the kernel density map (Figure 6) on the longitudinal profile of the 208 working face were plotted. Figure 5 shows that high-energy microseismic events are mainly concentrated vertically within the range of approximately 80 m above the coal seam in the Yan’an Formation and Zhiluo Formation, consisting of fine sandstone and coarse sandstone. The highest concentration can reach around 130 m above the coal seam. Above the Zhiluo Formation aquifer, there is a thick mudstone aquitard at a distance of 60 m, which acts as a barrier and absorbs stress and energy propagation to some extent. Therefore, the number of microseismic and high-energy microseismic events detected above the mudstone layer are relatively low.
As shown in Figure 5 and Figure 6, with the advancement of the working face, the distribution range of microseismic events further expands, and the events become more densely distributed. There is a tendency for upward development in the direction of the working face advancement, which may lead to the formation of penetrating fractures. Until the working face advances to 450 m, there is a significant increase in both the energy level of microseismic events and the number of high-energy microseismic events. Vertically, microseismic events are mainly concentrated within approximately 120 m above the roof.

3.3. On-Site Measurement of Overlying Rock Failure Analysis

The on-site measurement method is the most direct and accurate way to determine the height of the water-bearing fracture zone. A survey of the water-bearing fracture zone height was conducted at the 208 working face. During the investigation, drilling was performed at a borehole named TC2. By comparing the consumption of flushing fluid and the rock fragmentation at different depths before and after mining, and with the aid of a color television surveillance system for borehole inspection, the height of the water-bearing fracture zone was comprehensively determined.
During the drilling process, a significant amount of flushing fluid leaked when the borehole reached 108.21 m. Further drilling revealed the presence of water in the hole, indicating the existence of an upper stratum void. The phenomena observed during drilling are summarized in Table 2. Due to the presence of this stratum void, it was difficult to observe changes in the consumption of flushing fluid after entering the water-bearing fracture zone during this investigation.
The on-site investigation results indicate that the top point of the water-bearing fracture zone is at a depth of 201.96 m. The elevation of the borehole mouth is +757.9 m, and the development elevation of the top of the water-bearing fracture zone is +613.60 m, with a distance of 144.3 m from the 4# coal seam roof. Furthermore, based on underground measurements, the mining thickness of the 4# coal seam at the TC2 borehole location is 9.0 m. Therefore, the calculated ratio of fracture height to mining thickness is 16, and the height of the developed water-bearing fracture zone in the roof is 144.3 m.

4. Discussion

4.1. Correlation between Microseismic Monitoring Data and the Development of Water-Conducting Fracture Zones

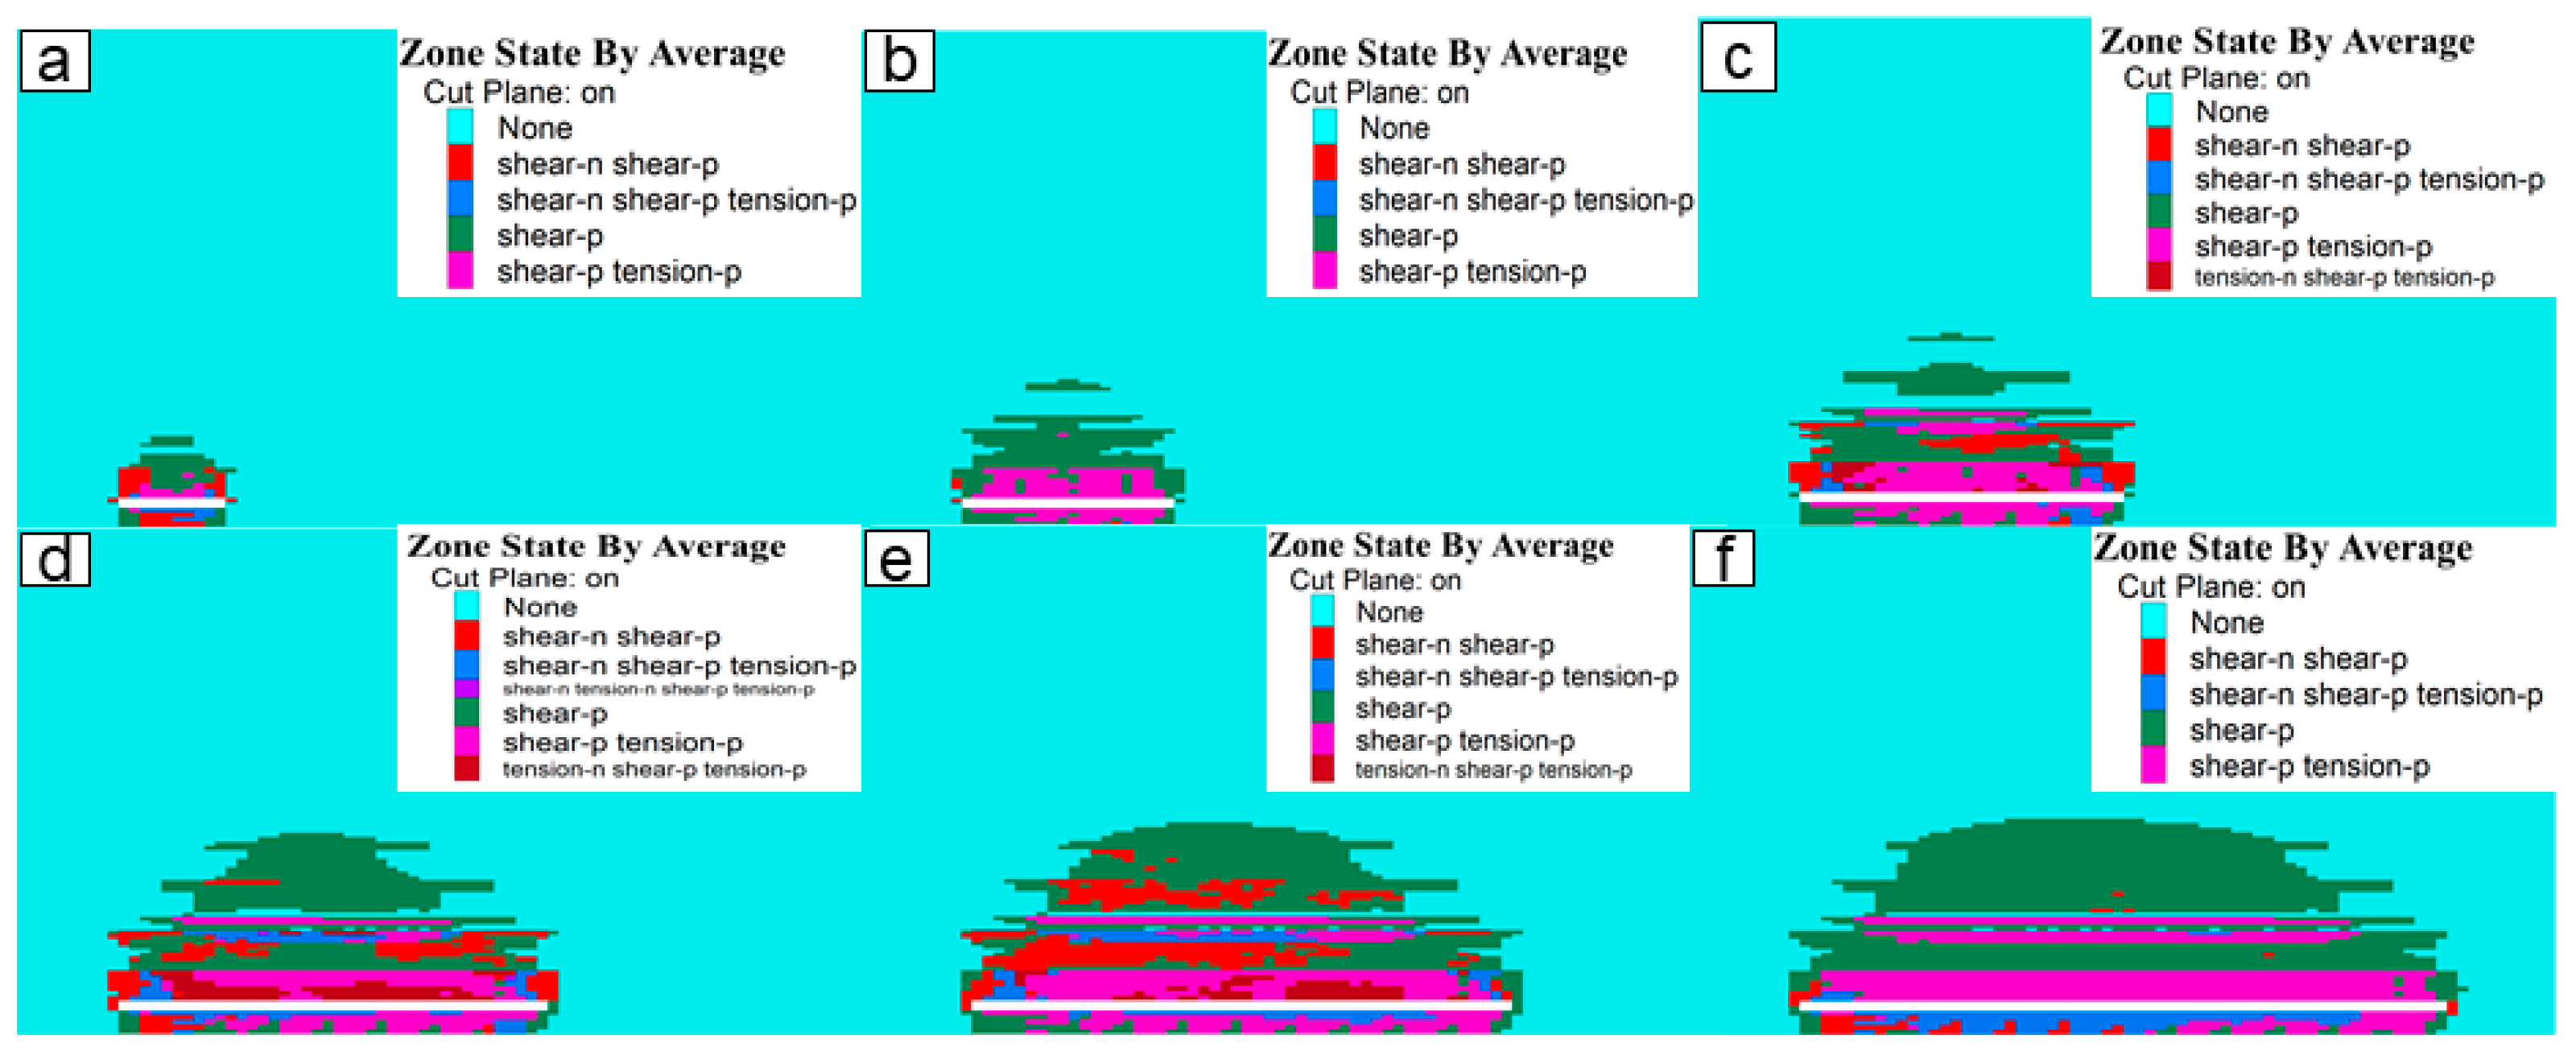
4.1.1. Numerical Simulation of the Height of Water-Conducting Fracture Zones

The numerical simulation method was employed to investigate the overlying strata’s failure and the formation process of water-conducting fracture zones in the 208 working face of the Tinan mine. Geological structure data were the primary basis, referencing mine geological and hydrogeological conditions to construct the numerical model. The working face orientation was the X-axis, with a length of 800 m, while the strike direction was the Y-axis, with a length of 400 m. The gravity direction was the Z-axis. On both sides of the strike and dip directions, 100 m of coal pillars were left, and the working face was excavated for a total length of 600 m. The simulation utilized the Mohr–Coulomb constitutive model. Based on the measured physical and mechanical parameters of rocks obtained from drilling in the Tinan coal mine and considering the average thickness of the strata, the values of the rock’s physical and mechanical parameters in the simulated strata were determined. The simulated excavation thickness of the working face was 9 m, with a step length of 50 m, and 3000 steps were calculated for each excavation cycle to analyze the failure of the plastic zone in the overlying strata (Figure 7).
Under certain conditions, the height of plastic failure in the roof strata can indicate the development height of the water-bearing fracture zone. The variation in the development height of the water-bearing fracture zone during different mining stages can be observed from the numerical simulation results. The simulation indicates that the development height of the water-bearing fracture zone reaches 145 m, with a deviation of 0.7 m from the actual development height. The overall trend can be characterized by a pattern of “slow increase—tendency to stabilize—rapid increase—tendency to stabilize”.

4.1.2. Correlation Analysis of Spatial Domain Destruction

Figure 8 depicts the relationship between the curve showing the overburden damage height detected through microseismic monitoring during the mining process along the strike direction (the outer contour line of microseismic events) and the predicted curve of the water-conducting fracture zone height obtained through numerical simulation. The figure illustrates that the overburden damage height penetrates the aquitard of the Anding Formation, reaching the base boundary of the Yijun Formation, but does not completely connect to the confined aquifer of the Yijun–Luohexia Formation. A comparison of the two curves reveals a consistent positive correlation along the strike direction. However, the maximum height detected by microseismic events (130 m) is less than the predicted height of water-conducting fracture zone development according to the numerical simulation (144.3 m), with a difference of 14.3 m. This disparity is primarily attributed to the complexity of geological conditions and the heterogeneity of coal rock bodies, resulting in errors in the monitoring results. Additionally, above the coal seam roof of the 208 working face, there is an 80 m thick aquitard composed of mudstone from the Anding Formation, with a thickness of 65.8 m. Due to its similarity with shale in composition and structure but with less fragility,, mudstone exhibits the characteristics of a small grain size and poor permeability, leading to microfracture events in the mudstone layer that may go undetected.
Based on past examples, microseismic monitoring data can reveal the development of fractures. This may occur due to a single high-energy microseismic event caused by mining disturbance, or it could result from multiple microseismic events leading to the extension of fracture tips and the formation of interconnected fractures. Therefore, employing microseismic monitoring methods for real-time, continuous, and spatially comprehensive monitoring of rock fracturing can allow for the inference of the developmental trend of water-conducting fracture zones. This serves as a predictive warning for changes in water inflow resulting from the formation of water-conducting channels in the working face roof.

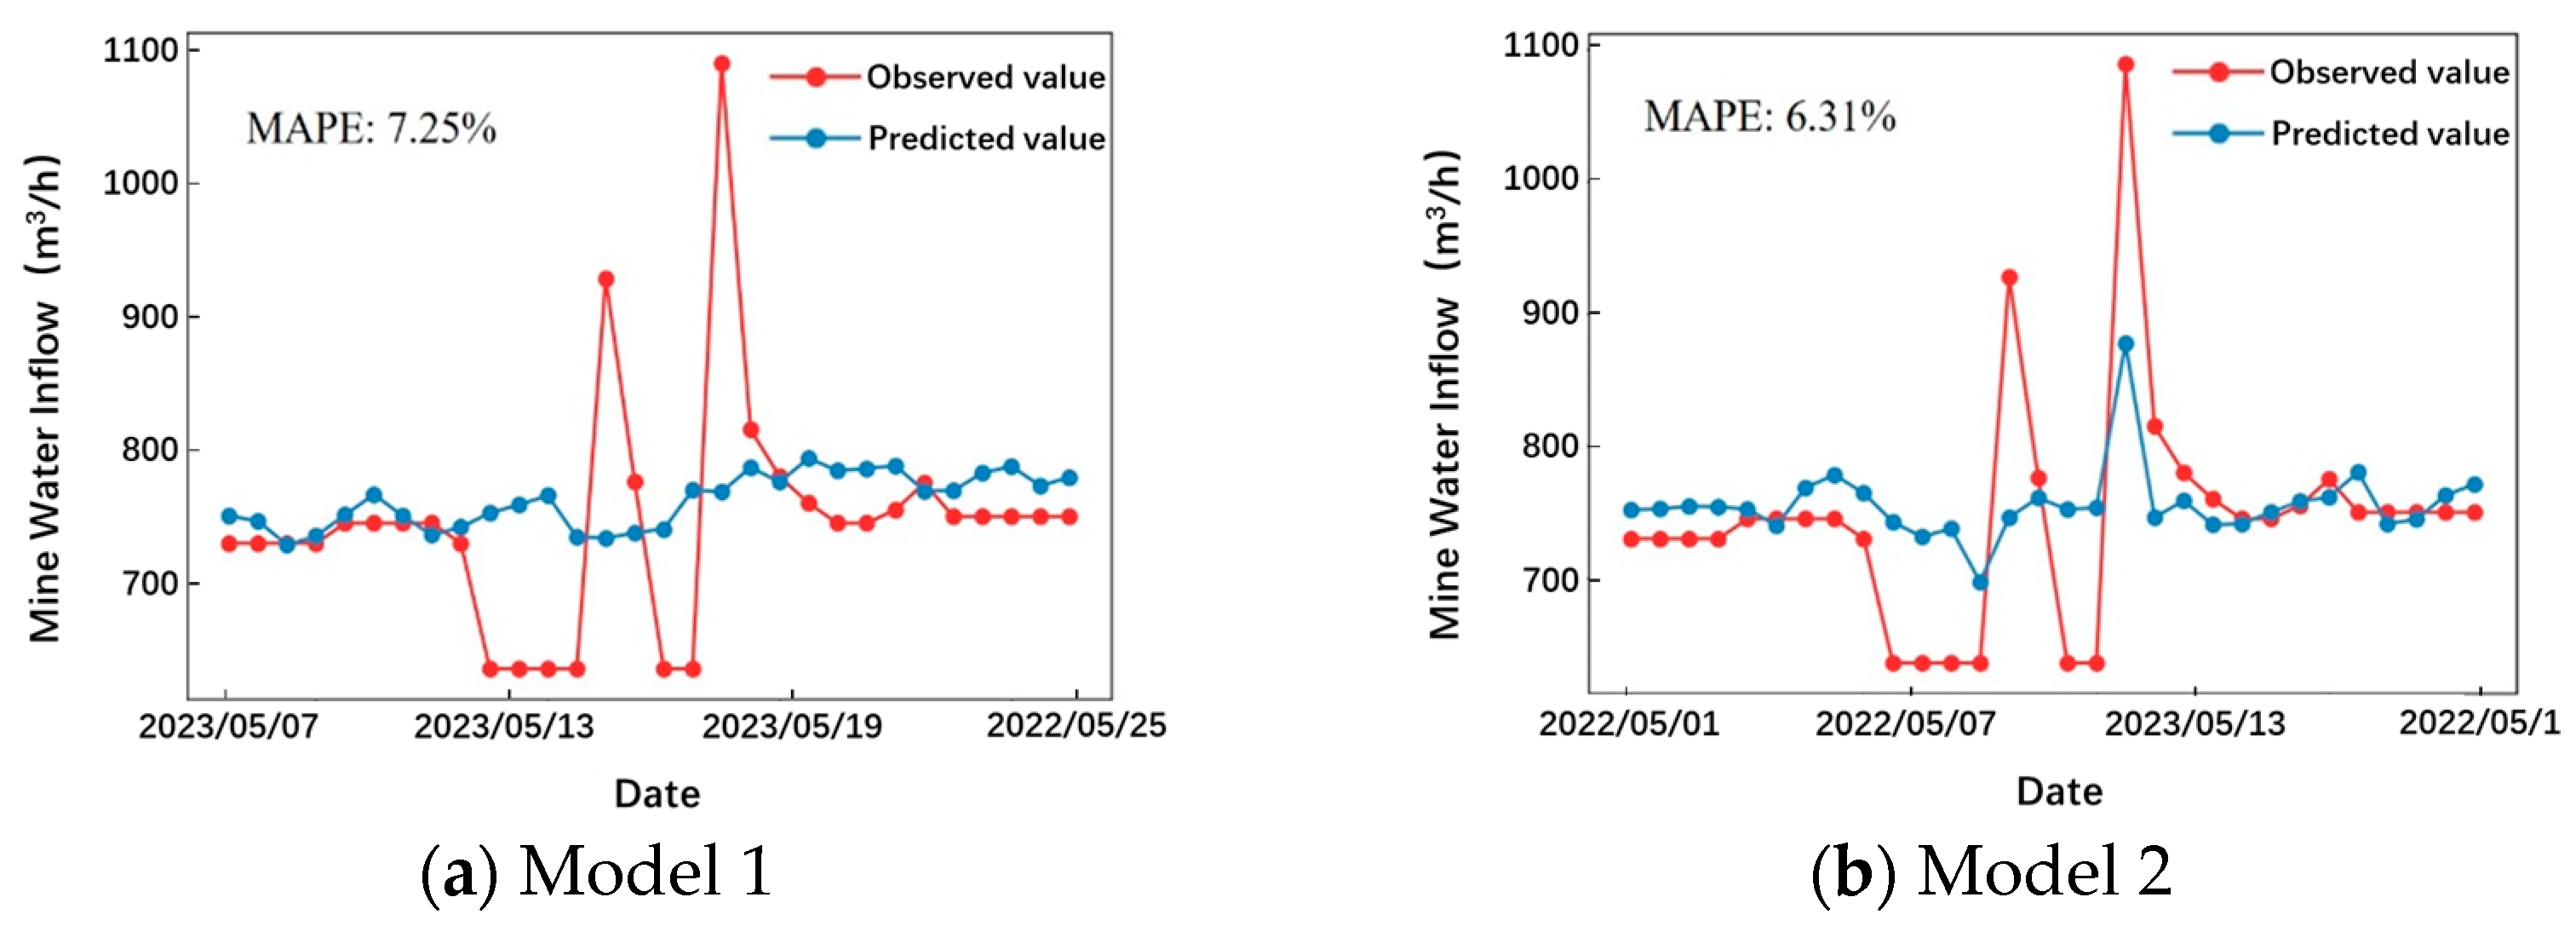
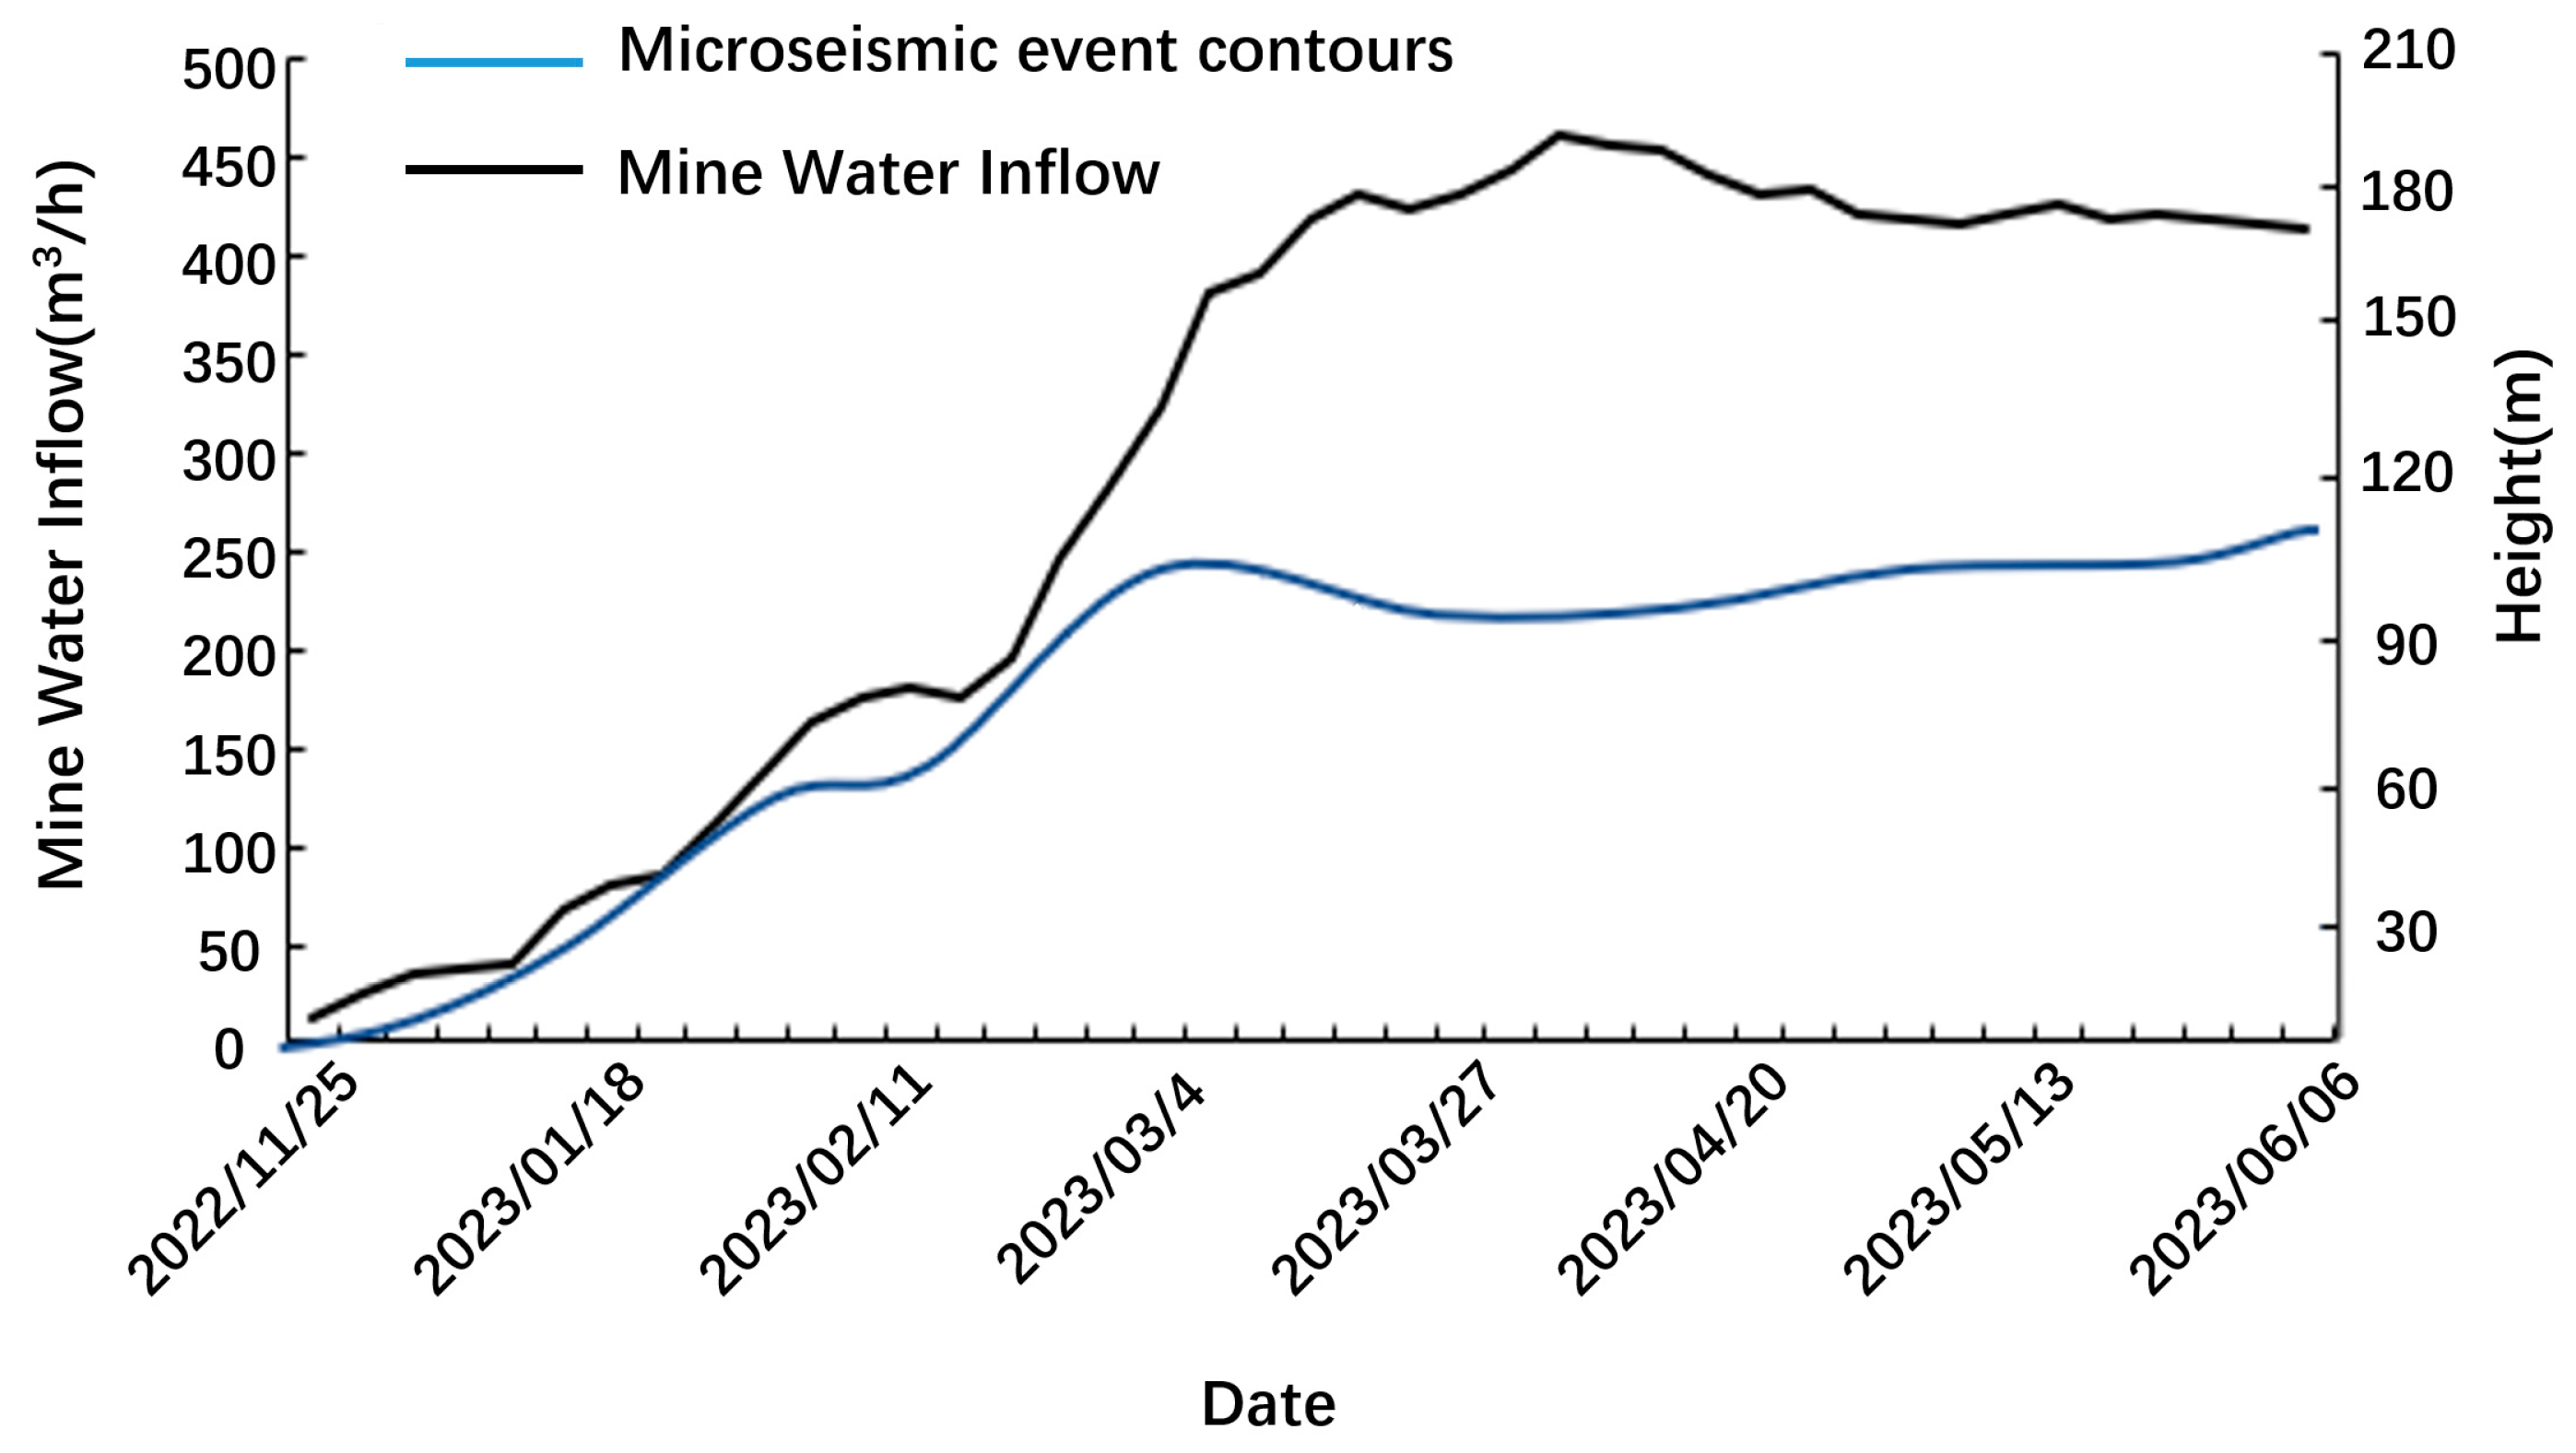
4.2. Correlation between Microseismic Monitoring Data and Water Inflow in the Working Face

As the mining of the working face progresses, the excavation area continuously expands, leading to an increase in the height of rock-fracturing movements. The sinking of the strata in the Luohexia Formation and the enlargement of the fracture range resulted in a gradual increase in water inflow in the 208 working face. Subsequently, an analysis was conducted on the correlation between the water inflow of the 208 working face during the mining process and the microseismic monitoring data.
After coal seam mining, as the working face advances, the water inflow of the 208 working face exhibits an overall increasing trend in three stages, with sudden increases observed at different time intervals (Figure 8). The analysis indicates that within a certain mining period, the overlying strata are affected by mining disturbances, resulting in microseismic events. This triggers the initiation of water-conducting fracture zones, with microseismic events occurring above the coal seam roof in the aquitard composed of mudstone from the Anding Formation. As these events accumulate and develop into water-conducting fracture zones, they penetrate the base boundary of the Yijun Formation, leading to an increase in sudden water influx. Therefore, the increase in water inflow occurs after the development of water-conducting fracture zones, representing a lagging phenomenon.
The Pearson correlation coefficient, commonly used in statistics to express the correlation between data, was employed in this study. SPSS Statistics 26 software was utilized to conduct correlation analyses comparing microseismic monitoring data (the position, total energy, maximum energy, number of events, and energy released per meter for each microseismic event) collected on the same day and the water inflow of the working face. The results are presented in Table 3.
According to the Pearson correlation coefficient, the correlation between the two datasets can be assessed. The strength of the correlation is determined based on the absolute value of the correlation coefficient (r), where values closer to 1 indicate a stronger correlation. Specifically, correlations are categorized as follows: extremely correlated (0.8–1.0), strongly correlated (0.6–0.8), moderately correlated (0.4–0.6), weakly correlated (0.2–0.4), and very weakly correlated or uncorrelated (0.0–0.2). Furthermore, the significance of the correlation is evaluated using the p-value. A p-value of less than 0.01 indicates an extremely significant correlation, values between 0.01 and 0.05 indicate a significant correlation, and values greater than or equal to 0.05 indicate no significant correlation.
Based on the specific calculation results, only the correlation between the number of microseismic events and water inflow is weakly significant. The correlation between the position, total energy, maximum energy, and energy released per meter for each microseismic event and water inflow is very weak and not significant. This aligns with the substantial error in estimating water-conducting fracture zone damage height reflected by microseismic events.
According to the analysis of this case, the peak point of microseismic event quantity often precedes the peak point of water inflow data, indicating a specific lag effect between the occurrence of water inflow events and microseismic events. Therefore, to determine the optimal lag time, sliding time series data were used based on the strength of the correlation. Through computation, the optimal lag time was determined to be 6 days (corresponding to an advancement distance of 24 m). Utilizing SPSS Statistics 26 software, correlation analyses were conducted between the microseismic monitoring data (position, total energy, maximum energy, number of events, and energy released per meter for each microseismic event) and the lagged water inflow data of the working face. The results are presented in Table 4.
Based on the calculation results in Table 3, the correlation relationship of the microseismic event quantity was changed to moderately significant (the r-value increased from 0.298 to 0.44). The correlation of the energy released per meter for microseismic events was significantly very weak. In contrast, the correlations of the microseismic event location and the maximum energy of microseismic events were extremely weak and insignificant. The total energy of microseismic events shows an extremely weak but significant correlation. Therefore, lagging the microseismic event data can effectively enhance the correlation with water inflow.

4.3. Research on Precursor Information of Water Inrush in the Working Face

Establishing a water inflow prediction model based on an error backpropagation algorithm for multilayer perceptron neural networks (MLP) can partially mitigate many uncertain factors associated with water inflow occurrences in working faces. MLP neural networks typically comprise input, output, and multiple hidden layers. There is no feedback between layers, and their basic structure is illustrated in Figure 9. MLP achieves deep learning through forward computation and backpropagation, and its input–output mathematical model can be represented as follows:
z i = R ( W i z i 1 + b i )
In the equation, z i represents the output of the i-th layer; W i   and   b i denote the weights and biases, respectively, between the i-th and i−1-th layers; and R represents the activation function, with the ReLU function being adopted in this paper.
A multilayer perceptron (MLP) neural network prediction model based on the error backpropagation algorithm was established to predict water inflow. Utilizing an MLP neural network for water inflow prediction can partially overcome many uncertainties associated with water influx in the working face. An MLP neural network generally consists of input layers, output layers, and several hidden layers. Based on the results in Table 3 and Table 4, two types of MLP neural network models were established.
For the first model, daily microseismic event quantity and daily advance footage of the working face were selected as input nodes for the MLP prediction model based on the correlation analysis results.
For the second model, the microseismic event quantity and energy released per meter for microseismic events, advanced footage of the working face six days in advance, and daily advance footage of the working face were chosen as input nodes for the MLP prediction model.
The daily water inflow serves as the output layer node. Data from the 208 working face from 16 August 2022 to 30 April 2023 were used as training set samples, while data from 1 May 2023 to 25 May 2023 were used as testing set samples to evaluate the accuracy of the model. The prediction results are shown in Figure 10.
The results shown in Figure 10 illustrate that the data-driven MLP models, due to their deep network structure, exhibit strong learning capabilities. In predicting water inflow, they can capture deep-level features, thereby predicting the overall trend of water inflow. Specifically, the average absolute percentage errors (MAPE) of both models are less than 10%, indicating a high degree of fitting and reliable prediction trends. Model 2 has smaller errors than model 1, indicating higher prediction accuracy. Moreover, compared to model 1, model 2 demonstrates superior performance in predicting the inflection points of water inflow, accurately predicting the timing of extreme values. This suggests that using lagged microseismic data for prediction can significantly improve the accuracy of water inflow prediction.
Based on the correlation analysis and water inflow prediction, it is apparent that the envelope curve drawn from the occurrence heights of microseismic events positively correlates with the development height of water-conducting fracture zones and the trend of water inflow in the working face. The occurrence of water inflow events and microseismic events exhibits a specific lag effect. Applying microseismic monitoring data allows for the qualitative and quantitative prediction of mine water inflow, with better prediction results achieved when using lagged microseismic event data. Therefore, abnormal microseismic data at the coal seam roof can be considered one of the precursor signals indicating potential water inflow occurrences.

4.4. Case Validation

Following the previous methodology in this study, the microseismic monitoring data of the coal seam roof in the 401 working face of the same mine were analyzed. It was predicted that concentrated roof layer damage would occur within a 30 m range above the coal seam, with a maximum height of 118 m, and the development height of water-conducting fracture zones would be located at the base boundary of the Yijun Formation. The trend of overburden damage height inferred from the microseismic monitoring data is essentially consistent with the trend of water inflow growth (Figure 11), supporting the data patterns observed for the 208 working face. Additionally, there is a certain lag effect between the trend of water inflow variation and the variation in microseismic data. Using the MLP neural network prediction model, the predicted water inflow value was 413 m3/h when the working face advanced to 600 m on 13 May 2023, while the actual water inflow was 422 m3/h, resulting in a relative error of 2.18%. This indicates a good prediction performance of the model.

5. Conclusions

a. By analyzing the microseismic monitoring data of the roof in the 208 working face and combining numerical simulations and on-site measurements of the development height of water-bearing fracture zones, we found that changes in microseismic monitoring data can, to some extent, reveal the development of fractures. The overall trend of overlying rock damage is characterized by “slow increase—tendency to stabilize–rapid increase—tendency to stabilize”.
b. Qualitative and quantitative analyses of the microseismic monitoring data and the water inflow volume at the 208 working face reveal a proportional relationship between the height of microseismic events and the trend of water inflow volume. The occurrence of water inrush events lags behind microseismic events. By analyzing the lag effect and applying MLP neural networks for mine water inflow prediction using suitable lagged microseismic data, we found that better accuracy in water inflow prediction can be achieved, with validation conducted on the 401 working face yielding satisfactory results.
c. In future research on water hazard warning, integrating real-time monitoring technologies such as underground water-level monitoring and stress monitoring is an important development direction. This integration allows for a more comprehensive assessment of the correlation between changes in underground water level, surface stress, and microseismic activity, thereby enhancing the capability of water hazard prediction in coal mines.

Author Contributions

Conceptualization, H.L. and Q.Z.; methodology, S.Y. (Shangxian Yin); software, H.L., T.Y. and H.Y.; validation, Q.Z., S.Y. (Songlin Yang) and J.K.; formal analysis, S.Y. (Shangxian Yin) and X.X.; investigation, Q.L.; resources, Y.H. and W.W.; data curation, Z.R. and B.X.; writing—original draft preparation, H.L., Q.Z. and S.Y. (Shangxian Yin); writing—review and editing, H.L., Q.Z. and S.Y. (Shangxian Yin). All authors have read and agreed to the published version of the manuscript.

Funding

This research study was funded by Efficient Drilling Rescue Technology And Equipment, grant number 2022YFC3005904-1.

Data Availability Statement

Data is contained within the article.

Conflicts of Interest

The authors declare no conflict of interest.

References

  1. Sun, W.; Li, W.; Ning, D.; Ren, L. Current states, prediction and prevention suggestions for water hazard accidents in China’s coal mines. Coal Geol. Explor. 2023, 51, 185–194. [Google Scholar]
  2. Zeng, Y.; Wu, Q.; Zhao, S.; Miao, Y.; Zhang, Y.; Mei, A.; Meng, S.; Liu, X. Characteristics, causes, and prevention measures of coal mine water hazard accidents in China. Coal Sci. Technol. 2023, 51, 1–14. [Google Scholar]
  3. Shi, X.; Jiang, F.; Zhu, S.; Yang, G. Mechanism of Integrated Dynamic Disaster of Rockburst and Water Inrush: A New Type of Integrated Dynamic Disaster in China. Geotech. Geol. Eng. 2017, 35, 1261–1270. [Google Scholar] [CrossRef]
  4. Brown, L.; Hudyma, M. Identification of Stress Change Within a Rock Mass Through Apparent Stress of Local Seismic Events. Rock Mech. Rock Eng. 2016, 50, 81–88. [Google Scholar] [CrossRef]
  5. Basu, S.; Ali, M.Y.; Farid, A.; Berteussen, K.A.; Mercado, G. A microseismic experiment in Abu Dhabi, United Arab Emirates: Implications for carbonate reservoir monitoring. Arab. J. Geosci. 2013, 7, 3815–3827. [Google Scholar] [CrossRef]
  6. Li, X.; Li, Z.; Wang, E.; Feng, J.; Chen, L.; Li, N.; Zou, Q. Microseismic Signal Spectra, Energy Characteristics, and Fractal Features Prior to Rock Burst: A Case Study from the Qianqiu Coal Mine, China. J. Earthq. Eng. 2016, 21, 891–911. [Google Scholar] [CrossRef]
  7. Guo, W.; Zhao, C. Focal Mechanisms and Stress Field Characteristics of Microearthquakes in Baihetan Reservoir in the Downstream Area of Jinsha River. Water 2023, 15, 709. [Google Scholar] [CrossRef]
  8. Yan, T.; Zhu, C.; Li, Q.; Xu, Q. Investigating Disaster Mechanisms Triggered by Abrupt Overburden Fracture Alterations in Close-Seam Mining Beneath an Exceptionally Thick Sandstone Aquifer. Sustainability 2023, 15, 13845. [Google Scholar] [CrossRef]
  9. Ma, K.; Yuan, F.; Wang, H.; Zhang, Z.; Sun, X.; Peng, Y.; Wang, H. Fracture mechanism of roof key strata in Dongjiahe coal mine using microseismic moment tensor. Geomat. Nat. Hazards Risk 2021, 12, 1467–1487. [Google Scholar] [CrossRef]
  10. Liu, C.; Li, S.; Cheng, C.; Cheng, X. Identification methods for anomalous stress region in coal roadways based on microseismic information and numerical simulation. Int. J. Min. Sci. Technol. 2017, 27, 525–530. [Google Scholar] [CrossRef]
  11. Zhang, P.; Yang, T.; Yu, Q.; Xu, T.; Shi, W.; Li, S. Study of a Seepage Channel Formation Using the Combination of Microseismic Monitoring Technique and Numerical Method in Zhangmatun Iron Mine. Rock Mech. Rock Eng. 2016, 49, 3699–3708. [Google Scholar] [CrossRef]
  12. Zhao, Y.; Yang, T.; Zhang, P.; Xu, H.; Wang, S. Inversion of seepage channels based on mining-induced microseismic data. Int. J. Rock Mech. Min. Sci. 2020, 126, 104180. [Google Scholar] [CrossRef]
  13. Sun, Y.; Zuo, J.; Li, Y.; Liu, C.; Li, Y.; Shi, Y. Micro-seismic monitoring on fractured zone and water inrush mechanism analysis of deep mining above aquifer in Xingdong coalmine. Rock Soil Mech. 2017, 38, 2335–2342. [Google Scholar]
  14. Cheng, S.; Li, S.-C.; Li, L.-P.; Shi, S.-S.; Zhou, Z.-Q.; Wang, J. Study on energy band characteristic of microseismic signals in water inrush channel. J. Geophys. Eng. 2018, 15, 1826–1834. [Google Scholar] [CrossRef]
  15. Zhao, Y.; Yang, T.; Zhang, P.; Xu, H.; Zhou, J.; Yu, Q. Method for Generating a Discrete Fracture Network from Microseismic Data and its Application in Analyzing the Permeability of Rock Masses: A Case Study. Rock Mech. Rock Eng. 2019, 52, 3133–3155. [Google Scholar] [CrossRef]
  16. Zhao, Y.; Yang, T.; Bohnhoff, M.; Zhang, P.; Yu, Q.; Zhou, J.; Liu, F. Study of the Rock Mass Failure Process and Mechanisms During the Transformation from Open-Pit to Underground Mining Based on Microseismic Monitoring. Rock Mech. Rock Eng. 2018, 51, 1473–1493. [Google Scholar] [CrossRef]
  17. Zhao, Y.; Yang, T.; Zhang, P.; Zhou, J.; Yu, Q.; Deng, W. The analysis of rock damage process based on the microseismic monitoring and numerical simulations. Tunn. Undergr. Space Technol. 2017, 69, 1–17. [Google Scholar] [CrossRef]
  18. Li, Y.; Lei, G.; Xu, S.; Wu, D. The spatial-temporal evolution law of microseismic activities in the failure process of deep rock masses. J. Appl. Geophys. 2018, 154, 1–10. [Google Scholar] [CrossRef]
  19. Ma, K.; Sun, X.; Tang, C.; Yuan, F.; Wang, S.; Chen, T. Floor water inrush analysis based on mechanical failure characters and microseismic monitoring. Tunn. Undergr. Space Technol. 2021, 108, 103698. [Google Scholar] [CrossRef]
  20. Cha, H.; Zhang, H.; Lian, H.; Qian, J.; Wei, T.; Tang, Z.; Mei, H.; Cheng, T. Microseismic monitoring on limestone water inrush at coal seam floor for groupA coal layer of Pan’er Coal Mine. J. China Coal Soc. 2022, 47, 3001–3014. [Google Scholar]
  21. Jiang, Z.; Li, Q.; Hu, Q.; Chen, J.; Li, X.; Wang, X.; Xu, Y. Underground microseismic monitoring of a hydraulic fracturing operation for CBM reservoirs in a coal mine. Energy Sci. Eng. 2019, 7, 986–999. [Google Scholar] [CrossRef]
  22. Dai, F.; Li, B.; Xu, N.; Zhu, Y. Microseismic early warning of surrounding rock mass deformation in the underground powerhouse of the Houziyan hydropower station, China. Tunn. Undergr. Space Technol. 2017, 62, 64–74. [Google Scholar] [CrossRef]
  23. Picozzi, M.; Oth, A.; Parolai, S.; Bindi, D.; De Landro, G.; Amoroso, O. Accurate estimation of seismic source parameters of induced seismicity by a combined approach of generalized inversion and genetic algorithm: Application to The Geysers geothermal area, California. J. Geophys. Res. Solid Earth 2017, 122, 3916–3933. [Google Scholar] [CrossRef]
  24. Yin, H.; Wu, Q.; Yin, S.; Dong, S.; Dai, Z.; Soltanian, M.R. Predicting mine water inrush accidents based on water level anomalies of borehole groups using long short-term memory and isolation forest. J. Hydrol. 2023, 616, 128813. [Google Scholar] [CrossRef]
  25. Yang, S.; Lian, H.; Xu, B.; Thanh, H.V.; Chen, W.; Yin, H.; Dai, Z. Application of robust deep learning models to predict mine water inflow: Implication for groundwater environment management. Sci. Total Environ. 2023, 857, 162056. [Google Scholar] [CrossRef] [PubMed]
  26. Duan, J. Integrated monitoring technology of water inrush from coal seam floor and its application. Coal Geol. Explor. 2017, 122, 3916–3933. [Google Scholar]
  27. Jin, D.; Zhao, C.; Duan, J.; Qiao, W.; Lu, J.; Li, P.; Zhou, Z.; Li, D. Research on 3D monitoring and intelligent early warning system for water hazard of coal seam floor. J. China Coal Soc. 2020, 45, 2256–2264. [Google Scholar]
  28. Zeng, Y.; Zhu, H.; Wu, Q.; Guo, X.; Pang, Z.; Liu, S.; Yang, W. Research status and prevention and control path of coal seam roof water disaster in China. J. China Coal Soc. 2024. [Google Scholar] [CrossRef]
  29. Zhou, J.; Wei, J.; Yang, T.; Zhu, W.; Li, L.; Zhang, P. Damage analysis of rock mass coupling joints, water and microseismicity. Tunn. Undergr. Space Technol. 2018, 71, 366–381. [Google Scholar] [CrossRef]
  30. Zeng, Y.; Mei, A.; Wu, Q.; Hua, Z.; Zhao, Y.; Du, X.; Wang, L.; Lv, D.; Pan, X. Source discrimination of mine water inflow or inrush using hydrochemicalfield and hydrodynamic field tracer simulation coupling. J. China Coal Soc. 2022, 47, 4482–4494. [Google Scholar]
Figure 1. The situation of the Tinan coal mine.
Water 16 01168 g001
Figure 2. The geological section of the 208 working face in the Tinan coal mine.
Water 16 01168 g002
Figure 3. The working face microseismic monitoring network.
Water 16 01168 g003
Figure 4. The statistics of partial microseismic events in the 208 working face. (a) The statistics of microseismic events in the 208 working face. (b) The distribution of microseismic events at different heights above the coal seam.
Water 16 01168 g004
Figure 5. A vertical projection of high-energy microseismic events in the advancement process of the working face.
Water 16 01168 g005
Figure 6. The distribution trend of microseismic events on the coal seam roof.
Water 16 01168 g006
Figure 7. Plastic deformation zone diagram during model excavation. (a) 100 m state (b) 200 m state (c) 300 m state (d) 400 m state (e) 500 m state (f) 600 m state.
Water 16 01168 g007
Figure 8. The relationship between microseismic data and water inflow in the 208 working face.
Water 16 01168 g008
Figure 9. Basic structure of MLP neural network model.
Water 16 01168 g009
Figure 10. Prediction diagram of mine water inflow based on MLP neural network.
Water 16 01168 g010
Figure 11. The 401 working face water inflow and microseismic data.
Water 16 01168 g011
Table 1. The parameters of the microseismic monitoring system for water inrush from the bottom plate of the working face.
DeviceTechnical IndexParameter
Microseismic sensorNumber of transmission channels≥12 channels, scalable
Installation methodRoof bolt
Geophone sensitivity100 V/m/s
Geophone bandwidth60–1500 Hz
Signal transmission formCurrent signal transmission
Sampling frequencyMaximum 10 KHz
Minimum seismic energy for source localization101 J
Microseismic monitoring substationNoise floor<0.2 μV RMS@2 ms
Maximum sample rate20 KHz
Table 2. The statistics of the on-site investigation after mining at borehole TC2.
Borehole Depth (m)EventsNotes
51.04Pre-drilling preparation
99.74Leakage of flushing fluid beganNo drilling and mud return was observed at the borehole mouth; there are no data available for fluid consumption observation
108.21Drilling halted; borehole inspection
158.36Drill bit drop of 17 cm
222.57Drilling halted; borehole inspection
Notes: TC2, X: 3885059.4, Y: 36491523.3, and H: +757.9 m.a.s.l. The coal seam is buried at a depth of 720.2 m, with a mining thickness of 9.0 m, and the casing diameter is Φ245 mm.
Table 3. Pearson correlation coefficient between microseismic monitoring data and water inflow data.
Statistical ValueCorrelation Coefficient (r-Value)Significance (p-Value)
Microseismic event localization.−0.0050.887
Total energy of microseismic events.−0.0210.124
Maximum energy of microseismic events.−0.0710.209
Several microseismic events.0.2980.000
Energy release per meter of microseismic events.0.0350.899
Table 4. Pearson correlation coefficient of lag microseismic monitoring data and water inflow data.
Statistical ValueCorrelation Coefficient (r-Value)Significance (p-Value)
Microseismic event localization.0.0390.510
Total energy of microseismic events.0.0870.009
Maximum energy of microseismic events.0.1080.310
Several microseismic events.0.4400.000
Energy release per meter of microseismic event.0.1350.002
Disclaimer/Publisher’s Note: The statements, opinions and data contained in all publications are solely those of the individual author(s) and contributor(s) and not of MDPI and/or the editor(s). MDPI and/or the editor(s) disclaim responsibility for any injury to people or property resulting from any ideas, methods, instructions or products referred to in the content.

