Article

Multilevel Drought Hazard Assessment under Climate Change Scenarios in Semi-Arid Regions—A Case Study of the Karkheh River Basin in Iran

1
Eawag, Swiss Federal Institute of Aquatic Science and Technology, 8600 Duebendorf, Switzerland
2
ETH Zürich, Department of Environmental Systems Science, Universitätstr. 16, 8092 Zürich, Switzerland
3
Agriculture Faculty, Department of Water University, Ferdowsi University of Mashhad, Mashhad 9177948974 AzadiSq, Khorasan Razavi, Iran
4
Department of Environmental Sciences, University of Basel, 4003 Basel, Switzerland
*
Author to whom correspondence should be addressed.
Water 2017, 9(4), 241; https://doi.org/10.3390/w9040241
Submission received: 17 February 2017 / Revised: 20 March 2017 / Accepted: 24 March 2017 / Published: 30 March 2017

Abstract

:
Studies using Drought Hazard Indices (DHIs) have been performed at various scales, but few studies associated DHIs of different drought types with climate change scenarios. To highlight the regional differences in droughts at meteorological, hydrological, and agricultural levels, we utilized historic and future DHIs derived from the Standardized Precipitation Index (SPI), Standardized Runoff Index (SRI), and Standardized Soil Water Index (SSWI), respectively. To calculate SPI, SRI, and SSWI, we used a calibrated Soil and Water Assessment Tool (SWAT) for the Karkheh River Basin (KRB) in Iran. Five bias-corrected Global Circulation Models (GCMs) under two Intergovernmental Panel on Climate Change (IPCC) scenarios projected future climate. For each drought type, we aggregated drought severity and occurrence probability rate of each index into a unique DHI. Five historic droughts were identified with different characteristics in each type. Future projections indicated a higher probability of severe and extreme drought intensities for all three types. The duration and frequency of droughts were predicted to decrease in precipitation-based SPI. However, due to the impact of rising temperature, the duration and frequency of SRI and SSWI were predicted to intensify. The DHI maps of KRB illustrated the highest agricultural drought exposures. Our analyses provide a comprehensive way to monitor multilevel droughts complementing the existing approaches.

1. Introduction

Drought is a natural hazard with adverse impacts on water resources, agriculture, and the environment [1,2,3]. In the literature, it is defined as a recurring prolonged dry period, which affects different components of the hydrological process [4]. Drought is a complex phenomenon that is difficult to quantify. This is because its characterization relies on different components of the water cycle; drought impacts evolve over time, so it is time-dependent. Climate change is likely to shift the patterns of drought and exacerbate the frequency and intensity of drought events in the foreseeable future. Therefore, a more comprehensive insight to drought should simultaneously take into account: (1) different components of the hydrological cycle and their interactions; (2) drought features in spatial and temporal domains using aggregation methods; and (3) future changes of components under projected climate change scenarios. Existing literatures mostly look at only one or two of the abovementioned aspects. Despite its significance for effective regional drought management, considering all perspectives together using a standardized procedure has not been well documented so far.
Depending on the scope, drought has been classified into meteorological, agricultural, hydrological, and socioeconomic categories [5,6]. The first three types of droughts reflect the physical characteristics of a drought phenomenon (namely physical drought). Socioeconomic drought is concerned with the water shortfall whose impact ripples through socioeconomic systems [7]. Although all types of droughts originate from a deficiency of precipitation [5], hydrological drought is usually out of phase with or lags behind the occurrence of a meteorological drought [8]. This is mainly because it takes some time before precipitation shortfall emerges in different subsurface components of the hydrological system, such as soil moisture, groundwater, and streams [8].
In order to alleviate the expected impacts of droughts, decision makers need to monitor drought using timely and reliable indices on both spatial and temporal scales. A common measurement tool used for this purpose is drought indices, which are believed to be more functional than raw precipitation or runoff variables for evaluating spatial and temporal characteristics of drought [9]. The Standardized Precipitation Index (SPI) [10] is broadly applied to monitor meteorological droughts [11,12,13]. Meteorological drought indices have been evaluated together with hydrological and agricultural indices to gain a broader understanding of drought propagation through the hydrological cycle (here called multilevel drought assessment). Hisdal et al. [14] assessed meteorological and hydrological droughts in Denmark on a regional scale and found that hydrological drought is less frequent, more persistent, and less homogeneous compared to meteorological droughts. Liu et al. [15] characterized drought propagation in groundwater systems using a standardized groundwater level index and SPI, showing that groundwater drought lasts longer with higher intensity. Tallaksen et al. [16] explored drought propagation in hydrology by looking at precipitation, groundwater recharge, hydraulic head, and river discharge in a groundwater-fed catchment in UK. Tadesse et al. [17], Vidal et al. [1], Tokarczyk et al. [18], and Duan et al. [19] found that drought impacts can be seen differently in each type, and more importantly, in the different affected regions. As such, their findings explain the reason for developing a comprehensive drought monitoring model for different types of droughts to give decision-makers detailed information on drought characteristics.
Drought has been inevitably interwoven with climate change impacts. Central to this concern is whether drought will become more frequent, severe, and widespread in the coming decades or not [20,21,22]. Water resource management to mitigate drought risks relies on understanding future characteristics such as the degree of severity, probability of occurrence, frequency, and duration of expected droughts [23,24,25]. Many researchers have projected occurrences of droughts under future climate scenarios by using Global Circulation Models (GCMs) [2]. Lee et al. [26] analyzed climate change impacts on different characteristics of drought in the Seoul region using four GCMs and reported a decrease in mild drought frequency, but an increase in the frequency of severe and extreme droughts._ENREF_18 Leng et al. [27] assessed the climate change impact on biophysical droughts using daily climate projections under five GCMs with the RCP8.5 (Representative Concentration Pathways) scenario in China. Their findings confirmed that meteorological, agricultural, and hydrological droughts will variably occur on different temporal and spatial scales. Liu et al. [28] used SPI, Standardized Runoff Index (SRI), and Palmer Drought Severity Index (PDSI) to construct historical and future projection of drought patterns for the Blue River Basin in Oklahoma. Their results predicted more drought events in the future (2010–2099). They also recommended PDSI and SRI as the most functional indices for drought risk assessment.
Drought hazard is usually defined as an aggregation of the frequency, intensity, duration, and spatial extent of occurrences [29]. Despite the extensive research on multilevel drought identification using drought indices under historic and future conditions, fewer studies have focused on associating climate change scenarios with composite drought hazard indices of different drought types. This level of analysis has received even less attention in Iran’s river basins with semi-arid climate. To fulfill this research demand, we examine the historic and future drought hazard using an ensemble of climate scenarios in the Karkheh River Basin (KRB) of Iran.
KRB is one of the nine watersheds studied in the CGIAR (Consultative Group on International Agricultural Research) Challenge Program on Water and Food (CPWF) [30]. The basin is one of the most agriculturally important areas in Iran, which produces about 10% of the country’s wheat [31]. It is also an example of a dryland system with a wide spectrum of bio-physical and socio-economic conditions as well as complex agricultural problems. While the properties of drylands around the world can widely vary [32,33], lessons learned from the drought assessment of such a complex system can be useful in other catchments in terms of methodology and providing detailed insights on key elements required for assessing different aspects of drought. The standardized and holistic drought hazard assessment implemented in this study can be conducted in other basins to identify regions exposed to drought.
Most of the research studies conducted in KRB have concentrated on water resource allocation [31,34], variability assessment in one or two components of water cycle [35,36,37], historic meteorological and agricultural droughts [38], or future projection in one drought type [39]. None of these research studies have looked at drought hazard indices of three different types. There is also an apparent lack of implementation of hazard analyses considering historic and future perspectives. Such detailed analyses are an essential step toward evaluating drought vulnerability of agricultural and water resources sectors and help policymakers recognize threats to different sectors.
The current study was carried out in order to analyze characteristics and relationships among meteorological, agricultural, and hydrological droughts using Drought Hazard Index (DHI) derived from a Soil and Water Assessment Tool (SWAT) hydrologic model. In the sections that follow, we analyze drought characteristics such as severity, frequency, and duration using SPI, SRI, and Standardized Soil Water Index (SSWI) for historical (1980–2012) and near future (2020–2052) periods to identify drought hotspots in the region.

2. Materials and Methods
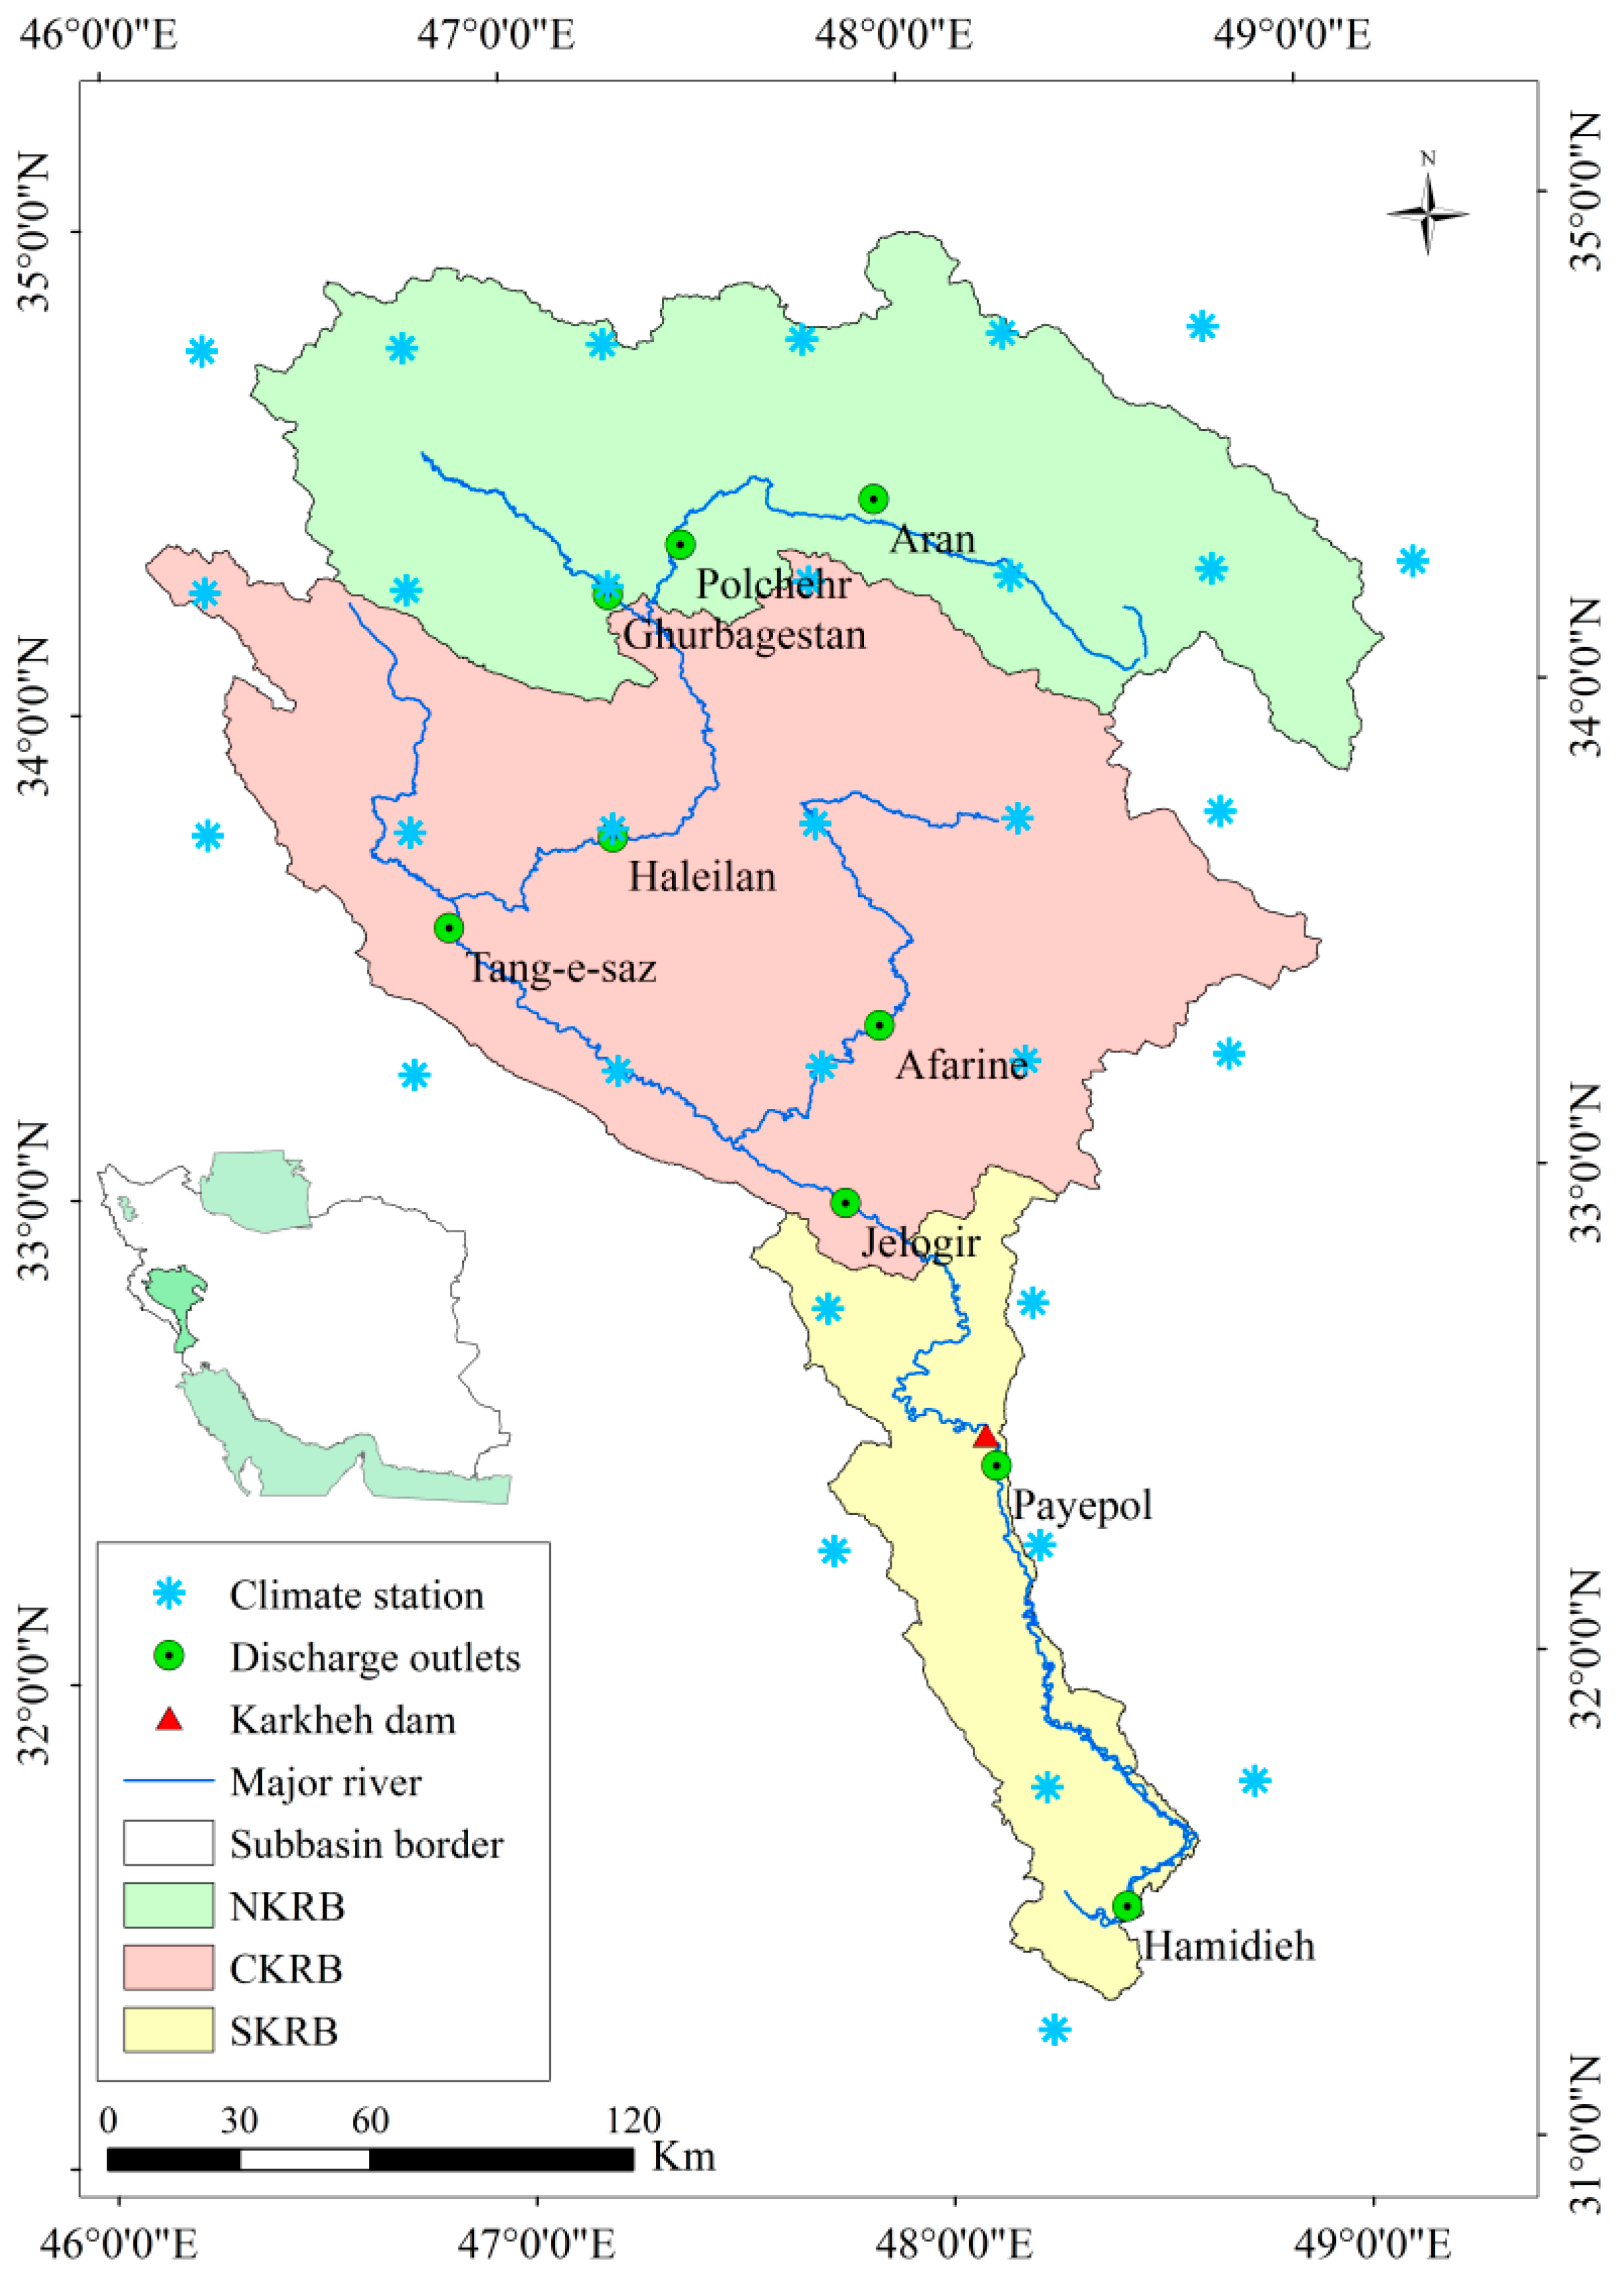
2.1. Study Area

KRB covers an area of 51,000 km2. It is the third largest basin in Iran and the food basket of the country [40]. The basin is divided into three catchments: Northern Karkheh (NKRB), Central Karkheh (CKRB), and Southern Karkheh (SKRB) (Figure 1). The climate of KRB is mainly semi-arid with annual precipitation ranging from 150 mm in SKRB to 750 mm in NKRB [40]. A number of dams were built or have been proposed for construction for irrigation and hydropower purposes [41]. The Karkheh dam located in the most downstream part of the basin, was constructed in 2002 to provide irrigation to the dry and lowland plains and is the largest reservoir in the basin (Figure 1) [41]. The Seymareh dam, the second most notably multipurpose dam, is under construction and is expected to be completed by 2025 [41].
KRB uses a rainfed production system in areas upstream of the Karkheh dam. The upper basin is dominated by pasture and scattered and sparse forest, which has been converted into rainfed and partially irrigated agriculture [41]. In recent years, groundwater has been excessively used for irrigation purposes. In contrast, SKRB is mostly under an irrigated production system (71% irrigated and 29% rainfed), but the amount of precipitation does not fulfill crop water requirements [30,41]. Wheat is the dominant crop, especially in rainfed condition. Other cultivated crops are chickpea, barley, and maize [30].

2.2. Agro-Hydrological Simulation and Model Calibration

SWAT [42] is a process-based, semi-distributed, continuous-time model, used to estimate water budget components in many studies. Hydrologic modeling in SWAT is based on a soil water balance equation. The primary components estimated in the model include surface water flow, evapotranspiration, soil infiltration, and percolation to shallow and deep aquifers. The model estimates surface water flow using the modified SCS-CN (Soil Conservation Service-Curve Number) method, which estimates the amount of infiltration and runoff from rainfall excess based on land use, hydrologic soil group, and antecedent moisture condition. According to the SCS-CN method, the total rainfall is divided into initial abstraction, continuous abstraction, and excess rainfall [43]. Daily precipitation, land use characteristics, and soil profile features are used as input for calculations. A detailed description of all hydrological processes in the model is provided by Neitsch et al. [44].
The Sequential Uncertainty Fitting Procedure (SUFI-2) is used for model calibration [45]. SUFI-2 quantifies prediction uncertainty using a 95% prediction uncertainty (95PPU) band calculated by expressing a range for parameters to map all sources of uncertainties. Two indices are used to measure the goodness-of-fit of the calibrated model: p-factor and r-factor [46]. The p-factor is the percentage of measured data bracketed by the 95PPU band. It varies between 0 and 1, where 1 indicates an ideal case, meaning that 100% of the measured data are inside the 95PPU band. The r-factor is the relative width of the uncertainty band divided by the standard deviation of the observed variable. More details are given by Abbaspour et al. [47]. The bR2 criterion (the weighted version of coefficient of determination R2) [46] and the Nash Sutcliffe (NS) [48] were used as objective functions to measure the degree of match between simulated and observed discharge values.

2.3. Model Set-Up and Data

For the study area, a digital elevation map (DEM) was obtained from NASA’s Shuttle Radar Topography Mission (SRTM) with a spatial resolution of 90 m [49]. A soil map, containing information such as maximum rooting depth of soil profile, soil porosity, and bulk density, was obtained from the global soil map of Food and Agricultural Organization (FAO). The database provided over 5000 soil types from which 17 were in our study area. Each soil type comprised two layers (0–30 and 30–100 cm) at the spatial resolution of 10 km and other soil variables calculated by Schuol et al. [50]. Daily climate data including precipitation and temperature at 31 stations (Figure 1) were obtained from WATCH (Water and Global Change) Forcing Data methodology applied to ERA-Interim (a re-analysis of meteorological observations produced by the European Centre for Medium-Range Weather Forecasts) data-Climate Research Unit (WFDEI-CRU) [51] at 0.5° × 0.5° resolution for 1980–2012. The land use map was created from the Indian Remote Sensing-Linear P6 (IRS-P6) satellite with Linear Imaging and Self Scanning (LISS-IV) sensor, IRS-P5 satellite with panchromatic cameras, Enhanced Thematic Mapper+2001 (ETM+2001) Landsat, and from 3300 field sampling points collected by IWPCO (Iran Water and Power Resources Development Company, Tehran, Iran) [52]. The monthly discharge values at nine observed discharge outlets (Figure 1) from IWPCO [53] were used for model calibration (1988–2012) and validation (1980–1987).
We obtained future daily climate data, including precipitation and minimum and maximum temperatures, from the Inter-Sectoral Impact Model Inter-comparison Project (ISI-MIP) for five GCMs based on Coupled Model Intercomparison Project (CMIP5) data [54] driven by RCP scenarios of the Intergovernmental Panel on Climate Change (IPCC) fifth assessment report [55] at a 0.5° × 0.5° spatial resolution. Details of the five GCMs (HADGEMES, GFDL, IPSL, MIROC, and NORESM) are summarized in Table 1.
The daily rainfall and temperature data from the five GCMs were bias corrected using the nearest local measured stations. For rainfall, we used a simple ratio method, in which for each month, we divided the average GCM data by the observed data and divided the daily GCM data by this factor to obtain future daily rainfall data. For the temperature, we tested linear and nonlinear models as described by Wilby et al. [56] and chose a fourth-degree regression model. In general, the results of the first-degree linear and fourth-degree nonlinear models were similar except for very small and very large temperature values, where the nonlinear model performed systematically better, as was also reported by Abbaspour et al. [47].
We used ArcSWAT 2012 with Esri’s ArcGIS version 10.2. A total of 333 subbasins and 1507 HRUs (Hydrologic Response Units) were created. The model was calibrated in five iterations with 480 simulations in each iteration. The time required for one single 33-year simulation was about 13 min. Considering 480 simulations in each iteration of calibration, we needed 100 h. In this paper, we used the parallel processing features of SWAT-CUP (a calibration/uncertainty or sensitivity program interface for SWAT) [57], where simulations were distributed over 24 CPUs, decreasing the required time to approximately 4.5 h. After calibration, model outputs including soil water, discharge, and precipitation at subbasin level were used as input variables for drought analysis.

2.4. Drought Analysis Methods

The commonly used SPI [10] was selected to monitor meteorological drought. It is computed by fitting a suitable probability distribution function (fx) to the frequency distribution of precipitation. We chose a 2-parameter gamma distribution as the probability density function [58,59]. The cumulative distribution function (Fx) is then the integral over fx as:
F x = 0 x f x ( x )   d x     x :   p r e c i p i t a t i o n
To obtain the SPI, we transformed Fx using an inverse normal transformation function with mean 0 and standard deviation 1. Six SPI classes were defined as: extreme wet, wet, mild, moderate, severe, and extreme drought [59] (Table 2).
SPI-X could be defined over different time scales (X = 1, 3, 6, 12, and 24-month). SPI-X at each month is obtained from total precipitation over the last X months. For example, SPI-3 at the end of February compares the December–January–February precipitation total in that particular year with the December–January–February precipitation totals of all other years. The SPI method can also be applied to soil moisture and discharge variables [10,60,61] as indicators of hydrological and agricultural droughts, respectively. In this study, we used the same method to calculate SRI based on discharge and SSWI based on soil water content.

2.5. Drought Hazard Index

To aggregate the severity and occurrence probability features of each index into one unique index for the entire study period, we calculated the Drought Hazard Index (DHI) using the methodology proposed by Shahid et al. [62] and later by Rajsekhar et al. [63]. In this method, each of the four drought classes is given a particular weight from 1 to 4, which represent mild (W1), moderate (W2), severe (W3), and extreme droughts (W4), respectively (Table 2). Furthermore, each class i receives a rate Ri from 1 to 3, based on its probability of occurrence obtained from the Jenks natural break method [64] (Table 2). The final DHI is aggregated as:
D H I = ( W 1 × R 1 ) + ( W 2 × R 2 ) + ( W 3 × R 3 ) + ( W 4 × R 4 )
As a result, three degrees of hazard intensity, namely low (DHI < 18), medium (21 < DHI < 18), and high (DHI > 21), are defined using Jenks natural break classification method.

3. Results

3.1. Performance of the KRB Hydrologic Model

The KRB hydrologic model provided reasonable accuracy after calibration. The p-factor for calibration (1988–2012) and validation (1980–1987) periods were larger than 0.55, indicating that more than 55% of the observed data were bracketed by the 95PPU band (Table 3). The r-factor values were mostly around 1 for all discharge stations, indicating reasonable prediction uncertainties in both calibration and validation periods. The average values of bR2 were 0.53 and 0.60 for calibration and validation periods, respectively. The NS efficiency values were larger than 0.5 in most discharge outlets, which are satisfactory results.

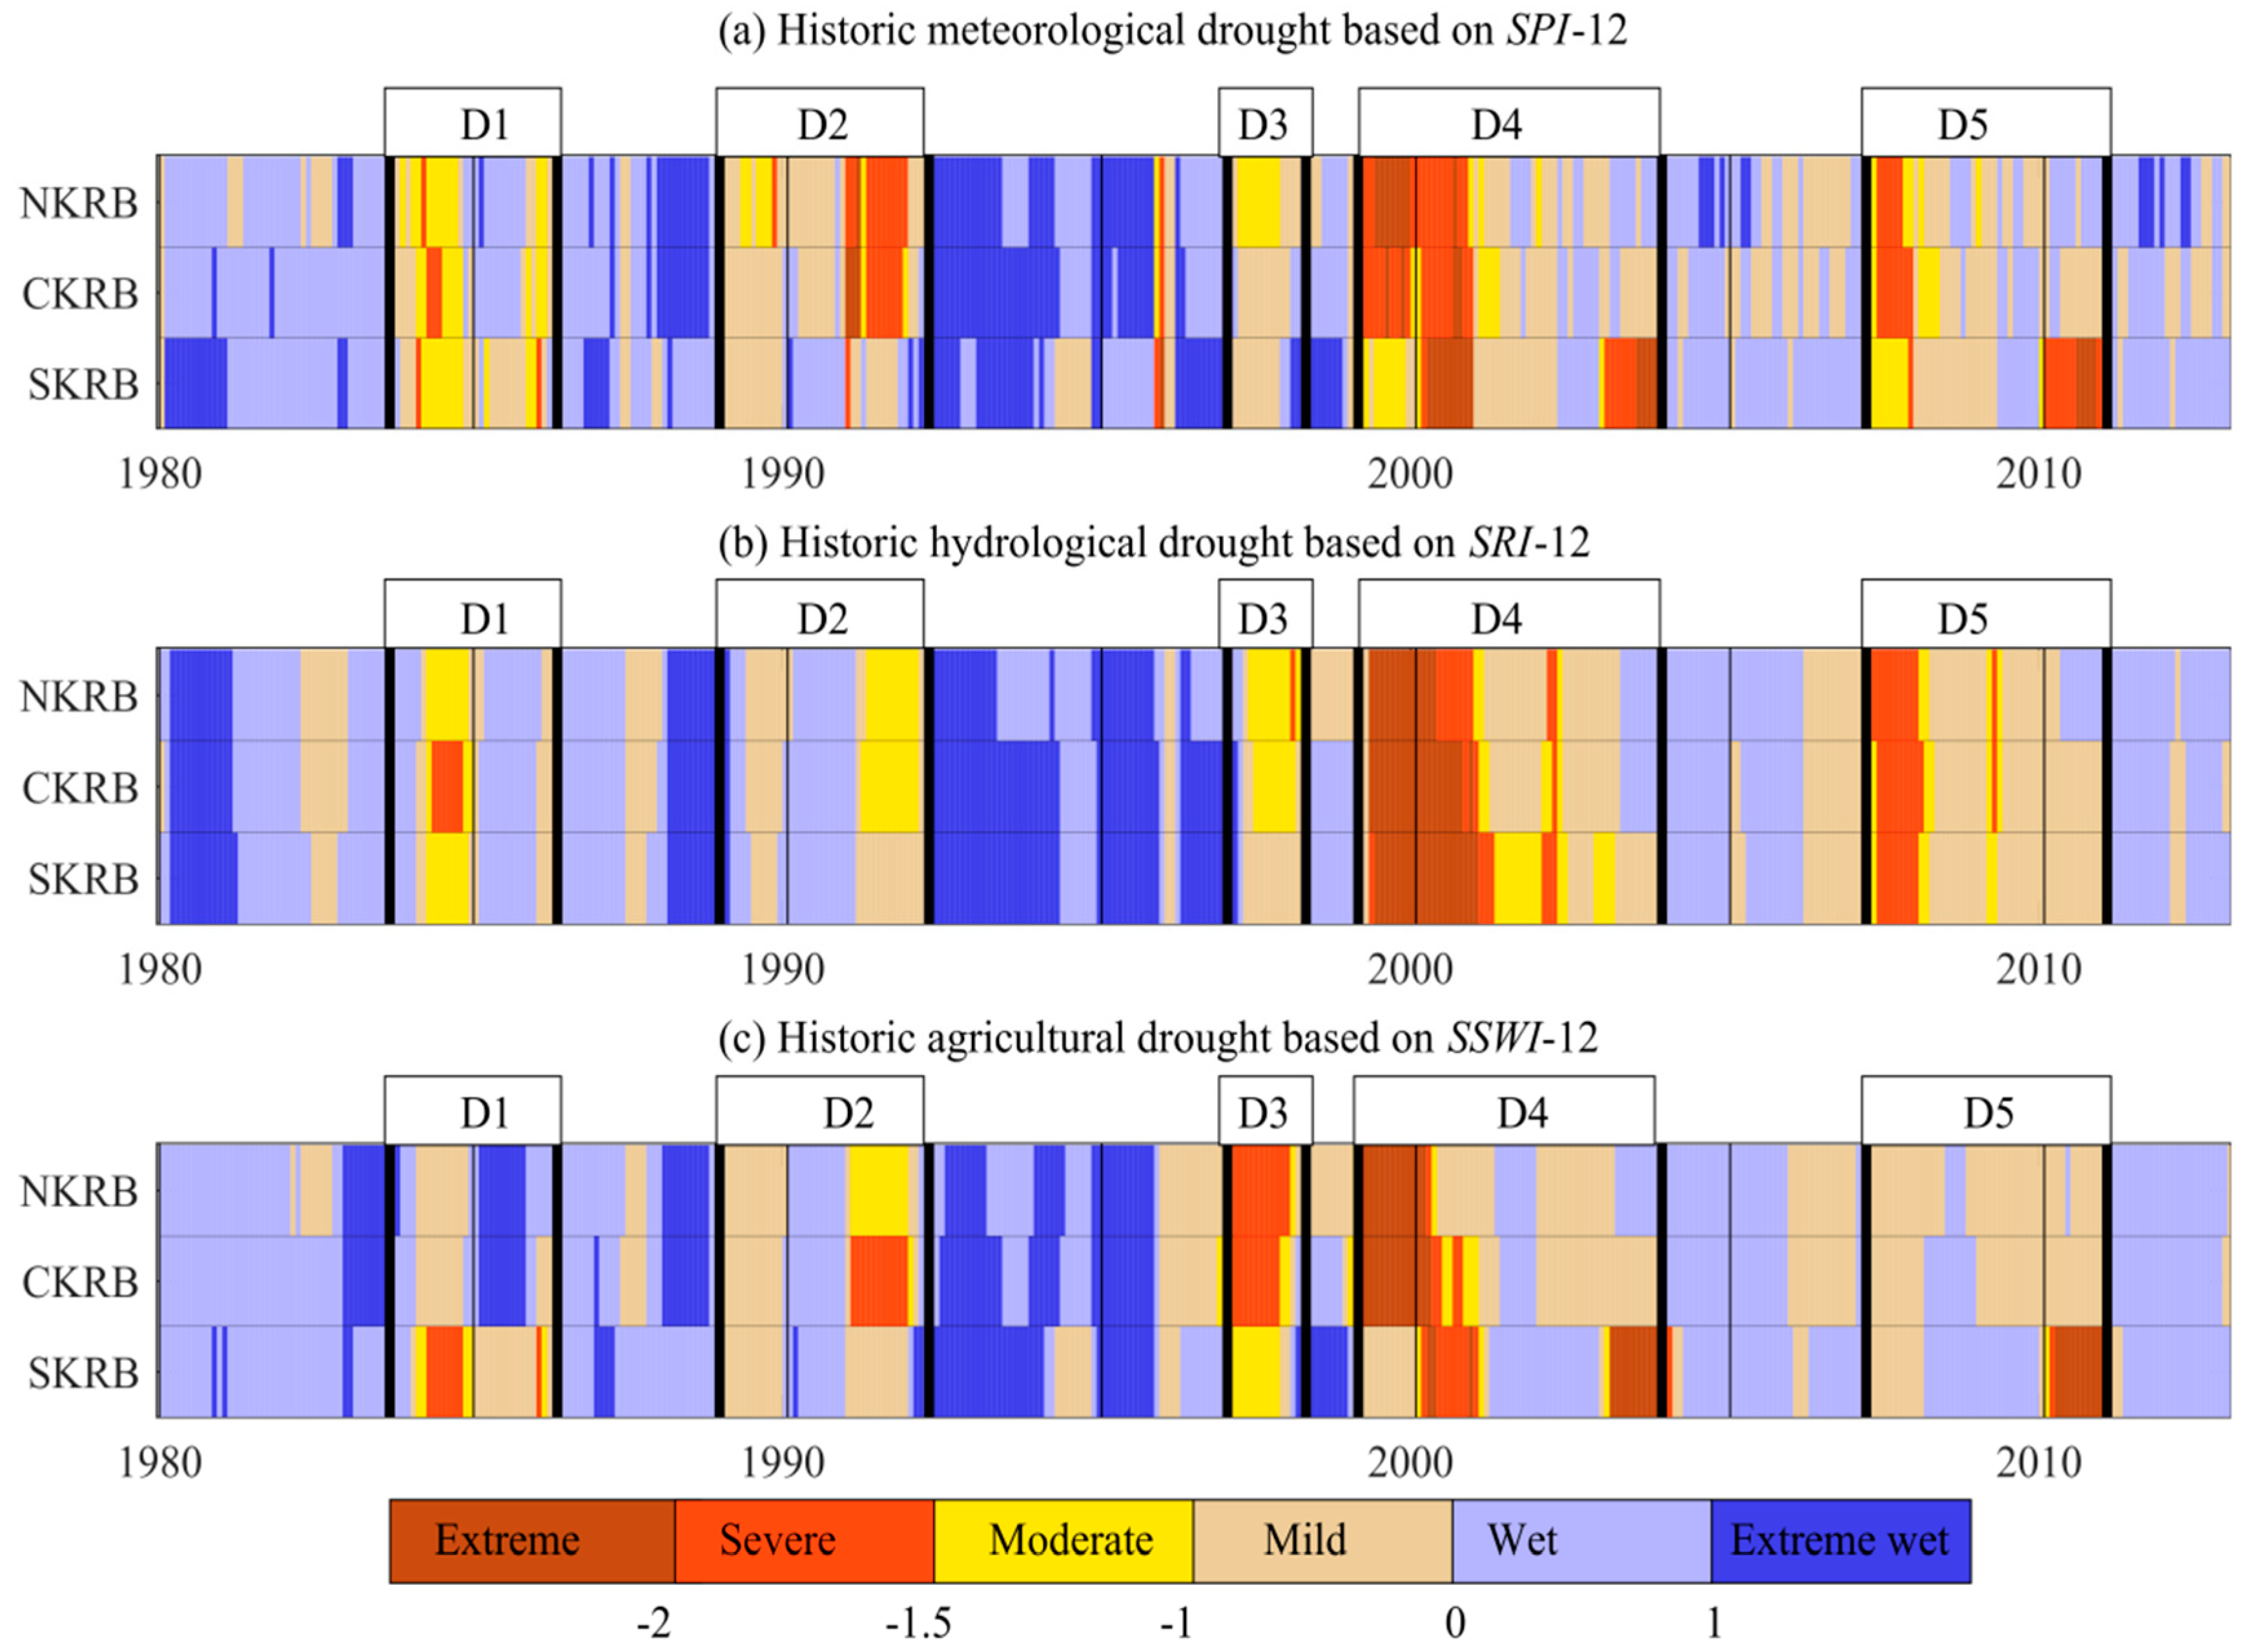
3.2. Temporal Propagation of Droughts in Historic Period

To calculate SPI, SRI, and SSWI, monthly values of precipitation, river discharge, and soil water (1980–2012) from 333 subbasins were aggregated into the NKRB, CKRB, and SKRB catchments levels (Figure 1) using weighted areal averages. The SPI evolution over 1, 3, 6, 9, 12, and 24-month time scales (Figure S1) showed higher drought frequency for shorter time scales. Moreover, less persistency was noticed at time scales shorter than six months. On the other hand, although in SPI-24, the severe drought period of 2000–2002 was identified, the extreme drought years of 1992 and 2008 were less obvious. This shows that 6, 9, 12-month time scales are more representative of drought periods. In this paper, SPI-12 was selected as the time scale of interest, as was also suggested by Lloyd-Hughes et al. [59], Gocic et al. [65], and Raziei et al. [66].
The historic time series of SPI-12, SRI-12, and SSWI-12 in the three catchments (Figure 2) show that the basin experienced most severe drought conditions after 1999 and most extreme wet conditions during 1993–1996. Overall, five drought events (D1–D5) with different meteorological, hydrological, and agricultural drought characteristics were identified between 1980 and 2012 (Figure 2a–c). In the meteorological sector (Figure 2a), the first drought event (D1) started in late 1983 with mostly moderate severity and lasted until late 1984. The event, however, persisted until early 1986 in SKRB. Meteorological drought D2 started in 1989 with mild severity in the three catchments and lasted until late 1991 with severe intensity in NKRB and CKRB. The subsequent event (meteorological D3) in 1997 had a short duration with mostly mild to moderate severity in all catchments. Meteorological event D4 started in mid-1999 with extreme severity. It lasted until 2001 in NKRB and CKRB and until 2004 in SKRB. The basin experienced another extreme event D5 from 2007 to 2010 with higher severity at the beginning and in SKRB at the end of the period.
Not all meteorological droughts had hydrological (Figure 2b) and agricultural (Figure 2c) signatures. Meteorological drought D1 registered as severe hydrological drought only in late 1984 in CKRB and as agricultural drought in late 1984 in SKRB. The D2 event had mostly a mild to moderate effect on hydrological drought, while producing severe agricultural drought in CKRB in 1991. D3 had almost the same pattern in hydrological sectors, whereas severe agricultural droughts were identified in 1997 in NKRB and CKRB. The major reason for higher severity of D3 in the agricultural sector is probably related to two months of extreme drought in early 1996, resulting in mild agricultural drought in 1996. From this time until the start of event D3, there was not enough time for soil moisture to replenish itself. In SKRB, the extreme wet conditions after 1996 accelerated replenishment of soil moisture and this caused a less severe agricultural drought during the D3 event. Meteorological drought D4 resulted in extreme hydrological and agricultural droughts. The meteorological event D5 resulted in a similar pattern for the hydrological sector, except for the extreme case in 2010, which showed up as an agricultural drought in SKRB.
Comparison of the correlation coefficient in droughts of different sectors in the six time scales (SPI-, SRI-1, 3, 6, 9, 12, 24, and SSWI-1, 3, 6, 9, 12, 24 months) and in the three catchments (Table 4) showed that the meteorological droughts are better correlated with hydrological and agricultural droughts of longer time periods. For example, SPI-1 is mostly correlated with SRI-3 (0.83 in NKRB, 0.79 in CKRB, and 0.60 in SKRB). SPI-3 and SPI-6 are mostly correlated with SRI-6 and SRI-9, respectively (highlighted box in Table 4). Similarly, SPI-3 shows the highest correlation with SSWI-9 (0.79 in NKRB, 0.78 in CKRB, and 0.76 in SKRB). This most likely suggests a 3-month lag of hydrological and agricultural responses to meteorological drought.

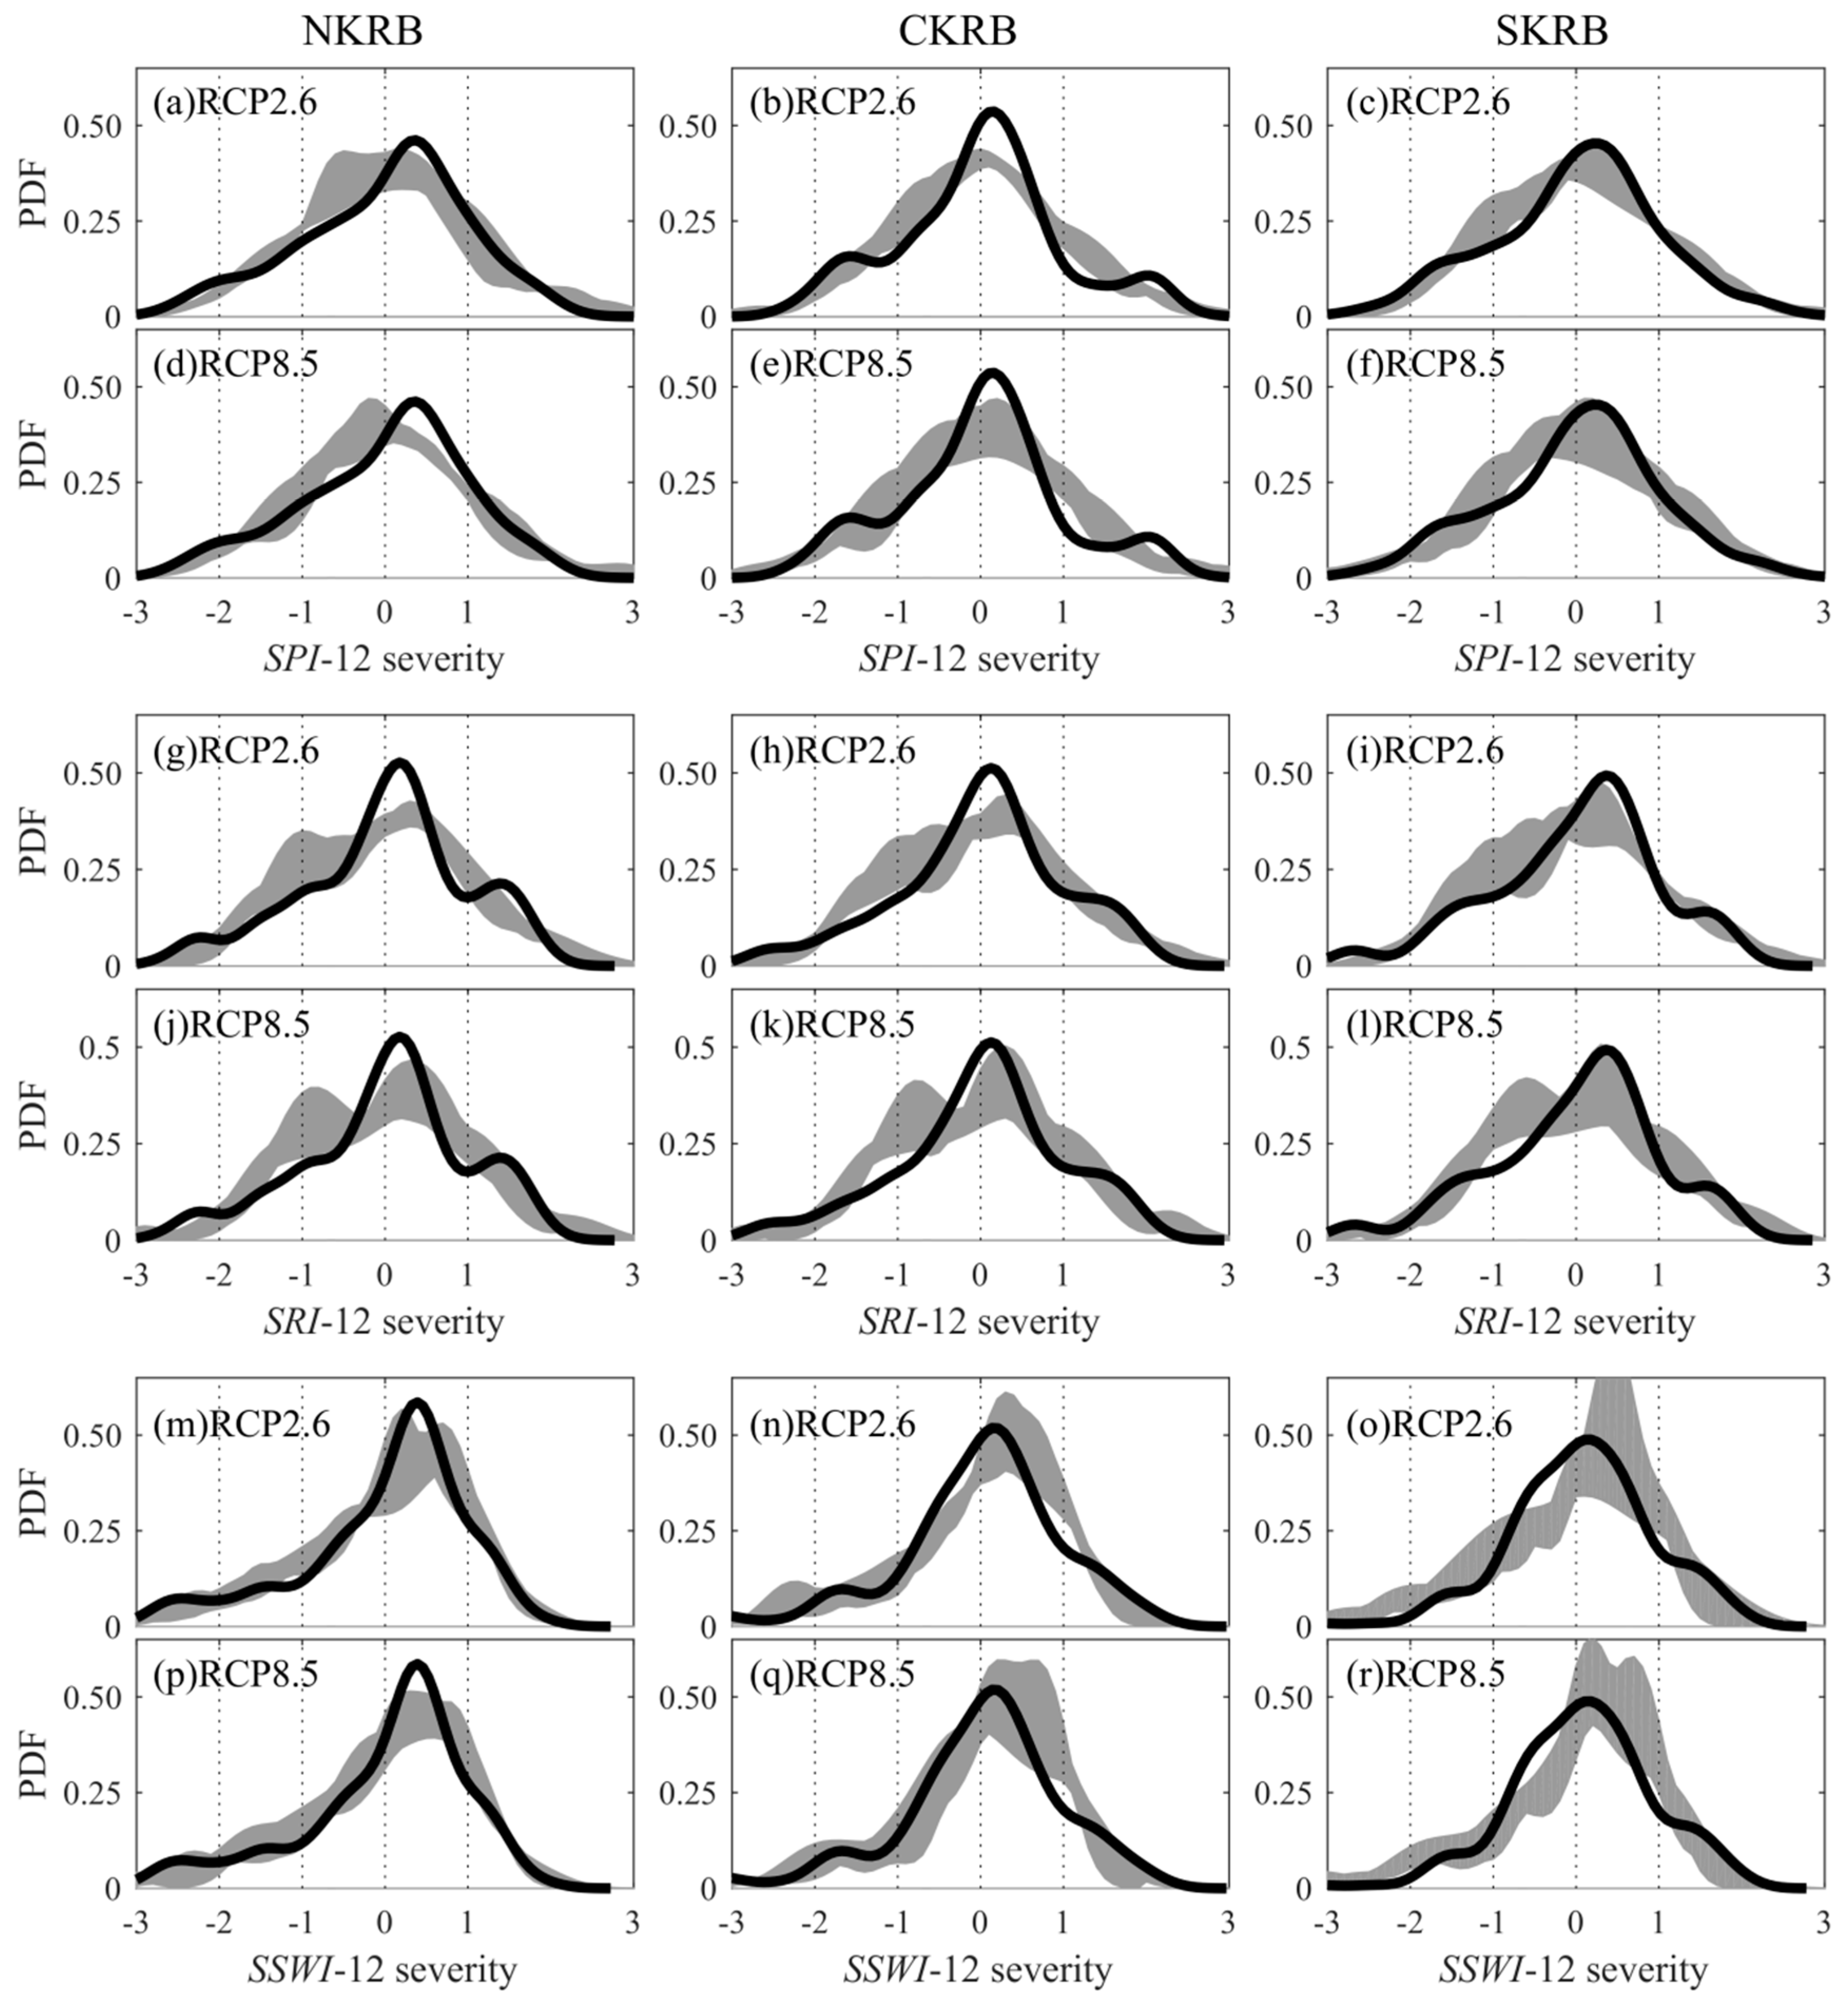
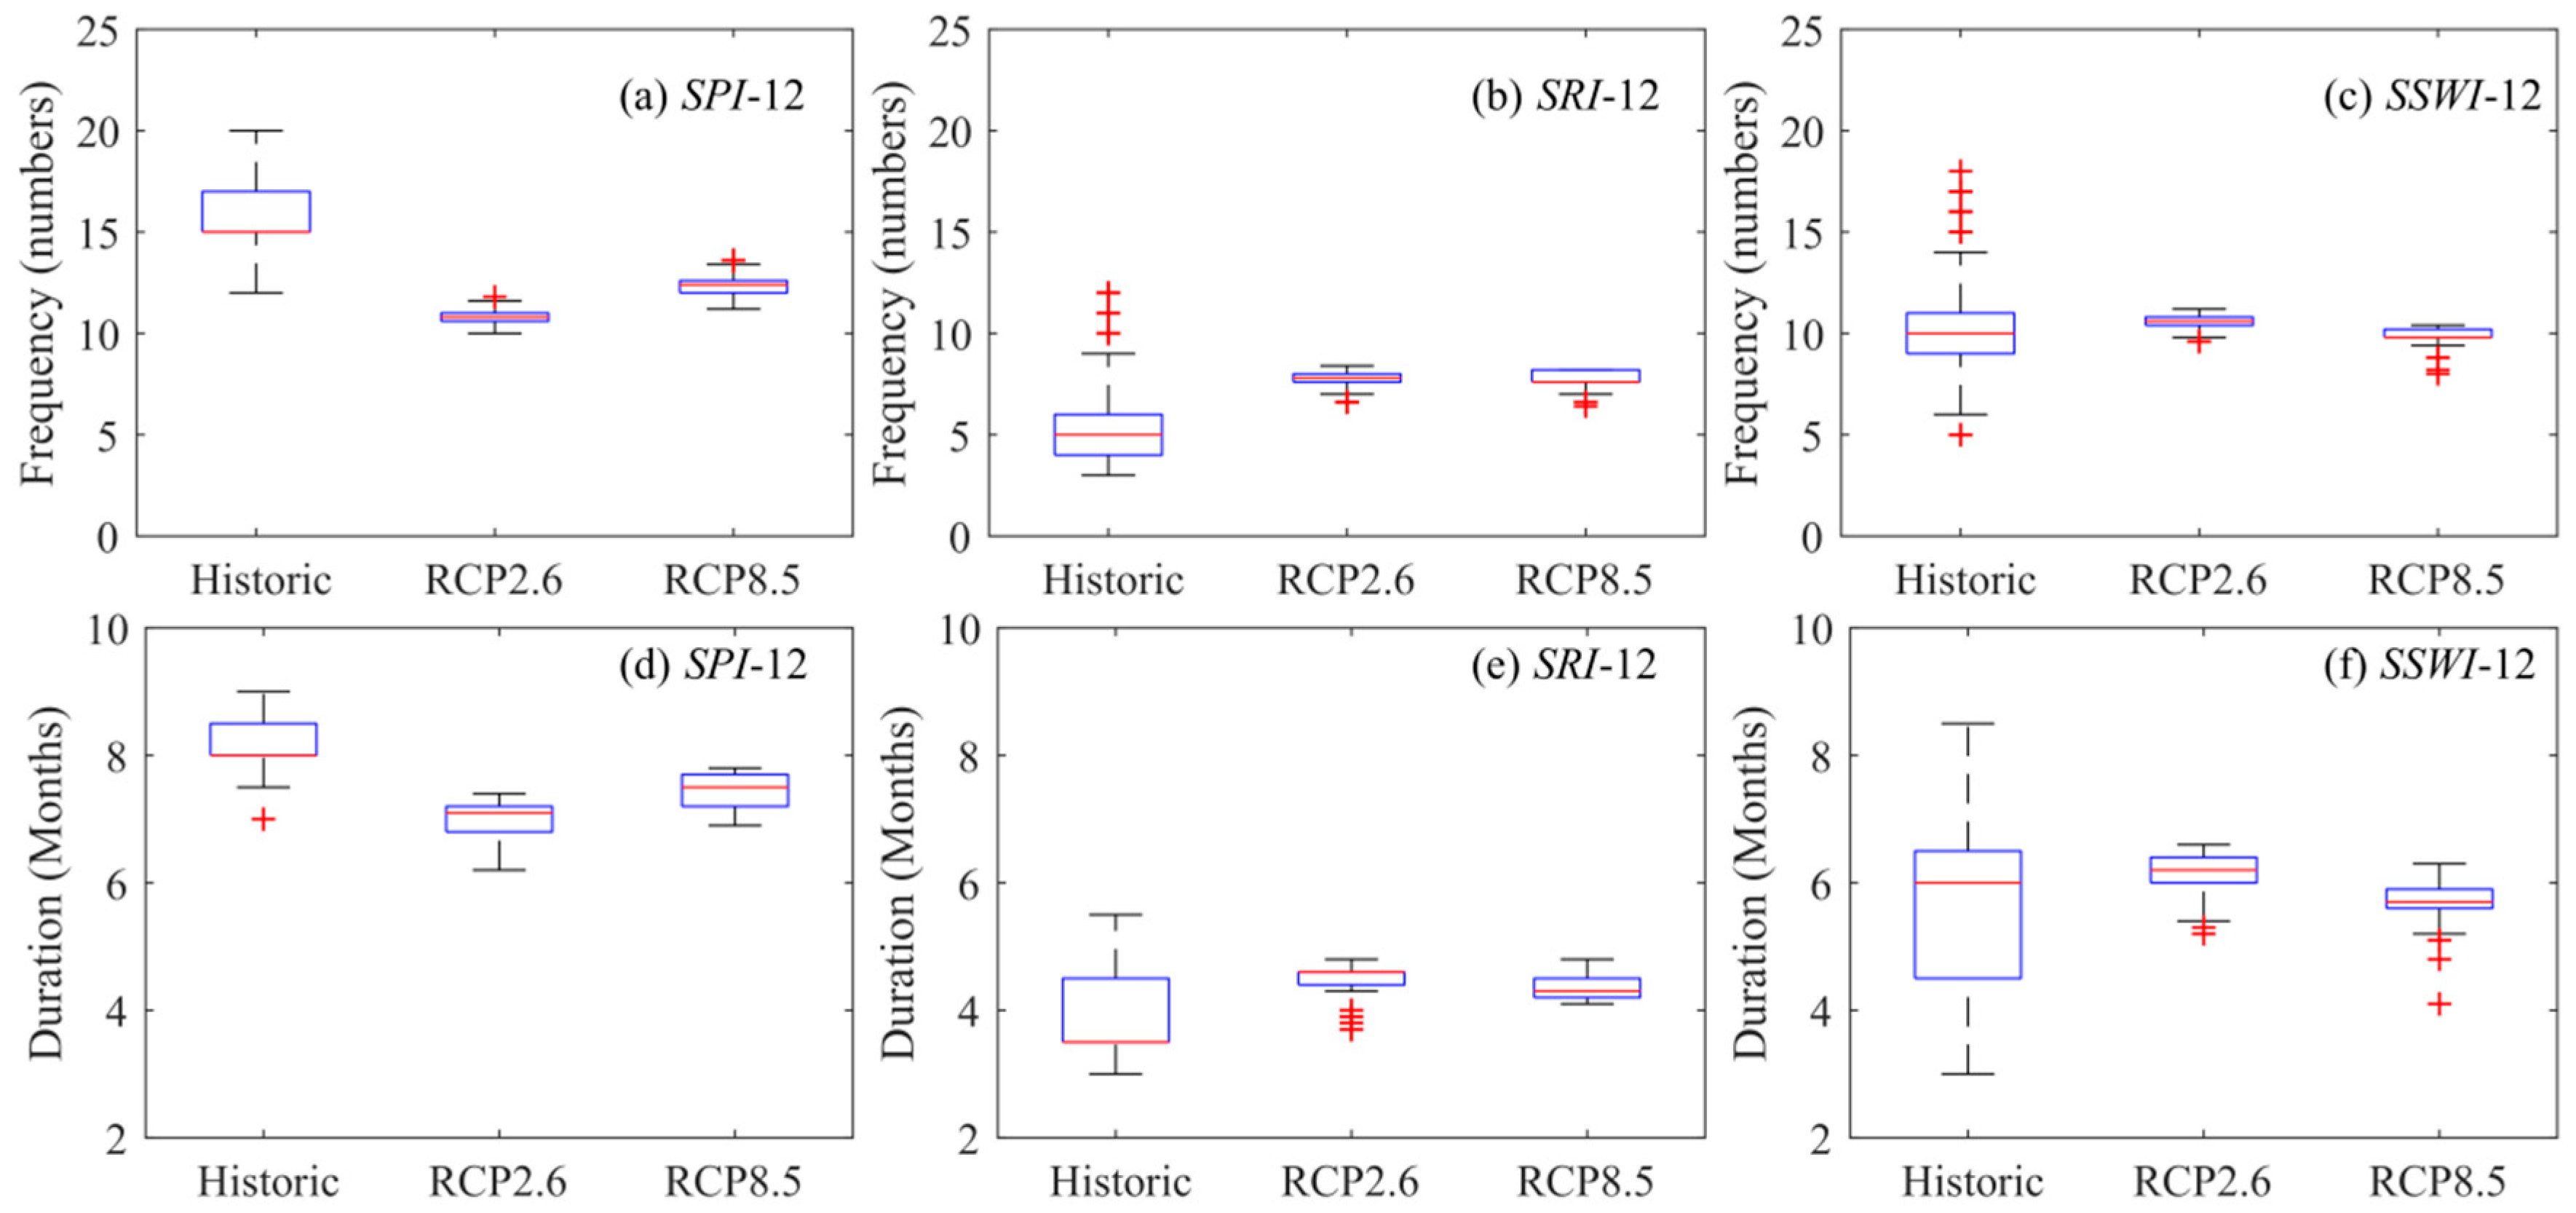
3.3. Future Characteristics of Droughts (Severity-Frequency-Duration)

The temporal variation of the three types of droughts under the RCP2.6 (Figure S2) and RCP8.5 (Figure S3) scenarios in five GCMs (2020–2052) shows that KRB will likely be more susceptible to droughts in the future. However, drought periods and their severities are different among GCM models and for different types of droughts. Overall, SPI-12 patterns (Figure S2a) show more severe meteorological droughts after 2045 under RCP2.6. In this scenario, severe hydrological (Figure S2b) droughts and extreme agricultural (Figure S2c) droughts are observed after 2035. In RCP8.5 (Figure S3), severe and extreme droughts for all three types also mostly appear in the same time period.
We compared historic and future droughts by using Probability Density Functions (PDFs) of SPI-12, SRI-12, and SSWI-12 for different severities (Figure 3a–r). The uncertainty bands stemming from the differences in the five GCMs are wider for mild and moderate meteorological and hydrological drought classes (SPI-12 and SRI-12 between −1.5 and 0) as compared with other classes, indicating lesser agreement between different GCMs. For agricultural drought, larger uncertainty is noticed for wet conditions (SSWI-12 between 0 and 1).
The resulting PDFs in the entire region, with the exception of agricultural drought in CKRB and SKRB, show a shift to left in the grey band, especially in the left leg of graphs for both RCP2.6 and RCP8.5, indicating higher probability of droughts (especially mild and moderate droughts) in the future. The left shift is slightly larger in RCP8.5 compared to RCP2.6 in all catchments. Agricultural drought in CKRB and NKRB, however, shows a tendency to shift to the right for most GCM models, indicating smaller probability of mild to moderate droughts. No significant change is observed in the probability of extreme meteorological droughts in the three catchments (the left tails of the distributions). The wider bands of SRI-12 compared to SPI-12 indicate larger uncertainties in the hydrological drought predictions by GCMs. The agricultural drought index (Figure 3m–r) shows a shift to the right, especially in the right tail of graphs for both the RCP2.6 and RCP8.5 scenarios, indicating higher probability of wet conditions. On the other hand, the agricultural sector is more exposed by extreme and severe droughts in CKRB and SKRB, as their probabilities are higher. The wide uncertainty band during wet conditions shows less agreement among the five GCMs.
To compare frequency and duration of historic droughts, we defined a drought event as having SPI-12, SRI-12, or SSWI-12 < 0 for at least two months. The historic frequency shows there were on the average 15 meteorological droughts, 5 hydrological droughts, and 10 agricultural droughts (Figure 4a–c). These droughts had durations of 8 months, 3.5 months, and 6 months, respectively (Figure 4d–f). During the historic period, meteorological droughts were more frequent with longer duration. The reason is that we considered periods of longer than two months as a drought event. So, some of the very short and mild meteorological events did not register signatures in other sectors (Figure 2). Besides, SRI-12 and SSWI-12 are influenced by precipitation as well as temperature, whereas SPI-12 depends only on precipitation.
Similarly, future projections show the highest frequency of meteorological drought. However, compared to the historic period, there are fewer differences between frequency and duration of the three drought types. Moreover, the duration and frequency of future hydrological and agricultural droughts are predicted to increase compared to historic period. It is interesting to note that future prediction of meteorological droughts is smaller in frequency and shorter in duration (Figure 4a,d) compared to historic meteorological drought. Drought frequency is expected to decrease from a median value of 15 to 10 and 12 in RCP2.6 and RCP8.5, respectively. This pattern is mostly caused by an unusually large number of droughts in the KRB during 2000 to 2010, which resulted in a high historic drought frequency. Hydrological droughts are, however, more frequent in the future with longer duration. There does not seem to be a large difference in the historic and future agricultural droughts. This is mainly due to the impact of both precipitation and temperature variables in the calculation of hydrologic and agricultural indices. Only slight differences between RCP2.6 and RCP8.5 are observed in all cases.

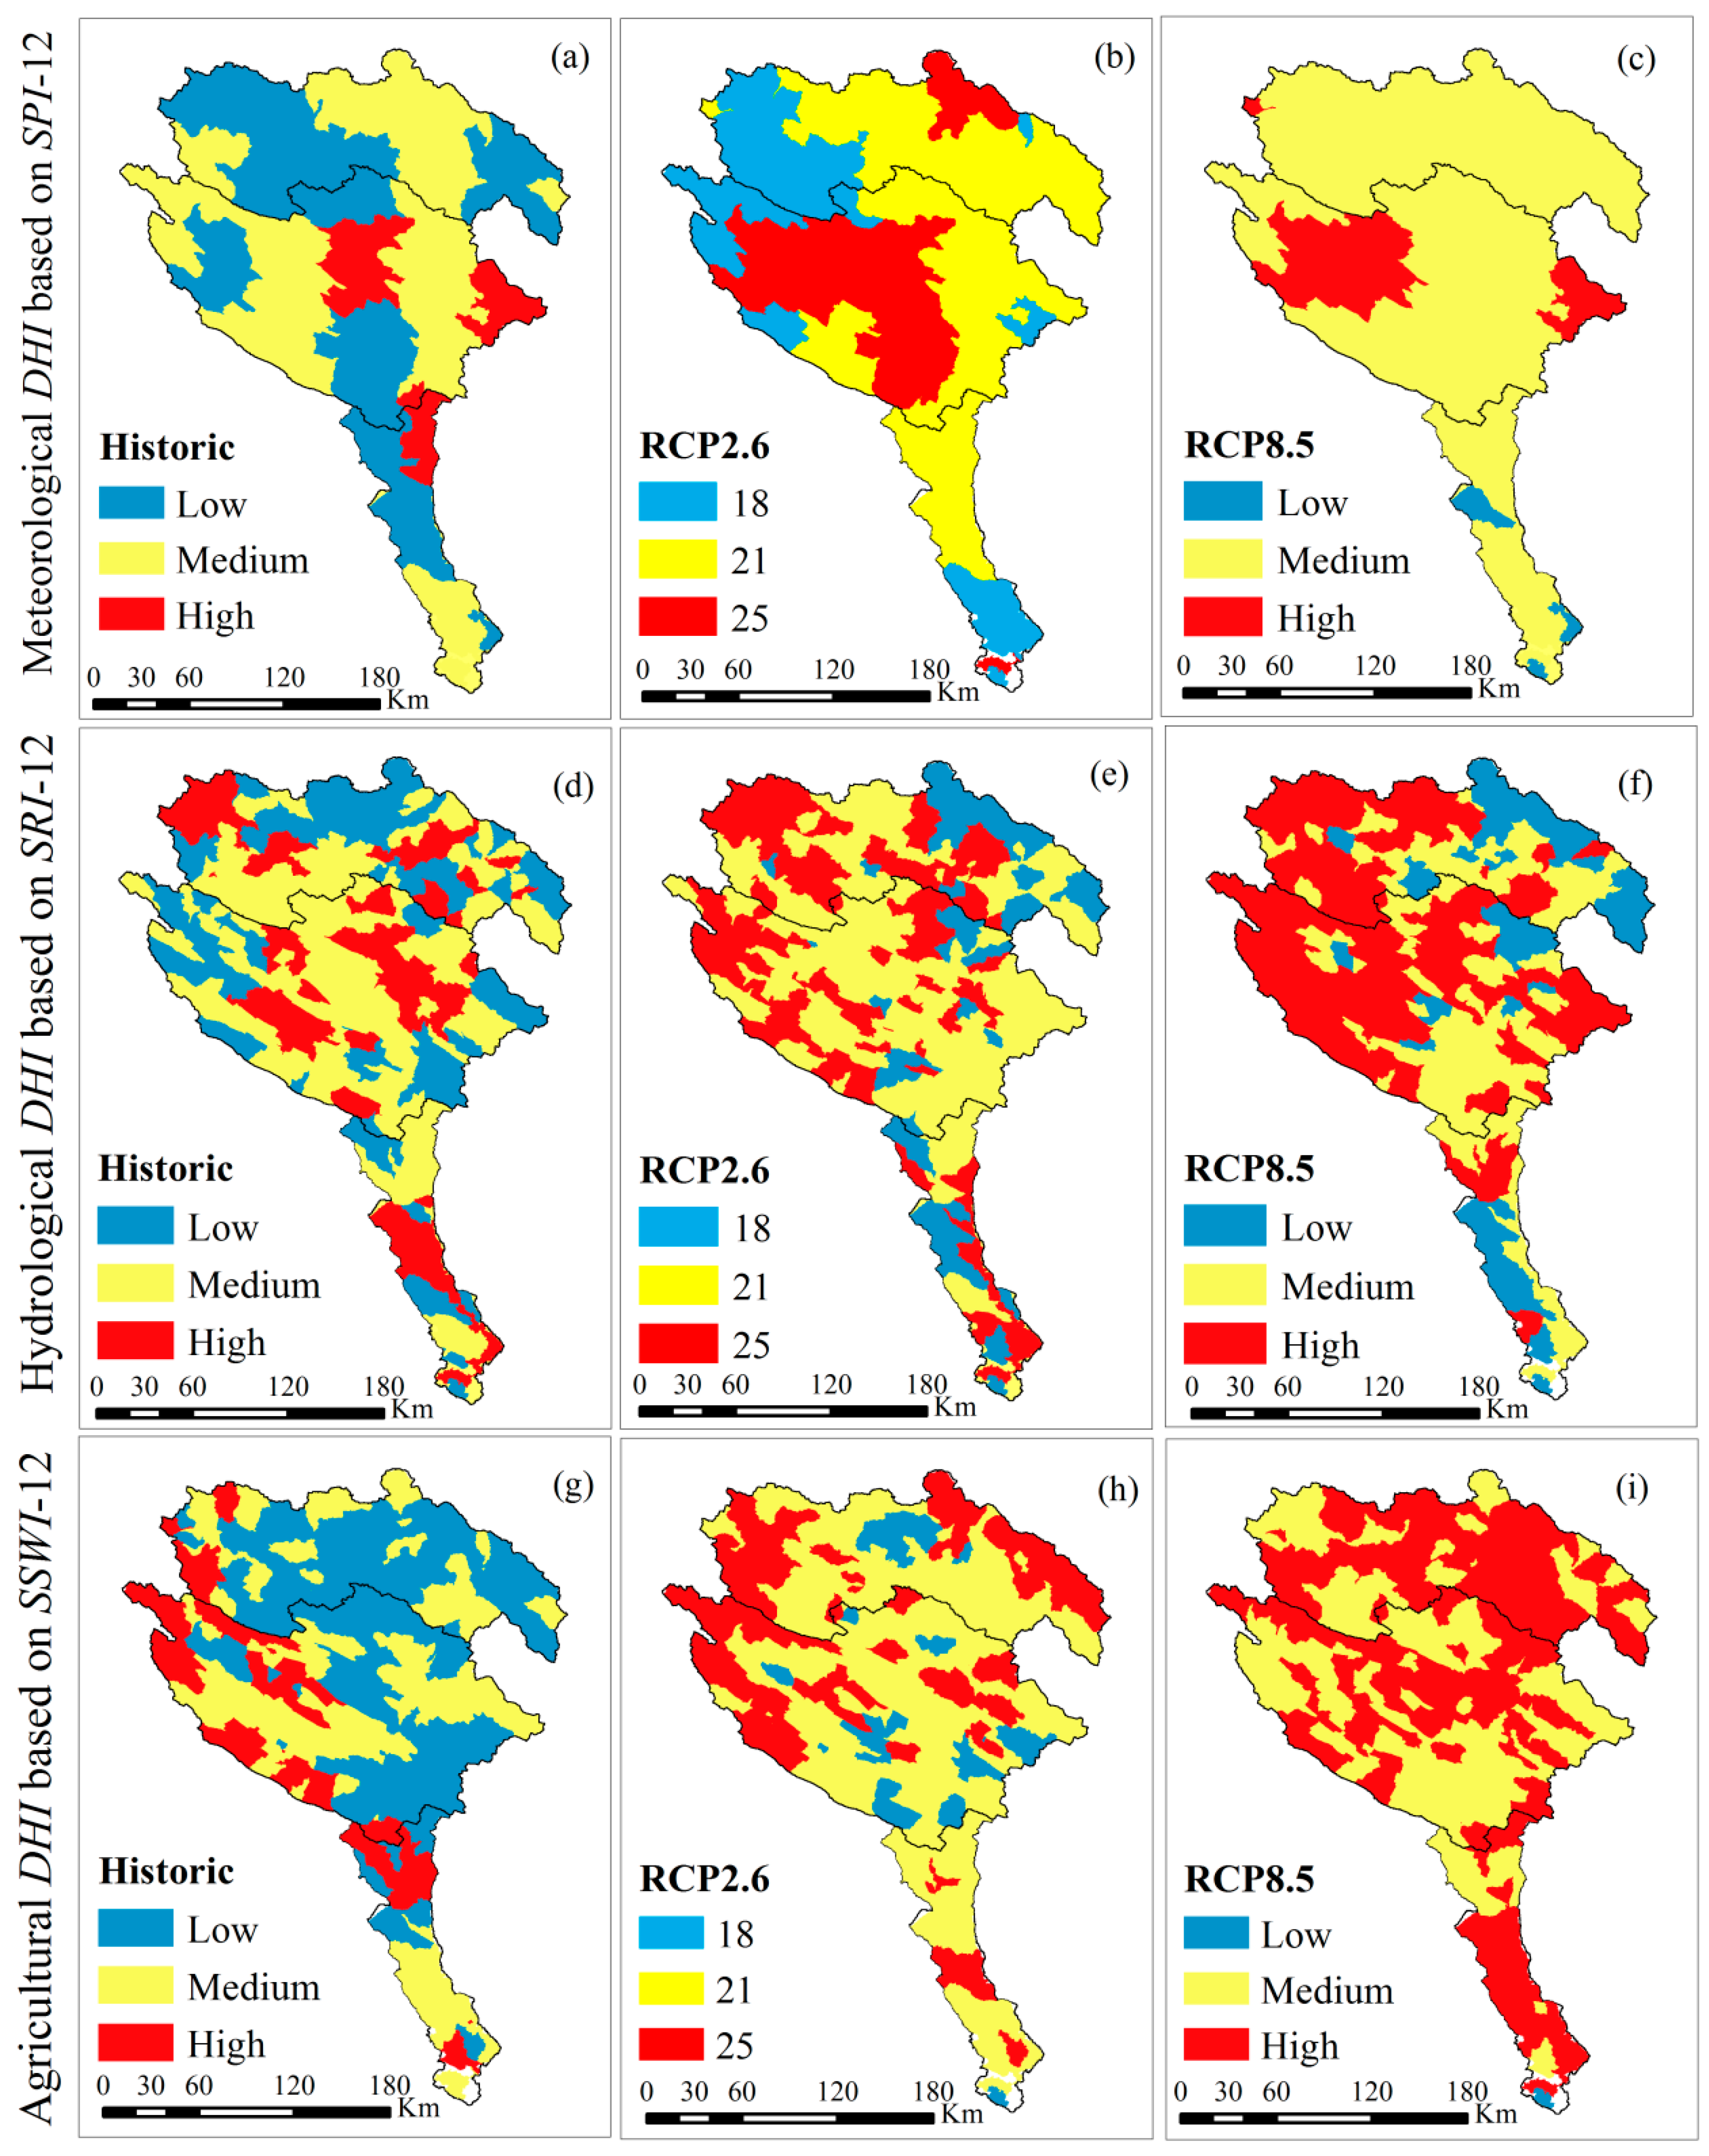
3.4. Composite Droughts Index, DHI

Spatial distributions of the composite meteorological DHI under future climate change conditions show that KRB would probably experience a higher degree of meteorological DHI compared to the historic period. Most of KRB will probably be exposed to medium meteorological DHI except eastern sides of CKRB where high meteorological DHI is predicted. Hydrological DHI responded differently for both historic and future conditions (Figure 5d–f). Generally, KRB is predicted to be more exposed to high hydrological DHI in western NKRB and CKRB. SKRB will probably be less exposed to high hydrological DHI. High agricultural DHI during the historic period was limited to the western part of KRB (Figure 5a,d), however, both RCP2.6 and RCP8.5 predict higher agricultural DHI (Figure 5g–i) in all catchments. In fact, RCP8.5 puts most of KRB under high agricultural DHI.

4. Discussion and Conclusions

SPI, SRI, and SSWI with the aid of a SWAT model captured past drought periods. The selected indices were found to be suitable for drought monitoring, since the severe and extreme periods agreed with historical records over the past 33 years of the study period reported previously [37,41]. We found a 3-month lag between incipient meteorological droughts and the time that hydrological droughts were observed. While occurrence of a lag between meteorological and hydrological droughts is reported in many studies [8,67], the length of lag time varies by study. For example, Liu et al. [28] found that hydrological drought was not observed until 2 months after meteorological drought, and Stefan et al. [68] reported a 2–3-month lag between the precipitation and river discharge anomalies during winter and a 0–1 month delay in summer. Generally, not only precipitation, but also factors such as rainfall interception, temperature, evapotranspiration, and a basin’s morphological conditions contribute to discharge formation. In our study, the lag time between meteorological and hydrological droughts might be related to different reasons in the upper to lower catchments. In NKRB and CKRB, the lag might be mostly due to the mountainous characteristic of catchments. The flow that contributes to rivers in these catchments are mostly from snow melt of the mountainous areas, which occurs at a later time than the actual precipitation. However, lagged response in SKRB is most probably associated with a mixed-flow regime. Within this catchment, not only precipitation, but also the discharge from NKRB and SKRB contributes to flow, however, with some lag due to the varying time of concentration. Therefore, the timing of hydrological drought differs from meteorological drought.
We chose soil moisture to quantify SSWI to monitor agricultural drought because it is more relevant compared to evapotranspiration in basins with semi-arid climates. In the semi-arid regions, the rate of potential evapotranspiration (atmospheric demand) is substantially larger than actual evapotranspiration (soil’s ability to supply water), causing soil moisture to be at the wilting point for most of the year [69]. In our study, SSWI-12 showed a 3-month delay with SPI-12, as temperature also influenced soil moisture content. With increasing temperature in the summer season, evaporation increases, causing a depletion of soil water content.
For KRB as a whole, the future climate is likely to increase the probability of severe and extreme droughts. Comparison of the results with future projection of the Köppen-Geiger climate classification [70] also confirms a shift of climate zone from warm to arid in SKRB. The frequency and duration of future droughts will probably increase based on SRI-12 and SSWI-12, but decrease for SPI-12. The reason is that SPI-12 is computed based on precipitation alone, while indices of hydrological and agricultural droughts depend on both temperature and precipitation. The spatial extent of high agricultural DHI is predicted to be much larger in the future, especially in SKRB. This shows the complexity in translating meteorological droughts to agricultural and hydrological sectors, as drought propagation into two latter types depends on the climate of the region as well as the responses of the hydrological cycles and differs depending on physiographic characteristics of the regions such as permeability, topography, and land use. Higher exposure of the agricultural sector to drought poses additional challenges to agricultural production, as KRB has already experienced serious water shortages in the last two major droughts (D4 and D5) and irrigated agriculture had to rely heavily on the exploitation of groundwater.
In conclusion, one of the strengths of our applied approach is the use of a standardized definition of drought indices, which made our analysis consistent for comparing different drought types irrespective of the climatic conditions and the regions. The paper also made some contributions toward exploring behaviors of drought propagation in hydrological systems and identifying regions that will be more exposed to drought risks in the future. The distributed agro-hydrological model SWAT was used to estimate soil water content and runoff at a fine spatial resolution. Comparison of multiple drought indices of different aspects allows for a better monitoring of space-time drought characteristics.
Similar analyses and sets of selected indices could be applied to other basins with different scales for a better understanding of drought effects. The high spatial resolution obtained from applying a physically based model can be aggregated to district, farm, and provincial levels, as the findings from multiple scales are usually complementary to each other [71]. The standardized procedure facilitates linking drought indices with socioeconomic factors to broaden the knowledge on physical and social vulnerability. For example, by linking the agricultural DHI with crop yields, one can quantify crop drought vulnerability and risks, which are essential for food security purposes. Similarly, hydrological DHI is an appropriate candidate to measure drought indices that assess the status of water resources vulnerability. Such joint interpretations help decision makers with proposing better allocation of resources.

Supplementary Materials

The following are available online at www.mdpi.com/2073-4441/9/4/241/s1, Figure S1: Evolution of SPI over different time scales in three catchments of KRB; Figure S2: The future heat map of (a) meteorological, (b) hydrological, and (c) agricultural droughts in RCP2.6 scenario in three catchments of KRB; Figure S3: The future heat map of (a) meteorological, (b) hydrological, and (c) agricultural droughts in RCP8.5 scenario in three catchments of KRB.

Acknowledgments

The first and second authors express their sincere thanks to Eawag Partnership Program (EPP) for the opportunity of a collaboration. The authors also thanks the financial support of Swiss National Science Foundation (SNF No.: CR21I3_146430. Dec.2013-Nov.2016).

Author Contributions

Bahareh Kamali and Delaram Houshmand Kouchi prepared the SWAT model and wrote the paper with the assistance from Karim C. Abbaspour. Bahareh Kamali and Delaram Houshmand Kouchi designed the methodology framework under supervision of Karim C. Abbaspour and Hong Yang. Karim C. Abbaspour, Hong Yang advised on conceptual and technical, and contributed to the strategy.

Conflicts of Interest

The authors declare no conflict of interest.

References

  1. Vidal, J.P.; Martin, E.; Franchisteguy, L.; Habets, F.; Soubeyroux, J.M.; Blanchard, M.; Baillon, M. Multilevel and multiscale drought reanalysis over France with the Safran-Isba-Modcou hydrometeorological suite. Hydrol. Earth Syst. Sci. 2010, 14, 459–478. [Google Scholar] [CrossRef]
  2. Dai, A.G. Drought under global warming: A review. WIREs Clim. Chang. 2011, 2, 45–65. [Google Scholar] [CrossRef]
  3. Vicente-Serrano, S.M.; Begueria, S.; Lorenzo-Lacruz, J.; Camarero, J.J.; Lopez-Moreno, J.I.; Azorin-Molina, C.; Revuelto, J.; Moran-Tejeda, E.; Sanchez-Lorenzo, A. Performance of drought indices for ecological, agricultural, and hydrological applications. Earth Interact. 2012, 16, 1–27. [Google Scholar] [CrossRef]
  4. Peters, E.; Bier, G.; van Lanen, H.A.J.; Torfs, P.J.J.F. Propagation and spatial distribution of drought in a groundwater catchment. J. Hydrol. 2006, 321, 257–275. [Google Scholar] [CrossRef]
  5. Wilhite, D.A.; Glantz, M.H. Understanding the drought phenomenon: The role of definitions. Water Int. 1985, 10, 111–120. [Google Scholar] [CrossRef]
  6. Orville, H.D. American meteorological society statement on meteorological drought. Bull. Am. Meteorol. Soc. 1990, 71, 1021–1023. [Google Scholar]
  7. Wang, D.B.; Hejazi, M.; Cai, X.M.; Valocchi, A.J. Climate change impact on meteorological, agricultural, and hydrological drought in central Illinois. Water Resour Res. 2011, 47. [Google Scholar] [CrossRef]
  8. Lglesias, L.; Garrote, L.; Cancelliere, A.; Cubillo, F.; Wilhite, D. Coping with Drought Risk in Agriculture and Water Supply Systems, Drought Management and Policy Development in the Mediterranean, 1st ed.; Springer: Dordrecht, The Netherlands, 2009; p. 320. [Google Scholar]
  9. Koutroulis, A.G.; Vrohidou, A.E.K.; Tsanis, I.K. Spatiotemporal characteristics of meteorological drought for the Island of Crete. J. Hydrometeorol. 2011, 12, 206–226. [Google Scholar] [CrossRef]
  10. McKee, T.B.; Doesken, N.J.; Kleist, J. The relationship of drought frequency and duration to time scales. In Proceedings of the 8th Conference on Applied Climatology, Anaheim, CA, USA, 17–22 January 1993; pp. 179–184. [Google Scholar]
  11. Stagge, J.H.; Kohn, I.; Tallaksen, L.M.; Stahl, K. Modeling drought impact occurrence based on meteorological drought indices in Europe. J. Hydrol. 2015, 530, 37–50. [Google Scholar] [CrossRef]
  12. Belayneh, A.; Adamowski, J.; Khalil, B.; Ozga-Zielinski, B. Long-term SPI drought forecasting in the Awash River Basin in Ethiopia using wavelet neural network and wavelet support vector regression models. J. Hydrol. 2014, 508, 418–429. [Google Scholar] [CrossRef]
  13. Moreira, E.E.; Pires, C.L.; Pereira, L.S. SPI drought class predictions driven by the North Atlantic Oscillation index using log-linear modeling. Water 2016, 8, 1–18. [Google Scholar] [CrossRef]
  14. Hisdal, H.; Tallaksen, L.M. Estimation of regional meteorological and hydrological drought characteristics: A case study for Denmark. J. Hydrol. 2003, 281, 230–247. [Google Scholar] [CrossRef]
  15. Liu, B.; Zhou, X.; Li, W.; Lu, C.; Shu, L. Spatiotemporal characteristics of groundwater drought and its response to meteorological drought in Jiangsu Province, China. Water 2016, 8, 1–21. [Google Scholar] [CrossRef]
  16. Tallaksen, L.M.; Hisdal, H.; Van Lanen, H.A.J. Space-time modelling of catchment scale drought characteristics. J. Hydrol. 2009, 375, 363–372. [Google Scholar] [CrossRef]
  17. Tadesse, T.; Brown, J.F.; Hayes, M.J. A new approach for predicting drought-related vegetation stress: Integrating satellite, climate, and biophysical data over the US central plains. ISPRS J. Photogramm. 2005, 59, 244–253. [Google Scholar] [CrossRef]
  18. Tokarczyk, T.; Szalinska, W. Combined analysis of precipitation and water deficit for drought hazard assessment. Hydrol. Sci. J. 2014, 59, 1675–1689. [Google Scholar] [CrossRef]
  19. Duan, K.; Mei, Y.D. Comparison of meteorological, hydrological and agricultural drought responses to climate change and uncertainty assessment. Water Resour. Manag. 2014, 28, 5039–5054. [Google Scholar] [CrossRef]
  20. Trenberth, K.E.; Dai, A.G.; van der Schrier, G.; Jones, P.D.; Barichivich, J.; Briffa, K.R.; Sheffield, J. Global warming and changes in drought. Nat. Clim. Chang. 2014, 4, 17–22. [Google Scholar] [CrossRef]
  21. Rummukainen, M. Changes in climate and weather extremes in the 21st century. WIREs Clim. Chang. 2012, 3, 115–129. [Google Scholar] [CrossRef]
  22. Touma, D.; Ashfaq, M.; Nayak, M.A.; Kao, S.C.; Diffenbaugh, N.S. A multi-model and multi-index evaluation of drought characteristics in the 21st century. J. Hydrol. 2015, 526, 196–207. [Google Scholar] [CrossRef]
  23. Wilhite, D.A.; Sivakumar, M.V.K.; Pulwarty, R. Managing drought risk in a changing climate: The role of national drought policy. Weather Clim. Extremes 2014, 3, 4–13. [Google Scholar] [CrossRef]
  24. Awal, R.; Bayabil, H.K.; Fares, A. Analysis of potential future climate and climate Extremes in the Brazos Headwaters basin, Texas. Water 2016, 8, 1–18. [Google Scholar] [CrossRef]
  25. Lu, G.; Wu, H.; Xiao, H.; He, H.; Wu, Z. Impact of climate change on drought in the upstream Yangtze river region. Water 2016, 8, 1–20. [Google Scholar] [CrossRef]
  26. Lee, J.H.; Kim, C.J. A multimodel assessment of the climate change effect on the drought severity-duration-frequency relationship. Hydrol. Processes 2013, 27, 2800–2813. [Google Scholar] [CrossRef]
  27. Leng, G.Y.; Tang, Q.H.; Rayburg, S. Climate change impacts on meteorological, agricultural and hydrological droughts in China. Glob. Planet Chang. 2015, 126, 23–34. [Google Scholar] [CrossRef]
  28. Liu, L.; Hong, Y.; Bednarczyk, C.N.; Yong, B.; Shafer, M.A.; Riley, R.; Hocker, J.E. Hydro-climatological drought analyses and projections using meteorological and hydrological drought indices: A case study in Blue river basin, Oklahoma. Water Resour. Manag. 2012, 26, 2761–2779. [Google Scholar] [CrossRef]
  29. Han, L.Y.; Zhang, Q.; Ma, P.L.; Jia, J.Y.; Wang, J.S. The spatial distribution characteristics of a comprehensive drought risk index in southwestern China and underlying causes. Theor. Appl. Climatol. 2016, 124, 517–528. [Google Scholar] [CrossRef]
  30. Oweis, T.; Siadat, H.; Abbasi, F. Improving On-Farm Agricultural Water Productivity in the Karkheh River Basin (KRB); CPWF Project Report-Project Number 08: CGIAR Challenge Program on Water and Food; Department for International Development: Chatham, UK, 2009. [Google Scholar]
  31. Vaghefi, S.A.; Abbaspour, K.C.; Faramarzi, M.; Srinivasan, R.; Arnold, J.G. Modeling crop water productivity using a coupled SWAT–MODSIM model. Water 2017, 9, 1–15. [Google Scholar]
  32. Sietz, D.; Feola, G. Resilience in the rural Andes: Critical dynamics, constraints and emerging opportunities. Reg. Environ. Chang. 2016, 16, 2163–2169. [Google Scholar] [CrossRef]
  33. Millennium Ecosystem Assessment. Ecosystems and Human Well-Being: Synthesis; Island Press: Washington, DC, USA, 2005. [Google Scholar]
  34. Vaghefi, S.A.; Mousavi, S.J.; Abbaspour, K.C.; Srinivasan, R.; Arnold, J.R. Integration of hydrologic and water allocation models in basin-scale water resources management considering crop pattern and climate change: Karkheh River Basin in Iran. Reg. Environ. Chang. 2015, 15, 475–484. [Google Scholar] [CrossRef]
  35. Masih, I.; Ahmad, M.U.D.; Uhlenbrook, S.; Turral, H.; Karimi, P. Analysing streamflow variability and water allocation for sustainable management of water resources in the semi-arid Karkheh river basin, Iran. Phys. Chem. Earth 2009, 34, 329–340. [Google Scholar] [CrossRef]
  36. Jamali, S.; Abrishamchi, A.; Marino, M.A.; Abbasnia, A. Climate change impact assessment on hydrology of Karkheh Basin, Iran. Proc. Inst. Civ. Eng.-Water Manag. 2013, 166, 93–104. [Google Scholar] [CrossRef]
  37. Zamani, R.; Tabari, H.; Willems, P. Extreme streamflow drought in the Karkheh river basin (Iran): Probabilistic and regional analyses. Nat. Hazards 2015, 76, 327–346. [Google Scholar] [CrossRef]
  38. Golian, S.; Mazdiyasni, O.; AghaKouchak, A. Trends in meteorological and agricultural droughts in Iran. Theor. Appl. Climatol. 2015, 119, 679–688. [Google Scholar] [CrossRef]
  39. Vaghefi, S.A.; Mousavi, S.J.; Abbaspour, K.C.; Srinivasan, R.; Yang, H. Analyses of the impact of climate change on water resources components, drought and wheat yield in semiarid regions: Karkheh river basin in Iran. Hydrol. Processes 2014, 28, 2018–2032. [Google Scholar] [CrossRef]
  40. Ahmad, M.U.D.; Giordano, M. The Karkheh river basin: The food basket of Iran under pressure. Water Int. 2010, 35, 522–544. [Google Scholar] [CrossRef]
  41. Marjanizadeh, S.; Qureshi, A.S.; Turral, H.; Talebzadeh, P. From Mesopotamia to the Third Millennium: The Historical Trajectory of Water Development and Use in the Karkheh River Basin, Iran; IWMI Working Paper 135; International Water Management Institute: Colombo, Sri Lanka, 2009. [Google Scholar]
  42. Arnold, J.G.; Srinivasan, R.; Muttiah, R.S.; Williams, J.R. Large area hydrologic modeling and assessment—Part 1: Model development. J. Am. Water Resour. Assoc. 1998, 34, 73–89. [Google Scholar] [CrossRef]
  43. Hjelmfelt, A.T. Investigation of Curve Number Procedure. J. Hydraul. Eng.—ASCE 1991, 117, 725–737. [Google Scholar] [CrossRef]
  44. Neitsch, S.L.; Arnold, J.G.; Kiniry, J.R.; Williams, J.R.; King, K.W. Soil and Water Assessment Tool; Theoretical Documentation: Version 2009; Texas Water Resources Institute: College Station, TX, USA, 2005. [Google Scholar]
  45. Abbaspour, K.C.; Yang, J.; Maximov, I.; Siber, R.; Bogner, K.; Mieleitner, J.; Zobrist, J.; Srinivasan, R. Modelling hydrology and water quality in the pre-ailpine/alpine Thur watershed using SWAT. J. Hydrol. 2007, 333, 413–430. [Google Scholar] [CrossRef]
  46. Krause, P.; Boyle, D.P.; Bäse, F. Comparison of different efficiency criteria for hydrological model assessment. Adv. Geosci. 2005, 5, 89–97. [Google Scholar] [CrossRef]
  47. Abbaspour, K.C.; Faramarzi, M.; Ghasemi, S.S.; Yang, H. Assessing the impact of climate change on water resources in Iran. Water Resour. Res. 2009, 45, 1–16. [Google Scholar] [CrossRef]
  48. Nash, J.E.; Sutcliffe, J.V. River flow forecasting through conceptual models part I—A discussion of principles. J. Hydrol. 1970, 10, 282–290. [Google Scholar] [CrossRef]
  49. Jarvis, A.; Reuter, H.; Nelson, A.; Guevara, E. Hole-Filled SRTM for the Globe Version 4, the CGIAR-CSI SRTM 90m Database. Available online: http://srtm.csi.cgiar.org (accessed on January 2008).
  50. Schuol, J.; Abbaspour, K.C.; Yang, H.; Srinivasan, R.; Zehnder, A.J.B. Modeling blue and green water availability in Africa. Water Resour. Res. 2008, 44, 1–18. [Google Scholar] [CrossRef]
  51. Weedon, G.P.; Gomes, S.; Viterbo, P.; Shuttleworth, W.J.; Blyth, E.; Osterle, H.; Adam, J.C.; Bellouin, N.; Boucher, O.; Best, M. Creation of the WATCH forcing data and its use to assess global and regional reference crop evaporation over land during the twentieth century. J. Hydrometeorol. 2011, 12, 823–848. [Google Scholar] [CrossRef]
  52. IWPCO (Iran Water and Power Resources Development Company). Systematic Planning of Karkheh Watershed; Land Use Studies (Available in Persian); Iran Water and Power Resources Development Company: Iranian Ministry of Energy, Tehran, Iran, 2009. [Google Scholar]
  53. IWPCO (Iran Water and Power Resources Development Company). Systematic Studies of Karkheh River Basin (Available in Persian); Iran Water and Power Resources Development Company: Iranian Ministry of Energy, Tehran, Iran, 2010. [Google Scholar]
  54. Hagemann, S.; Chen, C.; Haerter, J.O.; Heinke, J.; Gerten, D.; Piani, C. Impact of a statistical bias correction on the projected hydrological changes obtained from three GCMs and two hydrology models. J. Hydrometeorol. 2011, 12, 556–578. [Google Scholar] [CrossRef]
  55. Hempel, S.; Frieler, K.; Warszawski, L.; Schewe, J.; Piontek, F. A trend-preserving bias correction—The ISI-MIP approach. Earth Syst. Dyn. 2013, 4, 219–236. [Google Scholar] [CrossRef]
  56. Wilby, R.L.; Wigley, T.M.L. Downscaling general circulation model output: A review of methods and limitations. Prog. Phys. Geogr. 1997, 21, 530–548. [Google Scholar] [CrossRef]
  57. Rouholahnejad, E.; Abbaspour, K.C.; Vejdani, M.; Srinivasan, R.; Schulin, R.; Lehmann, A. A parallelization framework for calibration of hydrological models. Environ. Model. Softw. 2012, 31, 28–36. [Google Scholar] [CrossRef]
  58. Bordi, I.; Frigio, S.; Parenti, P.; Speranza, A.; Sutera, A. The analysis of the Standardized Precipitation Index in the Mediterranean area: Large-scale patterns. Ann. Geophys. 2001, 44, 965–978. [Google Scholar]
  59. Lloyd-Hughes, B.; Saunders, M.A. A drought climatology for Europe. Int. J. Climatol. 2002, 22, 1571–1592. [Google Scholar] [CrossRef]
  60. Hao, Z.; AghaKouchak, A.; Nakhjiri, N.; Farahmand, A. Global integrated drought monitoring and prediction system. Sci. Data 2014, 140001. [Google Scholar] [CrossRef] [PubMed]
  61. Mo, K.C. Model-based drought indices over the United States. J. Hydrometeorol. 2008, 9, 1212–1230. [Google Scholar] [CrossRef]
  62. Shahid, S.; Behrawan, H. Drought risk assessment in the western part of Bangladesh. Nat. Hazards 2008, 46, 391–413. [Google Scholar] [CrossRef]
  63. Rajsekhar, D.; Singh, V.P.; Mishra, A.K. Integrated drought causality, hazard, and vulnerability assessment for future socioeconomic scenarios: An information theory perspective. J. Geophys. Res.-Atmos. 2015, 120, 6346–6378. [Google Scholar] [CrossRef]
  64. Jenks, G.F. The Data Model Concept in Statistical Mapping. Int. Yearbook Cartogr. 1967, 7, 186–190. [Google Scholar]
  65. Gocic, M.; Trajkovic, S. Analysis of precipitation and drought data in Serbia over the period 1980–2010. J. Hydrol. 2013, 494, 32–42. [Google Scholar] [CrossRef]
  66. Raziei, T.; Saghafian, B.; Paulo, A.A.; Pereira, L.S.; Bordi, I. Spatial patterns and temporal variability of drought in western Iran. Water Resour. Manag. 2009, 23, 439–455. [Google Scholar] [CrossRef]
  67. Wilhite, D.A. Drought Assessment, Management, and Planning: Theory and Case Studies; Springer: New York, NY, USA, 1993; Volume 2. [Google Scholar]
  68. Stefan, S.; Ghioca, M.; Rimbu, N.; Boroneant, C. Study of meteorological and hydrological drought in southern Romania from observational data. Int. J. Climatol. 2004, 24, 871–881. [Google Scholar] [CrossRef]
  69. Tallaksen, L.M.; van Lanen, H.A.J. Hydrological Drought: Processes and Estimation Methods for Streamflow and Groundwater; Developments in Water Science; Elsevier: Amsterdam, The Netherlands, 2004; p. 579. [Google Scholar]
  70. Rubel, F.; Kottek, M. Observed and projected climate shifts 1901–2100 depicted by world maps of the Koppen-Geiger climate classification. Meteorol. Z. 2010, 19, 135–141. [Google Scholar]
  71. Sietz, D. Regionalisation of global insights into dryland vulnerability: Better reflecting smallholders’ vulnerability in Northeast Brazil. Glob. Environ. Chang. 2014, 25, 173–185. [Google Scholar] [CrossRef]
Figure 1. The Karkheh River Basin (KRB) and the three major catchments (Northern Karkheh (NKRB), Central Karkheh (CKRB), and Southern Karkheh (SKRB)). The figure shows the main river, Karkheh dam, 31 climate stations, and 9 observed discharge outlets used for calibration.
Water 09 00241 g001
Figure 2. The historic patterns of (a) SPI-12 for meteorological; (b) SRI-12 for hydrological; and (c) SSWI-12 for agricultural droughts in three major catchments of KRB.
Water 09 00241 g002
Figure 3. The probability density function (PDF) of different severities of SPI-12 (af), SRI-12 (gl), and SSWI-12 (mr) in RCP2.6 and RCP8.5 scenarios. The grey bands are extracted from maximum and minimum values in the five GCMs and the black lines indicate the historic PDFs.
Water 09 00241 g003
Figure 4. Comparison of the frequency and duration of historic and future of (a,d) SPI-12, (b,e) SRI-12, and (c,f) SSWI-12 droughts based on an ensemble of five GCMs. The red lines inside the boxes show the median, the boxplots show the 25 and 75 percentiles, and the whiskers show 5 and 95 percentiles from 333 subbasins in KRB.
Water 09 00241 g004
Figure 5. Spatial variations of meteorological DHI (ac), hydrological DHI (df), and agricultural DHI (gi) comparing the historic and future variations in RCP2.6 and RCP8.5. The results are obtained from an ensemble of five GCMs.
Water 09 00241 g005
Table 1. Description of the five Global Circulation Models (GCMs) used in this study obtained from Coupled Model Intercomparison Project (CMIP5).
GCM NameInstitute Full Name
HadGEM2-ESMet Office Hadley Centre (additional HadGEM2-ES realizations contributed by Instituto Nacional de Pesquisas Espaciais)
IPSL-CM5A-LRInstitute Pierre-Simon Laplace
GFDL-ESM2MNOAA Geophysical Fluid Dynamics Laboratory-Earth System Model
MIROC-ESM-CHEMJapan Agency for Marine-Earth Science and Technology, Atmosphere and Ocean Research Institute (The University of Tokyo) and National Institute for Environmental Studies
NorESM1-MNorwegian Climate Centre-Earth System Model
Table 2. Six drought classes and weight and rate assigned to each drought class based on drought severity and drought occurrence probability, respectively. SPI, Standardized Precipitation Index; SRI, Standardized Runoff Index; SSWI, Standardized Soil Water Index.
ClassSPI, SRI, SSWI ValuesWeightRates Based on % of Occurrence Probability (Pr)
Extreme wetLarger than 10-
Wet0 to 0.990-
Mild−0.99 to 0W1 = 1If (17.9 < Pr ≤ 25.7) → R1 = 1
If (25.7 < Pr ≤ 30.4) → R1 = 2
If (30.4 < Pr ≤ 34.6) → R1 = 3
Moderate−1.49 to −1W2 = 2If (5.9 < Pr ≤ 8.3) → R2 = 1
If (8.3 < Pr ≤ 10.3) → R2 = 2
If (10.3 < Pr ≤ 13) → R2 = 3
Severe−1.99 to −1.5W3 = 3If (1.5 < Pr ≤ 3.7) → R3 = 1
If (3.7 < Pr ≤ 5.6) → R3 = 2
If (5.6 < Pr ≤ 8.3) → R3 = 3
ExtremeSmaller than −2W4 = 4If (0.7 < Pr ≤ 2.2) → R4 = 1
If (2.2 < Pr ≤ 3.4) → R4 = 2
If (3.4 < Pr ≤ 7.6) → R4 = 3
Table 3. Calibration and validatation performances of simulated discharge in SWAT. NS, Nash Sutcliffe.
Outlet NamesCalibration Period (1988–2012)Validation Period (1980–1987)
p-Factorr-FactorbR2NSp-Factorr-FactorbR2NS
Akan0.561.040.510.370.661.170.570.51
Polchehr0.570.820.490.550.700.920.540.50
Ghurbagestan0.740.830.590.670.730.930.710.66
Haleilan0.670.820.620.650.730.950.680.62
Tangsaz0.750.930.640.660.651.090.730.54
Afrine0.530.660.460.560.630.580.370.42
Jelogir0.640.890.670.660.711.120.670.59
Payepol0.521.040.380.130.641.080.560.27
Hamidieh0.551.080.430.180.651.230.510.17
Table 4. Correlation coefficient of SPI with SRI and SSWI in different time scales and in three catchments; the highlighted boxes show the highest correlation values of SPIs with SRIs and SSWIs.
CatchmentSPI-1SPI-3SPI-6SPI-9SPI-12SPI-24
NKRBSRI-10.550.270.120.050.070.09
SRI-30.830.710.380.230.160.16
SRI-60.760.870.770.530.400.35
SRI-90.640.740.850.770.590.47
SRI-120.580.650.750.810.760.56
SRI-240.420.500.600.640.680.83
CKRBSRI-10.490.240.100.050.070.10
SRI-30.790.660.370.230.180.19
SRI-60.720.830.760.530.420.40
SRI-90.610.730.850.780.620.54
SRI-120.540.640.750.820.800.64
SRI-240.390.500.620.660.710.87
SKRB SRI-10.360.200.110.070.080.12
SRI-30.600.510.320.220.180.25
SRI-60.460.560.570.430.350.41
SRI-90.410.490.640.580.480.49
SRI-120.370.480.610.670.640.58
SRI-240.260.360.470.510.560.79
NKRBSSWI-10.630.300.160.090.100.10
SSWI-30.700.650.370.270.230.19
SSWI-60.670.790.740.560.490.41
SSWI-90.570.710.810.780.670.56
SSWI-120.470.590.720.780.790.64
SSWI-240.320.420.500.520.560.82
CKRBSSWI-10.680.320.150.090.090.09
SSWI-30.710.680.370.260.230.20
SSWI-60.630.780.740.550.470.42
SSWI-90.510.670.770.750.630.55
SSWI-120.410.560.670.730.740.62
SSWI-240.320.410.480.500.520.75
SKRBSSWI-10.710.450.280.190.100.14
SSWI-30.620.740.500.430.280.30
SSWI-60.560.760.810.610.480.43
SSWI-90.490.690.850.830.650.53
SSWI-120.390.590.770.850.840.63
SSWI-240.320.430.530.530.560.88

