Application of GIS-Interval Rough AHP Methodology for Flood Hazard Mapping in Urban Areas



Abstract
1. Introduction
2. Study Area
3. Methodology
3.1. Methodological Background
3.2. Interval Rough Numbers
3.3. IR’AHP Mathematical Model
4. Estimation of Flood-Prone Areas in Palilula Municipality
4.1. Criteria Selection
4.2. GIS-MCDA
4.3. Aggregation of Weighted Linear Combination
5. Results-Discussions
6. Conclusions
Acknowledgments
Author Contributions
Conflicts of Interest
Appendix A
- (1)
- Adding of IRN“+”
- (2)
- Subtraction of IRN“−”
- (3)
- Multiplication of IRN“×”
- (4)
- Dividing of IRN“/”
- (5)
- Scalar multiplication of IRN where
- (1)
- If the intervals of IRN are not strictly bounded by other intervals, then:
- (2)
- If the intervals of IRN and are strictly bounded by other intervals, then it is necessary to find intersection points and of IRN and . Then, if this is satisfied, and .
References
- Duan, W.; He, B.; Takara, K.; Luo, P.; Nover, D.; Yamashiki, Y.; Huang, W. Anomalous atmospheric events leading to Kyushu’s flash floods, 11–14 July 2012. Nat. Hazards 2014, 73, 1255–1267. [Google Scholar] [CrossRef] [Scilit]
- Aronica, G.T.; Brigandí, G.; Morey, N. Flash floods and debris flow in the city area of Messina, north-east part of Sicily, Italy in October 2009: The case of the Giampilieri catchment. Nat. Hazards Earth Syst. 2012, 12, 1295–1309. [Google Scholar] [CrossRef] [Scilit]
- Forkuo, E.K. Flood Hazard Mapping using Aster Image data with GIS. Int. J. Geomat. Geosci. 2011, 1, 19. [Google Scholar]
- Yahaya, S.; Ahmad, N.; Abdalla, R.F. Multi-criteria analysis for flood vulnerable areas in Hadejia-Jama’are River basin, Nigeria. Eur. J. Sci. Res. 2010, 42, 71–83. [Google Scholar]
- Tsakiris, G. Flood risk assessment: Concepts, modelling, applications. Nat. Hazards Earth Syst. 2014, 14, 1361–1369. [Google Scholar] [CrossRef] [Scilit]
- Chen, J.; Hill, A.A.; Urbano, L.D. A GIS-based model for urban flood inundation. J. Hydrol. 2009, 373, 184–192. [Google Scholar] [CrossRef] [Scilit]
- Huong, H.T.L.; Pathirana, A. Urbanization and climate change impacts on future urban flooding in Can Tho city, Vietnam. Hydrol. Earth Syst. Sci. 2013, 17, 379–394. [Google Scholar] [CrossRef] [Scilit]
- Sowmya, K.; John, C.M.; Shrivasthava, N.K. Urban flood vulnerability zoning of Cochin City, southwest coast of India, using remote sensing and GIS. Nat. Hazards 2015, 75, 1271–1286. [Google Scholar] [CrossRef] [Scilit]
- Fernández, D.S.; Lutz, M.A. Urban flood hazard zoning in Tucumán Province, Argentina, using GIS and multicriteria decision analysis. Eng. Geol. 2010, 111, 90–98. [Google Scholar] [CrossRef] [Scilit]
- Yang, W.; Sun, X.; Deng, W.; Zhang, C.; Liao, Q. Fourier Locally Linear Soft Constrained MACE for facial landmark localization. CAAI Trans. Intell. Technol. 2016, 1, 241–248. [Google Scholar] [CrossRef] [Scilit]
- Brigandì, G.; Bonaccorso, B.; Aronica, G.T.; Gueli, R.; Basile, G. Flood and Landslide Warning based on rainfall thresholds and soil moisture indexes: The SyS Alert model for Sicily. In Proceedings of the 15th Risks Plinius Conference, Giardini Naxos, Italy, 8–11 June2016. [Google Scholar]
- Directive 2007/60/EC of the European Parliament and of the Council of 23 October 2007 on the Assessment and Management of Flood Risks; Official Journal of the European Union L288 on 6.11.2007; European Union: Brussels, Belgium, 2007; pp. 27–34.
- Büchele, B.; Kreibich, H.; Kron, A.; Thieken, A.; Ihringer, J.; Oberle, P.; Merz, B.; Nestmann, F. Flood-risk mapping: Contributions towards an enhanced assessment of extreme events and associated risks. Nat. Hazards Earth Syst. Sci. 2006, 6, 485–503. [Google Scholar] [CrossRef] [Scilit]
- Zerger, A. Examining GIS decision utility for natural hazard risk modelling. Environ. Model. Softw. 2002, 17, 287–294. [Google Scholar] [CrossRef] [Scilit]
- Wang, Y.; Li, Z.; Tang, Z.; Zeng, G. A GIS-based spatial multi-criteria approach for flood risk assessment in the Dongting Lake Region, Hunan, Central China. Water Resour. Manag. 2011, 25, 3465–3484. [Google Scholar] [CrossRef] [Scilit]
- Vahidnia, M.H.; Alesheikh, A.A.; Alimohammadi, A.; Hosseinali, F. A GIS-based neurofuzzy procedure for integrating knowledge and data in landslide susceptibility mapping. Comput. Geosci. 2010, 36, 1101–1114. [Google Scholar] [CrossRef] [Scilit]
- Patel, D.P.; Srivastava, P.K. Flood hazards mitigation analysis using remote sensing and GIS: Correspondence with town planning scheme. Water Resour. Manag. 2013, 27, 2353–2368. [Google Scholar] [CrossRef] [Scilit]
- Jaafari, A.; Najafi, A.; Pourghasemi, H.R.; Rezaeian, J.; Sattarian, A. GIS-based frequency ratio and index of entropy models for landslide susceptibility assessment in the Caspian forest, northern Iran. Int. J. Environ. Sci. Technol. 2014, 11, 909–926. [Google Scholar] [CrossRef] [Scilit]
- Strobl, R.O.; Forte, F.; Lonigro, T. Comparison of the feasibility of three flood-risk extent delineation techniques using Geographic Information System: Case study in Tavolieredelle Puglie, Italy. Flood Risk Manag. 2012, 5, 245–257. [Google Scholar] [CrossRef] [Scilit]
- Gong, M.; Wang, S.; Liu, W.; Yan, J.; Jiao, L. Evolutionary computation in China: A literature survey. CAAI Trans. Intell. Technol. 2016, 1, 334–354. [Google Scholar] [CrossRef] [Scilit]
- Pradhan, B.; Hagemann, U.; Tehrany, M.S.; Prechtel, N. An easy to use ArcMap based texture analysis program for extraction of flooded areas from TerraSAR-X satellite image. Comput. Geosci. 2014, 63, 34–43. [Google Scholar] [CrossRef] [Scilit]
- Bathrellos, G.D.; Gaki-Papanastassiou, K.; Skilodimou, H.D.; Papanastassiou, D.; Chousianitis, K.G. Potential suitability for urban planning and industry development by using natural hazard maps and geological-geomorphological parameters. Environ. Earth 2012, 66, 537–548. [Google Scholar] [CrossRef] [Scilit]
- Bathrellos, G.D.; Skilodimou, H.D.; Chousianitis, K.; Youssef, A.M.; Pradhan, B. Suitability estimation for urban development using multi-hazard assessment map. Sci. Total Environ. 2017, 575, 119–134. [Google Scholar] [CrossRef] [Scilit] [PubMed]
- Tehrany, M.S.; Pradhan, B.; Jebur, M.N. Spatial prediction of flood susceptible areas using rule based decision tree (DT) and a novel ensemble bivariate and multivariate statistical models in GIS. J. Hydrol. 2013, 504, 69–79. [Google Scholar] [CrossRef] [Scilit]
- Hammond, M.J.; Chen, A.S.; Djordjevic, S.; Butler, D.; Mark, O. Urban flood impact assessment: A stateoftheart review. Urban Water J. 2015, 12, 14–29. [Google Scholar] [CrossRef] [Scilit]
- Djordjevic, S.; Vojinovic, Z.; Dawson, R.; Savic, D.A. Uncertainties in flood modelling in urban areas. In Applied Uncertainty Analysis for Flood Risk Management; World Scientific: Singapore, 2014; pp. 297–334. [Google Scholar]
- Malczewski, J. GIS-based multicriteria decision analysis: A survey of the literature. Int. J. Geogr. Inf. Sci. 2006, 20, 703–726. [Google Scholar] [CrossRef] [Scilit]
- Rahmati, O.; Zeinivand, H.; Besharat, M. Flood hazard zoning in Yasooj region, Iran, using GIS and multi-criteria decision analysis, Geomatics. Nat. Hazards Risk 2016, 7, 1000–1017. [Google Scholar] [CrossRef] [Scilit]
- Gigović, L.; Pamučar, D.; Božanić, D.; Ljubojević, S. Application of the GIS-DANP-MABAC multi-criteria model for selecting the location of wind farms: A case study of Vojvodina. Renew. Energy 2017, 103, 501–521. [Google Scholar] [CrossRef] [Scilit]
- Zhong, Q.B.; Chen, F. Trajectory planning for biped robot walking on uneven terrain—Taking stepping as an example. CAAI Trans. Intell. Technol. 2016, 1, 197–209. [Google Scholar] [CrossRef] [Scilit]
- Gigović, L.; Pamučar, D.; Bajić, Z.; Milićević, M. The Combination of Expert Judgment and GIS-MAIRCA Analysis for the Selection of Sites for Ammunition Depots. Sustainability 2016, 8, 372. [Google Scholar] [CrossRef] [Scilit]
- Gigović, L.; Pamučar, D.; Lukić, D.; Marković, S. Application of the GIS—Fuzzy DEMATEL MCDA model for ecotourism development site evaluation: A case study of “Dunavskiključ”, Serbia. Land Use Policy 2016, 58, 348–365. [Google Scholar] [CrossRef] [Scilit]
- Gerl, T.; Bochow, M.; Kreibich, H. Flood Damage Modeling on the Basis of Urban Structure Mapping Using High-Resolution Remote Sensing Data. Water 2014, 6, 2367–2393. [Google Scholar] [CrossRef] [Scilit]
- Chau, V.N.; Holland, J.; Cassells, S.; Tuohy, M. Using GIS to map impacts upon agriculture from extreme floods in Vietnam. Appl. Geogr. 2013, 41, 65–74. [Google Scholar] [CrossRef] [Scilit]
- Kazakis, N.; Kougias, I.; Patsialis, T. Assessment of flood hazard areas at a regional scale using an index-based approach and analytical hierarchy process: Application in Rhodope–Evros region Greece. Sci. Total Environ. 2015, 538, 555–563. [Google Scholar] [CrossRef] [Scilit] [PubMed]
- Papaioannou, G.; Vasiliades, L.; Loukas, A. Multi-criteria analysis framework for potential flood prone areas mapping. Water Resour. Manag. 2015, 29, 399–418. [Google Scholar] [CrossRef] [Scilit]
- Liu, Z.; Wang, W.; Jin, Q. Manifold alignment using discrete surface Ricci flow. CAAI Trans. Intell. Technol. 2016, 1, 285–292. [Google Scholar] [CrossRef] [Scilit]
- Kannan, M.; Saranathan, E.; Anbalagan, R. Comparative analysis in GIS-based landslide hazard zonation—A case study in Bodi—BodimettuGhat section, Theni District, Tamil Nadu, India. Arab. J. Geosci. 2014, 8, 691–699. [Google Scholar] [CrossRef] [Scilit]
- Kritikos, T.; Davies, T.R.H. GIS-based multi-criteria decision analysis for landslide susceptibility mapping at northern Evia, Greece. Z. Dt. Ges. Geowiss. 2011, 162, 421–434. [Google Scholar]
- Meyer, V.; Scheuer, S.; Haase, D. A multicriteria approach for flood risk mapping exemplified at the Mulderiver, Germany. Nat. Hazards 2009, 48, 17–39. [Google Scholar] [CrossRef] [Scilit]
- Tehrany, M.S.; Pradhan, B.; Mansor, S.; Ahmad, N. Flood susceptibility assessment using GIS-based support vector machine model with different kernel types. Catena 2015, 125, 91–101. [Google Scholar] [CrossRef] [Scilit]
- Gong, M.; Li, H.; Jiang, X. A multi-objective optimization framework for ill-posed inverse problems. CAAI Trans. Intell. Technol. 2016, 1, 225–240. [Google Scholar] [CrossRef] [Scilit]
- Pradhan, B. Flood susceptible mapping and risk area delineation using logistic regression, GIS and remote sensing. J. Spat. Hydrol. 2010, 9, 1–18. [Google Scholar]
- Kia, M.B.; Pirasteh, S.; Pradhan, B.; Rodzi, M.A.; Sulaiman, W.N.A.; Moradi, A. An artificial neural network model for flood simulation using GIS: Johor River Basin, Malaysia. Environ. Earth Sci. 2012, 67, 251–264. [Google Scholar] [CrossRef] [Scilit]
- Lohani, A.K.; Goel, N.K.; Bhatia, K.K.S. Improving real time flood forecasting using fuzzy inference system. J. Hydrol. 2014, 509, 25–41. [Google Scholar] [CrossRef] [Scilit]
- Saaty, T.L. The Analytic Hierarchy Process: Planning, Priority Setting, Resource Allocation; McGraw-Hill: New York, NY, USA, 1980. [Google Scholar]
- Chandio, I.A.; Matori, A.N.B.; Yusof, K.B.W.; Talpur, M.A.H.; Balogun, A.L.; Lawal, D.U. GIS-based analytic hierarchy process as a multicriteria decision analysis instrument: A review. Arab. J. Geosci. 2013, 6, 3059–3066. [Google Scholar] [CrossRef] [Scilit]
- Siddayao, G.P.; Valdez, S.E.; Fernandez, P.L. Analytic hierarchy process (AHP) in spatial modeling for flood plain risk assessment. Int. J. Mach. Learn. Comput. 2014, 4, 450. [Google Scholar] [CrossRef] [Scilit]
- Stefanidis, S.; Stathis, D. Assessment of flood hazard based on natural and anthropogenic factors using analytic hierarchy process (AHP). Nat. Hazards 2013, 68, 569–585. [Google Scholar] [CrossRef] [Scilit]
- Chakraborty, A.; Joshi, P.K. Mapping disaster vulnerability in India using analytical hierarchy process. Geomat. Nat. Hazards Risk 2014, 7, 308–325. [Google Scholar] [CrossRef] [Scilit]
- Pourghasemi, H.R.; Pradhan, B.; Gokceoglu, C. Application of fuzzy logic and analytical hierarchy process (AHP) to landslide susceptibility mapping at Haraz watershed, Iran. Nat. Hazards 2012, 63, 965–996. [Google Scholar] [CrossRef] [Scilit]
- Liu, H.; Tang, H.; Xiao, W.; Guo, Z.Y.; Tian, L.; Gao, Y. Sequential Bag-of-Words model for human action classification. CAAI Trans. Intell. Technol. 2016, 1, 125–136. [Google Scholar] [CrossRef] [Scilit]
- Rozos, D.; Bathrellos, G.D.; Skillodimou, H.D. Comparison of the implementation of rock engineering system and analytic hierarchy process methods, upon landslide susceptibility mapping, using GIS: A case study from the Eastern Achaia County of Peloponnesus, Greece. Environ. Earth Sci. 2011, 63, 49–63. [Google Scholar] [CrossRef] [Scilit]
- Ouma, Y.O.; Tateishi, R. Urban Flood Vulnerability and Risk Mapping Using Integrated Multi-Parametric AHP and GIS: Methodological Overview and Case Study Assessment. Water 2014, 6, 1515–1545. [Google Scholar] [CrossRef] [Scilit]
- Bathrellos, G.D.; Karymbalis, E.; Skilodimou, H.D.; Gaki-Papanastassiou, K.; Baltas, E.A. Urban flood hazard assessment in the basin of Athens Metropolitan city, Greece. Environ. Earth Sci. 2016, 75, 319. [Google Scholar] [CrossRef] [Scilit]
- Liu, H.; Wang, C.; Gao, Y. Scene-adaptive hierarchical data association and depth-invariant part-based appearance model for in door multiple objects tracking. CAAI Trans. Intell. Technol. 2016, 1, 210–224. [Google Scholar] [CrossRef] [Scilit]
- Moel, H.D.; Vliet, M.V.; Aerts, J.C.J.H. Evaluating the effect of flood damage-reducing measures: A case study of the unembanked area of Rotterdam, the Netherlands. Reg. Environ. Chang. 2014, 14, 895–908. [Google Scholar]
- Zhu, G.N.; Hu, J.; Qi, J.; Gu, C.C.; Peng, J.H. An integrated AHP and VIKOR for design concept evaluation based on rough number. Adv. Eng. Inform. 2015, 29, 408–418. [Google Scholar] [CrossRef] [Scilit]
- Song, W.; Ming, X.; Wu, Z. An integrated rough number-based approach to design concept evaluation under subjective environments. J. Eng. Des. 2013, 24, 320–341. [Google Scholar] [CrossRef] [Scilit]
- Statistical Office of the Republic of Serbia. 2011 Census of Population, Households and Dwellings in the Republic of Serbia; Book 20, Comparative overview of the number of population in 1948–2011. Data by settlements, Belgrade; Statistical Office of the Republic of Serbia: Krajevo, Serbia, 2014.
- Republic Hydrometeorological Institute of Serbia. Available online: http://www.hidmet.gov.rs/ciril/meteorologija/klimatologija_padav_rezim.php (accessed on 24 January 2017).
- Đorđević, V.S. Temperature and Precipitation Trends in Belgrade and Indicators of Changing Extremes for Serbia. Geogr. Pannon. 2008, 12, 62–68. [Google Scholar]
- Unkašević, M.; Tošić, I. A statistical analysis of the daily precipitation over Serbia: Trends and indices. Theor. Appl. Climatol. 2011, 106, 69–78. [Google Scholar] [CrossRef] [Scilit]
- Zeshui, X.; Qingli, D. The possibility of interval number sequence method and its application. J. Syst. Eng. 2003, 18, 67–70. [Google Scholar]
- Shuping, W. Interval multi-attribute decision-making of attitude indicator method. Control Decis. Mak. 2009, 24, 35–38. [Google Scholar]
- Zadeh, L.A. Fuzzy sets. Inf. Control 1965, 8, 338–353. [Google Scholar] [CrossRef] [Scilit]
- Xu, X.; Law, R.; Chen, W.; Tang, L. Forecasting tourism demand by extracting fuzzy Takagi-Sugeno rules from trained SVMs. CAAI Trans. Intell. Technol. 2016, 1, 30–42. [Google Scholar] [CrossRef] [Scilit]
- Pamučar, D.; Ćirović, G. The selection of transport and handling resources in logistics centres using Multi-Attributive Border Approximation area Comparison (MABAC). Expert Syst. Appl. 2015, 42, 3016–3028. [Google Scholar] [CrossRef] [Scilit]
- Song, W.; Ming, X.; Wu, Z.; Zhu, B. A rough TOPSIS approach for failure mode and effects analysis in uncertain environments. Qual. Reliab. Eng. Int. 2014, 30, 473–486. [Google Scholar] [CrossRef] [Scilit]
- Zhang, Q.; Xie, Q.; Wang, G. A survey on rough set theory and its applications. CAAI Trans. Intell. Technol. 2016, 1, 323–333. [Google Scholar] [CrossRef] [Scilit]
- Arce, M.E.; Saavedra, A.; Míguez, J.L.; Granada, E. The use of grey-based methods in multi-criteria decision analysis for the evaluation of sustainable energy systems: A review. Sustain. Energy Rev. 2015, 47, 924–932. [Google Scholar] [CrossRef] [Scilit]
- Ji, W.; Tang, L.; Li, D.; Yang, W.; Liao, Q. Video-based construction vehicles detection and its application in intelligent monitoring system. CAAI Trans. Intell. Technol. 2016, 1, 162–172. [Google Scholar] [CrossRef] [Scilit]
- Kuang, H.; Kilgour, D.M.; Hipel, K.W. Grey-based PROMETHEE II with application to evaluation of source water protection strategies. Inf. Sci. 2015, 294, 376–389. [Google Scholar] [CrossRef] [Scilit]
- Vahdani, B.; Tavakkoli-Moghaddam, R.; Meysam, M.S. Soft computing based on new interval-valued fuzzy modified multi-criteria decision-making method. Appl. Soft Comput. 2013, 13, 165–172. [Google Scholar] [CrossRef] [Scilit]
- Sizong, G.; Tao, S. Interval-Valued Fuzzy Number and Its Expression Based on Structured Element. Adv. Intell. Soft Comput. 2016, 62, 1417–1425. [Google Scholar]
- Zywica, P.; Stachowiak, A.; Wygralak, M. An algorithmic study of relative cardinalities for interval-valued fuzzy sets. Fuzzy Sets Syst. 2016, 294, 105–124. [Google Scholar] [CrossRef] [Scilit]
- Nayagama, V.L.G.; Jeevaraja, S.; Sivaraman, G. Complete Ranking of Intuitionistic Fuzzy Numbers. Fuzzy Inf. Eng. 2016, 8, 237–254. [Google Scholar]
- Wang, H.; Yang, B.; Chen, W. Unknown constrained mechanisms operation based on dynamic interactive control. CAAI Trans. Intell. Technol. 2016, 1, 259–271. [Google Scholar] [CrossRef] [Scilit]
- Nguyen, H. A new interval-value d knowledge measure for interval-valued intuitionistic fuzzy sets and application in decision making. Expert Syst. Appl. 2016, 56, 143–155. [Google Scholar] [CrossRef] [Scilit]
- Zheng, P.; Xu, X.; Xie, S.Q. A weighted interval rough number based method to determine relative importance ratings of customer requirements in QFD product planning. J. Intell. Manuf. 2016, 1–14. [Google Scholar] [CrossRef] [Scilit]
- Kang, R.; Zhang, T.; Tang, H.; Zhao, W. Adaptive Region Boosting method with biased entropy for path planning in changing environment. CAAI Trans. Intell. Technol. 2016, 1, 179–188. [Google Scholar] [CrossRef] [Scilit]
- Pawlak, Z. Rough sets. Int. J. Comput. Inf. Sci. 1982, 11, 341–356. [Google Scholar] [CrossRef] [Scilit]
- Duntsch, I.; Gediga, G. The rough set engine GROBIAN. In Proceedings of the 15th IMACS World Congress, Berlin, Germany, 24–29 August 1997; Sydow, A., Ed.; Wissenschaft und Technik Verlag: Berlin, Germany, 1997; Volume 4, pp. 613–618. [Google Scholar]
- Khoo, L.P.; Zhai, L.Y. A prototype genetic algorithm enhanced rough set-based rule induction system. Comput. Ind. 2001, 46, 95–106. [Google Scholar] [CrossRef] [Scilit]
- Saaty, T.L.; Vargas, L.G. Models, Methods, Concepts and Applications of the Analytic Hierarchy Process; Springer Science and Business, Media: Berlin, Germany, 2012. [Google Scholar]
- Saaty, T.L. A scaling method for priorities in hierarchical structures. J. Math. Psychol. 1977, 15, 234–281. [Google Scholar] [CrossRef] [Scilit]
- Stieglitz, M.; Rind, D.; Famiglietti, J.; Rosenzweig, C. An efficient approach to modeling the topographic control of surface hydrology for regional and global climate modeling. J. Clim. 1997, 10, 118–137. [Google Scholar] [CrossRef] [Scilit]
- Youssef, A.M.; Pradhan, B.; Hassan, A.M. Flash flood risk estimation along the St. Katherine road, southern Sinai, Egypt using GIS based morphometry and satellite imagery. Environ. Earth Sci. 2011, 62, 611–623. [Google Scholar] [CrossRef] [Scilit]
- Regmi, N.R.; Giardino, J.R.; Vitek, J.D. Modeling susceptibility to landslides using the weight of evidence approach: Western Colorado, USA. Geomorphology 2010, 115, 172–187. [Google Scholar] [CrossRef] [Scilit]
- Glenn, E.; Morino, K.; Nagler, P.; Murray, R.; Pearlstein, S.; Hultine, K. Roles of Saltcedar (Tamarix spp.) and capillary rise in salinizing a non-flooding terrace on a flow-regulated desert river. J. Arid Environ. 2012, 79, 56–65. [Google Scholar] [CrossRef] [Scilit]
- Kourgialas, N.N.; Karatzas, G.P. A flood risk decision making approach for Mediterranean tree crops using GIS; climate change effects and flood-tolerant species. Environ. Sci. Policy 2016, 63, 132–142. [Google Scholar] [CrossRef] [Scilit]
- OpenStreetMap. Available online: https://www.openstreetmap.org/#map=11/44.9123/20.5197 (accessed on 27 January 2017).
- Retaei, J.; Fahim, P.B.M.; Tavasszy, L. Supplier selection in the airline retail industry using a funnel methodology: Conjunctive screening method and fuzzy AHP. Expert Syst. Appl. 2014, 41, 8165–8179. [Google Scholar]
- John, A.; Paraskevadakis, D.; Bury, A.; Yang, Z.; Riahi, R. An integrated fuzzy risk assessment for seaport operations. Saf. Sci. 2014, 68, 180–194. [Google Scholar] [CrossRef] [Scilit]
- BalBeşikçi, E.; Kececi, T.; Arslan, O.; Turan, O. An application of fuzzy-AHP to ship operational energy efficiency measures. Ocean Eng. 2016, 121, 392–402. [Google Scholar] [CrossRef] [Scilit]
- Aşchilean, I.; Badea, G.; Giurca, I.; Naghiu, G.S.; Iloaie, F.G. Choosing the optimal technology to rehabilitate the pipes in water distribution systems using the AHP method. Energy Procedia 2017, 112, 19–26. [Google Scholar] [CrossRef] [Scilit]

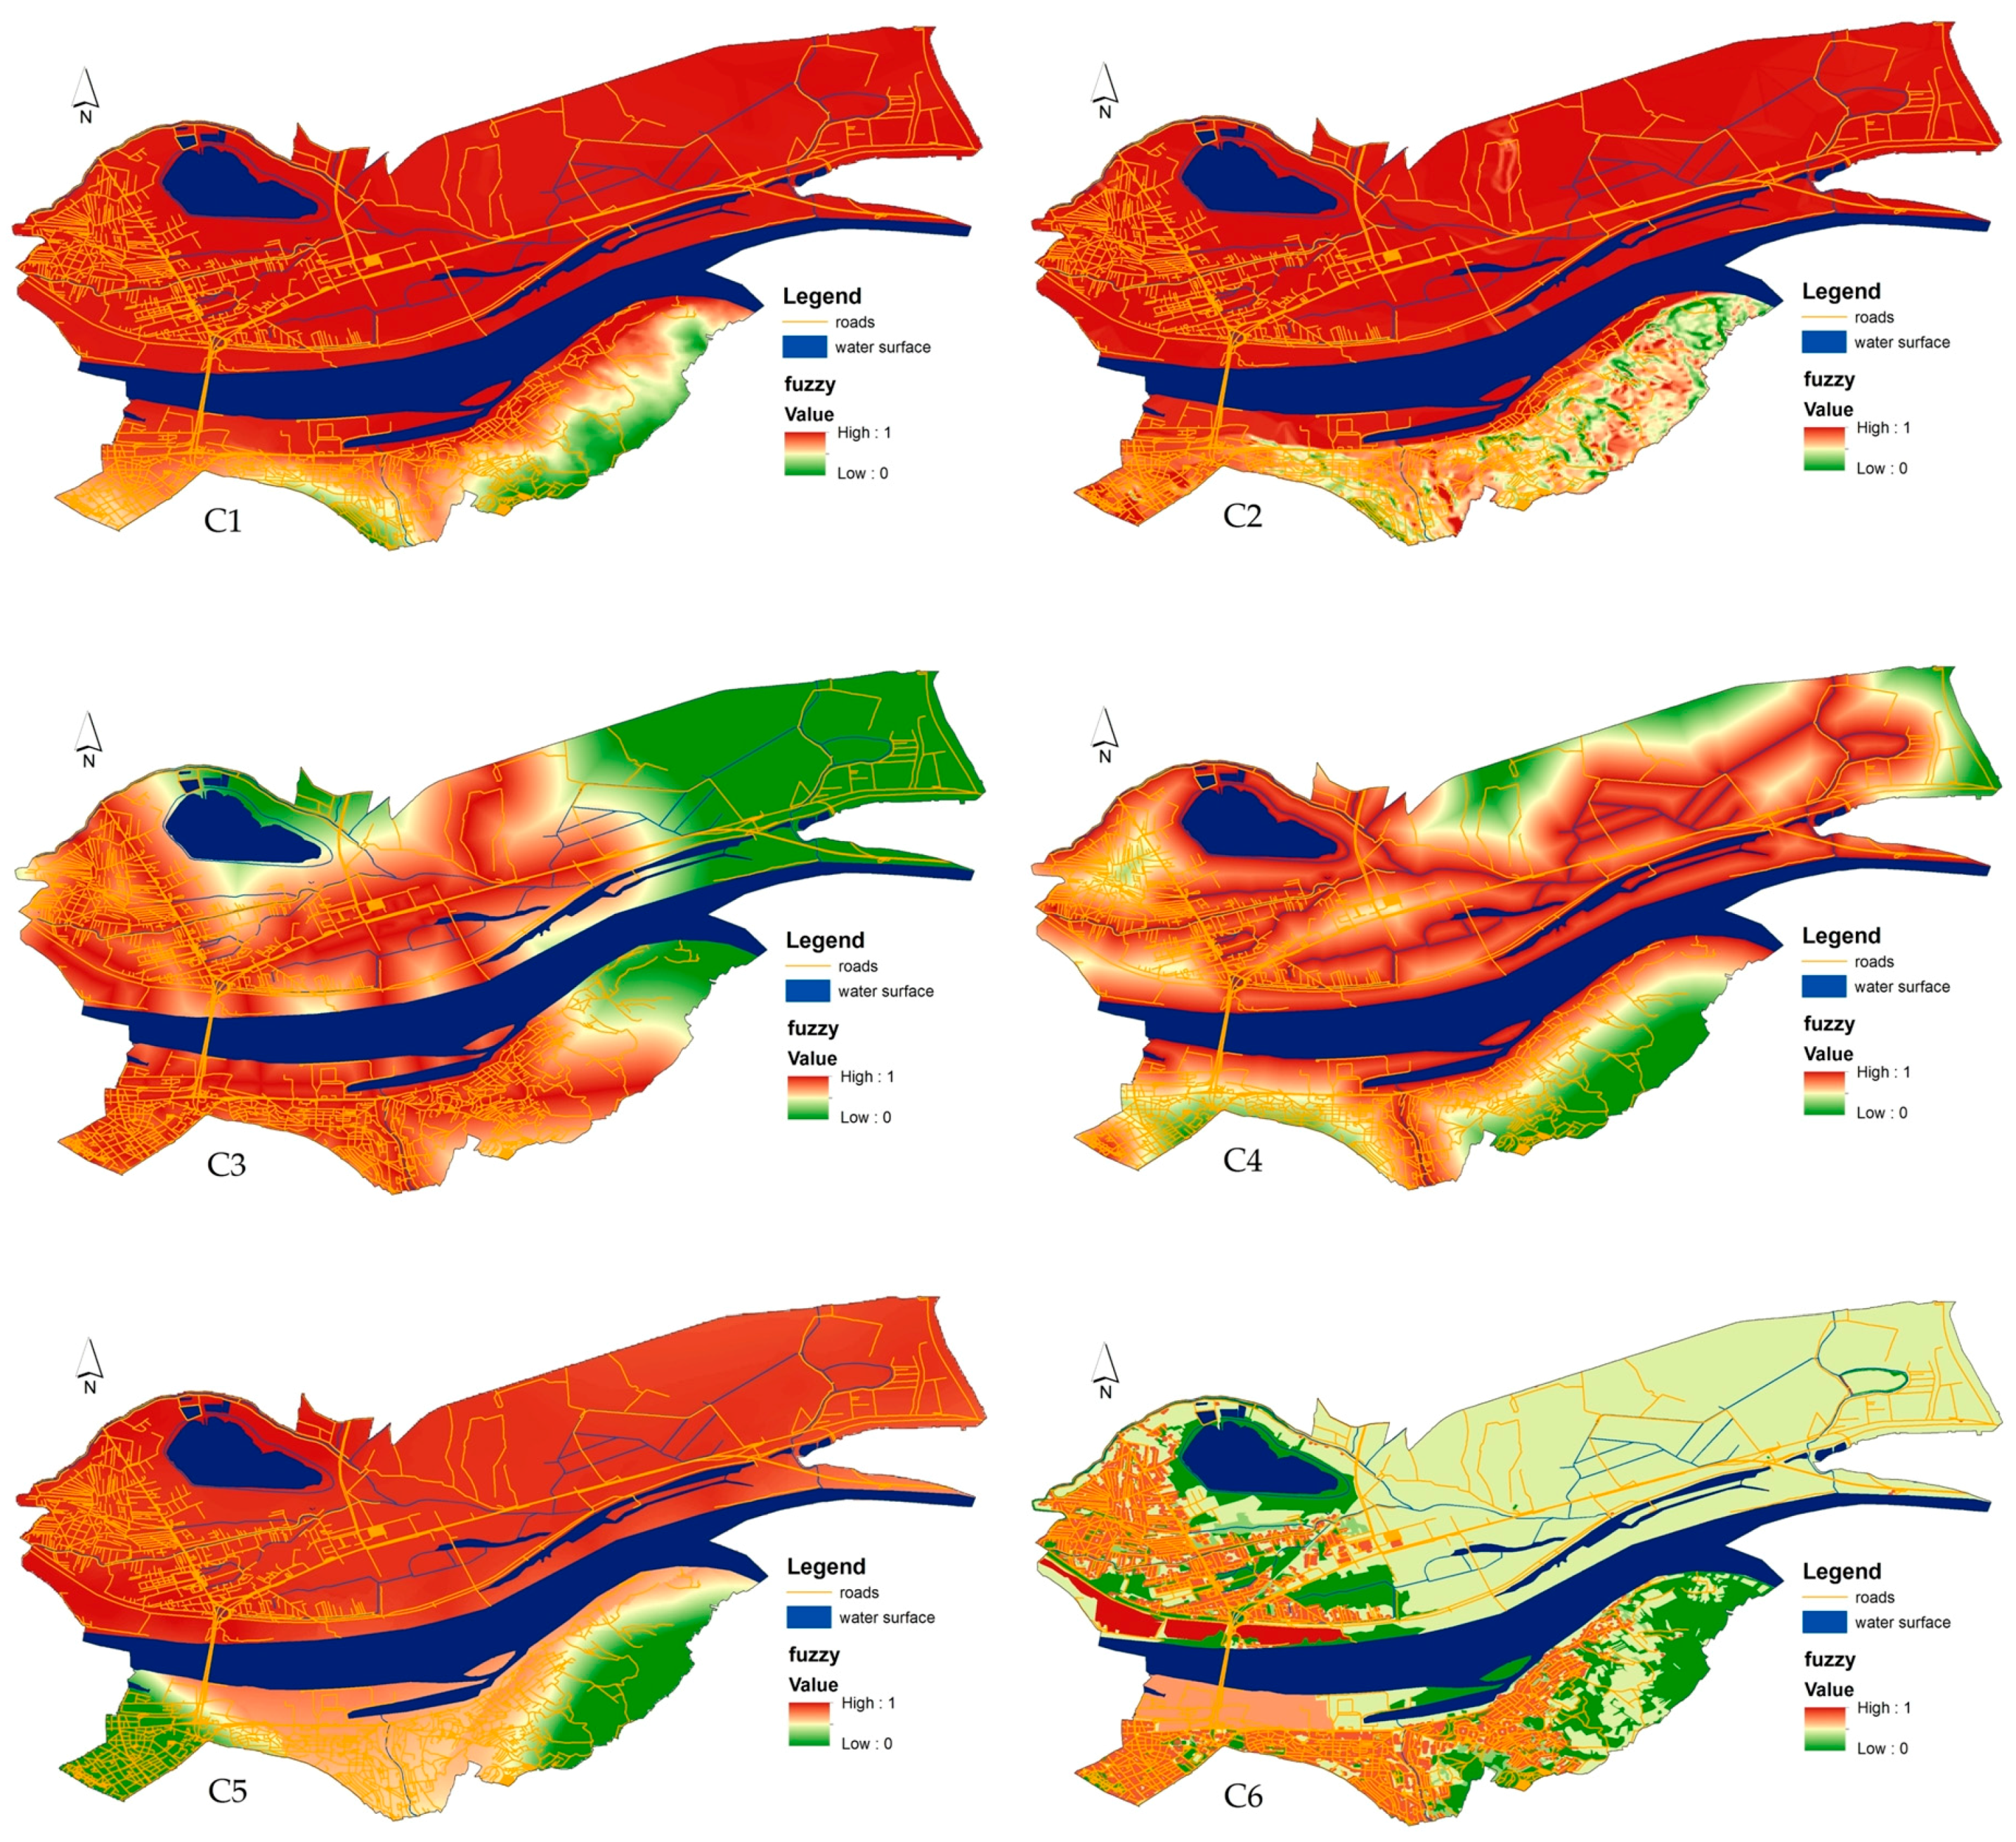
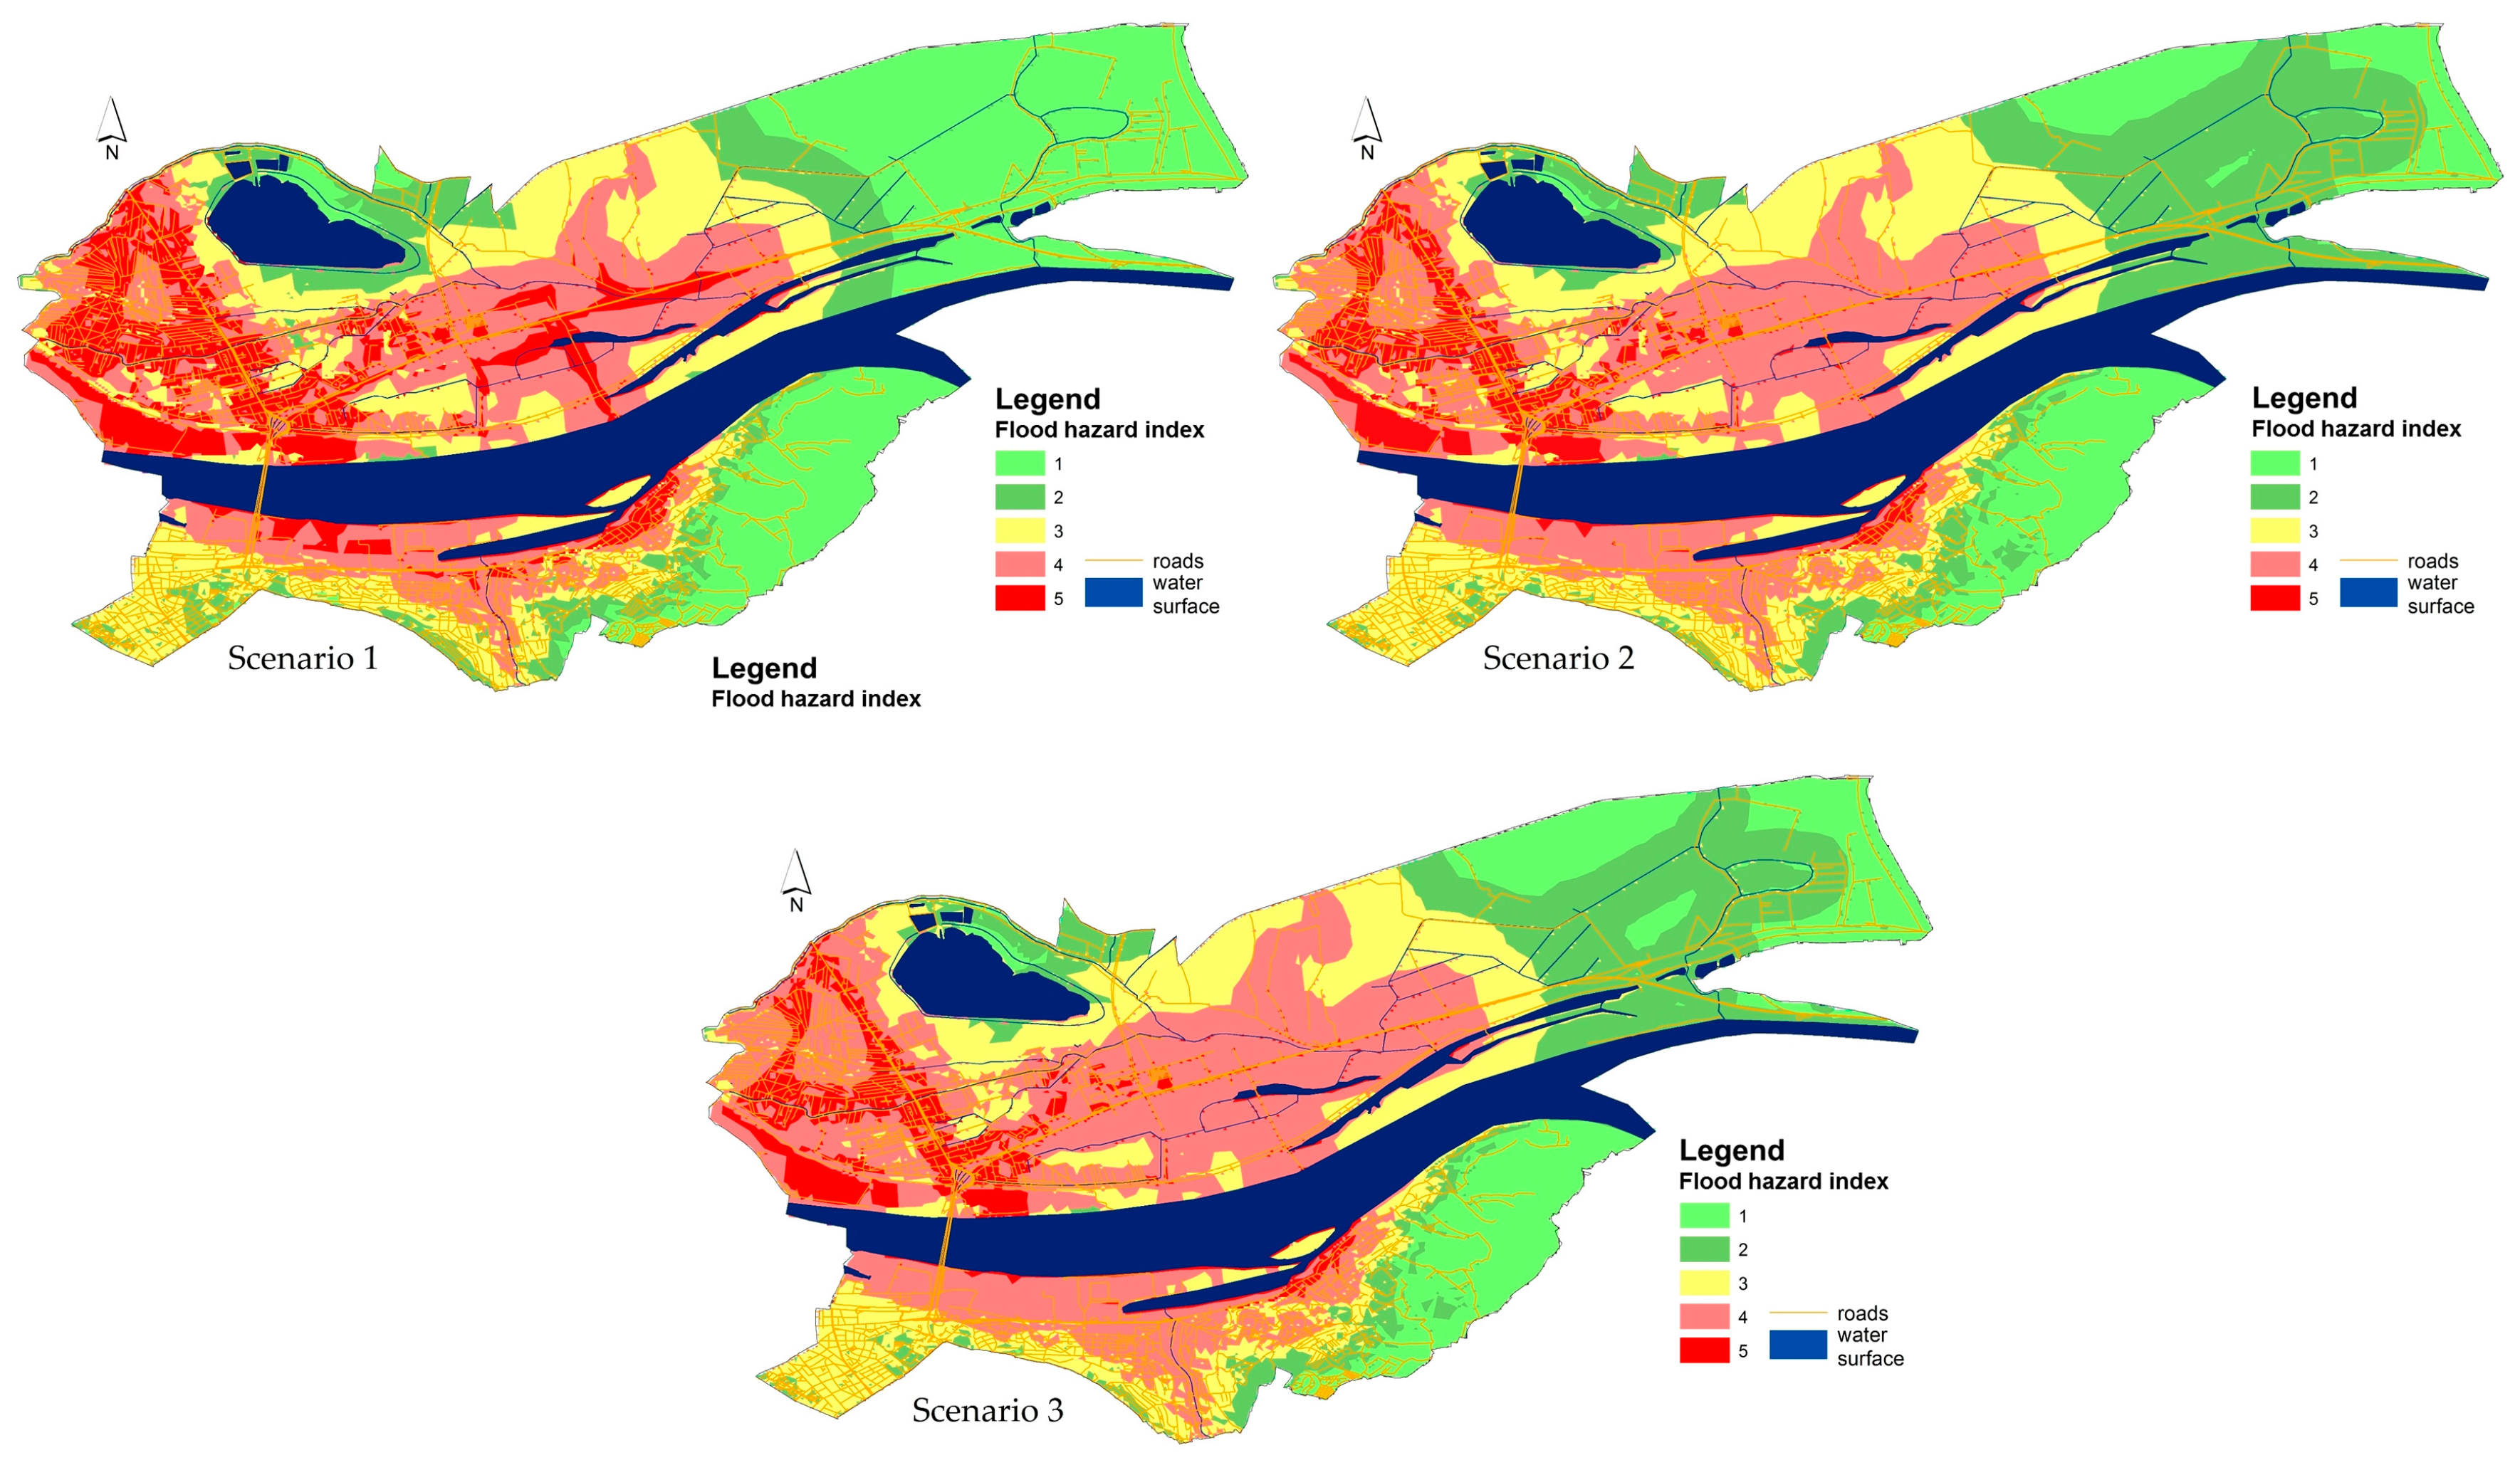
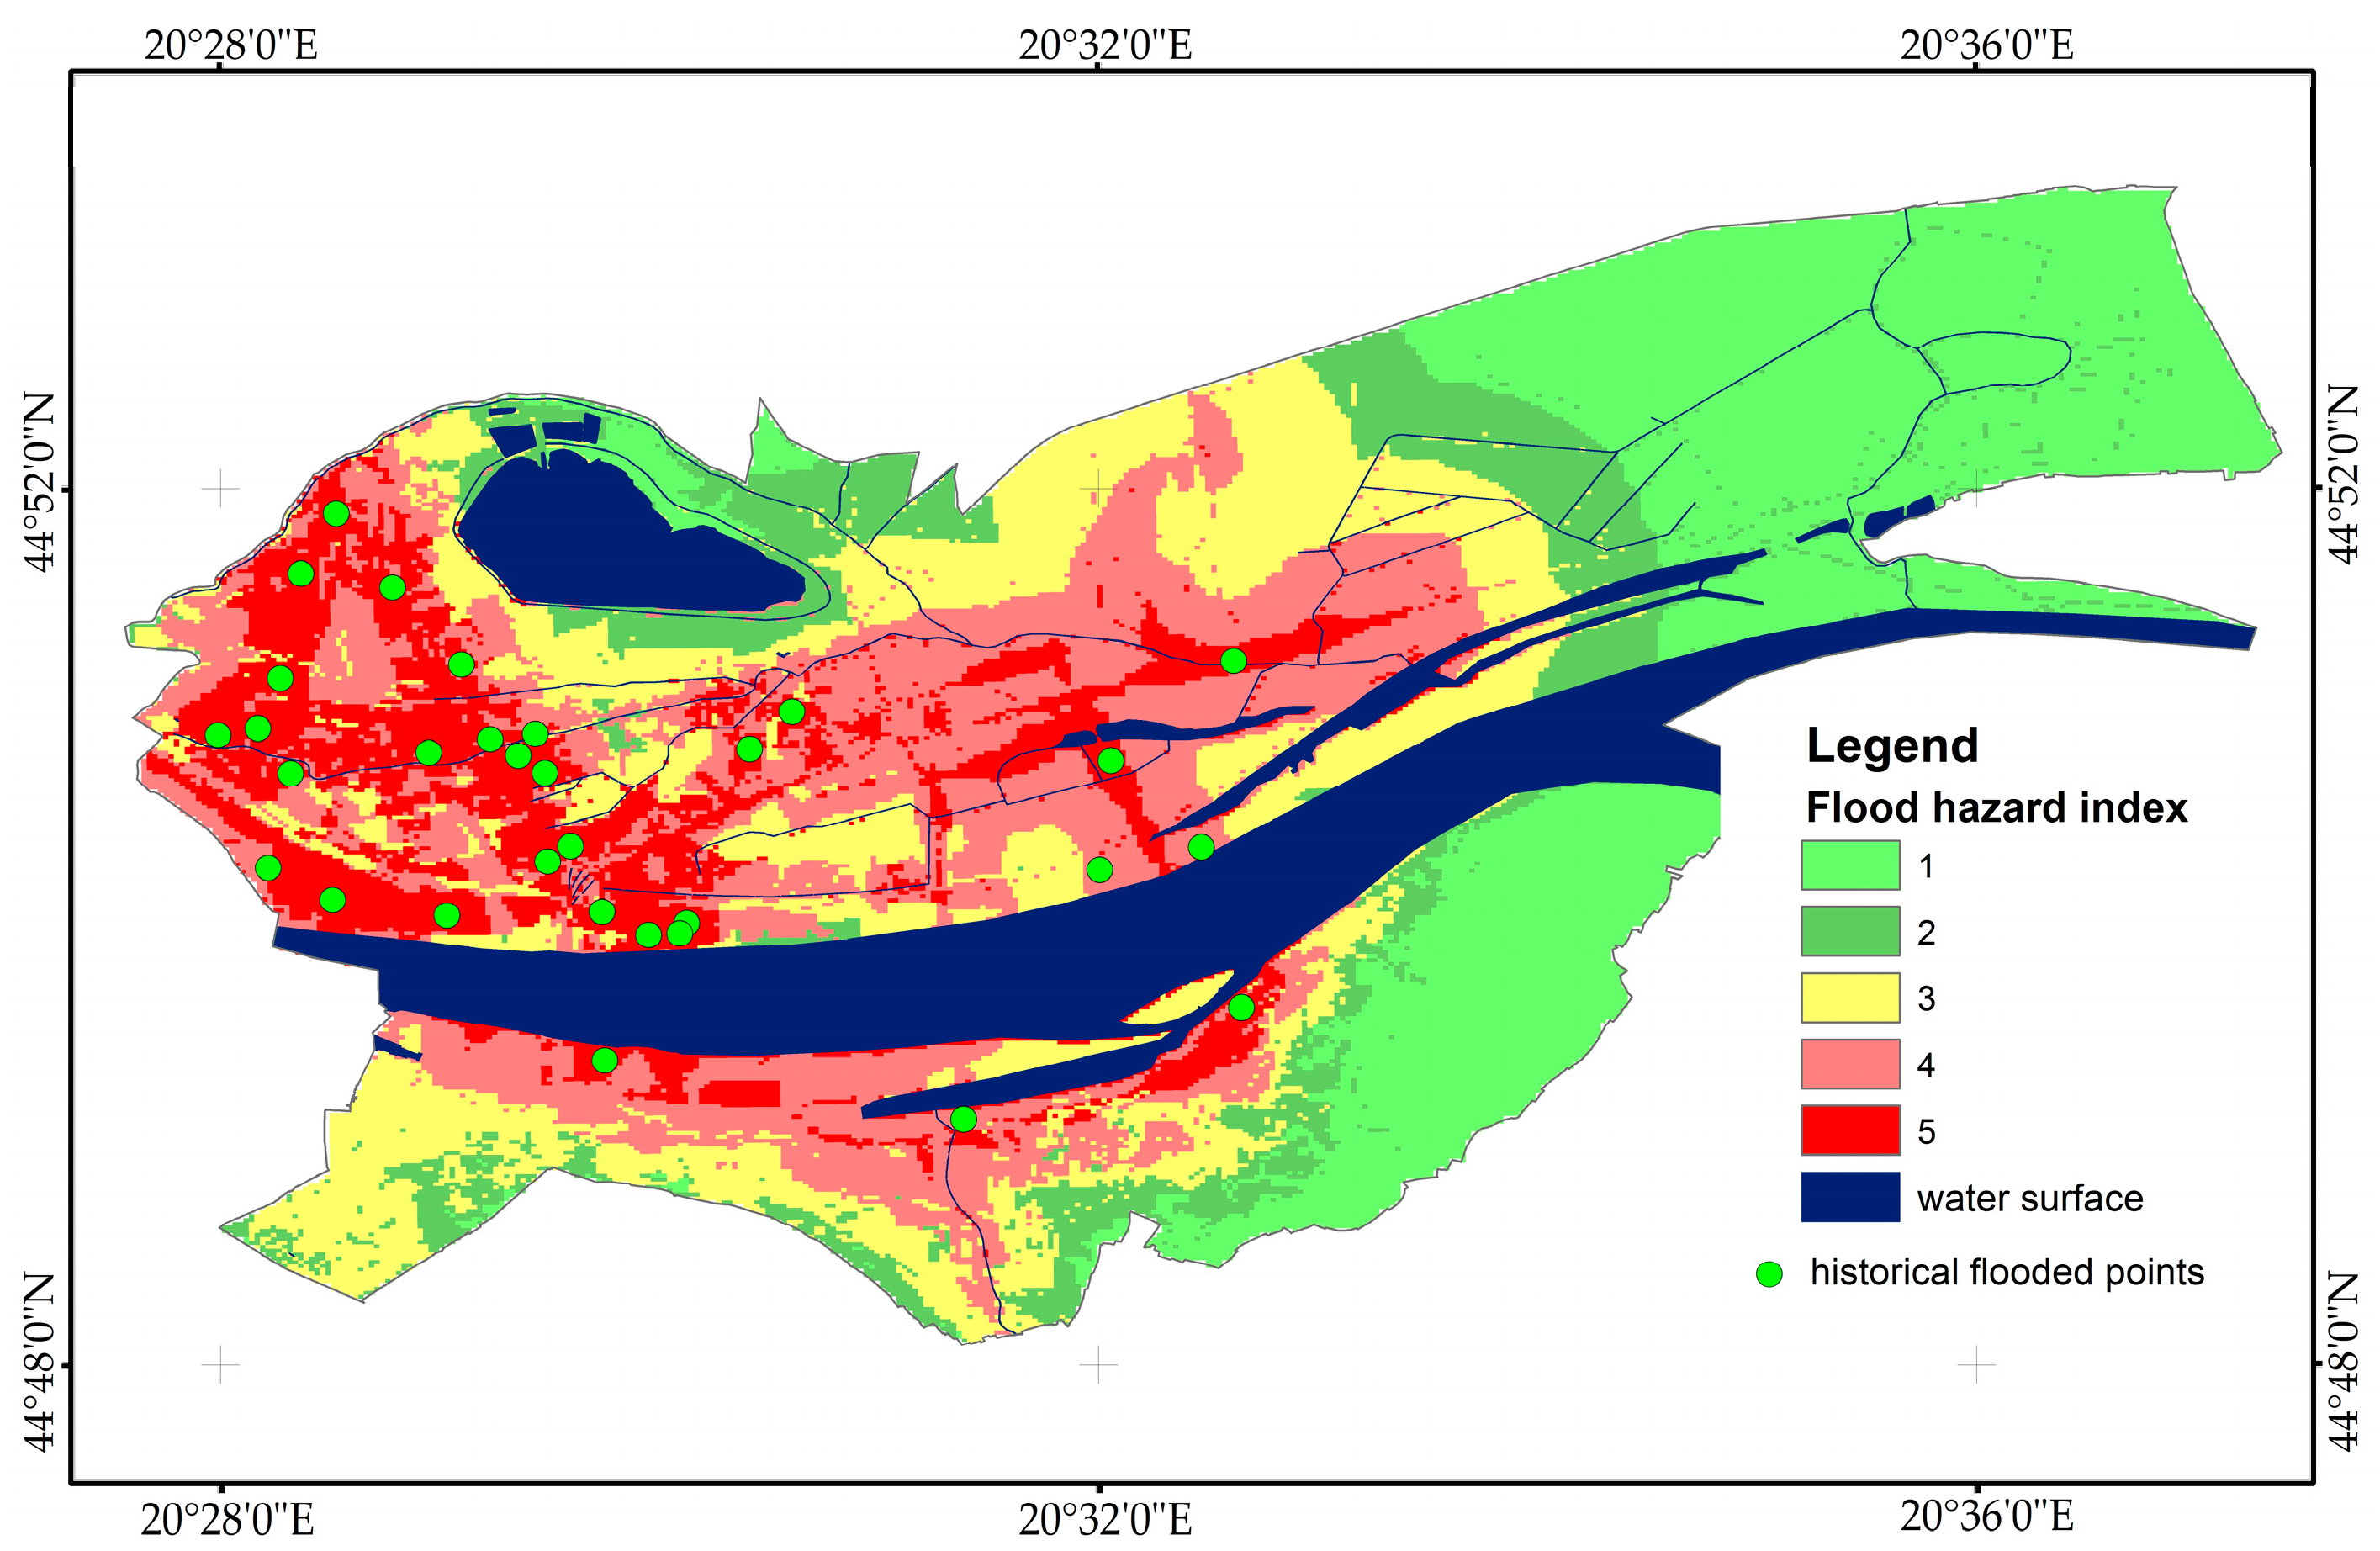

| 1 | 2 | 3 | 4 | 5 | 6 | 7 | 8 | 9 | 10 | |
|---|---|---|---|---|---|---|---|---|---|---|
| RI | 0.00 | 0.00 | 0.52 | 0.89 | 1.11 | 1.25 | 1.35 | 1.40 | 1.45 | 1.49 |
| Criteria | Fuzzy Membership Function | Control Points/Value Points | Final Utility |
|---|---|---|---|
| Elevation (C1) | Linear monotonically decreasing | c = 50 m; d = 300 m | 0–50 m equal to 1, 50–300 m between 1 and 0, more than 300 m equal to 0 |
| Slope (C2) | Linear monotonically decreasing | c = 1°; d = 35° | 0°–1° equal to 1, 1°–30° between 1 and 0, more than 35° equal to 0 |
| Distance from drainage network (C3) | Linear monotonically decreasing | c = 100 m; d = 2000 m | 0–100 m equal to 1, 100–2000 m between 1 and 0, more than 2000 m equal to 0 |
| Distance from water surfaces (C4) | Linear monotonically decreasing | c = 100 m; d = 2000 m | 0–100 m equal to 1, 100–2000 m between 1 and 0, more than 2000 m equal to 0 |
| Water table(C5) | Linear monotonically decreasing | c = 100 cm; d = 5000 cm | 0–100 cm equal to 1, 100–4000 cm between 1 and 0, more than 5000 cm equal to 0 |
| Land cover use (C6) | Discrete categorical data | Water areas equal 1; wetlands equal 0.9; urbanized areas equal 0.8; industrial areas equal 0.7; agriculture equals 0.5; land covered with sparse vegetation equals 0.4; grass and parks equal 0.2; forests equal 0.1 | |
| Expert 1 | ||||||
| C1 | C2 | C3 | C4 | C5 | C6 | |
| C1 | (1.00;1.00) | (0.13;0.14) | (5;7) | (0.2;0.25) | (4;5) | (0.13;0.14) |
| C2 | (8;7) | (1.00;1.00) | (9;9) | (2;3) | (9;9) | (1.00;1.00) |
| C3 | (0.2;0.14) | (0.11;0.11) | (1.00;1.00) | (0.11;0.13) | (0.25;0.33) | (0.11;0.11) |
| C4 | (5;4) | (0.5;0.33) | (9;8) | (1.00;1.00) | (7;8) | (0.25;0.33) |
| C5 | (0.25;0.2) | (0.11;0.11) | (4;3) | (0.14;0.13) | (1.00;1.00) | (0.11;0.13) |
| C6 | (8;7) | (1.00;1.00) | (9;9) | (4;3) | (9;8) | (1.00;1.00) |
| … | ||||||
| Expert 10 | ||||||
| C1 | C2 | C3 | C4 | C5 | C6 | |
| C1 | (1.00;1.00) | (0.14;0.11) | (1.00;1.00) | (0.2;0.25) | (6;7) | (0.14;0.11) |
| C2 | (7;9) | (1.00;1.00) | (7;8) | (3;4) | (9;9) | (1;2) |
| C3 | (1.00;1.00) | (0.14;0.13) | (1.00;1.00) | (0.2;0.25) | (7;8) | (0.14;0.13) |
| C4 | (5;4) | (0.33;0.25) | (5;4) | (1.00;1.00) | (9;8) | (0.33;0.25) |
| C5 | (0.14;0.17) | (0.11;0.11) | (0.14;0.13) | (0.11;0.13) | (1.00;1.00) | (0.11;0.13) |
| C6 | (7;9) | (1;0.5) | (7;8) | (3;4) | (9;8) | (1.00;1.00) |
| Expert | CRe | CRe' | CRe | wke |
|---|---|---|---|---|
| E 1 | 0.022 | 0.088 | 0.055 | 0.102 |
| E 2 | 0.071 | 0.087 | 0.079 | 0.071 |
| E 3 | 0.035 | 0.064 | 0.049 | 0.114 |
| E 4 | 0.081 | 0.067 | 0.074 | 0.076 |
| E 5 | 0.022 | 0.051 | 0.036 | 0.155 |
| E 6 | 0.083 | 0.067 | 0.075 | 0.075 |
| E 7 | 0.037 | 0.071 | 0.054 | 0.105 |
| E 8 | 0.031 | 0.065 | 0.048 | 0.118 |
| E 9 | 0.044 | 0.057 | 0.050 | 0.112 |
| E 10 | 0.092 | 0.067 | 0.079 | 0.071 |
| C1 | C2 | C3 | ... | C6 | |
|---|---|---|---|---|---|
| C1 | ([1.00,1.00],[1.00,1.00]) | ([0.59,4.41],[0.50,3.69]) | ([0.26,1.08],[0.26,1.34]) | ... | ([0.29,1.84],[0.29,2.43]) |
| C2 | ([0.27,1.89],[0.28,2.27]) | ([1.00,1.00],[1.00,1.00]) | ([4.79,6.87],[4.74,6.72]) | ([0.28,2.48],[0.36,2.77]) | |
| C3 | ([0.12,0.16],[0.13,0.19]) | ([0.31,2.06],[0.27,2.29]) | ([1.00,1.00],[1.00,1.00]) | ([1.23,6.30],[1.37,6.47]) | |
| C4 | ([4.79,6.87],[4.74,6.72]) | ([3.16,7.00],[3.82,7.13]) | ([6.36,8.31],[5.51,7.62]) | ([0.16,0.43],[0.15,0.32]) | |
| C5 | ([0.16,0.43],[0.15,0.32]) | ([0.72,5.73],[0.71,6.00]) | ([1.57,4.45],[1.42,4.86]) | ([0.41,4.01],[0.37,4.01]) | |
| C6 | ([0.25,1.63],[0.22,1.85]) | ([0.68,6.23],[0.65,5.88]) | ([1.04,5.02],[0.86,5.31]) | ([0.68,6.23],[0.65,5.88]) | |
| C7 | ([0.61,1.76],[0.45,1.41]) | ([1.67,6.96],[1.31,6.45]) | ([4.94,8.18],[4.36,7.69]) | ([1.00,1.00],[1.00,1.00]) |
| C1 | C2 | C3 | … | C6 | |
|---|---|---|---|---|---|
| C1 | ([0.05,0.24],[0.04,0.26]) | ([0.02,0.09],[0.02,0.09]) | ([0.02,0.53],[0.02,0.45]) | … | ([0.01,0.51],[0.02,0.51]) |
| C2 | ([0.06,0.3],[0.05,0.36]) | ([0.04,0.74],[0.04,0.94]) | ([0.02,0.69],[0.02,0.74]) | ([0.03,0.58],[0.04,0.73]) | |
| C3 | ([0.03,0.05],[0.03,0.06]) | ([0.02,0.06],[0.02,0.08]) | ([0.01,0.25],[0.01,0.28]) | ([0.01,0.11],[0.01,0.18]) | |
| C4 | ([0.16,0.4],[0.14,0.43]) | ([0.14,0.39],[0.14,0.42]) | ([0.09,0.85],[0.12,0.88]) | ([0.05,1.22],[0.06,1.27]) | |
| C5 | ([0.04,0.22],[0.04,0.27]) | ([0.02,0.17],[0.02,0.13]) | ([0.03,0.12],[0.03,0.12]) | ([0.02,0.78],[0.02,0.79]) | |
| C6 | ([0.06,0.31],[0.05,0.37]) | ([0.03,0.64],[0.03,0.77]) | ([0.02,0.75],[0.02,0.72]) | ([0.04,0.19],[0.04,0.2]) | |
| C7 | ([0.13,0.4],[0.11,0.43]) | ([0.08,0.69],[0.06,0.59]) | ([0.05,0.84],[0.04,0.79]) | ([0.05,1.08],[0.04,1.07]) |
| Criteria | Interval Rough Approach | Fuzzy Approach | Crisp Approach | |||
|---|---|---|---|---|---|---|
| IRN(wj) | Rank | Fuzzy (wj) | Rank | Crisp (wj) | Rank | |
| C1 | ([0.02,0.27],[0.02,0.3]) | 5 | (0.08,0.12,0.16) | 5 | 0.122 | 5 |
| C2 | ([0.03,0.43],[0.04,0.5]) | 2 | (0.11,0.19,0.21) | 2 | 0.203 | 2 |
| C4 | ([0.09,0.68],[0.09,0.7]) | 6 | (0.04,0.08,0.07) | 6 | 0.259 | 6 |
| C5 | ([0.01,0.1],[0.01,0.12]) | 1 | (0.25,0.32,0.55) | 1 | 0.120 | 1 |
| C6 | ([0.02,0.34],[0.02,0.35]) | 4 | (0.07,0.14,0.15) | 4 | 0.137 | 4 |
| C7 | ([0.03,0.42],[0.03,0.43]) | 3 | (0.12,0.15,0.19) | 3 | 0.159 | 3 |
| Definition | Crisp Scale | Fuzzy Scale |
|---|---|---|
| Equal importance | 1 | (1,1,1) |
| Somewhat more important | 3 | (2,3,4) |
| Much more important | 5 | (4,5,6) |
| Very much more important | 7 | (6,7,8) |
| Absolutely more important | 9 | (8,9,9) |
| Intermediate values | 2, 4, 6, 8 | (x − 1, x, x+1) |
| Flood Hazard Index | Scenario 1 IR’AHP | Scenario 2 F’AHP | Scenario 3 Crisp AHP | ||||
|---|---|---|---|---|---|---|---|
| (km2) | % | (km2) | % | (km2) | % | ||
| FHI 5 | Very high | 12.9 | 18.5 | 8.8 | 12.6 | 7.8 | 11.2 |
| FHI 4 | High | 16.2 | 23.2 | 20.7 | 29.6 | 24.9 | 35.6 |
| FHI 3 | Moderate | 15.1 | 21.6 | 17.2 | 24.6 | 15.3 | 21.9 |
| FHI 2 | Low | 8.5 | 12.2 | 14.7 | 21.0 | 12.2 | 17.5 |
| FHI 1 | Very low | 17.2 | 24.6 | 8.5 | 12.2 | 9.7 | 13.9 |
| Scenarios | Historically-Flooded Points | Flood Hazard Index (FHI) | ||||
|---|---|---|---|---|---|---|
| 5 | 4 | 3 | 2 | 1 | ||
| 1 IR’AHP | 31 | 27 (87.1%) | 4 (12.9%) | 0 | 0 | 0 |
| 2 F’AHP | 31 | 21 (67.7%) | 9 (29.0%) | 1(3.2%) | 0 | 0 |
| 3 AHP (crisp) | 31 | 17 (54.8%) | 10 (32.3%) | 4 (12.9%) | 0 | 0 |
| Land Cover/Infrastructure | Unit | Flood Hazard Index | ||||
|---|---|---|---|---|---|---|
| 5 | 4 | 3 | 2 | 1 | ||
| Urban areas | km2 | 7.85 | 6.42 | 3.90 | 12.84 | 0.57 |
| Grassland | km2 | 0.12 | 0.32 | 0.53 | 0.60 | 0.96 |
| Forests | km2 | 0.24 | 0.63 | 1.69 | 0.81 | 2.38 |
| Scrub | km2 | 0.17 | 0.29 | 0.31 | 0.18 | 0.12 |
| Arable land | km2 | 2.06 | 7.85 | 6.42 | 3.90 | 12.84 |
| Industrial areas | km2 | 0.34 | 0.99 | 0.45 | 0 | 0 |
| Parks | km2 | 0.009 | 0.45 | 0.086 | 0.107 | 0.003 |
| Marshes | km2 | 0.92 | 0.22 | 0.02 | 0 | 0 |
| Schools and universities | No. | 11 | 17 | 9 | 6 | 0 |
| Kindergartens | No. | 9 | 8 | 5 | 2 | 0 |
| Residential buildings | No. | 540 | 407 | 449 | 114 | 25 |
| Industrial buildings | No. | 11 | 13 | 6 | 0 | 0 |
| Medical facilities | No. | 4 | 1 | 1 | 0 | 0 |
| Roads | km | 36.77 | 38.54 | 32.30 | 16.94 | 20.80 |
| Railroads | km | 0.64 | 2.26 | 3.44 | 0.74 | 0.83 |
| Population | thousands | 41,565 | 31,108 | 18,568 | 11,540 | 7856 |
© 2017 by the authors. Licensee MDPI, Basel, Switzerland. This article is an open access article distributed under the terms and conditions of the Creative Commons Attribution (CC BY) license (http://creativecommons.org/licenses/by/4.0/).
Share and Cite
Gigović, L.; Pamučar, D.; Bajić, Z.; Drobnjak, S. Application of GIS-Interval Rough AHP Methodology for Flood Hazard Mapping in Urban Areas. Water 2017, 9, 360. https://doi.org/10.3390/w9060360
Gigović L, Pamučar D, Bajić Z, Drobnjak S. Application of GIS-Interval Rough AHP Methodology for Flood Hazard Mapping in Urban Areas. Water. 2017; 9(6):360. https://doi.org/10.3390/w9060360
Chicago/Turabian StyleGigović, Ljubomir, Dragan Pamučar, Zoran Bajić, and Siniša Drobnjak. 2017. "Application of GIS-Interval Rough AHP Methodology for Flood Hazard Mapping in Urban Areas" Water 9, no. 6: 360. https://doi.org/10.3390/w9060360
APA StyleGigović, L., Pamučar, D., Bajić, Z., & Drobnjak, S. (2017). Application of GIS-Interval Rough AHP Methodology for Flood Hazard Mapping in Urban Areas. Water, 9(6), 360. https://doi.org/10.3390/w9060360