Article

Recent Sedimentation Rates of Shallow Lakes in the Middle and Lower Reaches of the Yangtze River: Patterns, Controlling Factors and Implications for Lake Management

1
State Key Laboratory of Lake Science and Environment, Nanjing Institute of Geography and Limnology, Chinese Academy of Sciences, Nanjing 210008, China
2
School of Geographical Sciences, Guangzhou University, Guangzhou 510006, China
3
University of Chinese Academy of Sciences, Beijing 100049, China
4
Aarhus Institute of Advanced Studies, Aarhus University, Aarhus C 8000, Denmark
5
State Key Laboratory of Geobiology and Environmental Geology, Faculty of Earth Sciences, China University of Geosciences (Wuhan), Wuhan 430074, China
6
College of Harbor, Coastal and Offshore Engineering, Hohai University, Nanjing 210098, China
7
School of Environment and Planning, Liaocheng University, Liaocheng 252059, China
8
Department of Bioscience, Aarhus University, DK-8600 Silkeborg, Denmark
9
Sino-Danish Centre for Education and Research (SDC), Beijing 100049, China
*
Authors to whom correspondence should be addressed.
Water 2017, 9(8), 617; https://doi.org/10.3390/w9080617
Submission received: 7 June 2017 / Revised: 10 August 2017 / Accepted: 10 August 2017 / Published: 17 August 2017
(This article belongs to the Special Issue Ecological Responses of Lakes to Climate Change)

Abstract

:
Significantly increased sedimentation rates (SRs) in lakes worldwide in recent decades due to higher inputs of silt and eutrophication have led to significant environmental problems such as lake size diminishment and degraded water quality. Many lakes in the middle and lower reaches of the Yangtze River basin (MLYB) have followed this pattern. For effective lake management, it is essential to understand the pattern and drivers of SRs in these lakes. Fourteen typical lakes in the MLYB were chosen to examine the spatiotemporal patterns of SRs and identify the drivers over different time periods. Since 1900, SRs increased from <0.2 to 0.3–0.6 g·cm−2·year−1, particularly notable during 1930–1990. Combined with climatic factors, SR correlated negatively with lake (catchment) size and abundance of aquatic vegetation, whereas other lake features including nutrient status did not contribute significantly to the variation in SRs, due to the fast decomposition processes of organic matter in shallow lakes. Detrimental land use practices especially reclamation for croplands and rapid urbanization was revealed to elevate SRs pronouncedly. We propose various management strategies aiming to maintain SR reference condition at ~0.16 ± 0.08 g·cm−2·year−1, which is analogous to the SR value between 1850 and 1900.

1. Introduction

Shallow lakes are vitally important ecosystems with great heritage, ecological and aesthetic values [1,2]. However, over the past decades, the water quality and ecological function of shallow lakes in many regions of the world have experienced major degradation due to intense human disturbance and climate change [3,4,5,6]. Environmental problems such as loss of biodiversity, eutrophication, acidification and food web alterations, affecting the water quality and ecology of the lakes, have been addressed by many studies [7,8,9]. Less focus has been directed toward the problem of siltation of lakes and its ecological consequences. A sharp increase in sediment deposition has occurred in many lakes worldwide over the past ca. 100 years [10,11,12]. Large-scale surveys of European lakes, for example, have shown a general acceleration of sedimentation during the second half of the 20th century [12,13], and investigations conducted in lakes in western Canada (>100 lake catchments) have also demonstrated a trend towards increasing sedimentation since the 1950s [14]. Similarly, the lakes in the Yangtze River floodplain (Southeast of China)—one of the largest floodplains in the world—are undergoing enhanced swamping and silting, which poses a great threat to ecological and social security [15,16].
Both the geographic features of the lake and various external factors can exert influence on lake sedimentation processes, and hence, its sedimentation rates (SRs). Geomorphic features, such as the size of the lake and/or catchment, latitude, altitude and maximum water depth, are important as they affect the biogeochemical cycles, water circulation as well as the main sediment source into lakes [10,11,12,17,18]. Climate is also regarded as an important factor as the change in rainfall and temperature can alter runoff, soil erosion and biogeochemical processes with impacts on lake sedimentation [4,10,19]. Furthermore, human activities have been recognized as a key driver of sedimentation processes in the past century due to sewage input, land use changes and hydrological regulation [4,14,20]. Combined with natural environmental changes, human impacts pose a greater threat to the functioning of lake ecosystems by creating unfavorable lake environments such as increased sedimentation, reduced storage capacity, widespread flooding, often accompanied by enhanced nutrient levels and metal pollution [12,16,21,22,23,24,25,26].
The middle and lower reaches of the Yangtze River basin (MLYB), one of the most developed areas in China, are rich in shallow lakes. Many of these lakes are important sources of drinking water or aquaculture activities but have undergone serious deterioration in water quality and ecological degradation [15]. The sedimentation processes and patterns of these lakes are regulated by both natural variability (e.g., climate and frequent flooding) and human disturbances (land reclamation and deforestation). In recent decades, the sedimentation rates in some of the MLYB lakes have increased, coinciding with increased ecological degradation [27,28,29]. The mechanisms behind this increase differ among lakes. Xiang et al. [28] found higher sedimentation rates in lakes situated in areas with soil erosion, are likely triggered by land reclamation for agricultural purposes. Accordingly, in the Jianghan Plain and Dongting lake area, Du et al. [16] concluded that land reclamation had led to increased sediment deposition, further reducing lake size and thereby affecting flood control, with consequent negative ecological impacts since 1950. By contrast, Wu et al. [27] found that the building of water conservancy facilities (e.g., sluice gates) affected sedimentation rates by controlling the outflow/inflow of sediments or changing the hydrodynamic force (due to the changes in water flow rates) for particle deposition. Yao and Xue [30] pointed out that the sediment accumulation rates in the large-sized lakes in MLYB generally do not reflect the catchment erosion history but that relatively small lakes are sensitive to catchment disturbance [29]. In most situations, land use intensity and fresh water use, which may affect sedimentation rates, are decisive for the water quality and ecological functioning of lakes in MLYB, and significant changes in eutrophication and unsustainable land use practices have become a widespread problem, in particular since the reform and opening-up policy era, i.e., 1980s [8,31,32,33]. Consequently, the time window “1980s–2000s”, have always been focused on, with the aim to examine changes in different types of land use and their effects on lake sedimentation rates to guide lake managers. Such studies have highlighted the effects of sedimentation rates on the MLYB lakes produced by recent land use change at catchment scale; however, a comprehensive analysis of the pattern and drivers at various spatiotemporal scales is still not available.
Enhanced knowledge of the lake sedimentation process driven by multiple stressors would provide important information for lake managers. In recent years, the concept “catchment management” has been adapted by many lake managers and local governments and the concept of “reference conditions” is becoming increasingly relevant for lake managers [34,35,36]. Reference conditions are defined by the European Union [37] as the environmental state existing before major human modifications; and the current state can be evaluated relative to these conditions before implementing restorative actions. In Europe, most studies show the first clear evidence of effects by human activities on sediments from 1850 onwards, meaning that the state pre-1850 can be used as reference condition [12,38]. In China, although there is a long history (>6000 year) of agricultural cultivation in MLYB, the massive human disturbance (i.e., industrialization) gradually increased only after the 1900s [39]. Thus, in this paper, the state pre-1900 is used as the reference condition for sedimentation rates in MLYB. Identification of reference conditions will undoubtedly benefit the management programs of lakes in the Yangtze River basin.
To gain better knowledge of the spatiotemporal pattern of sedimentation rates in MLYB lakes, we collected sediment from 14 representative lakes (Figure 1). All of the lakes are shallow but vary greatly relative to their geographic characteristics and catchment background (i.e., lake area, lake morphology, social-economic development level, vegetation coverage, and land use type) and thus represent most of the lake types occurring in MLYB. In this paper, we attempt to: (1) reveal the spatial (within and among lakes) and temporal (since the 1850s and since the 1980s) pattern of sedimentation rates for various shallow lakes; (2) explore the controlling factors of the sedimentation rate patterns in this region, with special reference given to the effect of land use change from 1980 to 2000 (an important period of local economic development and urbanisation), and to the effect of climate change over the past 150 years; and (3) define reference conditions for the MLYB lakes to assist local as well as regional lake management. A comprehensive understanding of the processes of sedimentation will undoubtedly provide better guidance for aquatic ecosystem assessment and restoration in the region and elsewhere.

2. Materials and Methods

2.1. Study Region

The MLYB is an area of low relief, with elevations ranging from 3 to 5 m above mean sea level. It contains more than 600 lakes with an area over 1 km2. The average depth of the MLYB is about 2 m, covering a total area of 18,400 km2 [1]. Located in a region affected by the East Asian monsoon, with a mean annual temperature of 14–18 °C and annual precipitation of 1000–1600 mm per year, the area is characterized by cold and dry winters and hot and wet summers, rendering it a prone to flooding zone. Traditional land uses are agriculture, forestry, paddies and urban settlements. The past 100 years, particularly the recent 30 years, have seen rapid growth of the local population and fast economic development in the study region; the consequent expansion of material and recreational needs has changed the land use, causing increased soil erosion in the catchment [16,30,40]. At the same time, the construction of water conservation facilities has altered the original connectivity of the Yangtze River, creating a sharp rise in sediment accumulation rates and loss of water volume in lakes [41]. A total of 14 studied lakes (Figure 1) covering major gradients in lake geographic features and land use types were selected in MLYB [1]. The selected lakes were shallow (average depth 1.2 to 4.2 m) but varied widely in area (11.8–2425 km2), catchment size (232–36,500 km2), volume (0.03–5.14 × 10⁹ m3), distance to Yangtze River (0.44–125.58 km), vegetation abundance (1–5 classes) (Table 1) and socioeconomic condition (data source: Lake-Watershed Science Data Center, Data Sharing Infrastructure of Earth System Science, National Science & Technology Infrastructure of China [42]).

2.2. Field and Laboratory Methods

One to three sediment cores were collected from the deepest part of each lake using a Kajak gravity corer. All cores were sectioned at 0.5 cm intervals in the field from the top to 50 cm depth, and 1 cm below. The subsamples were preserved below 4 °C for subsequent analyses. 210Pb, 137Cs and 226Ra were determined for all the sediment samples from all the cores using EG & G Ortec Gamma Spectrometer at the Nanjing Institute of Geography and Limnology Chinese Academy of Sciences, China. The 137Cs measurement was undertaken at 662 keV, while 210Pb was determined via gamma emission at 46.5 keV and 226Ra at 295 and 352 ke γ-rays emitted by its daughter isotope 214Pb, following three weeks of storage in sealed containers to allow radioactive equilibration. Due to the significant disturbance in the catchment, constant rate of supply (CRS) of the 210Pb model were used for chronology analysis [43,44]. In the Yangtze River basin, considering the complex influence of varied sediment flux, the chronologies were verified using anthropogenic 137Cs activity profiles [45]. Dating sediment cores from shallow lakes using 210Pb can be problematic and we therefore focused on lakes with low dating errors [46].
Sedimentation rate (SR; g·cm−2·year−1) in each core were derived from 210Pb/137Cs dating:
SR = DM/(A × Y)
where DM (g) is the dry mass of each sample; A (cm2) is the Aperture area of the piston corer; and Y (year) is the corresponding time interval for each sample deposited. All sedimentation rates, except the ones in Donghu, Xijiu and Wanghu Lake, were based on our own work, while data on sedimentation rates in Donghu [26], Xijiu [47], Wanghu [48], Longgan Lake (for the cores LGL and LS1, see [49]) and Taihu (for the core DLS, see Shen et al. [50]), were collected from published literature.

2.3. Data Analyses

Data on current lake features for the period from 1990 to 2010 were collected, including: (1) surface area (SA); (2) catchment area (CA); (3) average depth (AD); (4) volume (VL); (5) average length (AL); (6) average width (AW); (7) catchment area: surface area ratio (CA/SA); (8) average length: average width ratio (AL/AW); (9) distance to the Yangtze River (DYR); (10) abundance of aquatic vegetation (AV), ranging from 1 to 5 with “1” (no aquatic plants) to “5” (full coverage of aquatic plants); and (11) trophic status (including annual average total phosphorus, total nitrogen and chlorophyll-a in the water column in the 1990s) (Table 1). The feature data (above data 1–8) were derived from the Scientific Data Sharing Platform of Lake and Watershed [42]; distance to the Yangtze River (above data 9) was measured according to the river channel from the lake to the main stream of Yangtze River by ArcGIS measure tools (ArcGIS 10.2, Esri, Redlands, CA, USA); and the remaining data (above data 10–11) were analyzed with standard methods [51].
Land use data in the catchments for each lake covering the period 1980–2000 were collected from the Data Center for Resources and Environmental Sciences, Chinese Academy of Sciences (1 km grid) [52], and “digital watershed data” for lakes were derived from HydroSHEDS based on DEM data (90 m resolution) [53]. By using ArcGIS 10.2, all data were reclassified into six categories: cropland, forest, grassland, waters, urbanized land and unutilized land (Figure 1); and the quantity (relative area) and change percentage of each category over two periods (1980–1990 and 1990–2000) were also calculated. The change of land use data were calculate d according to the function of 1990s–1980s.
Long-term climatic data, winter, summer and annual average rainfall and temperature over the past 150 years for Longgan Lake and Chaohu Lake were retrieved based on results from the global atmosphere–ocean coupled climate model (ECHO-G) [54]. The 5-Year average climatic data were used here to eliminate the error in climate model calculation and also the results of chronology to compare with the relevant ones of sedimentation rates.
To reveal the factors associated with sedimentation rates, correlation analyses were conducted between various parameters (lake geographic feature, land use change and climatic factors) and corresponding SR variability of each lake (median values, the percentage change and 5-year average SR respectively) in R 3.2 (corrplot package).

2.4. Reference Conditions for Sediment Accumulation Rates

Reference conditions are characterized by minimal disturbance that do not have a significant effect on the ecosystem. Defining the time of the “reference condition” of an ecosystem is subjective according to different management objectives [37]. In this paper, we tried to reveal the ecological reference condition for Yangtze lakes using diatom records derived from previous study [39] and define the state pre-1900 as the reference condition for sedimentation rates in MLYB. By frequency distribution analysis of sedimentation rates (by SPSS, Version 20, IBM Corporation, Armonk, NY, USA) in 14 lakes before 1900, the highest frequency value (expressed as mean and standard deviation) is defined as the reference condition of the sediment accumulation rate in the MLYB lakes.

3. Results

3.1. Dating Results

Generally, most of the cores from the 14 lakes had a relatively simple 210Pb profile spanning the past 150 years (Supplementary Materials, Figure S1). Unsupported 210Pb activity varied greatly among the lakes, ranging from 810 Bq/kg (Chihu Lake) to 230 Bq/kg (Dianshan Lake) at the top layers of the cores. The unsupported 210Pb activity in the cores from Taihu, Zhangdu Lake and Dianshan Lake showed abrupt decreasing trends at 5 cm, 23 cm and 11 cm depths, respectively, while, in other cores, the decay followed a relatively exponential pattern along with depth. Clear spatial variance was observed in the 210Pb activity among cores from the same lake, for instance Taibai Lake, Chaohu Lake, Taihu Lake and Longgan Lake (e.g., unsupported 210Pb activity was less than ~300 Bq/kg in the C20 core taken in 2009 from Chaohu Lake relative to ~800 Bq/kg in the 2007 core). In all the lakes, 137Cs activity versus depth profile exhibited a well-resolved peak corresponding to the 1963 with the occurrence of maximum fallout from the atmospheric weapons testing. However, the activity was relatively weak (less than 20 Bq/kg) in all cores. Sedimentation rates were high (~0.3–1.2 cm/year) in most cores in the recent 50 years and the dating error is therefore low (error increasing with date, typically less than six years in 1950s). The relatively good chronology for sediment cores with high sediment accumulation rates in shallow lakes ensures comparability of sedimentation rates among lakes, although the dating error was higher in the bottom of the core (generally 1 standard deviation of ~20 years in the 1850s).

3.2. Spatiotemporal Pattern of Sedimentation Rates Among Lakes

Sedimentation rates in the fourteen lakes since 1850 are shown in Figure 2a–n, depicting median values in different time periods (Figure 2o). Despite highly variable sedimentation patterns over time, some general trends can be traced. Before 1900, sedimentation rates were relatively low (average ~0.01–0.20 g·cm−2·year−1; “low-value” years) followed by different rates of increase. During 1900–1930, sedimentation rates show a slight increase in all lakes. During 1930–1960, sedimentation rates increased even further, with a small peak in most lakes (e.g., Xijiu, Shitang, Donghu, Zhangdu, Chihu, Dianshan, Longgan and Chaohu Lake), on average ranging from ~0.2 to 0.5 g·cm−2·year−1. In 1960–1990 except for five lakes (Wushan, Taibai, Zhangdu, Longgan and Chaohu Lake), sedimentation rates rose dramatically (“high-value” period), being on average ~0.3 to 0.6 g·cm−2·year−1. After the 1990s, sedimentation rates remained high, with a slightly decreasing trend in some of the lakes (Cehu, Wushan, Chihu, Dianshan, Longgan and Chaohu Lakes). From “1850–1900” to ”1900–1950” and then to “1950–2000”, an increasing trend for median sedimentation rates of each lake is obvious, and the recent sedimentation rates are much higher than in the “low-value” years (Figure 2o).
Sedimentation rates differed among the lakes depending on lake features and local factors. There are decreasing trends for median sedimentation rates in each lake with lake size in the above periods (Figure 2o). Small lakes, such as Cehu, Xijiu, Shitang and Donghu Lake, generally exhibited relatively high sedimentation rates, ranging from ~0.2 to 1.0 g·cm−2·year−1, while large lakes, such as Liangzi, Longgan, Chaohu and Taihu Lake, had sedimentation rates as low as ~0.02–0.2 g·cm−2·year−1. The sedimentation rates in Xijiu, Wushan, Taibai, Liangzi and Longgan Lake, tended to be lower than the general trend, while the sedimentation rates in Donghu Lake was usually higher. The extent of variation in these lakes is not synchronous over time. A sudden decrease in sedimentation rates occurred in Wushan, Taibai, Wanghu, Zhangdu, Longgan and Chaohu Lake in the ~1950s and 1960s (Figure 2c,e,h,l,m).

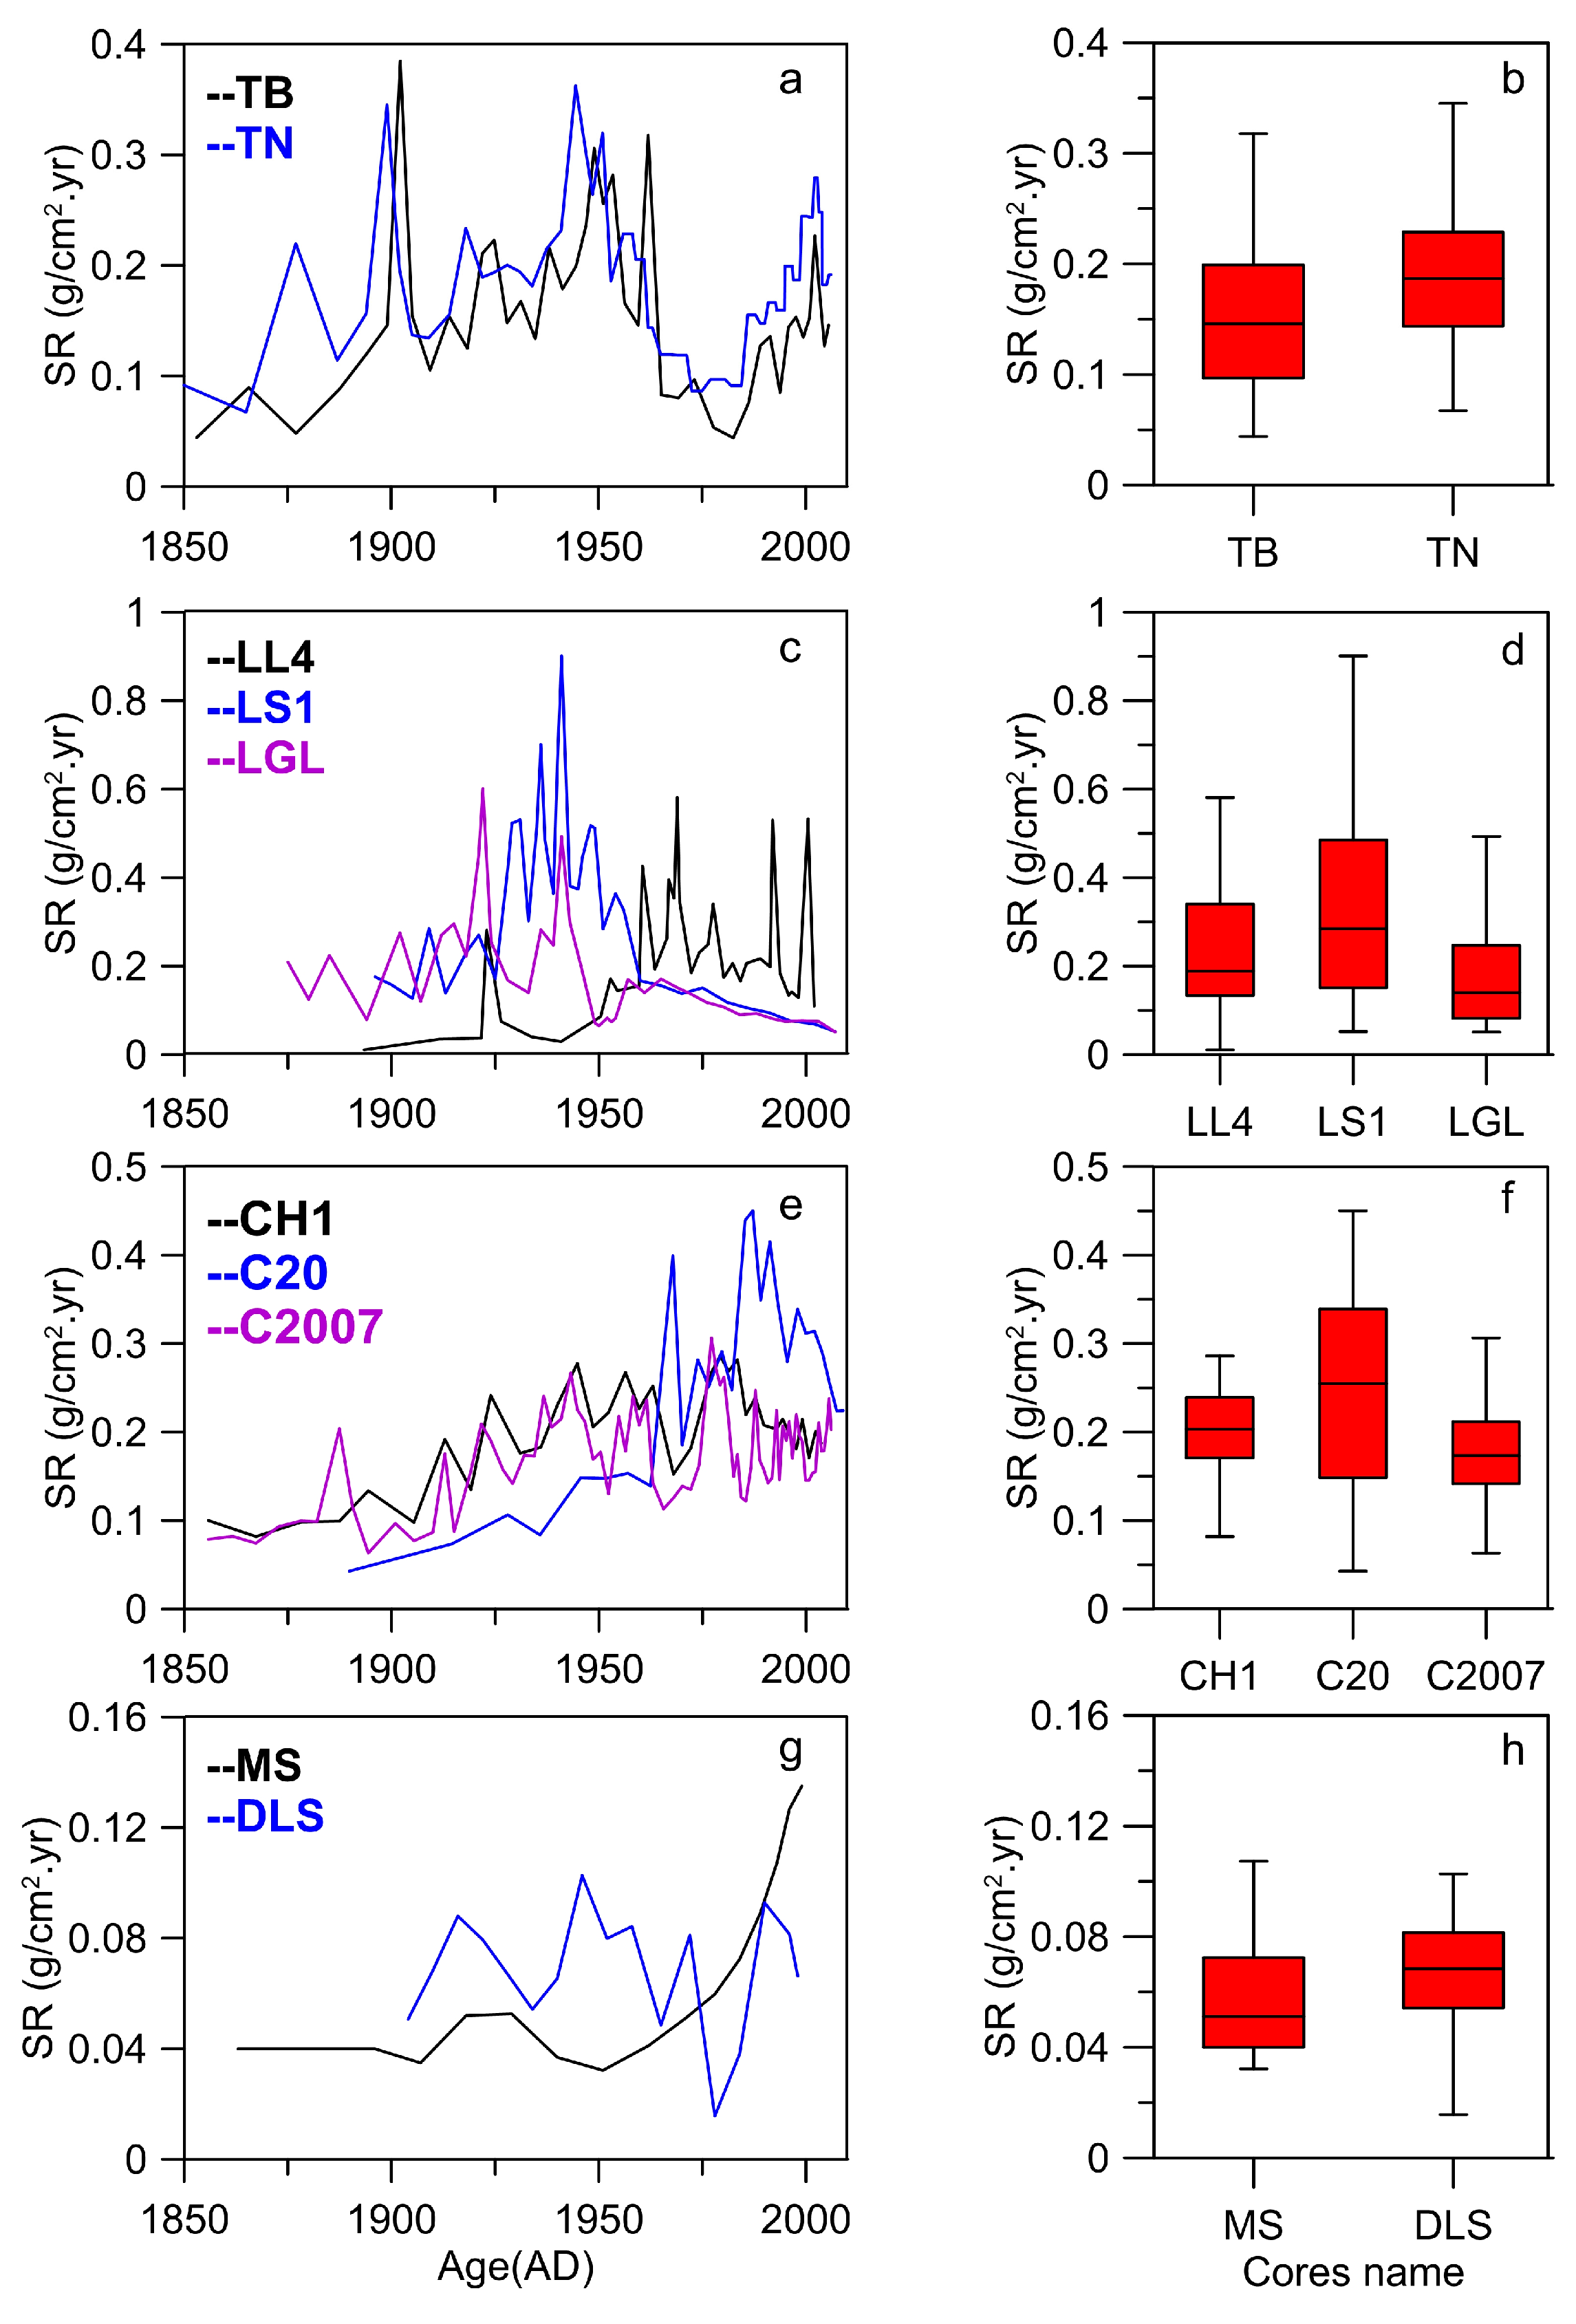
3.3. Sedimentation Rates in Multicores of an Individual Lake

Multicore results on sedimentation rates and median values for Taibai, Longgan, Chaohu and Taihu Lake are illustrated in Figure 3. Cores TB and TN were taken separately from the southern and northern parts of Taibai Lake, which exhibit similar patterns in sedimentation rates with a slight deviation in the time of peak value. Cores LL4, LS1 and LGL were taken from the northern, western and eastern part of Longgan Lake, respectively. Although the amplitude and the timing of the peak for the three cores differ, a pattern of “increase first and decrease in recent years” is identified. As for Chaohu Lake, a similar pattern appeared in the CH1 and C2007 cores (taken from the western part of the lake), but, for C20, an inner-center core, the sedimentation rates showed a high peak in the 1960s and the 1990s, which differ greatly from the other two cores. MS and DLS were northern and southern cores in western Taihu Lake, and the results showed that the sedimentation rates in MS continued to increase over time, while those in DLS exhibited many fluctuations.

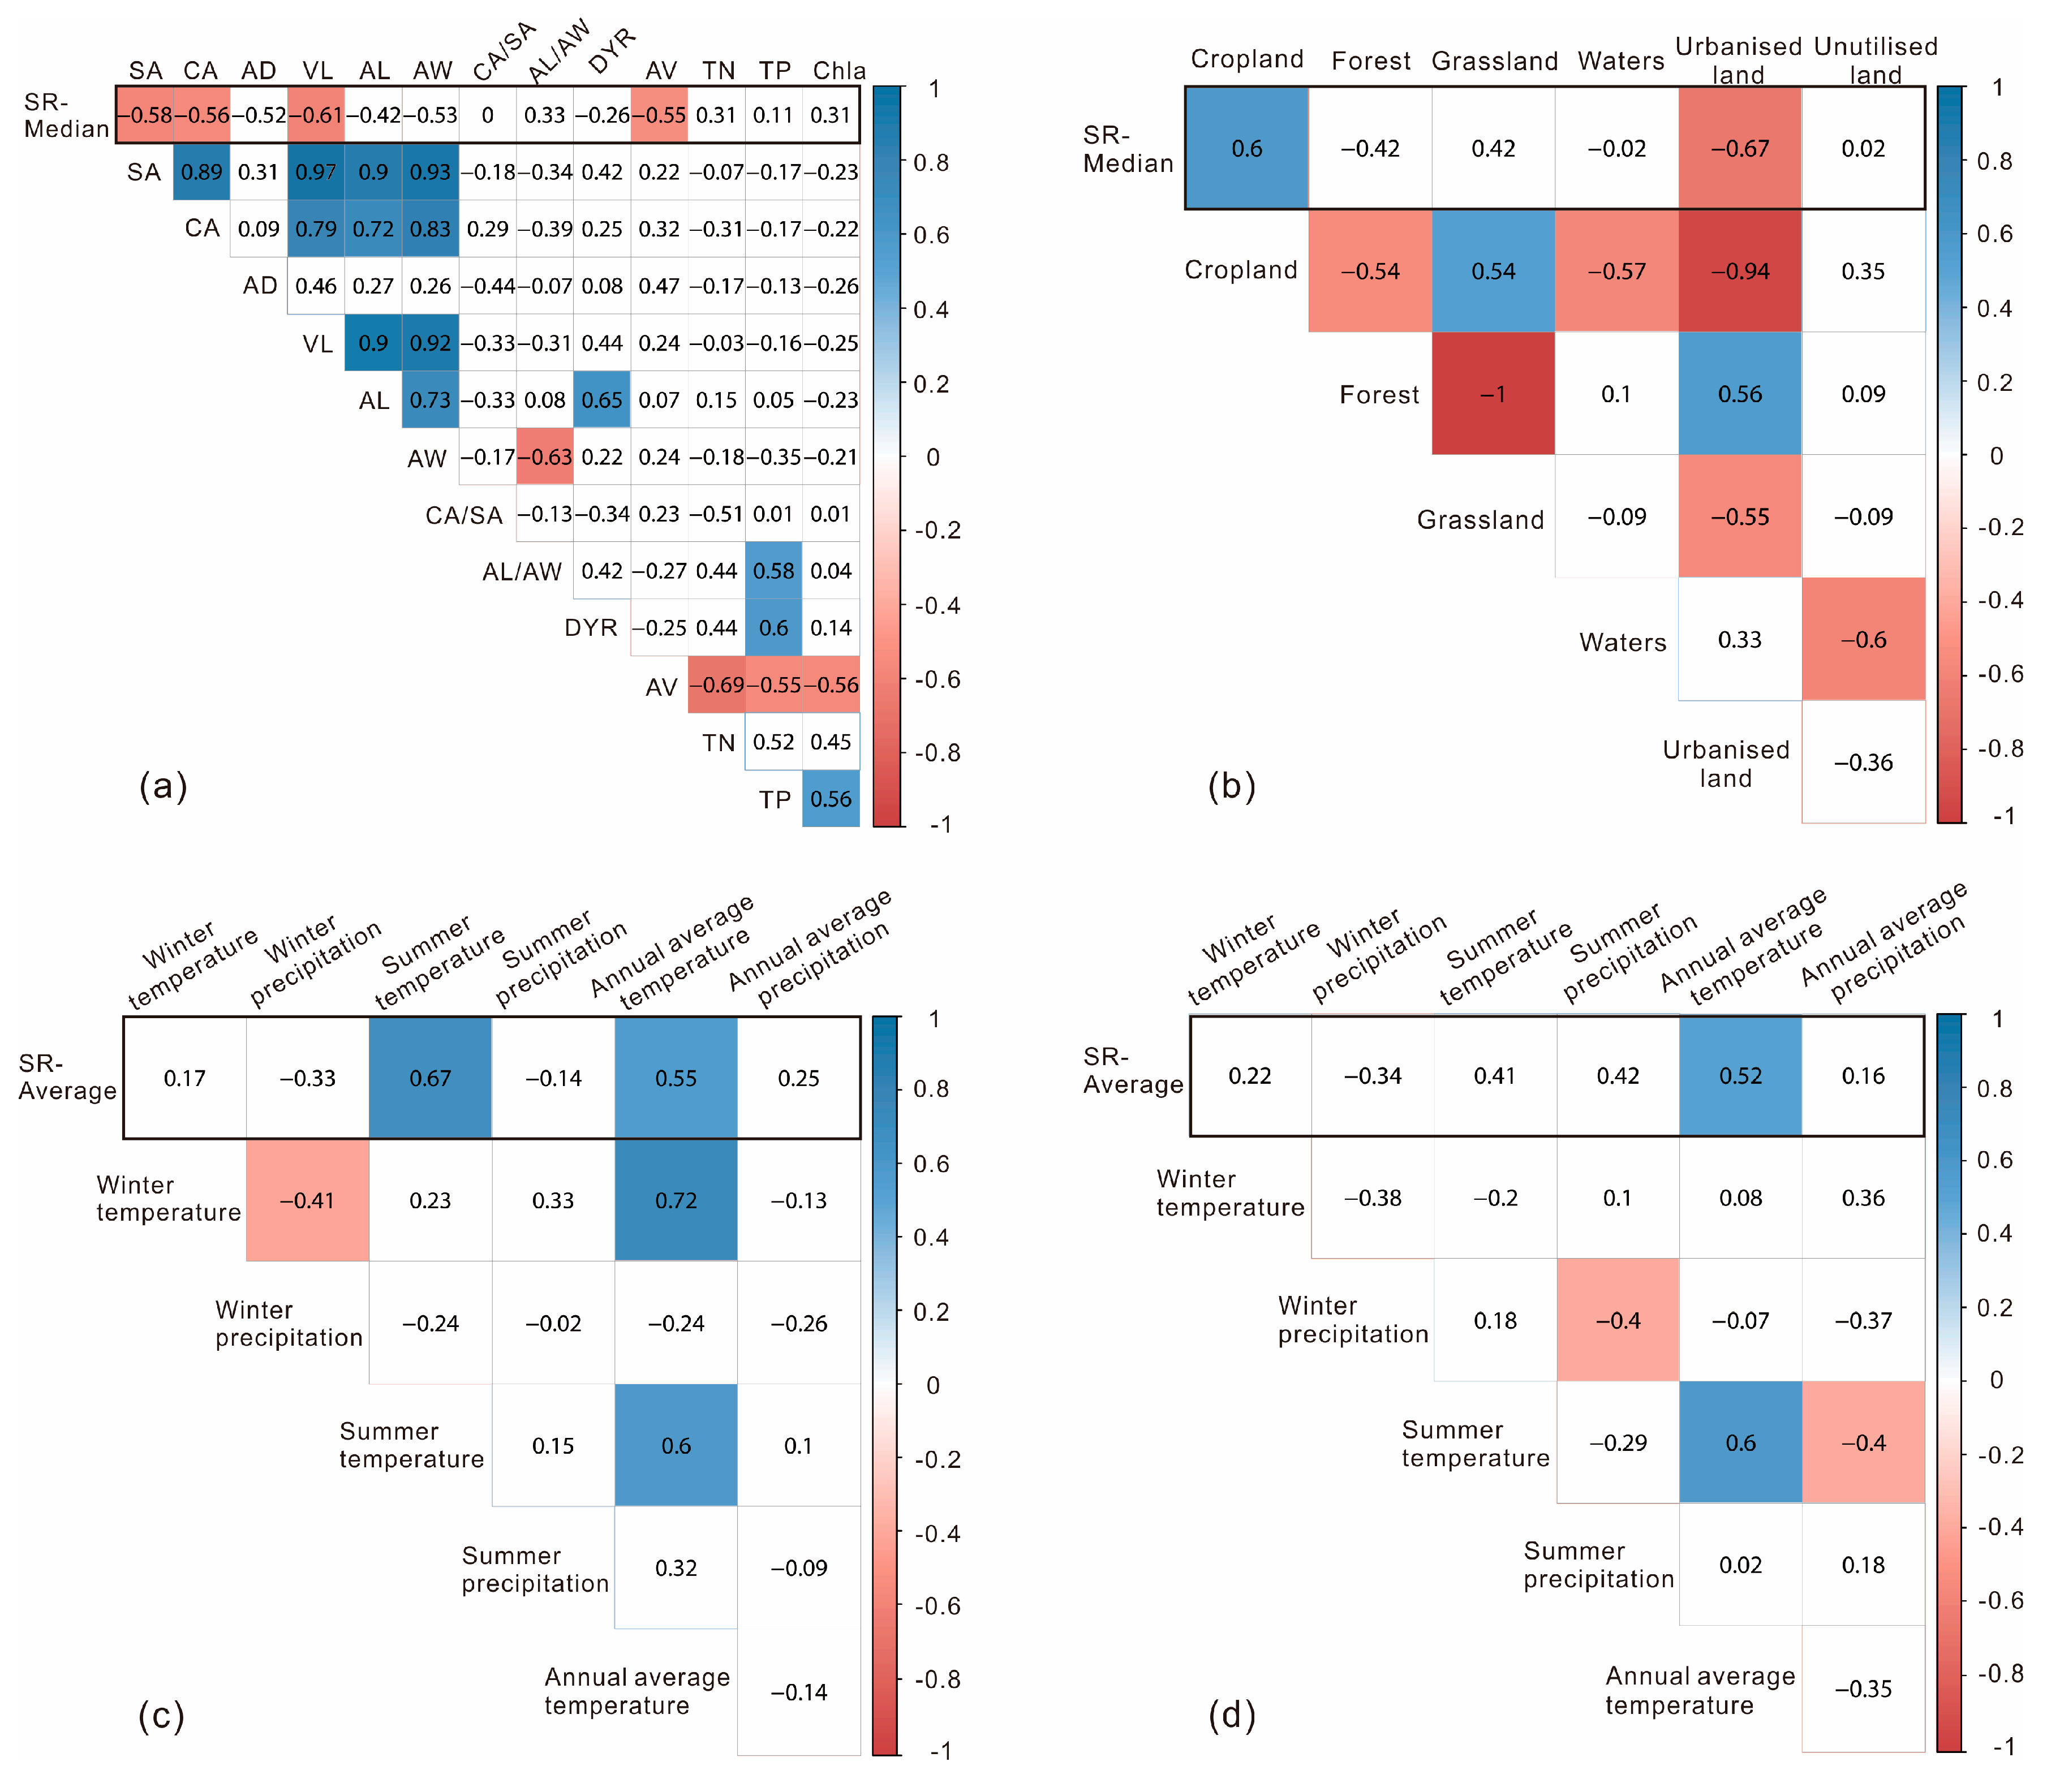
3.4. Factors Controlling Sedimentation Rates Variability

The median SR for the past 20 years (SR-Median) exhibited a significantly negative relationship with lake surface area, catchment area, abundance of aquatic vegetation and lake volume, the latter correlating positively with surface area (Figure 4a). There were no statistically significant relationships between SR-Median and other variables such as average length, average width, distance to Yangtze River and lake nutrient status (TN,TP and Chl-a).
Land use change (six types) in the catchments of the 14 study lakes was analyzed from GIS data covering the period 1980–2000. Cropland and forest are the main land use type in the 1980s, accounting for ~50–70% and ~15–30% of the total land cover respectively (Figure 1); however, marked land use changes occurred in cropland, forest, grassland and urbanized land in recent 30 years, where numerous croplands were transformed into urbanized lands and most forests were turned into grasslands (Table 2). A negative relationship can be found between the change of cropland and urbanized land (1990s vs. 1980s), and also between the one of forest and grasslands (1990s vs. 1980s). However, a positive relationship was only found between the change of sedimentation rates and the ones in croplands and urbanized lands (median in 1990s vs. median in the 1980s). There was no statistically significant relationship between the other types of land use change and the change in sedimentation rates (Figure 4b).
Correlation analysis between ECHO-G simulated climatic data (five-year average) since 1850 vs. their corresponding sedimentation rates in Chaohu and Longgan Lake are shown in Figure 4c,d. Although their correlations are low, positive relationships can be found between the change of annual temperature and sedimentation rates. However, there is no significant relationship between sedimentation rates and annual/summer/winter precipitation over time.

3.5. Reference Conditions for Sedimentation Rates

The sedimentation rates in the 14 study lakes in 1850–1900 follow a normal distribution as shown in the frequency distribution analysis and its mean value represents the sedimentation rates of the 14 lakes for this period (Figure 5a). Mostly, sedimentation rates prior to the 1900s were low, with average values ~0.16 g·cm−2·year−1: four lakes, Cehu, Shitang Lake, Donghu and Chihu, which are urban lakes or suburb lakes had higher sedimentation rates (average value >0.25 g·cm−2·year−1); the largest variation was observed in Wushan Lake (Figure 5b). The SR reference condition for the MLYB lakes was calculated to ~0.16 ± 0.08 g·cm−2·year−1.

4. Discussion

4.1. Spatiotemporal Pattern in Sedimentation Rates in MLYB Lakes

The sedimentation rates in most (12 of 14 lakes) of our MLYB study lakes showed a clear increasing trend over time, especially since the mid-20th century (Figure 2). Despite a high variability in temporal resolution, data quality and reconstructed sedimentation rates, which complicates inter-catchment comparisons, it has long been established that human impacts (i.e., land use change, sewage input, and hydrological regulation) combined with climate change have significantly affected the sedimentation process, causing pronounced alterations in SR [10,12,14]. Prior to 1900, the limited human impacts result in low sedimentation rates in all lakes. The period “1850–1900” corresponds with the late Qing Dynasty in Chinese history, a primitive farming era in absence of industrial development, science and technology. Weaker human impacts (due to small scale cultivation and lower population density) [4,47] in the catchments of Wushan, Taibai and Longgan Lake imply that their Median-sedimentation rates are lower here than the other sites at that time. However, as for Donghu Lake, located in Wuhan city (long history of high population density [55]), human impacts have always been more significant, which is also reflected by the higher background values of sedimentation rates. The period 1900–1960 is characterized by the early society and economy development in the Republic of China and new China era, when sedimentation rates increased considerably in most lakes. Severe floods and droughts occurring in the MLYB during this period caused more runoff by precipitation and enhanced soil erosion due to intensified farming. At the same time, the foundation of New China in 1949 promoted social development, including gradual construction of water conservation facilities. In MLYB, the most developed area in which the most important cereal production zones of China are located, multiple dams and reservoirs were built to avoid frequent flooding and drought [4,56,57]. As a result, changes occurred in hydrodynamic forces and sediment resources, with consequent increases in sedimentation rates in most lakes. After 1960, the new China and its reform and opening-up policy promoted the development of society and the economy even further, thus augmenting human impacts. This, combined with climate change, has led to so far the most dramatic increase in human impacts, including land use change (i.e., reclamation of land for agricultural purposes, expansion of cities, deforestation) (i.e., Table 2) and thereby significantly elevated sedimentation rates, towards the “high-value” period. Since the 1990s, the degraded environment has given rise to public concern, resulting in the implementation of many restoration programmes [32,57,58]. Successful lake management measures adopted by local governments have been targeted at reducing the adverse effects of intense human impacts in order to slow down the sharp sedimentation rates increment. Overall, our results are in line with those from investigations of shallow lakes elsewhere in the world (e.g., Europe and western Canada), suggesting that the rise in global sedimentation rates relative to lake type and major human impacts combined with climate change is typically 2–10-fold higher under disturbed compared with undisturbed conditions; actually, they may be even higher depending on local environmental conditions and the intensity of impact [11,12,14].
Although the “one lake one core approach” is mainly used in paleolimnology [46,59], the within lake spatial variability in sedimentation rates must not be ignored. In MLYB, sedimentation rates varied in multicores from the same lake (Figure 3) relative to the topography of the lake basin, the types of aquatic plants present and the human activities in the watershed. In close proximity to the water inlet of Taibai Lake, the TB core exhibited slightly higher sedimentation rates than the TN core due to stronger sedimentation effects with mostly external source inputs (see below Section 4.3). Similar spatial variation also prevails for Longgan and Chaohu Lakes. LL4/LS1/LGL in Longgan lake [27] and CH1/C20/C2007 in Chaohu Lake [46,56] receive material from different sub-catchments, leading to varied sedimentation rates in each core. In Taihu Lake, human impacts (industrial development and high population density) were stronger in the north-west Taihu catchment than those in the south-west region, rendering higher sedimentation rates in the MS core (north-west core). Although there is spatial variability in sedimentation rates in multicores of an individual lake, which illustrates the sediment patterns of large shallow floodplain lakes, the differences are relatively small (~20–50% change rate) compared with the among-lake differences (~1–900% change rate). Consequently, the sediment pattern extracted from a single core in each lake in this study is still representative and useful for comparative purpose.

4.2. Factors Controlling Sedimentation Rate Variability

Lake size and catchment area were revealed to be key factors determining the variability in sedimentation rates in MLYB lakes, small lakes with small catchments having higher sedimentation rates (Figure 2). The reason for this is probably that small lakes with small catchments have limited sediment storage space that weakens the hydrodynamic force. Furthermore, although erodible areas may be smaller in small-sized catchments, the sediment yield ratio typically increases due to less on-slope deposition and conveyance system deposition [60]. At global scale, the size of the lake basin (water area and catchment area) is always found to correlate negatively with sediment yield and accumulation rates, and there is sharp decline in sediment yield and accumulation rates with the decreasing size. As a result, smaller lake basins tend to be more susceptible to regional impacts than larger ones, as large lakes have lower sediment transfer efficiency and slow reaction times [11,60,61,62]. Another important factor regulating sedimentation rates is the presence of aquatic plants. In most of the MLYB lakes, the majority of sediment mass originates from land due to the strong soil erosion in the catchment, and aquatic macrophyte vegetation (both emergent and submerged plants) can always restrict sediment transportation from the lake edge to the center [49,63]. Lakes such as Liangzi and Longgan have abundant emergent macrophytes and low primary production compared with their external source inputs which may reduce sedimentation rates, tending to have lower median sedimentation rates than other lakes with similar features (Figure 2o). The same applies to Xijiu, Wushan and Taibai Lake, which had lower median sedimentation rates before 1900. As all these three lakes contained high density of aquatic macrophytes prior to 1900. Because of intense aquaculture activities and water pollution, today, only Zhangdu, Liangzi and Longgan Lake exhibit high abundance of aquatic plants, with lower median sedimentation rates than other similar lakes. The amount of nutrient inputs showed by TP, TN and Chl-a, was found to have limited effects on sedimentation in our 14 MLYB study lakes. Although there was high nutrient load and primary production in most MLYB lakes, the decomposition of organic matter was very fast as it occurs in many shallow lakes (e.g., up to 80% in hyper eutrophic lakes—Taihu [64]). Consequently, the contribution of shallow lakes to the sedimentation rates is difficult to discern. Similar studies in other lakes of the MLYB region, suggest that disturbances in catchments (e.g., soil erosion) may be the main cause of SR variation in MLYB [30].
In MLYB, land use change (especially reclamation for croplands and rapid urbanization) contributed significantly to SR variation. It has long been recognized that land use change can accelerate soil erosion by impairing soil stability in the catchment and increasing the runoff to surface areas, initiating erosion of road surfaces and enhancing the sediments transfer to watercourses [14,61]. The pronounced reduction in croplands restrained soil erosion, and in a way increased urbanized lands weakened erosion of road surfaces by soil fixing, resulting in lower sedimentation rates in 1990s than in 1980s. Other land use change (e.g., transformation of forests into grasslands) may be argued to have affected sedimentation rates; however, this is not the case as they are always one to two orders of magnitude lower than in cropland and urbanized land [61,65,66]. Significant correlation between the change of sedimentation rates and the proportion of cropland and urban land suggests that land use change has been one of the most important controlling factors for elevated sedimentation rates (Figure 4b).
Local factors such as construction of water storage facilities may have significant effects on the sedimentation processes via weakened hydrodynamic effects and decreased/increased inflow/outflow flux from upstream/downstream areas [67,68]. The construction of numerous dams and reservoirs has disrupted the connection of lakes with the Yangtze River or other rivers in the upper reaches [69]. This has led to the occurrence of sudden and marked changes in sedimentation rates with reduced inflow/outflow flux and suspended sediment solids. The construction of the upstream reservoirs Jinxing and Meichuan in 1958 in Wushan Lake and the upstream reservoirs Jingzhu, Kaotian and Xianrenba in 1958–1963 in Taibai Lake led to significantly lower sedimentation rates in the ~1960s, with lower median sedimentation rates (Figure 2e). Meanwhile, the construction of the Diaoyutai reservoir in Longgan lake [27], the Wagou sluice in 1954 in Zhangdu Lake [57], the Longhekou reservoir in 1962 as well as the Chaohu dam in 1962 in Chaohu Lake [31] led to disruption of the connection between lakes and the Yangtze River. In turn, the reduction of outflow or the backward flood flow has occurred affecting sedimentation rates. This explains the sudden SR reduction in the above lakes in the 1950s and 1960s (Figure 2c,e,h,l,m).
It appears that increased temperature may also have played a small role to contribute to the variations in sedimentation rates observed in MLYB lakes. To some extent, this is attributable that the increased temperature can promote lake productivity by indirectly mobilizing the nutrient dynamics within lakes. For example, increased lake water temperature can enhance the decomposition rates of organic matter in the lake consequently supporting the higher primary productivity [70]. However, flooding with increased runoff and, as well as elevated soil erosion, are always confounded by various catchment variables, making it difficult to discern the impacts of climate related variables including the temperature and precipitation on SR [14].

4.3. Implications for Lake Management

Our study revealed that combination of catchment and land use change parameters together with climate change are the controlling factors of the observed increase in sedimentation rates in MLYB. Small lakes had higher sedimentation rates, consequently with increased risk of siltation. Detrimental land use practices such as reclamation for croplands and rapid urbanization should preferably be avoided or mitigated. Hence, proper management with sustainable land use in the catchment may alleviate degradation of the lake environment, such as to develop eco-agricultural mode and reasonable city planning. Meanwhile, in response to the high nutrient input, lately the establishment of buffer zones along the lakeshore and surrounding rivers has been found to be an effective and widely employed management tool in China [71,72].
Paleolimnological investigations help establish reference conditions for lakes, i.e., the “pristine” state when the lake was unaffected or only negligibly impacted by human disturbance. According to this, the current extent of environmental degradation can be defined and knowledge of this may be of great value for lake managers [12,34,39,73]. However, reference conditions may be difficult to establish as this has to be restored back to the far past. Furthermore, many irreversible changes of lake systems (e.g., infilling) may render a historically defined recovery target impossible or difficult to reach [34]. In MLYB, many substantial human-made changes of lakes have taken place, such as damming and land reclamation, rendering it impossible for managers to restore the lakes to a true reference condition. Nevertheless, establishment of reference conditions is essential to assess the deviation of the system from its natural background. We propose that the period 1850–1900 can be used as the reference state because human activities in MLYB gradually increased in the period of the Republic of China (~1900s) with early industrial revolution. The SR reference condition for MLYB lakes was then calculated to ~ 0.16 ± 0.08 g·cm−2·year−1, comparable with values from European lakes, being 0.15 to 0.25 g·cm−2·year−1 for large, lowland shallow lakes [12]. Furthermore, since 2002, efforts by local governments and environmental protection agencies have aimed to restore lakes to an early state, which was thought to be better than the current one with higher biodiversity and water quality before the launch of large scale of reclamation and dam building programs. By re-linking lakes (i.e., Zhangdu Lake) [74] to Yangtze, returning arable land to the lake, rendering our reference conditions more adaptive [69].

Supplementary Materials

The following are available online at www.mdpi.com/2073-4441/9/8/617/s1, Figure S1: Unsupported 210Pb (CRS model) activity and 137Cs activity for 15 cores in 11 lakes.

Acknowledgments

This research was supported by the National Science Foundation of China (No. 41530753), the National Key Research and Development Program of China (No. 2017YFA0605203), the National Science Foundation of China (No. 41472314), and the High Level University Construction Project of Guangdong Province (Regional water environment safety and water ecological protection). Xuhui Dong was also supported by an AIAS-COFUND Marie Curie fellowship (No. 609033) at Aarhus University. Erik Jeppesen and Thomas A. Davidson were supported by the MARS project (Managing Aquatic ecosystems and water Resources under multiple Stress) funded under the 7th EU Framework Programme, Theme 6 (Environment including Climate Change), Contract No. 603378 (http://www.mars-project.eu). We would like to thank Anne Mette Poulsen for proofreading and Anders Nielsen for assistance with ArcGIS analysis.

Author Contributions

Min Xu, Xuhui Dong and Xiangdong Yang conceived the idea; Min Xu, Xu Chen, Qinghui Zhang, Qian Liu and Min Yao collected and analyzed the data; Min Xu wrote the manuscript; and Erik Jeppesen, Xiangdong Yang, Rong Wang, and Thomas A. Davidson contributed with useful suggestions in writing the manuscript. All of the authors contributed to finalize the manuscript.

Conflicts of Interest

The authors declare no conflict of interest.

References

  1. Wang, S.M.; Dou, H.S. Lakes in China; Science press: Beijing, China, 1998. [Google Scholar]
  2. Moss, B. Engineering and biological approaches to the restoration for eutrophication of shallow lakes in which aquatic plant communtities are important components. Hydrobiologia 1990, 200, 367–377. [Google Scholar] [CrossRef]
  3. Bennett, E.M.; Carpenter, S.R.; Caraco, N.F. Human impact on erodable phosphorus and eutrophication: A global perspective increasing accumulation of phosphorus in soil threatens rivers, lakes, and coastal oceans with eutrophication. Am. Inst. Biol.Sci. 2001, 51, 227–234. [Google Scholar]
  4. Liu, E.; Yang, X.; Shen, J.; Dong, X.; Zhang, E.; Wang, S. Environmental response to climate and human impact during the last 400 years in Taibai Lake catchment, middle reach of Yangtze River, China. Sci. Total Environ. 2007, 385, 196–207. [Google Scholar] [CrossRef] [PubMed]
  5. Schiefer, E.; Reid, K.; Burt, A.; Luce, J. Watershed assessment in the Southern Interior of British Columbia. In Assessing Natural Sedimentation Patterns and Impacts of Land Use on Sediment Yield: A Lake-Sediment–Based Approach; Toews, D., Chatwin, S., Eds.; Ministry of Forests Research Program: Columbia, UK, 2001; pp. 209–236. [Google Scholar]
  6. Blais, J.M.; France, R.L.; Kimpe, L.E.; Cornett, R.J. Climatic changes in Northwestern Ontario have had a greater effect on erosion and sediment accumulation than logging and fire Evidence from 210Pb chronology in lake sediments. Biogeochemistry 1998, 43, 235–252. [Google Scholar] [CrossRef]
  7. Jeppesen, E.; Peder Jensen, J.; Søndergaard, M.; Lauridsen, T.; Landkildehus, F. Trophic structure, species richness and biodiversity in Danish lakes: Changes along a phosphorus gradient. Freshw. Biol. 2000, 45, 201–218. [Google Scholar] [CrossRef]
  8. Qin, B.; Gao, G.; Zhu, G.; Zhang, Y.; Song, Y.; Tang, X.; Xu, H.; Deng, J. Lake eutrophication and its ecosystem response. Chin. Sci. Bull. 2013, 58, 961–970. [Google Scholar] [CrossRef]
  9. Dunne, J.A.; Williams, R.J.; Martinez, N.D. Network structure and biodiversity loss in food webs: Robustness increases with connectance. Ecol. Lett. 2002, 5, 558–567. [Google Scholar] [CrossRef]
  10. Brothers, S.; Vermaire, J.C.; Gregory-Eaves, I. Empirical models for describing recent sedimentation rates in lakes distributed across broad spatial scales. J. Paleolimnol. 2008, 40, 1003–1019. [Google Scholar] [CrossRef]
  11. Dearing, J.A.; Jones, R.T. Coupling temporal and spatial dimensions of global sediment flux through lake and marine sediment records. Glob. Planet. Chang. 2003, 39, 147–168. [Google Scholar] [CrossRef]
  12. Rose, N.L.; Morley, D.; Appleby, P.G.; Battarbee, R.W.; Alliksaar, T.; Guilizzoni, P.; Jeppesen, E.; Korhola, A.; Punning, J.-M. Sediment accumulation rates in European lakes since AD 1850: Trends, reference conditions and exceedence. J. Paleolimnol. 2010, 45, 447–468. [Google Scholar] [CrossRef]
  13. Anderson, N.; Bennion, H.; Lotter, A. Lake eutrophication and its implications for organic carbon sequestration in Europe. Glob. Chang. Biol. 2014, 20, 2741–2751. [Google Scholar] [CrossRef] [PubMed]
  14. Schiefer, E.; Petticrew, E.L.; Immell, R.; Hassan, M.A.; Sonderegger, D.L. Land use and climate change impacts on lake sedimentation rates in western Canada. Anthropocene 2013, 3, 61–71. [Google Scholar] [CrossRef]
  15. Yang, G.; Ma, R.; Zhang, L.; Jiang, J.; Yao, S.; Zhang, M.; Zeng, H. Lake status, major problems and protection strategy in China. J. Lake Sci. 2010, 22, 799–810. [Google Scholar]
  16. Du, Y.; Xue, H.; Wu, S.; Ling, F.; Xiao, F.; Wei, X. Lake area changes in the middle Yangtze region of China over the 20th century. J. Environ. Manag. 2011, 92, 1248–1255. [Google Scholar] [CrossRef] [PubMed]
  17. Flower, R.; Appleby, P.; Thompson, J.; Ahmed, M.; Ramdani, M.; Chouba, L.; Rose, N.; Rochester, R.; Ayache, F.; Kraiem, M. Sediment distribution and accumulation in lagoons of the Southern Mediterranean Region (the MELMARINA Project) with special reference to environmental change and aquatic ecosystems. Hydrobiologia 2009, 622, 85–112. [Google Scholar] [CrossRef]
  18. López-Vicente, M.; Navas, A. Relating soil erosion and sediment yield to geomorphic features and erosion processes at the catchment scale in the Spanish Pre-Pyrenees. Environ. Earth Sci. 2010, 61, 143–158. [Google Scholar] [CrossRef] [Green Version]
  19. Jeppesen, E.; Meerhoff, M.; Davidson, T.A.; Trolle, D.; Sondergaard, M.; Lauridsen, T.L.; Beklioglu, M.; Brucet, S.; Volta, P.; Gonzalez-Bergonzoni, I.; et al. Climate change impacts on lakes: An integrated ecological perspective based on a multi-faceted approach, with special focus on shallow lakes. J. Limnol. 2014, 73, 84–111. [Google Scholar] [CrossRef] [Green Version]
  20. Boyle, J.F.; Plater, A.J.; Mayers, C.; Turner, S.D.; Stroud, R.W.; Weber, J.E. Land use, soil erosion, and sediment yield at Pinto Lake, California: Comparison of a simplified USLE model with the lake sediment record. J. Paleolimnol. 2011, 45, 199–212. [Google Scholar] [CrossRef]
  21. Du, Y.; Cai, S.; Zhang, X.; Zhao, Y. Interpretation of the environmental change of Dongting Lake, middle reach of Yangtze River, China, by 210Pb measurement and satellite image analysis. Geomorphology 2001, 41, 171–181. [Google Scholar] [CrossRef]
  22. Engstrom, D.R.; Almendinger, J.E.; Wolin, J.A. Historical changes in sediment and phosphorus loading to the upper Mississippi River: Mass-balance reconstructions from the sediments of Lake Pepin. J. Paleolimnol. 2009, 41, 563–588. [Google Scholar] [CrossRef]
  23. Al-Masri, M.S.; Aba, A.; Khalil, H.; Al-Hares, Z. Sedimentation rates and pollution history of a dried lake: Al-Oteibeh Lake. Sci. Total Environ. 2002, 293, 177–189. [Google Scholar] [CrossRef]
  24. Odhiambo, B.K.; Ricker, M.C. Spatial and isotopic analysis of watershed soil loss and reservoir sediment accumulation rates in Lake Anna, Virginia, USA. Environ. Earth Sci. 2012, 65, 373–384. [Google Scholar] [CrossRef]
  25. Scheffer, M. Ecology of Shallow Lakes; Springer Science & Business Media: Wageningen, The Netherlands, 2004. [Google Scholar]
  26. Yang, H.; Yi, C.; Xie, P.; Xing, Y.; Ni, L. Sedimentation rates, nitrogen and phosphorus retentions in the largest urban Lake Donghu, China. J. Radioanal. Nucl. Chem. 2006, 267, 205–208. [Google Scholar] [CrossRef]
  27. Wu, Y.; Liu, E.; Bing, H.; Yang, X.; Xue, B.; Xia, W. Geochronology of recent lake sediments from Longgan Lake, middle reach of the Yangtze River, influenced by disturbance of human activities. Sci. Chin. Earth Sci. 2010, 53, 1188–1194. [Google Scholar] [CrossRef]
  28. Xiang, L.; Lu, X.X.; Higgitt, D.L.; Wang, S.M. Recent lake sedimentation in the middle and lower Yangtze basin inferred from from 137Cs and 210Pb measurements. J. Asian Earth Sci. 2002, 21, 77–86. [Google Scholar] [CrossRef]
  29. Xue, B.; Yao, S. Recent sedimentation rates in lakes in lower Yangtze River basin. Quat. Int. 2011, 244, 248–253. [Google Scholar] [CrossRef]
  30. Yao, S.; Xue, B. Sedimentary geochemical record of human-induced environmental changes in Huanggaihu Lake in the middle reach of the Yangtze River, China. J. Limnol. 2015, 74, 31–39. [Google Scholar] [CrossRef]
  31. Chen, X.; Yang, X.; Dong, X.; Liu, Q. Nutrient dynamics linked to hydrological condition and anthropogenic nutrient loading in Chaohu Lake (Southeast China). Hydrobiologia 2011, 661, 223–234. [Google Scholar] [CrossRef]
  32. Shankman, D.; Davis, L.; De Leeuw, J. River management, landuse change, and future flood risk in China’s Poyang Lake region. Int. J. River Basin Manag. 2009, 7, 423–431. [Google Scholar] [CrossRef]
  33. Paerl, H.W.; Xu, H.; McCarthy, M.J.; Zhu, G.; Qin, B.; Li, Y.; Gardner, W.S. Controlling harmful cyanobacterial blooms in a hyper-eutrophic lake (Lake Taihu, China): The need for a dual nutrient (N & P) management strategy. Water Res. 2011, 45, 1973–1983. [Google Scholar] [PubMed]
  34. Bennion, H.; Battarbee, R.W.; Sayer, C.D.; Simpson, G.L.; Davidson, T.A. Defining reference conditions and restoration targets for lake ecosystems using palaeolimnology: A synthesis. J. Paleolimnol. 2010, 45, 533–544. [Google Scholar] [CrossRef]
  35. Stoddard, J.L.; Larsen, D.P.; Hawkins, C.P.; Johnson, R.K.; Norris, R.H. Setting Expectations for the Ecological Condition of Streams: The Concept of Reference Condition. Ecol. Appl. A Publ. Ecol. Soc. Am. 2006, 16, 1267–1276. [Google Scholar] [CrossRef]
  36. Johnson, R.K. Bioassessment of Freshwater Ecosystems: Using the Reference Condition Approach. Freshw. Biol. 2010, 50, 199. [Google Scholar] [CrossRef]
  37. European Union. Directive 2000/60/EC of the European Parliament and of the Council of 23 October 2000 on establishing a framework for community action in the field of water policy. In Official Journal of the European Union; European Union: Brussels, Belgium, 2000; Volume L327, pp. 1–72. [Google Scholar]
  38. Battarbee, R.W.; Bennion, H. Palaeolimnology and its developing role in assessing the history and extent of human impact on lake ecosystems. J. Paleolimnol. 2010, 45, 399–404. [Google Scholar] [CrossRef]
  39. Dong, X.; Yang, X.; Chen, X.; Liu, Q.; Yao, M.; Wang, R.; Xu, M. Using sedimentary diatoms to identify reference conditions and historical variability in shallow lake ecosystems in the Yangtze floodplain. Mar. Freshw. Res. 2016, 67, 803–815. [Google Scholar] [CrossRef]
  40. Liu, E.; Shen, J.; Birch, G.F.; Yang, X.; Wu, Y.; Xue, B. Human-induced change in sedimentary trace metals and phosphorus in Chaohu Lake, China, over the past half-millennium. J. Paleolimnol. 2012, 47, 677–691. [Google Scholar] [CrossRef]
  41. Yin, H.; Liu, G.; Pi, J.; Chen, G.; Li, C. On the river–lake relationship of the middle Yangtze reaches. Geomorphology 2007, 85, 197–207. [Google Scholar] [CrossRef]
  42. Ma, R.; Yang, G.; Duan, H.; Jiang, J.; Wang, S.; Feng, X.; Li, A.; Kong, F.; Xue, B.; Wu, J.; et al. The quantity, size and spatial distributions of lakes in China. Sci. China Earth Sci. 2011, 54, 283–289. [Google Scholar] [CrossRef]
  43. Appleby, P.G. Chronostratigraphic Techniques in Recent Sediments. In Tracking Environmental Change Using Lake Sediments: Basin Analysis, Coring, and Chronological Techniques; Last, W.M., Smol, J.P., Eds.; Springer: Dordrecht, The Netherlands, 2001; pp. 171–203. [Google Scholar]
  44. Robbins, J.A. Geochemical and Geophysical Applications of Radioactive Lead; Elsevier: Amsterdam, The Netherlands, 1978; Volume 1, pp. 285–393. [Google Scholar]
  45. Liu, E.; Bin, X.; Xiangdong, Y.; Yanhong, W.; Weilan, X. 137Cs and 210Pb Chronology for modern lake sediment: A case study of Chaohu lake Taibai Lake. Mar. Geol. Quat. Geol. 2009, 29, 89–94. [Google Scholar] [CrossRef]
  46. Dong, X.; Anderson, N.J.; Yang, X.; Chen, X.; Shen, J. Carbon burial by shallow lakes on the Yangtze floodplain and its relevance to regional carbon sequestration. Glob. Chang. Biol. 2012, 18, 2205–2217. [Google Scholar] [CrossRef]
  47. Wu, Y.; Liu, E.; Yao, S.; Zhu, Y.; Xia, W. Recent heavy metal accumulation in Dongjiu and Xijiu lakes, East China. J. Paleolimnol. 2009, 43, 385–392. [Google Scholar] [CrossRef]
  48. Shi, X.L.; Qin, B.Q. Study on 137Cs and 210Pb Dating and Sedimentation Rates of Wanghu Lake, Hubei Province. J. Ningbo Univ. (Nat. Sci. Eng. Ed.) 2008, 3, 418–422. [Google Scholar]
  49. Wu, Y.; Lücke, A.; Wang, S. Assessment of nutrient sources and paleoproductivity during the past century in Longgan Lake, middle reaches of the Yangtze River, China. J. Paleolimnol. 2007, 39, 451–462. [Google Scholar] [CrossRef]
  50. Shen, J.; Liu, E.; Zhu, Y.; Hu, S.; Qu, W. Distribution and chemical fractionation of heavy metals in recent sediments from Lake Taihu, China. Hydrobiologia 2007, 581, 141–150. [Google Scholar] [CrossRef]
  51. Nanjing Institute of Geography and Limnology Chinese Academy of Sciences. Technical Specification Lake Survey; Science Press: Beijing, China, 2015. [Google Scholar]
  52. Liu, J.; Kuang, W.; Zhang, Z.; Xu, X. Spatiaotemporal characteristics, patterns and causes of land-use changes in China since the late 1980s. J. Geogr. Sci. 2014, 24, 195–210. [Google Scholar] [CrossRef]
  53. Lehner, B.; Verdin, K.; Jarvis, A. New Global Hydrography Derived From Spaceborne Elevation Data. Eos Trans. Am. Geophys. Union 2008, 89, 93–94. [Google Scholar] [CrossRef]
  54. Liu, J.; Storch, H.; Chen, X.; Zorita, E.; Zheng, J.; Wang, S. Simulated and reconstructed winter temperature in the Eastern China during the last millennium. Chin. Sci. Bull. 2005, 50, 2872–2877. [Google Scholar]
  55. Editorial Committee of chronicles in Wuhan. Wuhan Local Chronicles; Wuhan University Press: Wuhan, China, 1992. [Google Scholar]
  56. Chen, X.; Yang, X.; Dong, X.; Liu, E. Environmental changes in Chaohu Lake (Southeast, China) since the mid 20th century: The interactive impacts of nutrients, hydrology and climate. Limnol.-Ecol. Manag. Inland Waters 2013, 43, 10–17. [Google Scholar] [CrossRef]
  57. Xiong, S. Water Balance of Zhangdu Lake in Yangtze River Basin. Exp. Water Res. Hydropower Inf. 2006, 27, 72–79. [Google Scholar]
  58. Qin, B.; Zhu, G.; Gao, G.; Zhang, Y.; Li, W.; Paerl, H.W.; Carmichael, W.W. A drinking water crisis in Lake Taihu, China: Linkage to climatic variability and lake management. Environ. Manag. 2010, 45, 105–112. [Google Scholar] [CrossRef] [PubMed]
  59. Anderson, N.; Korsman, T.; Renberg, I. Spatial heterogeneity of diatom stratigraphy in varved and non-varved sediments of a small, boreal-forest lake. Aquat. Sci. 1994, 56, 40–58. [Google Scholar] [CrossRef]
  60. Porto, P.; Walling, D.E.; Callegari, G. Using 137Cs measurements to establish catchment sediment budgets and explore scale effects. Hydrol. Proc. 2011, 25, 886–900. [Google Scholar] [CrossRef]
  61. Vanmaercke, M.; Poesen, J.; Govers, G.; Verstraeten, G. Quantifying human impacts on catchment sediment yield: A continental approach. Glob. Planet. Chang. 2015, 130, 22–36. [Google Scholar] [CrossRef]
  62. Walling, D.E.; Collins, A.L. The catchment sediment budget as a management tool. Environ. Sci. Policy 2008, 11, 136–143. [Google Scholar] [CrossRef]
  63. Zhang, Q.; Dong, X.; Yao, M.; Shiyue, C.; Yang, X. Historical information on aquatic vegetation revealed by sedimentary diatom: A case study on Liangzi Lake. Acta Hydrobiol. Sin. 2014, 38, 1024–1032. [Google Scholar]
  64. Chunhua, H.; Peimin, P. Downward flux of suspended substance and organic decomposition rate in Wulihu Bay, Taihu Lake. Oceanol. Et Limnol. Sin. 2000, 31, 327–333. [Google Scholar]
  65. Maetens, W.; Vanmaercke, M.; Poesen, J.; Jankauskas, B.; Jankauskien, G.; Ionita, I. Effects of land use on annual runoff and soil loss in Europe and the Mediterranean: A meta-analysis of plot data. Prog. Phys. Geogr. 2012, 36, 599–653. [Google Scholar] [CrossRef]
  66. Montgomery, D.R. Soil erosion and agricultural sustainability. Proc. Natl. Acad. Sci. USA 2007, 104, 13268–13272. [Google Scholar] [CrossRef] [PubMed]
  67. Nilsson, C.; Reidy, C.A.; Dynesius, M.; Revenga, C. Fragmentation and flow regulation of the world’s large river systems. Science 2005, 308, 405–408. [Google Scholar] [CrossRef] [PubMed]
  68. Xu, K.; Milliman, J.D. Seasonal variations of sediment discharge from the Yangtze River before and after impoundment of the Three Gorges Dam. Geomorphology 2009, 104, 276–283. [Google Scholar] [CrossRef]
  69. Kattel, G.R.; Dong, X.; Yang, X. A century-scale, human-induced ecohydrological evolution of wetlands of two large river basins in Australia (Murray) and China (Yangtze). Hydrol. Earth Syst.Sci. 2016, 20, 2151–2168. [Google Scholar] [CrossRef]
  70. Likens, G.E. Lake Ecosystem Ecology: A Global Perspective; Academic Press: San Diego, CA, USA, 2010. [Google Scholar]
  71. Le, C.; Zha, Y.; Li, Y.; Sun, D.; Lu, H.; Yin, B. Eutrophication of lake waters in China: Cost, causes, and control. Environ. Manag. 2010, 45, 662–668. [Google Scholar] [CrossRef] [PubMed]
  72. Shan, N.; Ruan, X.; Xu, J.; Pan, Z. Estimating the optimal width of buffer strip for nonpoint source pollution control in the Three Gorges Reservoir Area, China. Ecol. Model. 2014, 276, 51–63. [Google Scholar] [CrossRef]
  73. Battarbee, R.W.; Morley, D.; Bennion, H.; Simpson, G.L.; Hughes, M.; Bauere, V. A palaeolimnological meta-database for assessing the ecological status of lakes. J. Paleolimnol. 2011, 45, 405–414. [Google Scholar] [CrossRef]
  74. WWF. WWF China Programme Annual Report; WWF: Beijing, China, 2006. [Google Scholar]
Figure 1. GIS maps showing the geographical distribution and land use for the 14 studied lakes from the Yangtze River basin (MLYB).
Water 09 00617 g001
Figure 2. Sediment accumulation rates since 1850s in CE, XJ, WS, ST, TB, DH, WH, ZD, CI, DS, LZ, LG, CH and TH lake (an), respectively, and their median values in different time periods (o). Lakes are presented in order of increasing surface area. For lakes with multiple cores, TB, LL4, CH1 and MS were chosen, respectively, as the representative core in Taibai, Longgan, Chaohu and Taihu Lake (Data in b, f, g modified from [26,47,48], respectively); Lake code refers to Table 1.
Water 09 00617 g002aWater 09 00617 g002b
Figure 3. SRs of different cores within the same lake for Taibai, Longgan, Chaohu and Taihu Lake: (ag) SR variations with time; and (bh) corresponding boxplots with all data (Data of LGL core and LS1 core in Longgan Lake, and data of DLS core in Taihu Lake modified from [49,50], respectively).
Water 09 00617 g003
Figure 4. Results of correlation analysis: (a) SR-Median vs. lake features in recent 20 years; (b) SR-Median vs. Land use change in recent 20 years; and (c,d) (five-year average) SR-Average vs. climate change (winter, summer and annual temperature and precipitation) in Chaohu and Longgan Lake since 1850 respectively. The shaded bar represents the correlation coefficient, and each grid with colored background shows significance at 0.95. SA, surface area; CA, catchment area; AD, average depth; VL, water volume; AL, average length; AW, average width; CA/SA, surface area/catchment area; AL/AW, average length/average width; DYR, distance to the Yangtze River; AV, abundance of aquatic vegetation; TN, total nitrogen; TP, total phosphorus; and Chl-a, chlorophyll-a.
Water 09 00617 g004
Figure 5. (a) Frequency distribution curve based on all data on SRs before 1900 in the 14 study lakes; and (b) median sedimentation rates (SRs-Median) of the 14 study lakes for the period 1850–1900. Lake code refers to Table 1. The black dashed line represents the SR reference condition.
Water 09 00617 g005
Table 1. Morphological features of the 14 study lakes.
Lake NameCodeLocationSA (km2)CA (km2)AD (m)VL (109 m3)AL (km)AW (km)DYR (km)AVTN (mg/L)TP (mg/L)Chl-a (µg/L)Core Names in Each Lake
CehuCEN 30°14′–30°16′
E 115°08′–115°10′
11.82322.10.037.11.70.9510.770.044.35CE
XijiuXJN 31°22′–31°24′
E 119°42′–119°42′
12.4 971.90.04 20.60.87125.58 1 2.760.2214.26XJ
WushanWSN 29°53′–29°57′
E 115°31′–115°37′
16.1 4692.10.05 7.4 2.2 3.62 1 1.140.2340.62WS
ShitangSTN 30°18′–30°39′
E 117°04′–117°07′
23.3 3641.50.09 12.05.011.63 1 1.000.0710.40ST
TaibaiTBN 29°56′–30°01′
E 115°46′–115°50′
26.0 9602.50.08 10.8 2.3 11.66 2 1.430.134.72TB,TN
DonghuDHN 30°31′–30°36′
E 114°21′–114°28′
33.7 6502.20.09 11.8 2.9 9.27 1 1.530.2451.53DH
WanghuWHN 29°51′–29°54′
E 115°20′–115°25′
35.2 5143.60.16 9.2 4.6 4.26 2 0.960.0424.80WH
ZhangduZDN 30°37′–30°42′
E 114°40′–114°48′
42.3 53101.20.04 9.3 3.8 1.81 3 0.560.0313.35ZD
ChihuCIN 29°45′–29°48′
E 115°41′–115°44′
61.2 3602.50.2312.0 6.7 0.44 2 1.540.017.50CI
DianshanDSN 31°04′–31°12′
E 120°54′–121°01′
63.7 4462.10.16 12.8 5.0 84.98 1 2.090.1631.61DS
LiangziLZN 30°05′–30°18′
E 114°21′–114°39′
304.3 32654.21.27 31.7 9.6 47.38 5 0.490.043.18LZ
LongganLGN 29°52′–30°05′
E 115°19′–116°17′
316.2 55113.21.20 29.5 10.7 4.40 4 0.770.054.82LL4,LS1,LGL
ChaohuCHN 31°25′–31°43′
E 117°16′–117°51′
769.6 92582.72.07 61.7 12.5 62.40 1 1.570.1417.58CH1,C20,C2007
TaihuTHN 30°55′–31°33′
E 119°52–′120°36′
2425.0 36,5001.95.14 68.0 35.7 88.56 1 1.540.069.17MS,DLS
Notes: SA, surface area (km2); CA, catchment area (km2); AD, average depth (m); VL, water volume (109 m3); AL, average length (km); AW, average width (km); DYR, distance to the Yangtze River (km); AV, abundance of aquatic vegetation; TN, total nitrogen (mg/L); TP, total phosphorus (mg/L); and Chl-a, chlorophyll-a (µg/L). The numbers 1–5 represent vegetation abundance: 1 = no aquatic plants and 5 = full coverage of aquatic plants.
Table 2. The extent of land use change (%) (six types) in the 14 lakes from the 1980s to the 1990s based on ArcGIS analysis.
LakeCodeCroplands (%)Forests (%)Grasslands (%)Waters (%)Urbanized Lands (%)Unutilized Lands (%)
CehuCE−1.45−18.6219.030.930.100.00
XijiuXJ−5.16−9.469.400.684.540.00
WushanWS−0.34−18.3418.340.100.230.00
ShitangST−0.26−24.6924.60−0.010.350.00
TaibaiTB−0.01−23.8723.84−0.170.200.02
DonghuDH−1.57−7.517.32−0.862.610.00
WanghuWH−0.19−29.5329.52−0.220.260.17
ZhangduZD−0.54−37.1437.160.280.210.03
LiangziLZ−0.38−11.9311.74−0.460.180.86
ChaohuCH−1.36−12.9312.920.051.320.00
XijiuXJ−5.16−9.469.400.684.540.00
WushanWS−0.34−18.3418.340.100.230.00
ShitangST−0.26−24.6924.60−0.010.350.00
WanghuWH−0.19−29.5329.52−0.220.260.17

