4.1. The Non-Darcian Equations
The experimental flow velocity–hydraulic gradient (
V–
J) relationships for different rough single fractures under different flow conditions are illustrated in
Figure 6,
Figure 7 and
Figure 8 and the fitting results, using linear Equation (1) and nonlinear Equations (2) and (3), and goodness of fit were also shown in
Table 3,
Table 4 and
Table 5. Fitting parameters are listed in
Table 6.
It was found that non-Darcian flow existed in both smooth and rough single fractures. The nonlinear phenomenon was more obvious in rough single fractures with high asperity heights, which are the heights of roughness inside the fracture. The non-Darcian V–J relationships were best described by the Forchheimer equation.
The fitting parameters in
Table 6 exhibited the following patterns. First, with the decrease of the asperity heights of the rough elements from 8 mm to 2 mm, the relative roughness (
) decreased from 0.8 to 0.2 and the average aperture increased from 4.7 mm to 8.7 mm, the value of
k in the Darcian equation decreased, indicating an increasing of permeability for the fracture. The value of
c in the Izbash equation also decreased with the average aperture, but the value of
m in the Izbash equation did not show any obvious trend. Second, fitting parameters showed different trends for smooth and rough single fractures. For smooth single fractures, the value of
a in the Forchheimer equation decreased with the average aperture but the value of
bc and the value of the non-Darcian coefficient
βc increased with the average aperture. Third, the nonlinear phenomenon was more striking in smooth single fractures with larger average apertures. However, for rough single fractures in which flow can be described by the Forchheimer equation,
a increased with the average aperture but
bc and
βc decreased with the average aperture. This was probably because the increase of asperity heights of rough elements in a rough single fracture would create greater fluid–solid contact surface, and enhance the frictional force for flow. Therefore, the relative importance of viscous flow versus inertial flow for a greater relative roughness is increased, reducing the flow nonlinearity (which is primarily caused by the inertial effect of flow).
4.2. The ADE and CTRW Models
The molecular diffusion coefficient
Dm is set as 5.0 × 10
−11 m
2·s
−1 based on the Taylor–Aris experiment [
1]. The Peclet numbers (
Pe =
bV/
Dm) in our experiment were greater than 5 × 10
6. As pointed out by Bauget and Fourar [
1], when the Peclet number is greater than 4000, transverse dispersion can be ignored. The
Pe numbers of our experiments were more than 100 times greater than 4000, which warranted the use of the one-dimensional approach. The CTRW Matlab Toolbox V3.1 [
20] was employed for the CTRW TPL model.
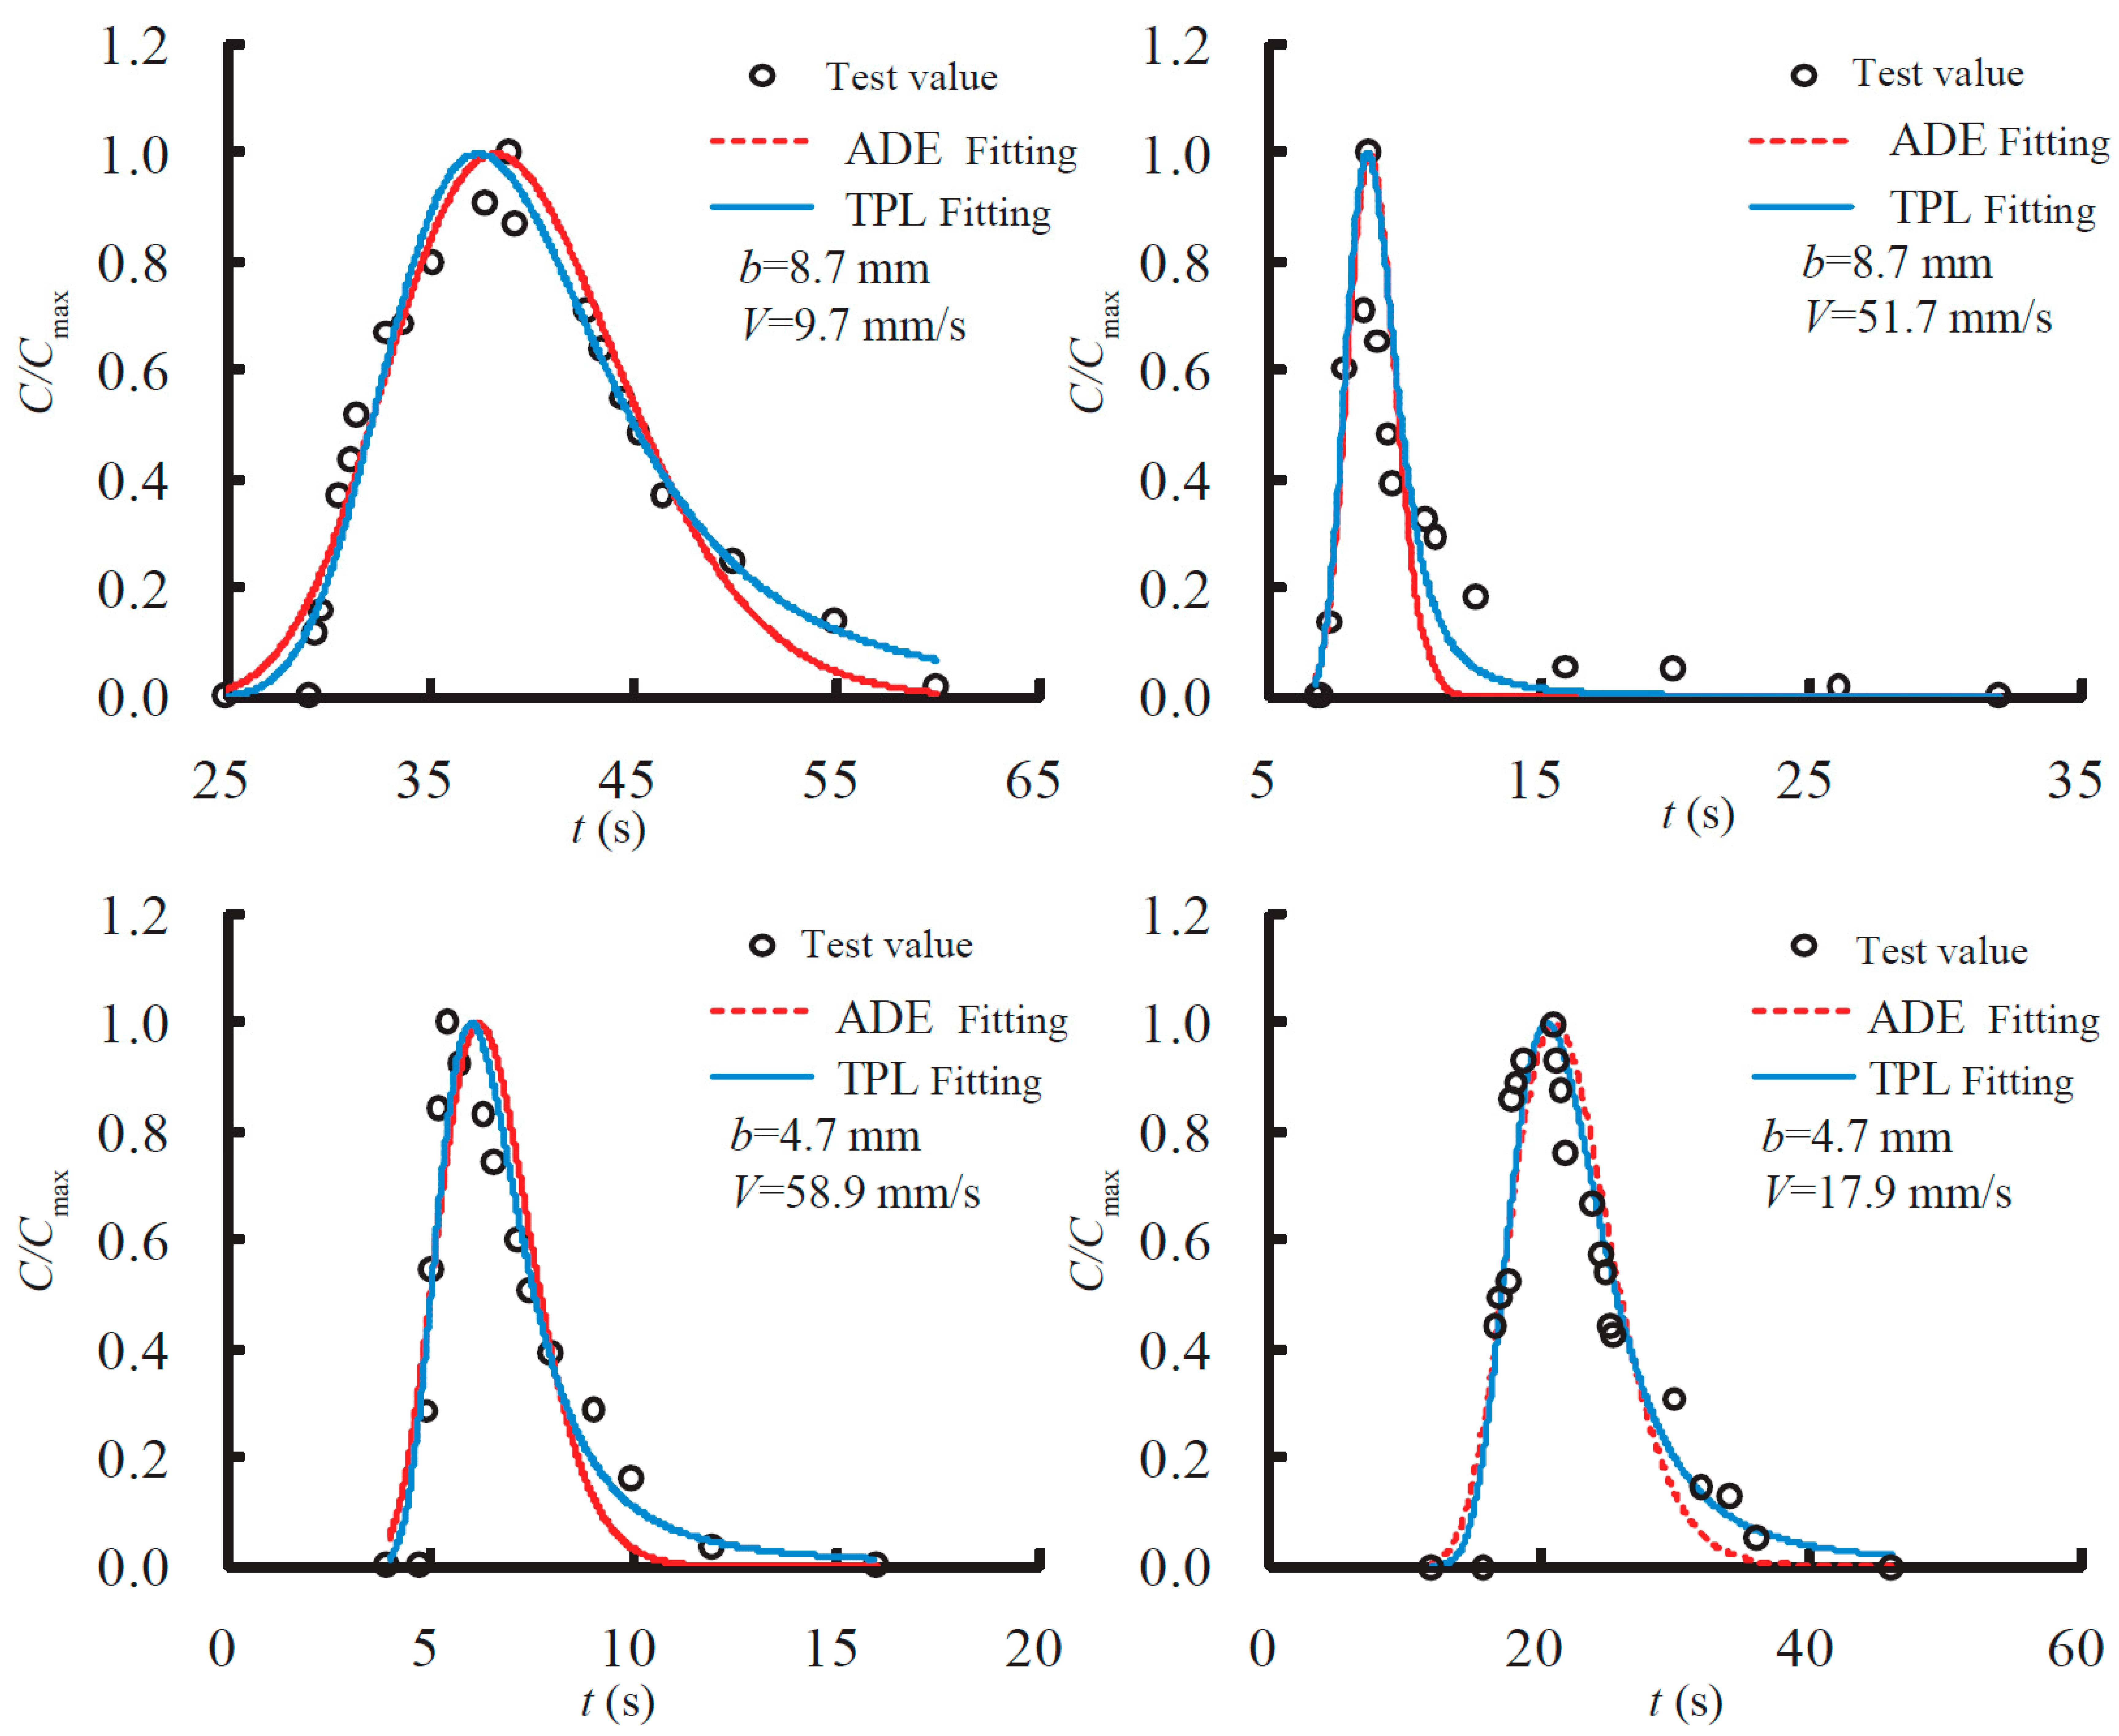
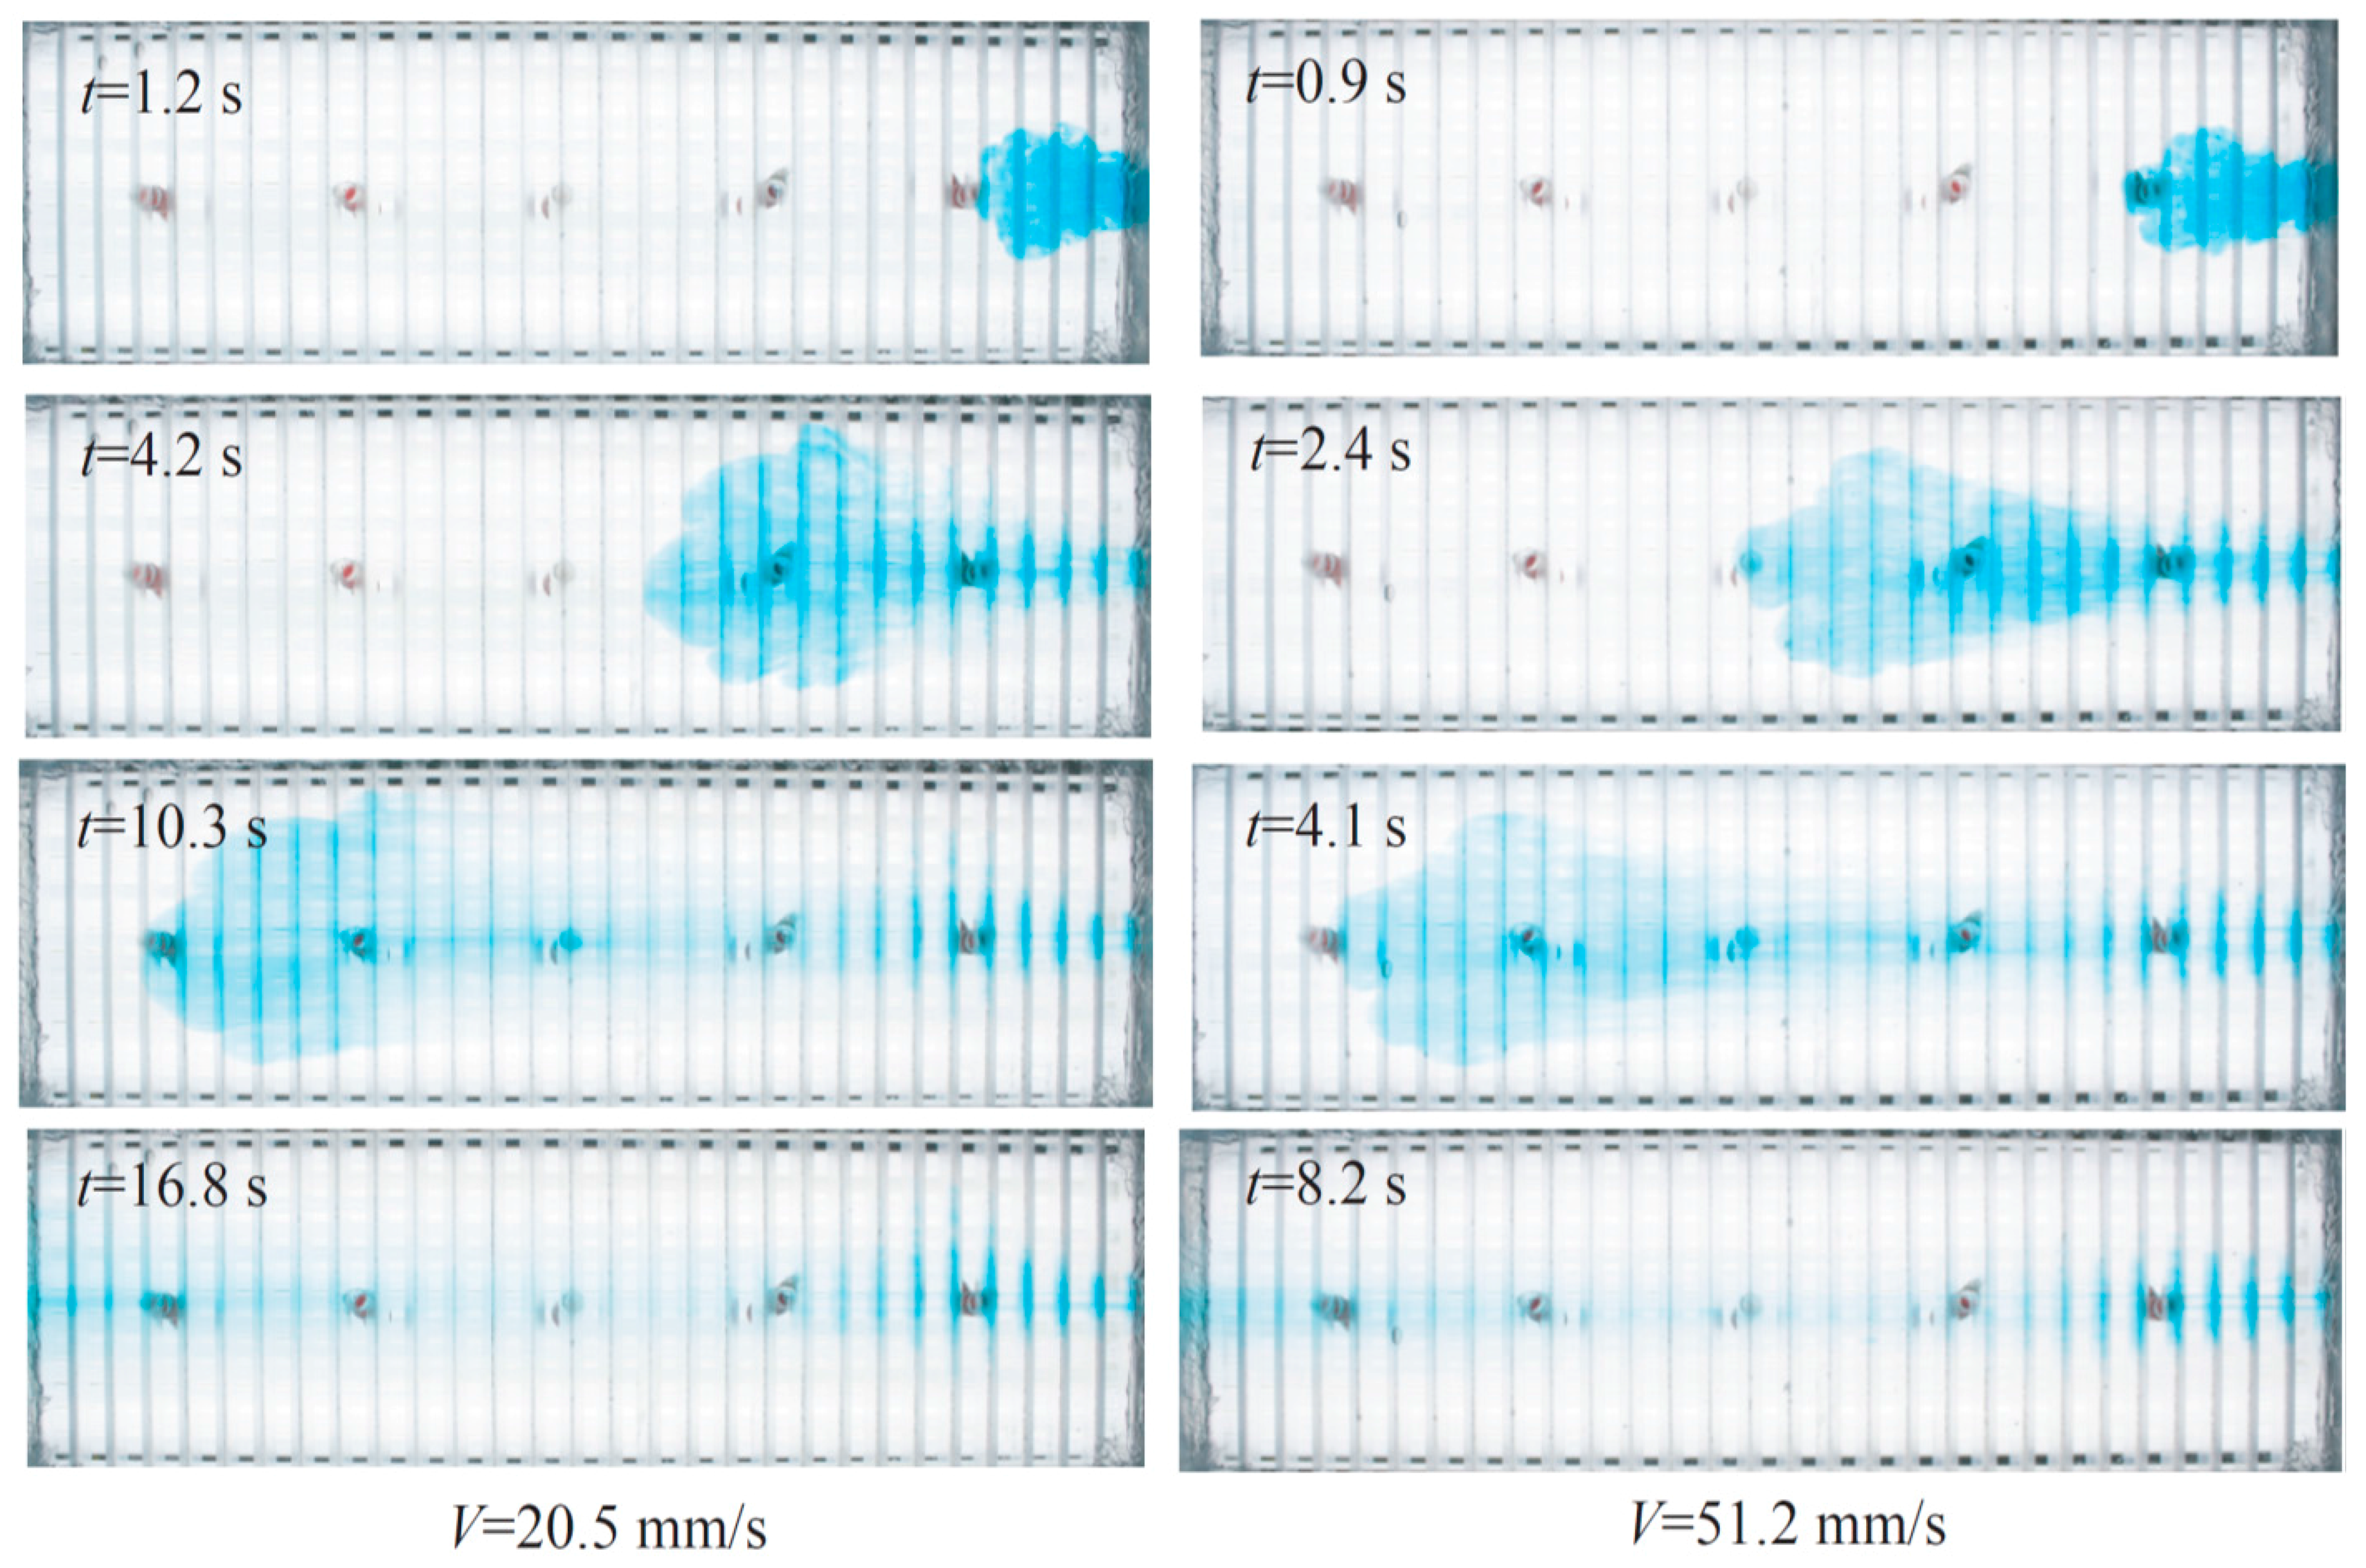
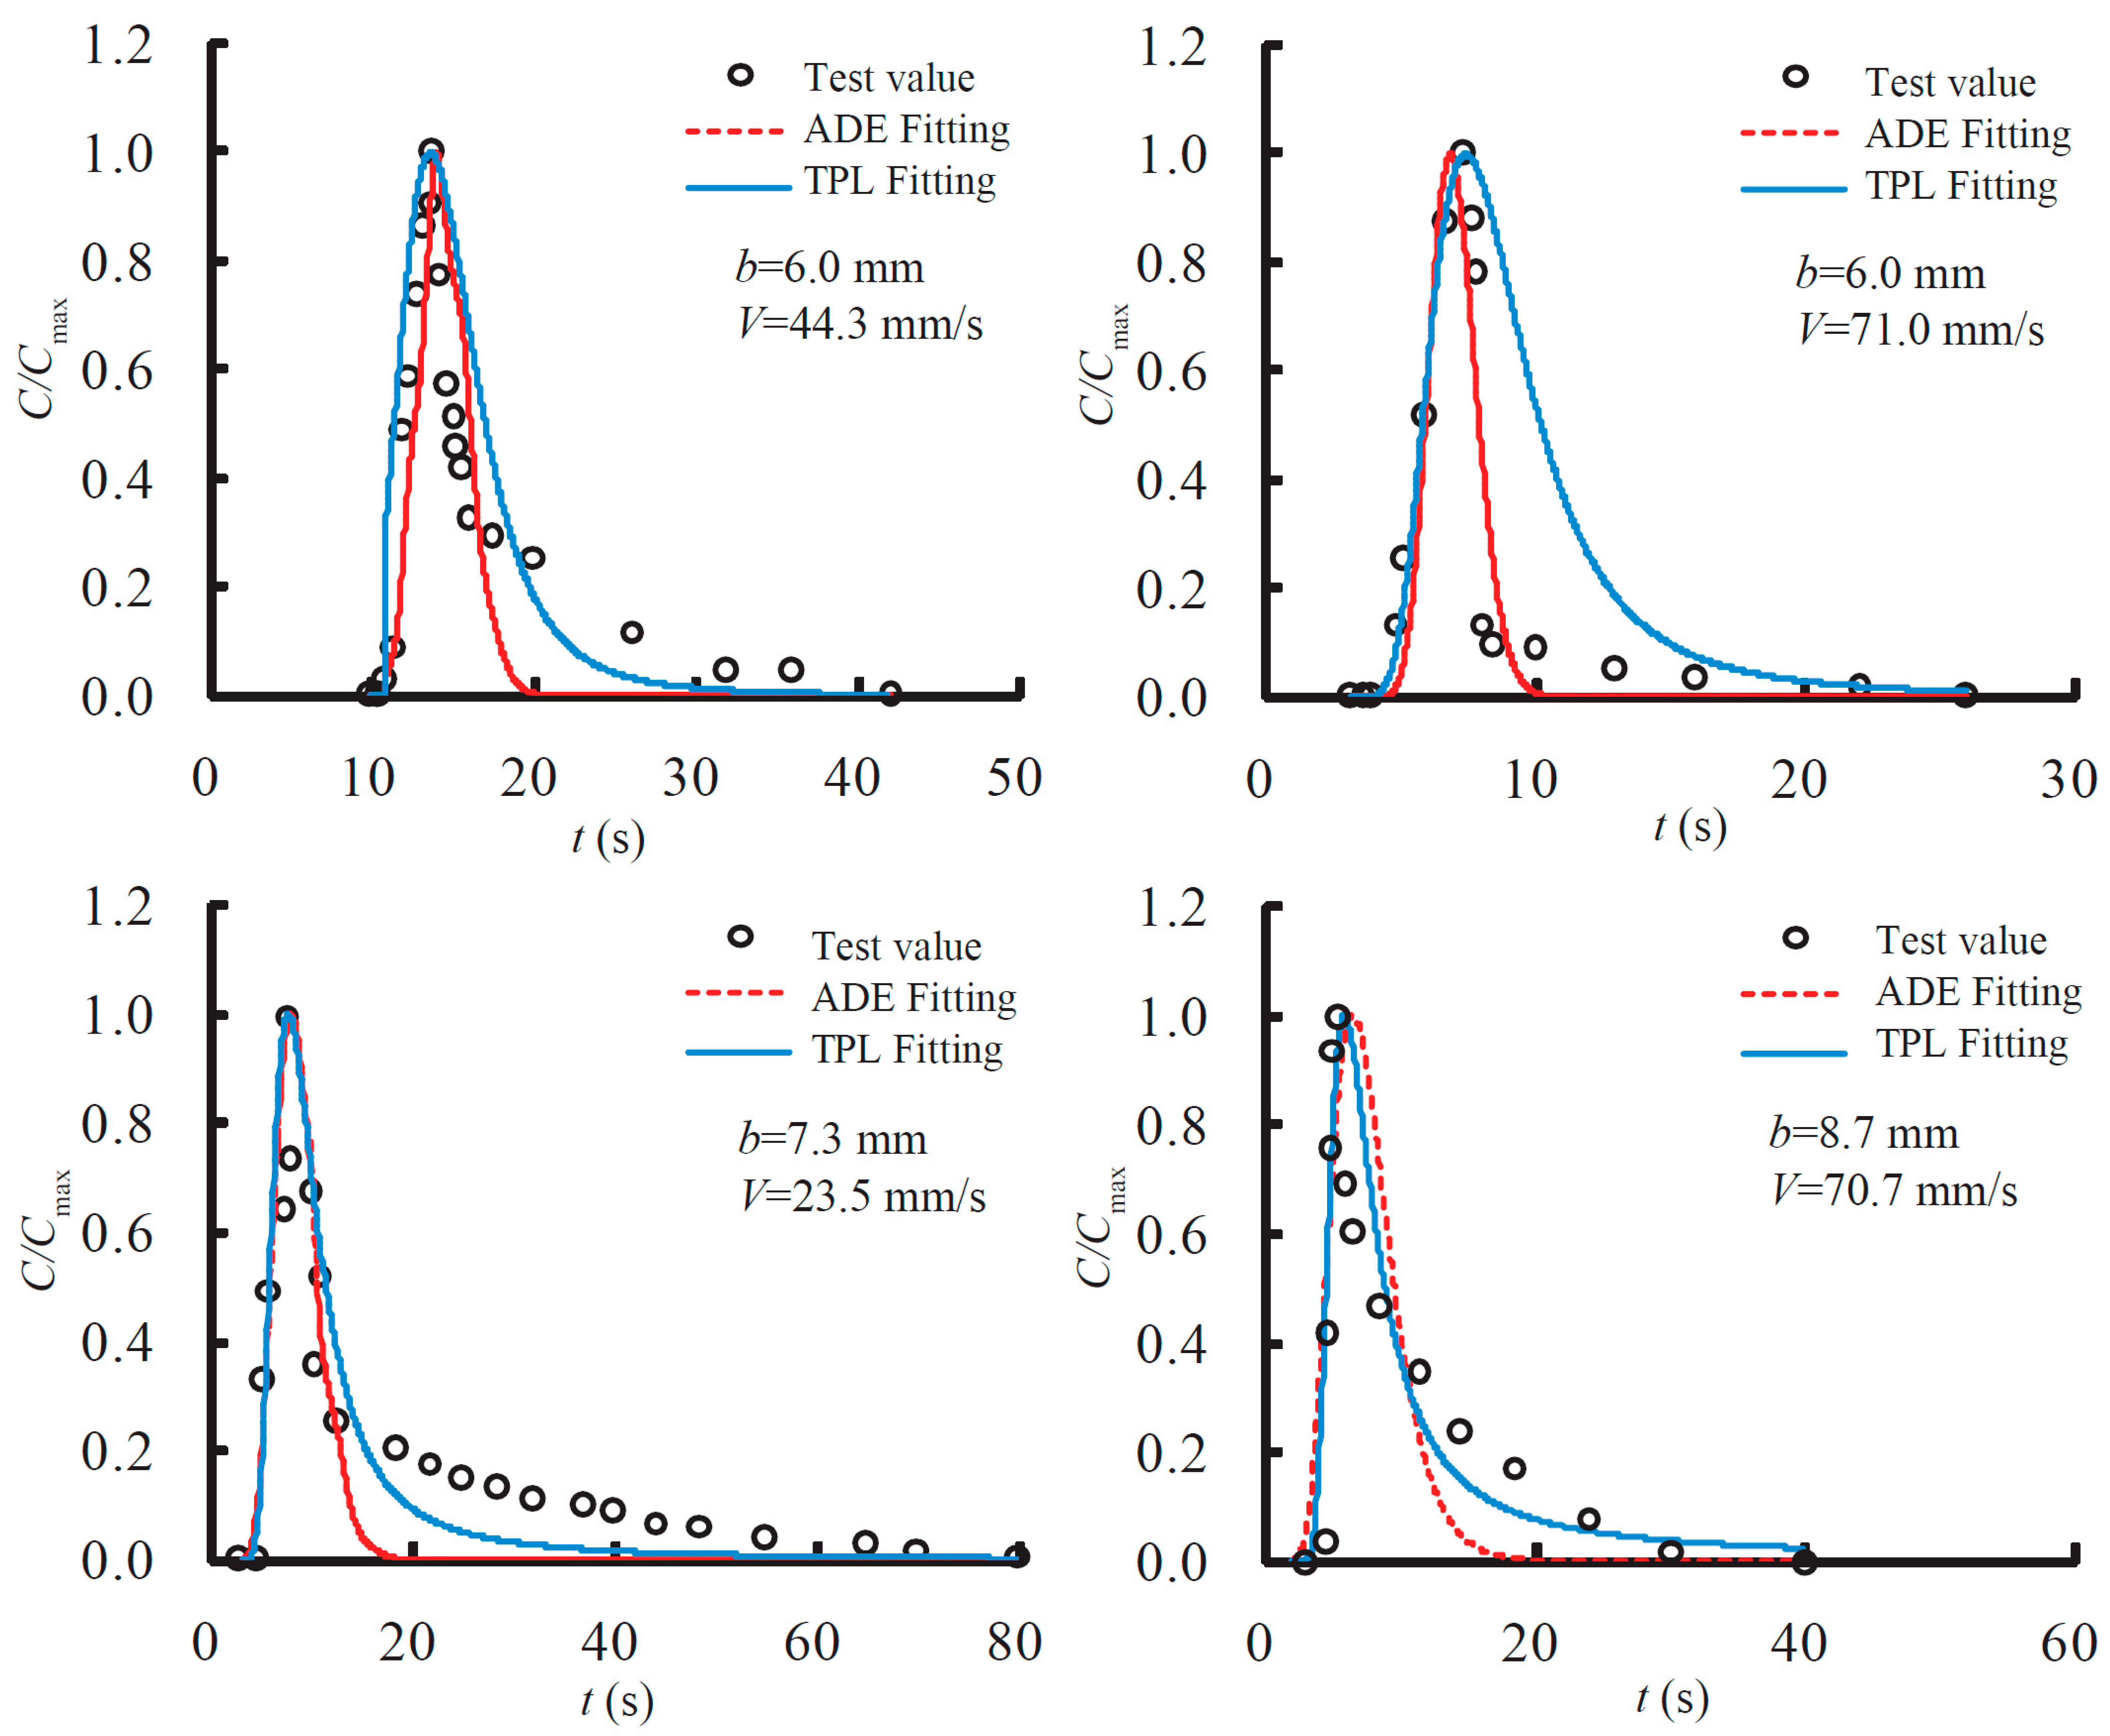
BTCs at position
x = 555 mm in single fractures with smooth parallel plates and rectangular rough single fractures were illustrated and fitted by ADE and CTRW TPL models. The results are shown in
Figure 9 and
Figure 10 and
Table 7 and
Table 8.
We can make several interesting observations from
Figure 9 and
Figure 10. First, BTCs followed the normal distribution in smooth single fractures, especially when the flow velocity was small. Second, as the flow velocity
V increased, BTCs appeared to exhibit non-normal distributions with long tails. These non-normal distributions could be found ubiquitously in rough single fractures. Third, the classical ADE model was incapable of capturing the long-tailing of BTCs either in smooth or rough single fractures. However, the CTRW TPL model could better explain BTCs in both smooth and rough single fractures, especially in capturing the long-tailing phenomenon.
Similar conclusions can be obtained from
Table 7 and
Table 8, as demonstrated by relatively smaller values of
R2 and larger RMSE values for the ADE model compared with the CTRW TPL model. The
R2 values were greater than 0.95 and the RMSE values were less than 0.1 with the CTRW TPL model, indicating satisfactory goodness of fit. It could be seen that the
t1 value in the CTRW TPL model was less than the observation time of the test and the
t2 value in the same model was much larger than the observation time of the test, indicating that the solute transport through single fractures under experimental flow conditions was far from reaching Fickian transport.
It can be seen from
Table 7 and
Table 8 that 1 <
β < 2, reflecting how the solute transport in both smooth and rough single fractures under non-Darcian flow conditions had not reached Fickian migration. The
β value decreased with the flow velocity and the relative roughness (
), indicating that the degree of nonlinearity was stronger with larger flow velocity; and the degree of deviation from Fickian transport was also higher. Meanwhile, an increase of the asperity height would further aggravate the irregularity of solute transport. The above observations were made based on a
β value of 1.05 and a
value of 0.6 in single fractures with rectangular roughness.
In addition, the parameter vψ, which is the average velocity of solute particles in the CTRW TPL model, was much larger than the actual average velocity of V. This implied that the average velocity of solute particles was greater than the average velocity of flow.
To further study the effect of relative roughness (
) on solute transport, BTCs at position
x = 355 mm downstream,
V of 71.0 m/s,
b of 8.7 mm and 6.0 mm, and
of 0.2 and 0.6 in single fractures with rectangular roughness were fitted by the CTRW TPL model; while BTCs at position
x = 355 mm downstream,
V of 49.5 m/s,
b of 8.7 mm and 7.3 mm, and
of 0.2 and 0.4 in single fractures with trapezoidal roughness were also fitted by the CTRW TPL model. The fitting results can be seen in
Table 9. As a reference for comparison, BTCs at position
x = 355 mm downstream,
V of 59.0 m/s, and
b of 4.7 mm and 8.7 mm in single fractures with smooth parallel plates were also fitted by the CTRW TPL and the results are also listed in
Table 9.
From
Table 9, one can see that an increase of
resulted in a significant reduction in the value of
β; that is, the degree of non-Fickian transport (or the deviation from Fickian transport) was affected significantly by
in rough single fractures. However, the change of the
b values in single smooth fractures had little effect on the value of
β.
Furthermore, to analyze the effect of fracture roughness type (rectangular or trapezoidal) on solute transport, BTCs from rough single fractures with rectangular and trapezoidal roughness under the same flow condition (
V = 36.0 mm/s) and the same
value of 0.4 were fitted by the CTRW TPL model, and the results are shown in
Table 10. As a reference for comparison, BTCs from smooth single fractures and rough single fractures with trapezoidal roughness under the same flow condition (
V = 51.5 mm/s) and the same
b value of 6 mm were fitted by the CTRW TPL model and the results are also listed in
Table 10.
We can conclude from
Table 10 that the
β value under the same flow condition in a rough single fracture with a rectangular-type of roughness was smaller than that with a trapezoidal-type of roughness. As shown in Chen et al. [
11], recirculation of flow in the eddies and curved streamline in a rough single fracture with the rectangular-type of roughness caused greater energy loss than that in the rough single fracture with a trapezoidal-type roughness. Such additional energy loss caused a greater degree of flow nonlinearity or stronger non-Darcian flow, leading to stronger non-Fickian transport and a smaller
β value.
In summary, the heterogeneity of the fractured media, which is reflected in the relative roughness and roughness structure, was primarily responsible for the non-Fickian transport through rough single fractures. Also, the increase of flow nonlinearity of non-Darcian flow can exacerbate the non-Fickian transport phenomenon.


