Article

Detection of Bagworm Infestation Area in Oil Palm Plantation Based on UAV Remote Sensing Using Machine Learning Approach

by
Siti Nurul Afiah Mohd Johari
1,
Siti Khairunniza-Bejo
1,2,3,*,
Abdul Rashid Mohamed Shariff
1,2,3,
Nur Azuan Husin
1,2,
Mohamed Mazmira Mohd Masri
4 and
Noorhazwani Kamarudin
4
1
Department of Biological and Agricultural Engineering, Faculty of Engineering, Universiti Putra Malaysia (UPM), Serdang 43400, Selangor, Malaysia
2
Smart Farming Technology Research Centre, Universiti Putra Malaysia (UPM), Serdang 43400, Selangor, Malaysia
3
Institute of Plantation Studies, Universiti Putra Malaysia (UPM), Serdang 43400, Selangor, Malaysia
4
Malaysian Palm Oil Board (MPOB), No. 6, Persiaran Institusi, Bandar Baru Bangi, Kajang 43000, Selangor, Malaysia
*
Author to whom correspondence should be addressed.
Agriculture 2023, 13(10), 1886; https://doi.org/10.3390/agriculture13101886
Submission received: 6 September 2023 / Revised: 19 September 2023 / Accepted: 21 September 2023 / Published: 27 September 2023
(This article belongs to the Special Issue Digital Innovations in Agriculture—Series II)

Abstract

:
Due to its rapid reproduction rate and brief life cycle, the most well-known oil palm pest, Metisa plana (Lepidoptera: Psychidae), also known as the bagworm, can spread to epidemic proportions. The outbreak can significantly reduce oil palm yield by resulting in 40% crop losses and 10% to 13% leaf defoliation. A manual census was conducted to count the number of pests and determine the category of infestation; however, when covering a large area, it typically takes more time and labour. Therefore, this study used unmanned aerial vehicles (UAVs) as a quick way to detect the severity levels of infestation in oil palm plantations, including healthy (zero), low, mild, and severe infestation using DJI Inspire 2 with Micasense Altum-PT multispectral camera at an altitude of 70 m above ground. Three combinations were created from the most significant vegetation indices: NDVI and NDRE, NDVI and GNDVI, and NDRE and GNDVI. According to the results, the best combination in classifying healthy and low levels was found to be NDVI and GNDVI, with 100% F1 score. In addition, the combination of NDVI and NDRE was found to be the best combination in classifying mild and severe level. The most important vegetation index that could detect every level of infestation was NDVI. Furthermore, Weighted KNN become the best model that constantly gave the best performance in classifying all the infestation levels (F1 score > 99.70%) in all combinations. The suggested technique is crucial for the early phase of severity-level detection and saves time on the preparation and operation of the control measure.

1. Introduction

Bagworms (Lepidoptera: Psychidae) are tiny insect pest larvae that are prevalent worldwide in arborvitae as well as other fruit and flower crops like apple, maple, elm, poplar, oak, birch, black locust, cypress, juniper, willow, and juniper. In Malaysia, bagworm, especially Metisa plana, is the most serious insect pest which is capable of reaching epidemic proportions in oil palm plantations by presenting higher numbers than usual [1]. Bagworms are “naturally created” to easily become pests due to their high reproductive rate and short life cycle, which are gifts of natural advantages, along with their unique dispersal mode, case construction, and silk thread as survival mechanisms [2]. Bagworm outbreaks are frequent in oil palm plantations and can result in up to 40% crop losses and 10% to 13% leaf defoliation, both of which have a significant negative economic impact on oil palm yield [1,3]. According to Chung [4], small holes from feeding are the first signs of bagworm damage on fronds. The outbreaks are noticeable because the bagworms start eating as soon as they hatch, scraping the top surface of the leaf until it dries out and leaving holes. The palms with severe bagworm infestations suffer increased amounts of foliage damage until all the fronds are lost, typically in the upper part of the palm fronds, which appear brown in colour. Brownish-coloured frond damage results from severe bagworm infestation. Furthermore, the severely damaged leaves caused the lower and central crown to appear greyish brown [5]. When pest populations reached their maximum growth potential, they frequently reached levels that significantly reduced leaf cover over large areas and had a propensity to recur [6]. Single-species outbreaks were frequently reported, while mixed species outbreaks could affect both young and old palms, though the area of the outbreak is typically larger on older palms [7]. According to Aziz et al. [8], precise estimation of the infestation based on the oil palm foliar damage is difficult to identify. Thus, the estimation of the damage severity rating was used which corresponds to the bagworm infestation. The severity rating was divided into four levels, which started with zero infestation, followed by light damage, medium damage, and serious damage. All the severity ratings are summarized in Table 1.
A census must be conducted to effectively control bagworm in an oil palm plantation. It is carried out to count the number of insect pests directly, which involves a superficial inspection for signs of pest incidence [5]. It is conducted by cutting down one frond to count the number of larvae on both sides of the frond. According to the Standard Operating Procedure (SOP) of bagworm control by the Malaysian Palm Oil Board (2016) [9], a census is conducted on 1% of the infested area, subject to the entire infested area, where one palm of every ten is sampled. Critical early defoliation can be considered present when there are ten larvae on each frond [10]. When it comes to covering a large area, this method typically requires more time and labour. Therefore, a quick and trustworthy method utilising remote sensing would be helpful in determining the degree of bagworm-infested area for prompt decisions regarding outbreak control measures.
Technology advancements that replace manual sampling techniques have benefited the agriculture sector, particularly in terms of increasing crop production. Unmanned aerial vehicles (UAV), also known as drones, are an increasingly important component of remote sensing tools in the context of precision farming. UAVs have limitless potential in agriculture, and they have the power to revolutionise the industry along with smart farming and new data management techniques [11]. Usually, UAV platforms equipped with a wide range of sensor types, such as visual RGB (Red, green, blue) cameras, multispectral cameras, hyperspectral cameras, and thermal cameras that can capture images with flexible revisit scheduling at low altitudes with ultra-spatial and temporal resolutions have allowed for the observation of small individual plants and the extraction of information at a fine scale that can aid farmers in making decisions, improve agricultural production, and maximise resource utilisation [12,13,14].
Moreover, UAV images and machine learning (ML) techniques have developed new ways to examine datasets recently, particularly in precision agriculture. These models can be powerful and useful tools for the prediction of various crop parameters using data obtained from UAV images. Vegetation Indices (VI) are algebraic combinations of different spectral bands that are used to highlight the vigour and other characteristics of vegetation (i.e., canopy biomass, absorbed radiation, chlorophyll content, etc.) [15]. Many VIs can be obtained from RGB cameras or multispectral cameras that consist of five channels (i.e., red, green, blue, near infrared, and red edge), such as the normalized difference vegetation index (NDVI), the green normalised difference vegetation index (GNDVI), the normalized difference red edge (NDRE), the simple ratio (SR), and the chlorophyll index (CI). These VIs were usually used to provide significant information in analysing vegetation traits such as plant diseases, pests, and stress detection. For instance, Klouček et al. [16] calculated selected vegetation indices (i.e., greenness index (GI), simple ratio (SR), green ratio vegetation index (GRVI), normalized difference vegetation index (NDVI), and green normalized difference vegetation index (GNDVI)) and evaluated them based on visual differences in the spectral curves of bark-beetle-infested tree and healthy trees. Minařík et al. [17] extracted elevation features (crown area, height percentiles) and three vegetation indices (i.e., NDVI, NDRE, and Enhanced Normalized Difference Vegetation Index (ENDVI)) to detect a bark beetle disturbance in a mixed urban forest. According to Tsouros et al. [18], the most popular techniques for analysing UAV imagery for precision agriculture include vegetation indices and machine learning. These techniques were used to detect pests and diseases in a variety of crops, including coffee [19], wheat [20], citrus [21], cotton [22] and forests [16,23], as summarized in Table 2. Despite the number of various remote sensing approaches that were used to monitor pests and diseases in oil palm plantations [24,25], their application at the UAV platform together with vegetation indices and machine learning techniques is still limited [26,27]. Based on Table 2, it also can be concluded that the same vegetation indices can be used to detect different types of pests and diseases in different types of crops. Therefore, it also has the potential to be used for detecting bagworm infestation areas in oil palm plantations.
Previously, several bagworm studies were conducted in ground-based and aerial-based detection. Ground-based detection normally was carried out to detect the presence of bagworm, as performed by Ahmad et al. [28], who identified both live and dead bagworms Metisa plana using a motion tracking technique on oil palm fronds. Nevertheless, this method was only applied to live and dead bagworms without knowing the specific instar stage. Since classifying bagworm instar stages is essential for early prevention, Mohd Johari et al. [29] used machine learning to identify bagworm instar stages based on spectral properties and upgraded to automatic detection using the transfer learning approach [30]. However, these studies did not address the infestation. Previously, the detection of foliar damaged was carried out by Aziz et al. [8], who discovered that the most sensitive wavelengths (i.e., 570 nm, 680 nm, 734 nm, 787 nm, 996 nm, and 1047 nm) to detect bagworm-infested foliar damage using ground-based spectrometer. However, these studies were not appropriate to be applied in a large plantation area, as they require high labour costs and are time consuming; thus, an aerial-based approach was proposed to recognise the issue. Anuar et al. [27] applied a multispectral camera mounted on an UAV to detect the bagworm-infested area and compare it with healthy area and concluded that a multispectral false-colour composite has the capability to differentiate between healthy and bagworm-infested oil palm. Nonetheless, this study only focuses on two areas (i.e., healthy, and infested) and does not distinguish between different infested areas, such as low-infestation areas, mildly infested areas, and severely infested areas.
Based on the literature listed above, the study that assessed the potential of UAV images in detecting different severity levels of bagworm infestation in oil palm plantation was limited, and more needed to be discovered. Therefore, this study uses UAV-acquired images and machine learning techniques to locate the bagworm Metisa plana infestation area. This study focuses exclusively on the ability of machine learning to categorise the severity level of infestation as healthy, low infestation, mild infestation, and severe infestation using vegetation indices extracted from UAV images.

2. Materials and Methods
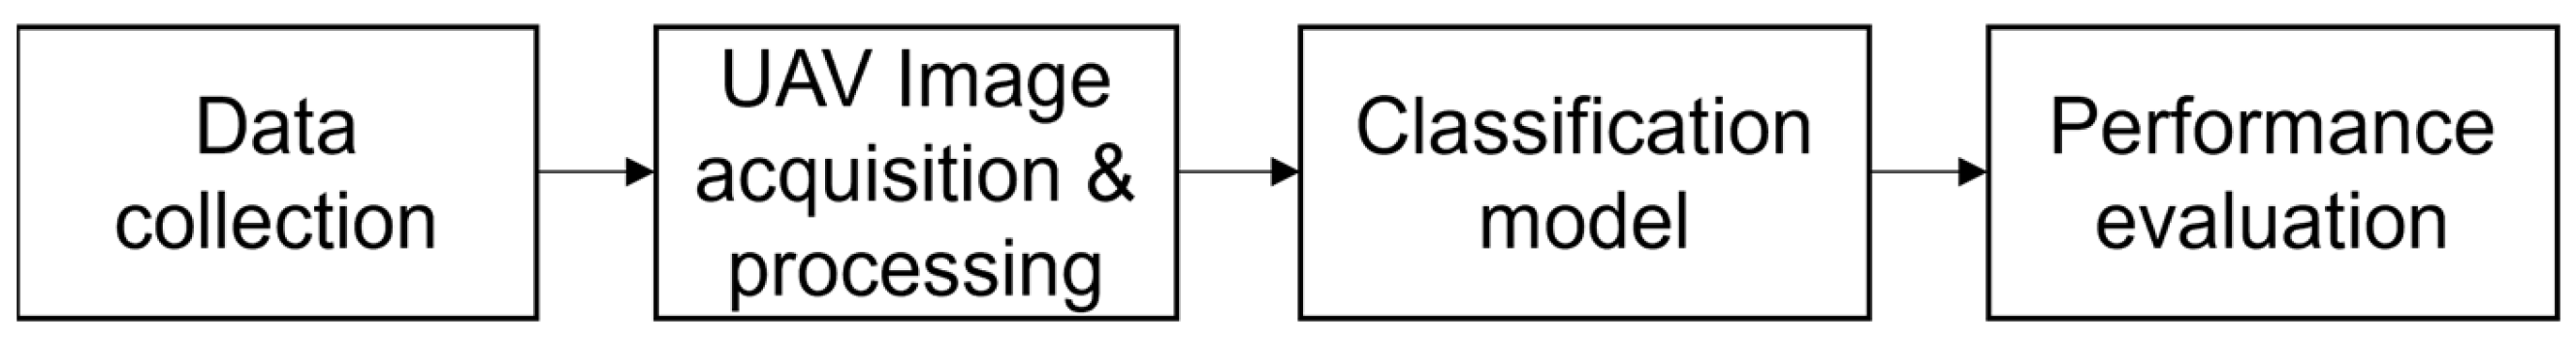
2.1. Overview

Figure 1 shows a flowchart of this study. It began with the data collection, including study site selection for each category of bagworm infestation, i.e., healthy, low, mild, and severe infestation, and also the ground assessment of the level of infestation. Image acquisition was conducted using an UAV, and all the captured images were then processed for mosaicking and exported in TIFF format. Six selected vegetation indices were derived and extracted from the imagery. Statistical analysis was carried out to identify the significant differences between the indices. The three most significant indices were selected for the classification model. Then, the performance of the model was evaluated based on the value of accuracy and F1 score. Due to the imbalanced dataset, undersampling and oversampling methods were used to achieve the balance distribution of the dataset for the further analysis. A classification model was developed using the combination of significant vegetation indices. The model was then tested with the original dataset, and the performance of the model was evaluated. The most insensitive model with the highest F1 score was selected as the best model in this study.

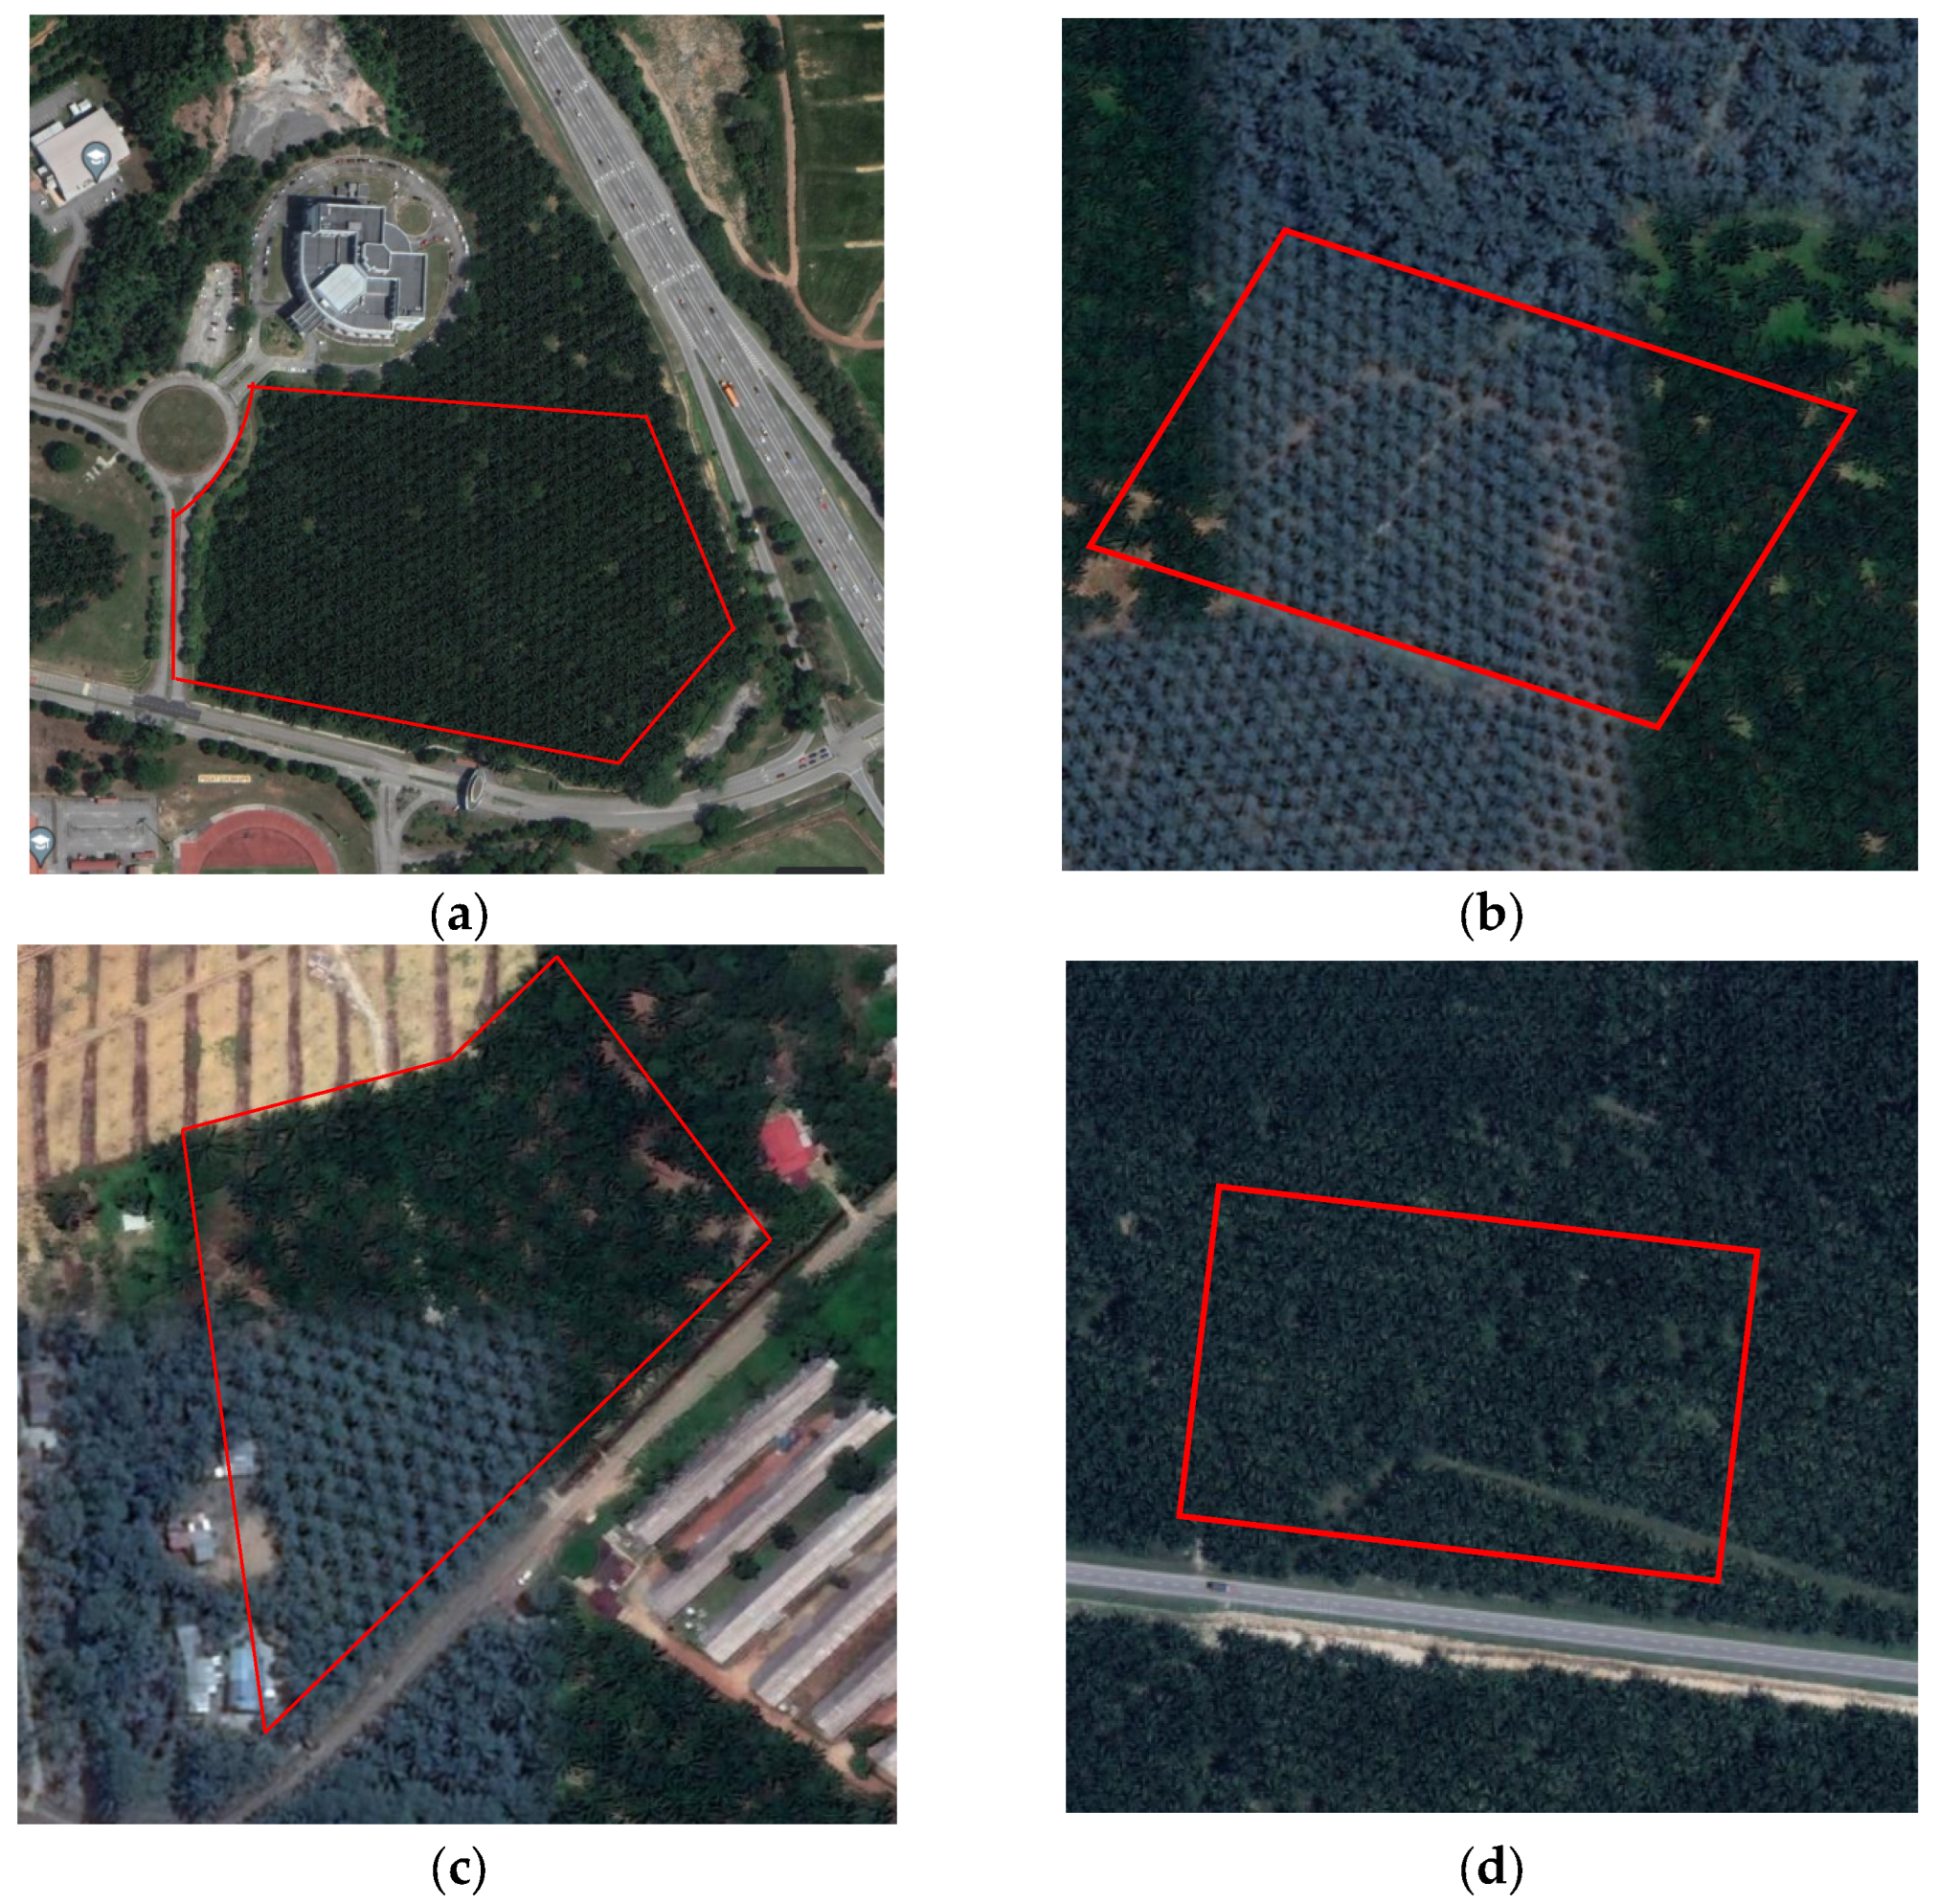
2.2. Data Collection

This study was conducted in three different plantation areas, which covers four categories of infestation, as described in Table 3. These study areas are presented in Figure 2 using a Google Earth imagery (2020) and labelled in the red frames. A healthy plantation area that showed no sign of infestation was located at Serdang, Selangor, covering about 6 hectares at coordinate location (2°59′13″ N, 101°43′34″ E) (Figure 2a). Low and mild infestations were located at Pagoh, Johor (Figure 2b,c), covering 7.0 and 2.0 hectares, respectively. Meanwhile, a severe infestation area was located at Ayer Kuning, Perak, with coordinate location (4°11′56″ N, 101°07′38″ E), covering 10 hectares (Figure 2d).
The incidence of oil palm trees was determined to assess the bagworm infestation in the oil palm plantation using a quantitative assessment, which was carried out based on bagworm-infestation symptoms. The assessment was carried out based on the number of infested fronds over the total number of fronds of each oil palm tree, as suggested by Thaer et al. [31], using the following formula in Equation (1).
i n c i d e n c e   r a t e = n u m b e r   o f   i n f e s t e d   f r o n d n u m b e r   o f   t o t a l   f r o n d
Usually, each palm consists of 30–40 frond leaves. The infected fronds were identified based on the condition of the frond and the number of bagworms detected per frond. The incidence rate was ranked according to infestation and severity of the bagworm infestation, subject to the severity scale mentioned previously. In addition, a manual census was also carried out to identify the bagworm instar stage and to sum up the existence of the bagworms in each frond. The process involved cutting the frond randomly and observing the bagworms. The incidence rate and the number of bagworms per frond are summarized in Table 4.

2.3. UAV Image Acquisition and Processing

The images were taken with fixed exposure settings between 10:00 and 11:00 am local time on a clear and non-cloudy day using a DJI Inspire 2 UAV (DJI Sky City, Shenzen, China) with a rotary wing, known as a quadcopter, equipped with a Micasense Altum-PT multispectral camera (Seattle, Washington, DC, USA) (Figure 3).
The Micasense series, which has five bands and can record data in the RGB, near-infrared, and red-edge regions (400–900 nm), was the pioneer of multispectral cameras [32]. It can be used in a wide range of UAV types because of its lightweight design (577 g) and small size (11 cm × 8 cm × 6.9 cm). It has five sensors with resolution of 3.2 megapixels (2064 × 1544 pixels) in the five spectral regions of blue (475–500 nm), green (550–565 nm), red (665–675 nm), red edge (715–725 nm), and NIR (825–860 nm). The sensor acquires all five bands at a ground sample distance (GSD) of 120 m at a speed of up to 2 captures per second with a 50° horizontal field of view (HFOV) and a 38° vertical field of view (VFOV). It also captures ultra-high-resolution panchromatic images and has a thermal sensor at the resolution of 12.4 megapixels (4112 × 3008 pixels) and 0.1 megapixels (320 × 256 pixels), respectively, for data output. A downwelling light sensor (DLS), mounted upward on the UAV, measures incident light and enables radiometric calibration of these 5 multispectral bands during image capture.
Meanwhile, the DJI Inspire 2 is a powerful, high-tech drone that weighs approximately 3.44 kg and is capable of transmitting video in both 1080p and 720p at a maximum distance of 7 km. It travels at an impressive 94 km/h, which is quite fast. The UAV measures 42.7 cm in length, 31.7 cm in height, and 42.5 cm in width. There are 150 to 390 RAW images for each flight mission. The GPS coordinates on each photo help with 3D reconstruction.
In this study, the flight altitude was set at 70 metres above ground. Orthomosaics with a 5.28 cm spatial resolution were taken at a speed of up to two captures per second and with 80% longitudinal and 75% lateral overlap. The Pix4Dmapper software version 4.13.1 (1) (Pix4D SA, Lausanne, Switzerland) was used to execute the flight missions autonomously. All the images taken were stored in an SD card.
Image mosaicking was performed in Agisoft Metashape Professional software (Agisoft LLC., St. Petersburg, Russia), which generates a multispectral orthomosaic which includes each band imagery (Blue, Green, Red, Red-edge, NIR and thermal). Agisoft was the most widely used software due to its advantages of excluding low-quality images and its standardised workflow [33]. The process of mosaicking was started by importing all the images into the software. The primary channel was set to panchromatic for a higher-resolution panchromatic band during alignment. The MicaSense Calibrated Reflectance Panel, which was captured prior to the flight, was then used to radiometrically calibrate all the images. The primary goal is to adjust the various radiometric resolutions between the UAV camera and the sensing periods. Then, the images were aligned, and a dense point cloud model of the objects was built from the numerous collected images while also fine-tuning the camera positions of each image. After the orthomosaic imagery was generated, all the imagery of each infestation level was then exported for further analysis.
All the images of four infestation levels were loaded in the QGIS, an open-source GIS software version 3.28.2 for data extraction. Reflectance values generated by the multispectral bands corresponding to blue (475–500 nm), green (550–565 nm), red (665–675 nm), red edge (715–725 nm), and NIR (825–860 nm) were used to calculate the vegetation indices. Six vegetation indices were derived, namely, the normalized difference vegetation index (NDVI), the green normalized difference vegetation index (GNDVI), the normalized difference red edge (NDRE), the simple ratio (SR), the green Chlorophyll Index (GCI), and the red edge Chlorophyll Index (RECI) (Table 5).
Five points were randomly selected from each canopy of palm tree, as illustrated in Figure 4. These sampling techniques were implemented for each sample of a tree in each category of infestation. Vegetation indices of these points were then averaged to represent the vegetation indices of each tree.

2.4. Classification Model

A significant level of vegetation indices was identified using Analysis of Variance statistical analysis (ANOVA) in SPSS software (IBM SPSS Statistics 25, IBM, New York, NY, USA) based on a value of p < 0.05. Seventy percent of the total for each infestation level, totalling 11,970 datasets, served as the ANOVA’s input parameters and was later used for model development, while the other 30% (5130) was used for testing. Only three significant vegetation indices with a standard error lower than 0.002 were selected as datasets to develop classification models using the classification learner apps available in the machine learning toolbox from MATLAB (2021b, The Mathworks Inc., Natick, MA, USA).
A K-fold cross-validation function in MATLAB was used to conduct a cross-validation process to assess the performance of the model. It was one of the most popular methods for classifier model selection and error estimation [39]. It divides each sample into a predetermined number of groups (N), of which N-1 groups are used to fit a model while the remaining sample is used for validation. Each group served as the validation group during the ‘N’ times this fitting and validation process was carried out. The model performances were described using the averaged values of the evaluating metrics. In this study, the N is set to 5, as it was randomly partitioned into 5 sub datasets of equivalent size. Figure 5 illustrates the 5-fold cross validation process.
Figure 6 provides a summary of the 5 machine learning classifiers used in this study from the default setting by the classification learner apps in MATLAB, including Decision Tree (DT), Discriminant Analysis (DA), Naïve Bayes (NB), Support Vector Machine (SVM), and K-nearest Neighbour (KNN). The classification models were developed separately using three different combinations of vegetation indices: (a) NDVI and NDRE, (b) NDVI and GNDVI, and (c) NDRE and GNDVI. The best classification model was determined based on the highest F1 score mean value. The use of only 2 combinations of vegetation indices serves to create a straightforward and more cost-effective tool for future hardware design.

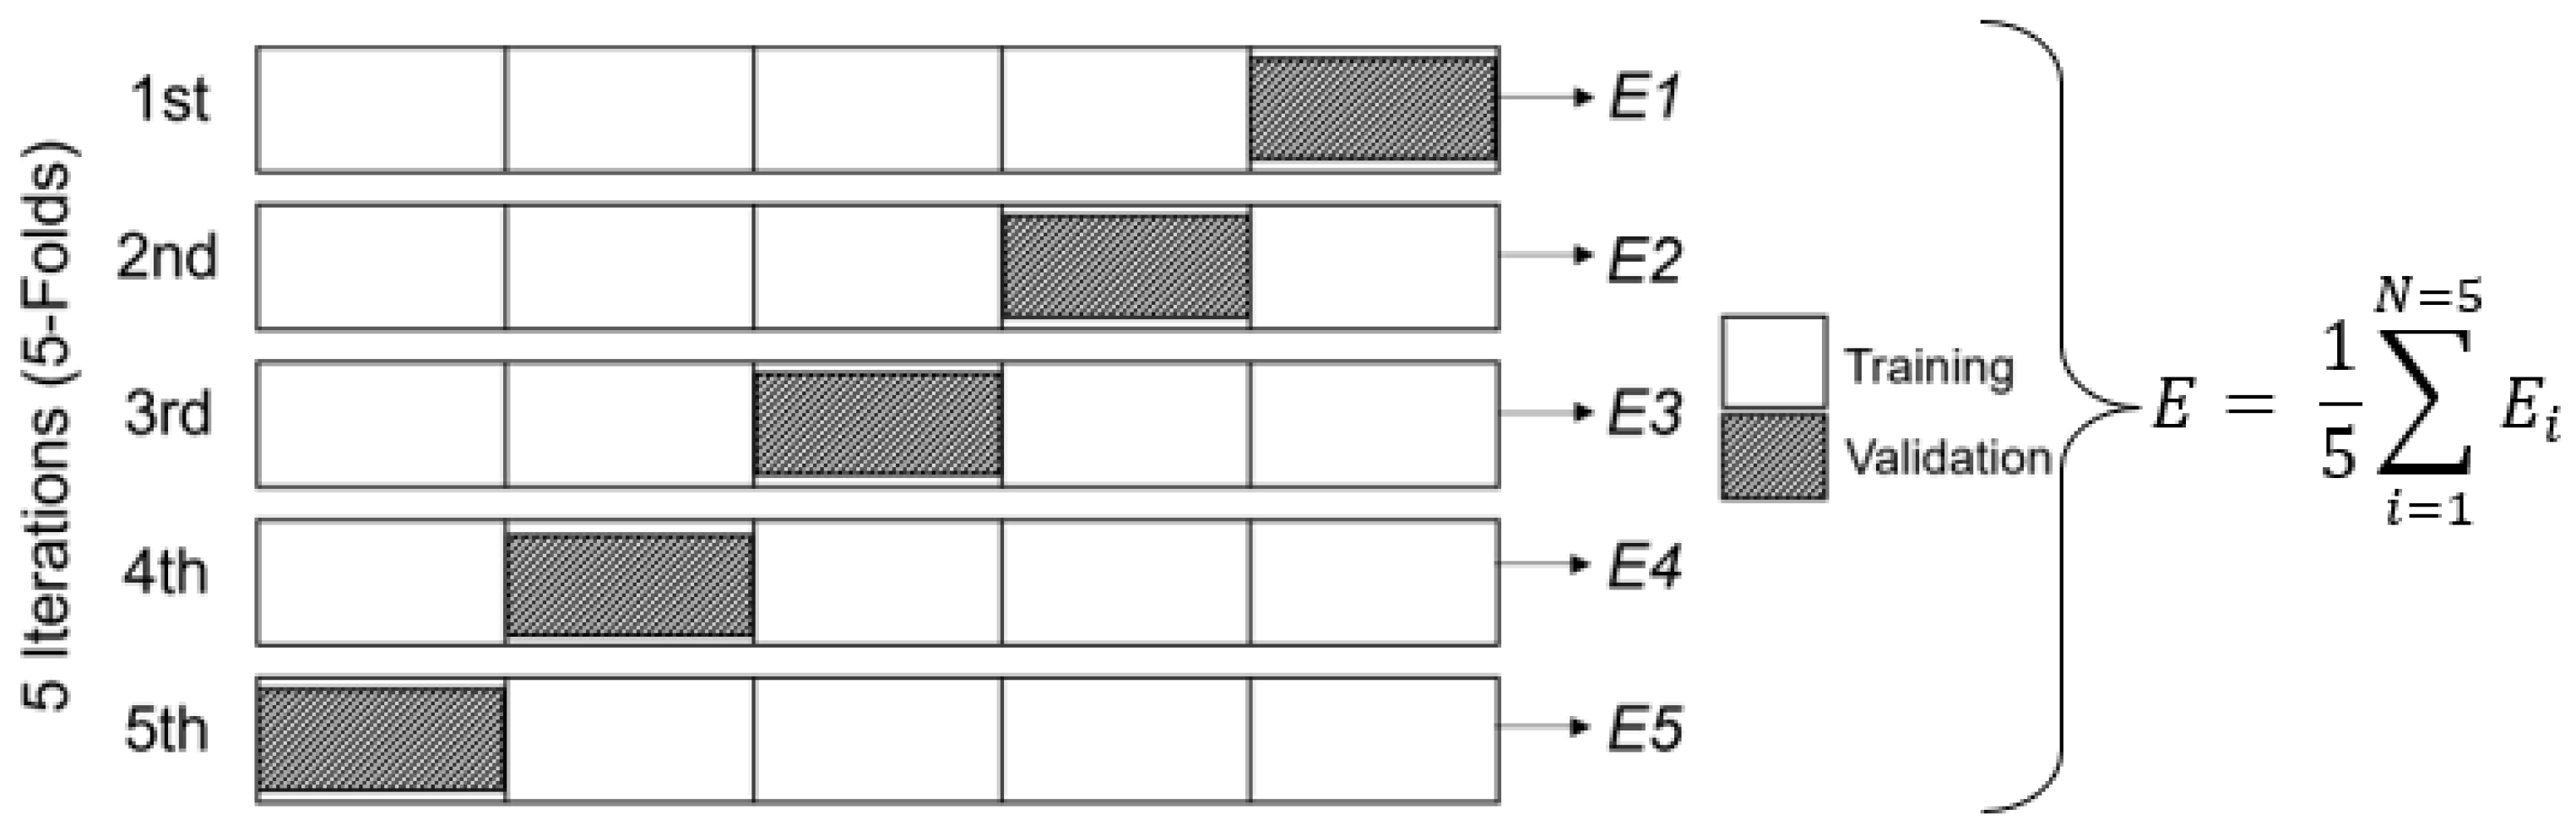
2.5. Performance Evaluation

The classification for each infestation category was displayed using the multiclass confusion matrix, which shows the accuracy for each class while exposing specific misclassifications. From the confusion matrix, true positive (TP), false positive (FP), true negative (TN) and false negative (FN) can be calculated to assess the performance of the model such as accuracy, precision, recall, specificity, and F1 score. Accuracy is the proportion of correctly classified dataset over all datasets. The proportion of correctly predicted positive observations among all predicted positive observations is known as precision (Equation (2)). The proportion of correctly predicted positive observations to all the actual observations in a class is known as recall (Equation (3)). The F1 score (Equation (4)) is the harmonic mean of the precision and recall, which provides a measurement for the number of errors made by the algorithm, with 0 being the worst possible value and 1 being the best possible value. A high F1 score denotes both a high precision and recall. By comparing all the performance metrics, the F1 score seems more reliable when it comes to unbalanced data. A macro average was used to determine the results, which involved calculating each performance separately and averaging them. Additionally, the percentage difference (Equation (5)) of the F1 score between training (i) and testing (j) was then calculated to identify the pattern of the model either overfitting or underfitting.
P r e c i s i o n ,   P = T P ( T P + F P )
R e c a l l ,   R = T P ( T P + F N )
F 1 s c o r e = 2 × ( P × R ) ( P + R )
P e r c e n t a g e   d i f f e r e n c e = | i j | i × 100

3. Results

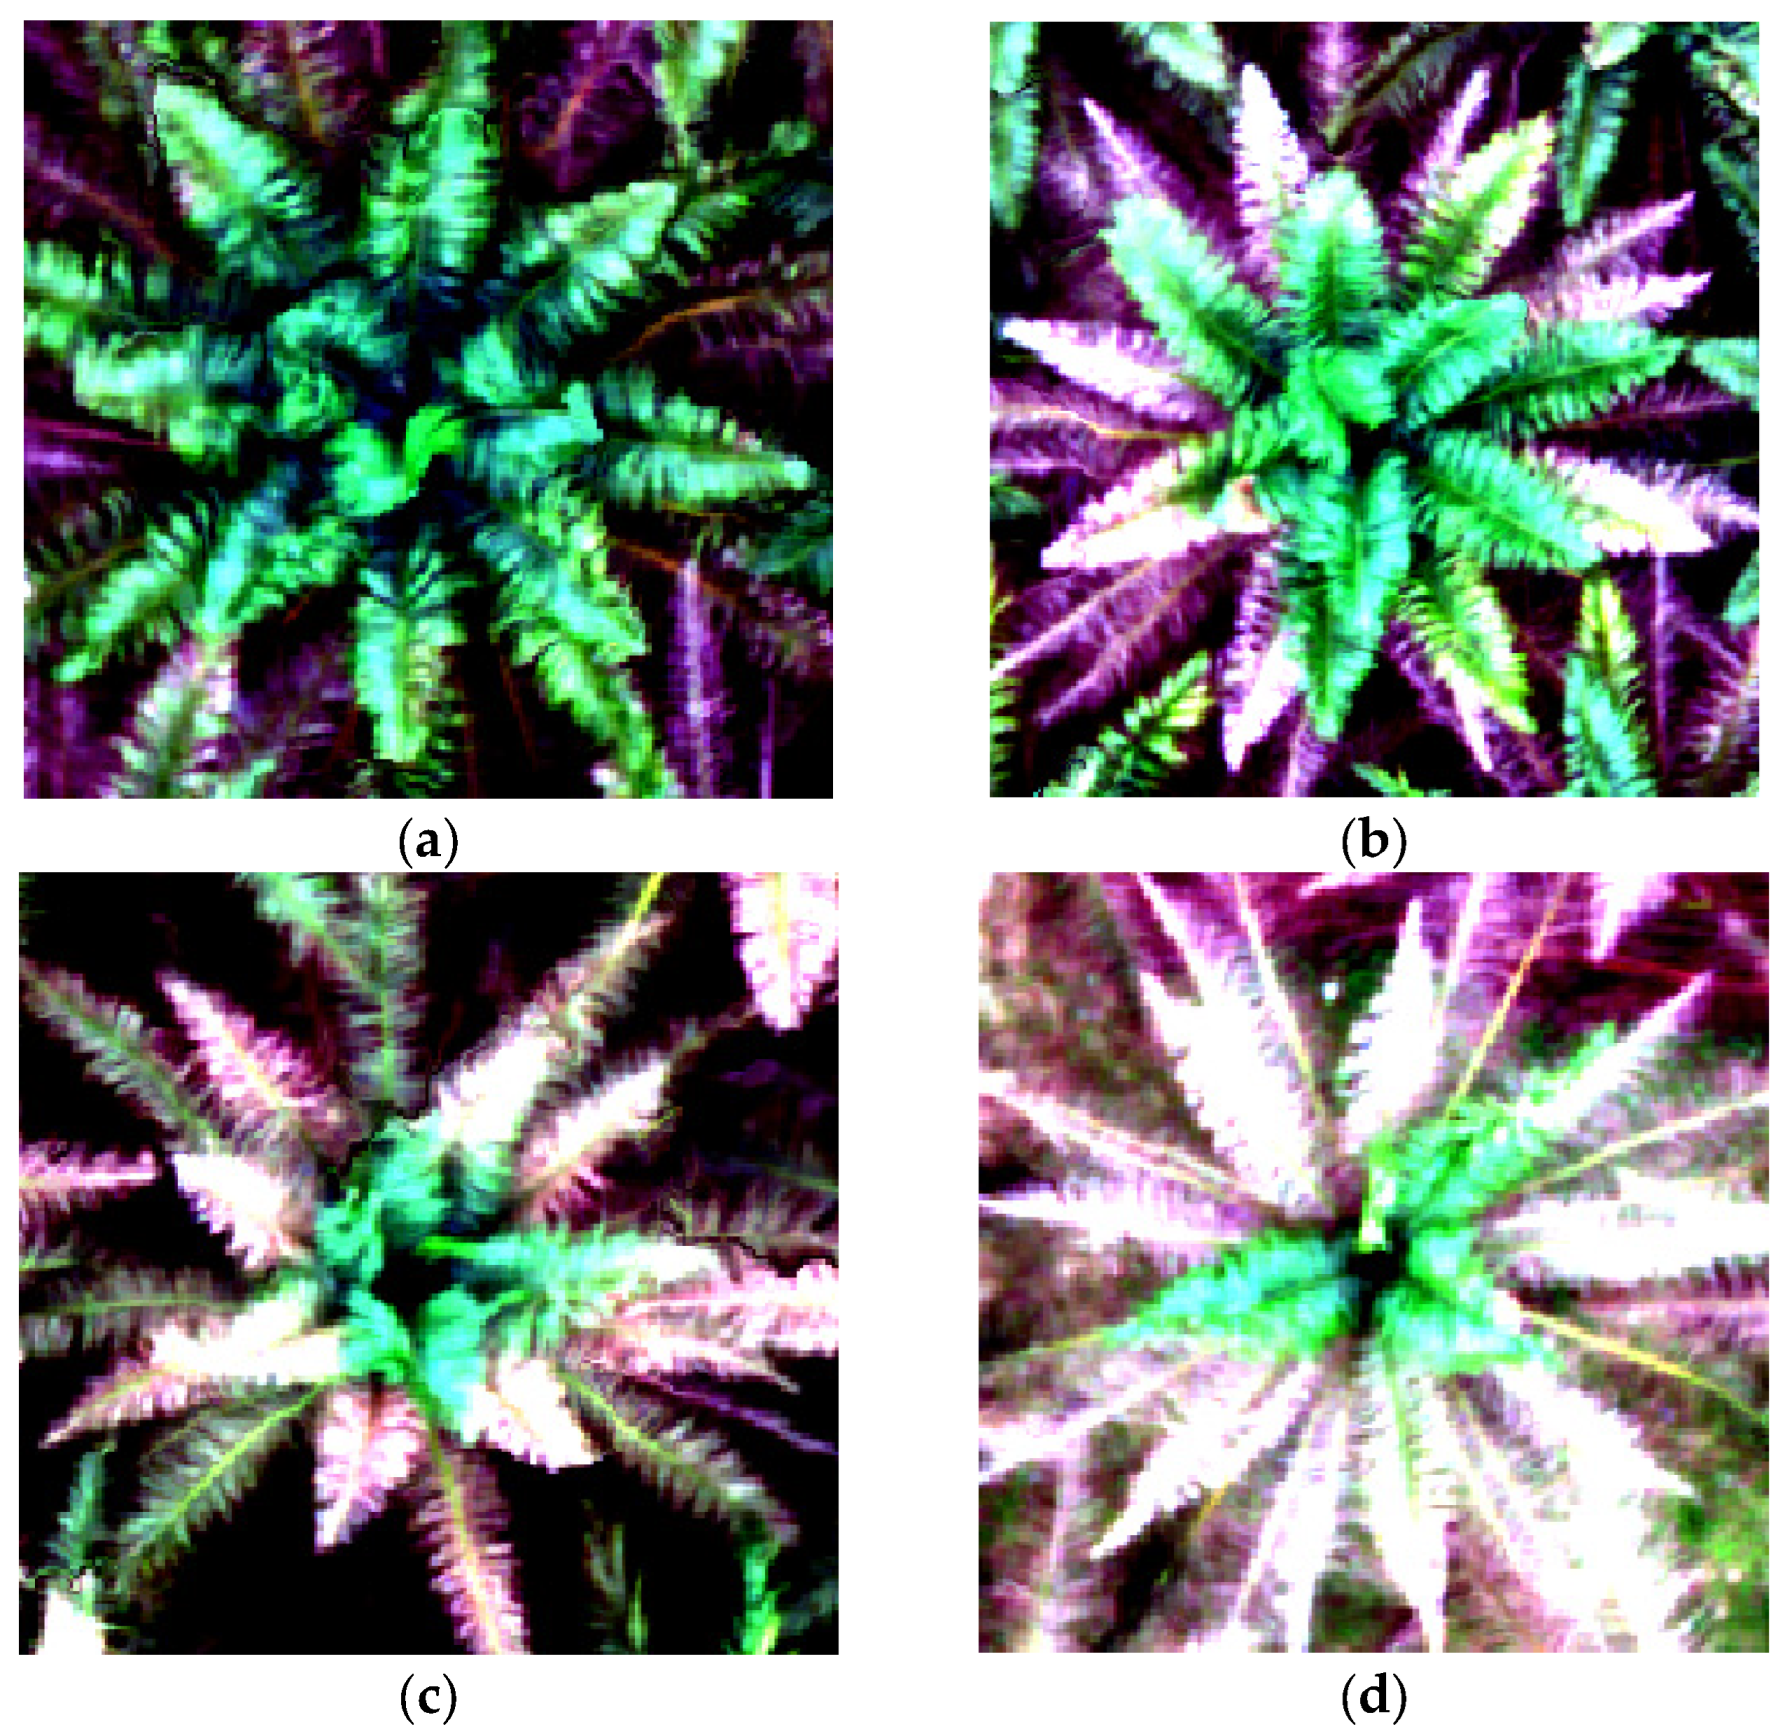
3.1. Imagery Acquisition

Figure 7 displays the canopy image in red, green, and blue (RGB) colour format, for all infestation levels. As shown in Figure 7a, the canopy was completely covered with green frond leaves, indicating that the canopy is unharmed. Figure 7b shows a canopy with low infestation that is beginning to change, particularly at the bottom of the canopy where the frond leaves have begun to dry out. Then, the foliar damage is increasing and starting to strip most of the fronds at the bottom canopy area of Figure 7c, indicating mild infestation. Meanwhile, the severely infested canopy in Figure 7d is completely stripped, with no frond leaves remaining at the bottom of the canopy.

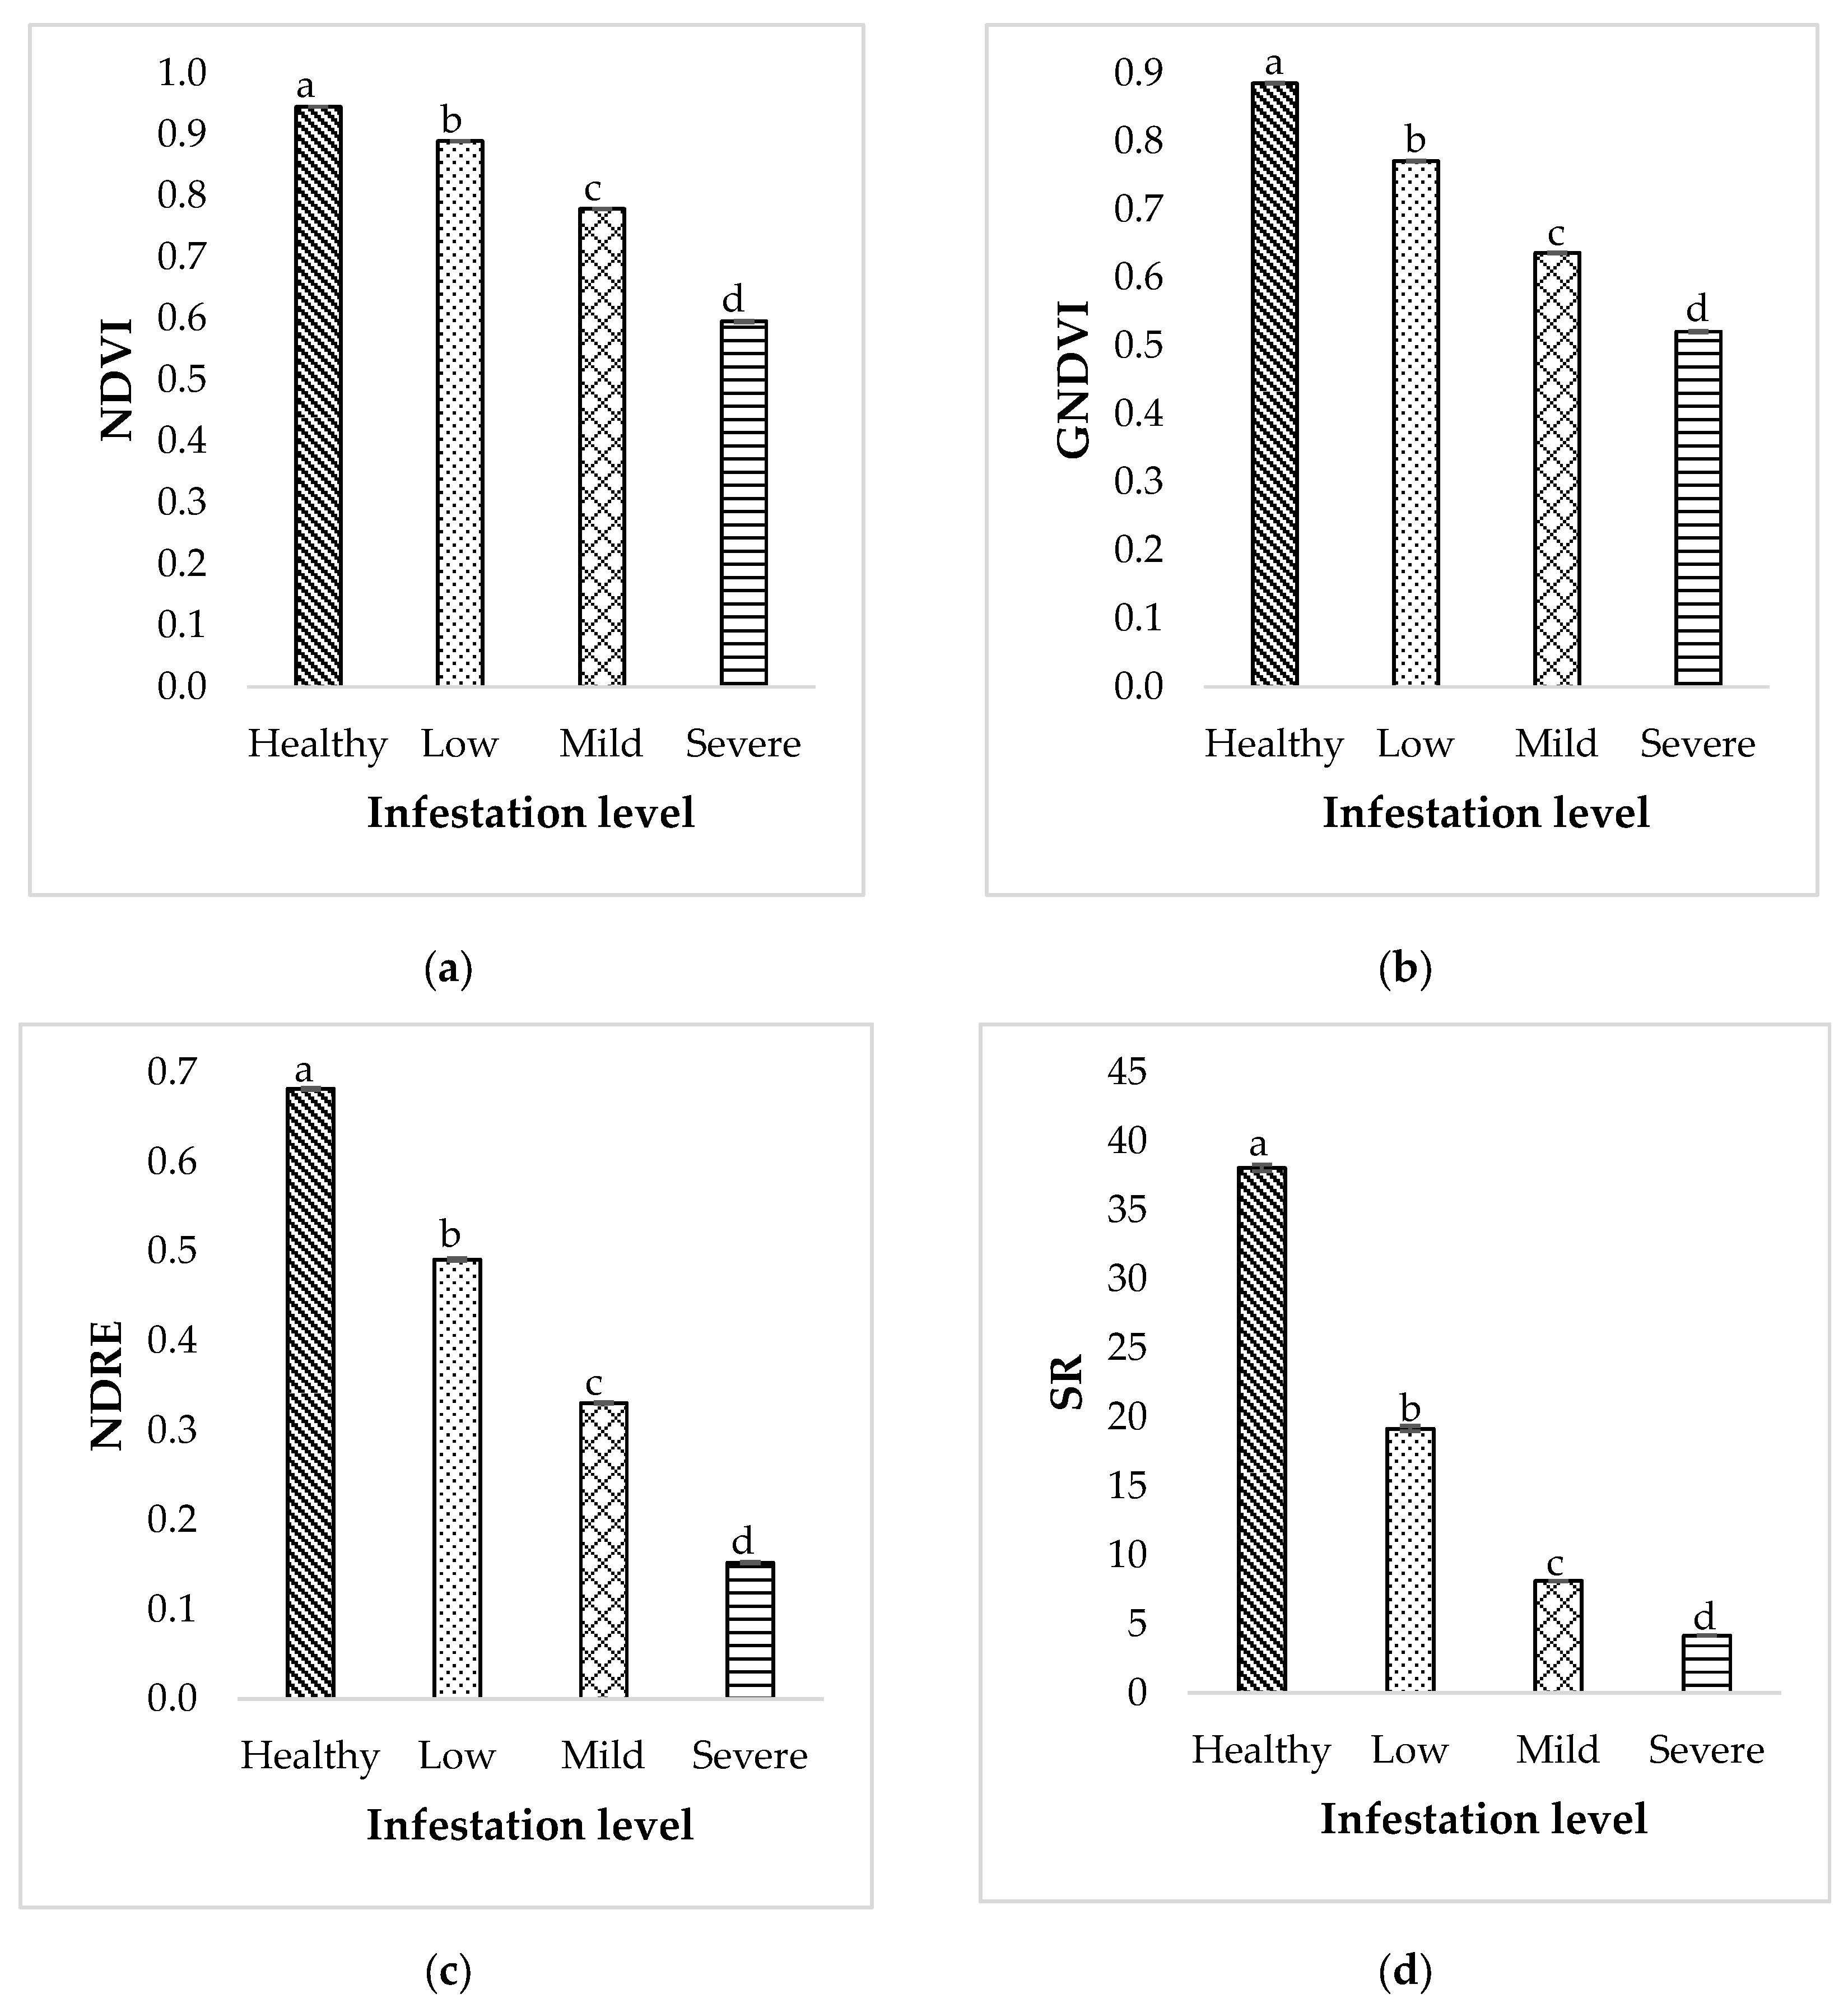
3.2. Vegetation Indices Analysis

All these vegetation indices were then subjected to a statistical analysis to determine the variance across the means of infestation level. Results of mean (±standard error) comparison of the vegetation indices for each infestation category using a Tukey’s HSD are tabulated in Table 6. Values that are not connected by the same letter are significantly different. According to Table 6, all the vegetation indices show consistent results where all infestation categories differ significantly. Figure 8 provides an illustration of the histogram mean comparison of each vegetation index according to the degree of infestation. As the infestation grows, it is evident that all values decrease.
To provide a more cost-effective solution, only three significant vegetation indices with standard errors lower than 0.002 were selected, namely NDVI, NDRE, and GNDVI for model development. The combination of each selected index was then created: NDVI and NDRE, NDVI and GNDVI, and NDRE and GNDVI. As a result, these three combinations were included for model development.

3.3. Classification Model Analysis

The performance of the model was evaluated based on the F1 score value. The percentage difference between training and testing was calculated to identify the underlier of the model performance. It was determined based on the model with the smallest difference between training and testing. The tabulated results are shown in Table 7. According to Table 7, the F1 scores of all the models during training and testing were mostly high, at more than 90%. The percentage difference, meanwhile, was lower and below 1%, indicating that there was no overfitting in any of the models.
In the combination of NDVI and NDRE, Quadratic SVM and Fine Gaussian SVM, both achieved a 100% F1 score during testing, indicating that the models successfully classify the infestation level correctly. It was then followed by a 99.98% F1 score, achieved by Fine tree, Medium tree, Fine KNN and Weighted KNN. According to their confusion matrix, the slight difference was due to ‘healthy’ being misclassified as ‘low’ with an error rate of 0.44%. The same issue was faced by another 10 models that gained an F1 score between 99.14% and 99.79% (i.e., Coarse tree, Quadratic discriminant, Gaussian Naïve Bayes, Linear SVM, Cubic SVM, Medium Gaussian SVM, Coarse Gaussian SVM, Medium KNN, Coarse KNN, and Cubic KNN) with error rates ranging between 0.89% and 4.00%. The Cosine KNN model achieved the lowest F1 score, at 97.34%, due to misclassification of the model in distinguishing between healthy and low, as well as mild being detected as severe, with error rates of 4% and 10%, respectively. Additionally, the Linear discriminant model also had a low F1 score (98.34%) because it misclassified low as healthy (2.22%) and misclassified low as mild with an error rate of 2.5%. The Kernel Naïve Bayes model obtained a 99.46% F1 score. However, it has two issues: misclassifying healthy as low and low as healthy, with error rates of 1.78% and 0.42%, respectively.
In the combination of NDVI and GNDVI, nine models, including Fine tree, Medium tree, Coarse tree, Linear discriminant, Cubic SVM, Coarse Gaussian SVM, Medium KNN, Coarse KNN, and Cubic KNN, achieved 100% F1 scores, indicating perfect classifications with zero error rates. There were two models that had an F1 score less than 99%, i.e., Gaussian Naïve Bayes (98.76%) and Cosine KNN (98.41%). Both models deal with the same issue, which is misclassification of healthy as low (error rate < 3%), as well as mild being misclassified as severe (error rate < 6%). Cosine KNN also deals with another issue, which is misclassification of low as healthy, with an error rate of 0.83%. The same problems with error rates between 0.42% and 0.83% were addressed by six additional models, namely Kernel Naïve Bayes, Linear SVM, Quadratic SVM, Medium Gaussian SVM, Fine KNN, and Weighted KNN, which all achieved F1 score ranges of 99.16% to 99.89%. Furthermore, Kernel Naïve Bayes also misclassified mild as severe with an error rate of 4.44%. Quadratic discriminant and Fine Gaussian SVM achieved F1 score ranges of 99.08% and 99.82%, respectively; however, they misclassified mild as severe with an error rate of 5.56% and 1.11%, respectively.
In the combination of NDRE and GNDVI, five models successfully achieved a 100% F1 score during testing, namely, Linear SVM, Medium Gaussian SVM, Medium KNN, Cubic KNN and Weighted KNN. On the other hand, three models achieved an F1 score lower than 99%, i.e., Quadratic discriminant (98.62%), Linear discriminant (97.56%) and Cosine KNN (77.03%). The performance of Cosine KNN in this combination was the worst because it was obviously unable to differentiate between all infestation levels, with an average error rate of 25.19%. Meanwhile, the Quadratic discriminant and Linear discriminant models had trouble, classifying healthy as low (error rate 3.11%) and low as mild (error rate 2.92%). The Quadratic discriminant model also misclassified severe as mild with an error rate of 0.67%. The other models with F1 scores between 99.00% and 99.79% essentially have the standard issue of being unable to distinguish between healthy and low, such as Fine tree, Medium tree, Coarse tree, Gaussian Naïve Bayes, Quadratic SVM, Cubic SVM, Fine Gaussian SVM, Coarse Gaussian SVM, Fine KNN, and Coarse KNN, with an average error rate of 1.64%. However, some of these models also had another issue. For example, Fine and Medium trees had error rates of 0.42% due to incorrectly classifying low as healthy. The Kernel Naïve Bayes, Coarse Gaussian SVM, and Fine KNN incorrectly misclassified severe as mild with an average error rate of 0.44%. Misclassification of low, which was predicted as mild, was also faced by Kernel Naïve Bayes, Coarse Gaussian, Gaussian Naïve Bayes and Coarse KNN, with an average error rate of 1.36%.
Overall, the performance of each model varied depending on the combination. The combination of NDVI and GNDVI was found to be the most successful in terms of perfect classification, with a 100% F1 score and zero error rate, due to nine models that accurately classified every level of infestation. It was then followed by a combination of NDRE and GNDVI with five models, and two models from NDVI and NDRE combinations. Nonetheless, all the models performed well, with an F1 score of more than 97.00% in every combination, except for Cosine KNN in the combination of NDRE and GNDVI, which performed the worst and gained an F1 score of 77.03%.

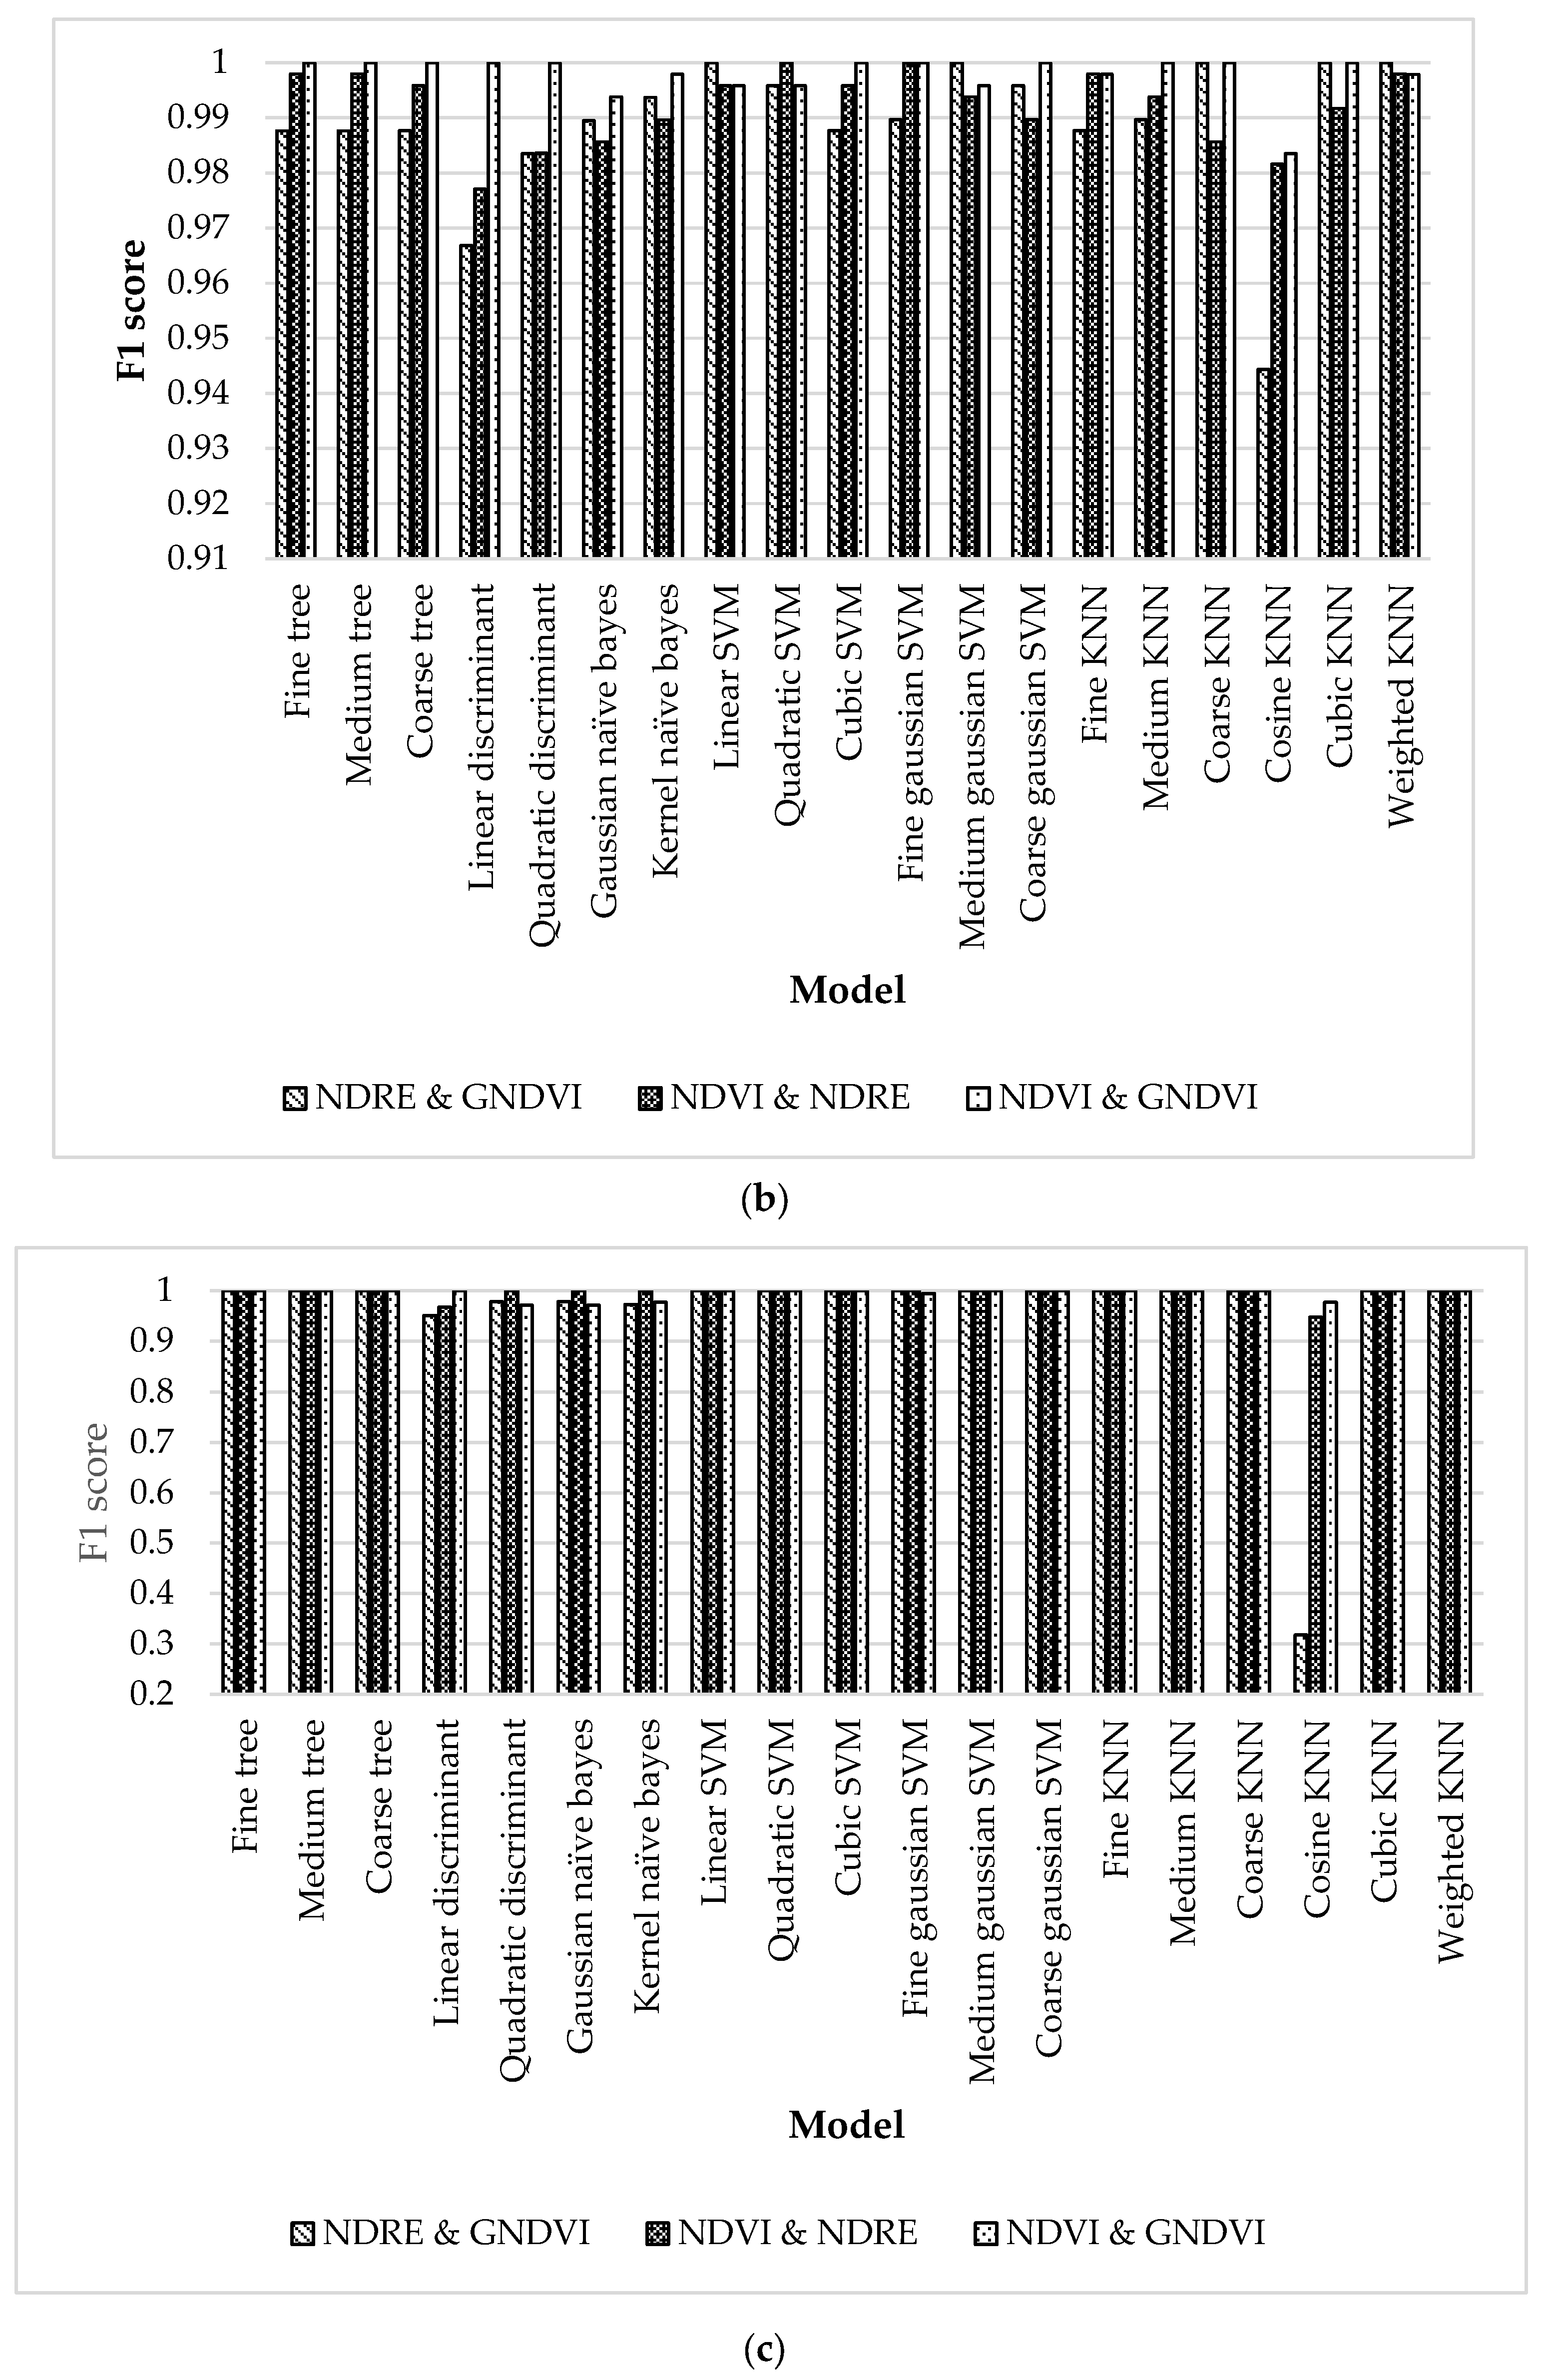
3.4. Effect of Combination of Vegetation Indices

Figure 9 shows the performance of each model in classifying the infestation level based on the combination of vegetation indices. In general, all the models performed well across all combinations. Out of 19 models, 14 models had a great performance, with an F1 score of more than 98% in classifying all infestation levels for all VI combinations, especially in classifying mild and severe levels, where all the models performed perfectly and achieved 100% F1 scores, i.e., Fine tree, Medium tree, Coarse tree, Linear SVM, Quadratic SVM, Cubic SVM, Fine Gaussian SVM, Medium Gaussian SVM, Coarse Gaussian SVM, Fine KNN, Medium KNN, Coarse KNN, Cubic KNN and Weighted KNN. The best models out of these models were the Weighted KNN and Cubic KNN models, which worked well in all combinations and accurately classified infestation levels. The main distinction between Cubic KNN and Weighted KNN was that, when NDVI and GNDVI were combined, Cubic KNN achieved a 100% F1 score in classifying healthy and low, whereas Weighted KNN achieved 99.78% and 99.79%, respectively. Nevertheless, Weighted KNN outperformed Cubic KNN, which achieved 99.70% in classifying low and healthy in the combination of NDVI and NDRE.
Out of all the models, Cosine KNN performed the least well, especially when combined with NDRE and GNDVI, which performed the least well at classifying all infestation levels. For instance, it gained a 32% F1 score in classifying mild, followed by 87% (severe), and 94% (healthy and low). Nevertheless, it did well in classifying a mild level in the other combinations, with an F1 score of more than 94%. Additionally, the Cosine KNN performed well when NDVI and GNDVI were combined, where all infestation levels were accurately identified and an F1 score range of 97% to 99% was obtained.
The performance of the remaining four models, which included the Linear discriminant, Quadratic discriminant, Gaussian Naïve Bayes, and Kernel Naïve Bayes, were varied, with F1 scores ranging from 95% to 100%. Generally, they successfully classified severe level in all combinations and received a perfect F1 score. In addition, they also performed well in classifying healthy and low, especially in the combination of NDVI and GNDVI, and obtained F1 scores between 96% and 100%. However, they had difficulty in categorising mild levels (F1 scores ranged between 95% and 97%), except for the NDRE and NDVI combination, where they successfully achieved a 100% F1 score.
In general, the best combination for the model to perform well in classifying the healthy and low levels of infestation and achieving a 100% F1 score was the combination of NDVI and GNDVI. For instance, 11 out of 19 models achieved a 100% F1 score in healthy level (Figure 9a), followed by the combination of NDRE and GNDVI, where only six models gained a 100% F1 score. A similar outcome was present at the low level, where most of the models obtained a 100% F1 score (11 models) when NDVI and GNDVI were combined, followed by the combination of NDRE and GNDVI (four models). For the combination of NDVI and GNDVI, it appears to be impossible for the models to classify at the healthy and low levels and achieve a 100% F1 score; instead, it is the most effective for classifying at the mild and severe levels, where 17 and 18 models out of 19 models perfectly performed well at the mild and severe levels, respectively.
The findings of this study were logical, as foliar damage in a severe condition was evidently present and gave off a brown appearance. The same is true of the mild level, where all the foliar damage began to become apparent. The crucial factor was therefore the healthy and low conditions, where the foliar damage was not readily apparent and recognised. As a result, all the models in this study successfully classified healthy and low infestation levels, particularly when NDVI and GNDVI were combined.

4. Discussion

In this study, UAV-based multispectral images were used in detecting different severity levels of bagworm infestation in oil palm plantations. This study employs UAV-acquired images and machine learning techniques to locate the bagworm Metisa plana infestation area. It focuses exclusively on the ability of the machine learning to categorise the severity level of infestation as healthy, low infestation, mild infestation, and severe infestation using vegetation indices extracted from UAV images. Out of five vegetation indices, three were selected and formed three combinations: NDVI and NDRE, NDVI and GNDVI, and NDRE and GNDVI. A total of 19 models were used to determine the effectiveness of the combination dataset to classify each infestation level.
Weighted KNN was chosen out of all the models used due to its highly consistent performance and the great classification of all infestation levels (F1 score greater than 99.70%). It was then followed by Cubic KNN, which had an F1 score of over 99.10%. Meanwhile, the Cosine KNN model was chosen as having the least effective performance among the others with an F1 score range between 32% and 94%. It was clearly demonstrated that the same classifier, using a different kernel, produced the best and worst performance. KNN typically works by using the distance function to determine how far new data entry is from values provided in datasets with different classes based on its closeness in the given range (k) of neighbours. In this study, the k-neighbour was constant and set at 10, indicating medium distinctions between classes. Meanwhile, the distance function was based on the kernel type of the KNN. For instance, Weighted KNN uses the distance-weighing concept, where the weighing is calculated using Euclidean distances. Cosine KNN and Cubic KNN use cosine distance and cubic distances, respectively. This study clearly demonstrated that the weighted kernel provided an excellent result due to the addition of weights to the Euclidean distance, which enhances classification performance. The same verdict was obtained by Mohd Johari et al. [29], in differentiating the four larval instar stages with an accuracy of 91% to 95%. In addition, Rathore et al. [40] also found that KNN, using weighted kernel, achieved a high accuracy of 90% compared to other kernels in distinguishing between various type of insects and between adult and larvae insect sounds.
Furthermore, the best combination of vegetation indices was determined to be NDVI and GNDVI, as most models could successfully classify the level of infestation and achieved a 100% F1 score, especially in healthy and low levels. The same outcome was obtained by Mangewa et al. [41], where the NDVI and GNDVI were determined to be the most effective vegetation indices for detecting and monitoring ecological changes in wildlife habitat condition classes (i.e., very good, good, poor and very poor). Generally, NDVI is most useful when used to assess vegetation density over large areas and to assess crop health; meanwhile, GNDVI is based on the greenness level, which is determined by the radiance of the leaf surface and is a significant indicator in distinguishing between healthy and infested leaves. Moreover, the combination of NDVI and NDRE was found to be the most suitable combination for the models in classifying mild and severe levels and achieved an F1 score of 100%. A comparable finding was presented by Boiarskii and Hasegawa [42], who used NDVI and NDRE to identify the poorly growing vegetation area and demonstrated that NDRE was sensitive to chlorophyll content, indicating nitrogen limitation in the leaves. Hence, it can be inferred that the results obtained from this research, which showcased the effectiveness of utilising the combination of NDVI and NDRE, as well as NDVI and GNDVI, in achieving optimal classification performance for identifying low and severe infestation, as well as healthy and low infestation, respectively, are deemed satisfactory.
In terms of spectral bands, NIR makes up all the vegetation indices used in this study. Following that, the NIR band was tested against other bands such as red, green, and red edge using the same arithmetic operation (subtraction, division, and addition). The combination of NIR and red band formed NDVI; NIR and green band formed GNDVI; and NIR and red edge formed NDRE. The combination of NDVI and NDRE obtained the best results in classifying between mild and severe infestation, as well as a combination of NDVI and GNDVI obtained the best results in classifying healthy and low. In this study, NDVI was recognised as a crucial vegetation index because it aids in classifying all levels of infestation. The red band was regarded as a crucial band in addition to NIR because it also affects the performance of all classifications. Thus, the performance of all classification models is clearly boosted by the combination of NIR and red bands.
Nevertheless, a severe condition seems easy to identify, as the foliar damage is obvious. As mentioned by Corley and Tinker [5], the lower and central crown appeared greyish brown as a result of the severely damaged leaves. This is consistent with the findings of this study, which showed that most of the models were correctly classified as severe levels and had 100% F1 scores in all combinations. In this case, healthy and low infestation levels play a crucial role, as it is difficult to detect the starting point of the infestation. As a result, this suggested method has an excellent chance of identifying healthy and low infestation levels even when the foliar damage is unseen, and there are no colour changes of the frond. Therefore, decision-making models may be able to tell farmers when to start pest control measures to stop the spread of the pest, especially for early infection predictions.

5. Conclusions

In this study, Metisa plana infestation levels were classified using UAV images and a machine learning approach. To enhance the classification performance of each model in classifying the level of infestation, three types of combinations among chosen vegetation indices were developed, namely NDVI and NDRE, NDVI and GNDVI, and NDRE and GNDVI. According to the results, the best combination for classifying healthy and low levels was found to be NDVI and GNDVI, empowering the model to classify all infestation levels with a 100% F1 score. In addition, the combination of NDVI and NDRE was found to be the best combination fort classifying mild and severe levels. The most important vegetation index that could detect every level of infestation was NDVI. The classification of the infestation level is made clearer and more accurate by combining it with other vegetation indices. In addition, Weighted KNN became the best model, which constantly gave the best performance in classifying all the infestation levels (F1 score > 99.70%) in all combinations.
Early detection of a bagworm infestation is crucial for effective management and early control measures. Therefore, this suggested method is essential for the early phase of severity level detection, considering that the infestation level can be automatically identified, allowing the planning and management of the control measure to be planned more quickly. Furthermore, the outcomes of this study demonstrated the enormous potential of UAV synergy for the detection of pest infestations using machine learning. Transfer learning methodology could be used in future studies to provide more automatic classification.

Author Contributions

Conceptualization, S.N.A.M.J. and S.K.-B.; methodology, S.N.A.M.J. and S.K.-B.; software, S.K.-B.; formal analysis, S.N.A.M.J. and S.K.-B.; investigation, S.N.A.M.J.; resources, M.M.M.M. and N.K.; data curation, S.N.A.M.J.; writing—original draft preparation, S.N.A.M.J.; writing—review and editing, S.K.-B.; supervision, S.K.-B., A.R.M.S., N.A.H. and M.M.M.M.; project administration, S.K.-B.; funding acquisition, S.K.-B. All authors have read and agreed to the published version of the manuscript.

Funding

This research was funded by the Ministry of Higher Education Malaysia (MOHE) under Fundamental Research Grants Scheme (FRGS) (Project number: FRGS/1/2018/TK04/UPM/02/4) and the Graduate Study and Research in Agriculture (SEARCA) under Professorial Chair Award 2022–2023 in the field of Imaging Technology and Remote Sensing.

Institutional Review Board Statement

Not applicable.

Data Availability Statement

The data presented in this study are available on request from the corresponding author. The data are not publicly available due to restrictions.

Acknowledgments

The authors would like to thank the MPOB for providing sample data.

Conflicts of Interest

The authors declare no conflict of interest.

References

  1. Norman, K.; Basri, M.W. Status of common oil palm insect pests in relation to technology adoption. Planter 2007, 83, 371–385. [Google Scholar]
  2. Cheong, Y.; Tey, C.C. Environmental Factors which lnfluence Bagworm outbreak. In Proceedings of the 5th MPOB-IOPRI International Seminar, Kuala lumpur, Malaysia, 22–23 November 2013; Volume 2013. [Google Scholar]
  3. Bagworm Infestation in District Causing Palm Oil Production to Drop. Available online: https://www.thestar.com.my/news/community/2012/11/21/bagworm-infestation-in-district-causing-palm-oil-production-to-drop (accessed on 12 June 2022).
  4. Chung, G.F. Effect of Pests and Diseases on Oil Palm Yield. In Palm Oil; AOCS Press: Boulder Urbana, IL, USA; Elsevier Inc.: Amsterdam, The Netherlands, 2012; pp. 163–210. [Google Scholar]
  5. Corley, R.H.V.; Tinker, P.B. Pests of the Oil Palm. In The Oil Palm; John Wiley & Sons: Hoboken, NJ, USA, 2019; pp. 437–459. [Google Scholar] [CrossRef]
  6. Wood, B.J.; Kamarudin, N. Bagworm (Lepidoptera: Psychidae) infestation in the centennial of the Malaysian oil palm industry—A review of causes and control. J. Oil Palm Res. 2019, 31, 364–380. [Google Scholar] [CrossRef]
  7. Tuck, H.C.; Ibrahim, Y.; Chong, K.K. Infestations by the bagworms metisa plana and pteroma pendula for the period 1986-2000 in major oil palm estates managed by golden hope plantation berhad in peninsular malaysia. J. Oil Palm Res. 2011, 23, 1040–1050. [Google Scholar]
  8. Aziz, N.A.; Omar, W.; Kassim, R.; Kamarudin, N. Remote Sensing Measurement for Detection of Bagworm Infestation in Oil Palm Plantation. MPOB Inf. Ser. 2012, 502, 589–597. [Google Scholar]
  9. Standard Operating Procedures (SOP) Guidelines for Bagworm Control. Malaysian Palm Oil Board (MPOB): Bangi, Malaysia, 2016.
  10. Kamarudin, N.; Ahmad Ali, S.R.; Mohd Masri, M.M.; Ahmad, M.N.; Che Manan, C.A.H.; Kamarudin, N. Controlling Metisa plana Walker (Lepidoptera: Psychidae) outbreak using Bacillus thuringiensis at an oil palm plantation. J. Oil Palm Res. 2019, 29, 47–54. [Google Scholar] [CrossRef]
  11. Kim, J.; Kim, S.; Ju, C.; Il Son, H. Unmanned aerial vehicles in agriculture: A review of perspective of platform, control, and applications. IEEE Access 2019, 7, 105100–105115. [Google Scholar] [CrossRef]
  12. Candiago, S.; Remondino, F.; De Giglio, M.; Dubbini, M.; Gattelli, M. Evaluating multispectral images and vegetation indices for precision farming applications from UAV images. Remote Sens. 2015, 7, 4026–4047. [Google Scholar] [CrossRef]
  13. Xiang, H.; Tian, L. Development of a low-cost agricultural remote sensing system based on an autonomous unmanned aerial vehicle (UAV). Biosyst. Eng. 2011, 108, 174–190. [Google Scholar] [CrossRef]
  14. Guimarães, N.; Pádua, L.; Marques, P.; Silva, N.; Peres, E.; Sousa, J.J. Forestry remote sensing from unmanned aerial vehicles: A review focusing on the data, processing and potentialities. Remote Sens. 2020, 12, 1046. [Google Scholar] [CrossRef]
  15. Gutierrez-Rodriguez, M.; Escalante-Estrada, J.A.; Rodriguez-Gonzalez, M.T. Canopy Reflectance, Stomatal Conductance, and Yield of Phaseolus vulgaris L. and Phaseolus coccinues L. Under Saline Field Conditions. Int. J. Agric. Biol. 2005, 7, 491–494. [Google Scholar]
  16. Klouček, T.; Komárek, J.; Surový, P.; Hrach, K.; Janata, P.; Vašíček, B. The use of UAV mounted sensors for precise detection of bark beetle infestation. Remote Sens. 2019, 11, 1561. [Google Scholar] [CrossRef]
  17. Minařík, R.; Langhammer, J.; Lendzioch, T. Automatic tree crown extraction from uas multispectral imagery for the detection of bark beetle disturbance in mixed forests. Remote Sens. 2020, 12, 4081. [Google Scholar] [CrossRef]
  18. Tsouros, D.C.; Bibi, S.; Sarigiannidis, P.G. A review on UAV-based applications for precision agriculture. Information 2019, 10, 349. [Google Scholar] [CrossRef]
  19. Marin, D.B.; Ferraz, G.A.S.; Santama, L.S.; Barbosa, B.D.S.; Barata, R.A.P.; Osco, L.P.; Ramos, A.P.M.; Guimaraes, P.H.S. Detecting coffee leaf rust with UAV-based vegetation indices and decision tree machine learning models. Comput. Electron. Agric. 2021, 190, 106476. [Google Scholar] [CrossRef]
  20. Su, J.; Liu, C.; Coombes, M.; Hu, X.; Wang, C.; Xu, C.; Li, Q.; Guo, L.; Chen, W.H. Wheat yellow rust monitoring by learning from multispectral UAV aerial imagery. Comput. Electron. Agric. 2018, 155, 157–166. [Google Scholar] [CrossRef]
  21. DadrasJavan, F.; Samadzadegan, F.; Seyed Pourazar, S.H.; Fazeli, H. UAV-based multispectral imagery for fast Citrus Greening detection. J. Plant Dis. Prot. 2019, 126, 307–318. [Google Scholar] [CrossRef]
  22. Wang, T.; Thomasson, J.A.; Yang, C.; Isakeit, T.; Nichols, R.L. Automatic classification of cotton root rot disease based on UAV remote sensing. Remote Sens. 2020, 12, 1310. [Google Scholar] [CrossRef]
  23. Yu, R.; Luo, Y.; Zhou, Q.; Zhang, X.; Wu, D.; Ren, L. A machine learning algorithm to detect pine wilt disease using UAV-based hyperspectral imagery and LiDAR data at the tree level. Int. J. Appl. Earth Obs. Geoinf. 2021, 101, 102363. [Google Scholar] [CrossRef]
  24. Haw, Y.H.; Lai, K.W.; Chuah, J.H.; Khairunniza-Bejo, S.; Husin, N.A.; Hum, Y.C.; Yee, P.L.; Tee, C.A.T.H.; Ye, X.; Wu, X. Classification of basal stem rot using deep learning: A review of digital data collection and palm disease classification methods. PeerJ. Comput. Sci. 2023, 9, e1325. [Google Scholar] [CrossRef]
  25. Khosrokhani, M.; Khairunniza-Bejo, S.; Pradhan, B. Geospatial tecnologies for detection and monitoring of Ganoderma basal stem rot infestion in oil palm plantation: A review on sensors and techniques. Geocarto Int. 2018, 33, 260–276. [Google Scholar] [CrossRef]
  26. Viera-Torres, M.; Sinde-González, I.; Gil-Docampo, M.; Bravo-Yandún, V.; Toulkeridis, T. Generating the baseline in the early detection of bud rot and red ring disease in oil palms by geospatial technologies. Remote Sens. 2020, 12, 3229. [Google Scholar] [CrossRef]
  27. Anuar, I.M.; Arof, H.; Nor, N.M.; Hashim, Z.; Seman, I.A.; Masri, M.M.M.; Ibrahim, M.S.; Tat, E.H.; Toh, C.T. Remote Sensing for Detection of Ganoderma Disease and Bagworm Infestation in Oil Palm. Adv. Agric. Food Res. J. 2021, 2, 1–14. [Google Scholar] [CrossRef]
  28. Ahmad, M.N.; Mohamed Shariff, A.R.; Aris, I.; Abdul Halin, I.; Moslim, R. Identification and determination of the spectral reflectance properties of live and dead bagworms, Metisa plana Walker (Lepidoptera: Psychidae) using Vis/NIR spectroscopy. J. Oil Palm Res. 2020, 33, 425–435. [Google Scholar] [CrossRef]
  29. Mohd Johari, S.N.A.; Khairunniza-Bejo, S.; Shariff, A.R.M.; Husin, N.A.; Masri, M.M.M.; Kamarudin, N. Identification of bagworm (Metisa plana) instar stages using hyperspectral imaging and machine learning techniques. Comput. Electron. Agric. 2022, 194, 106739. [Google Scholar] [CrossRef]
  30. Mohd Johari, S.N.A.; Khairunniza-Bejo, S.; Shariff, A.R.M.; Husin, N.A.; Masri, M.M.M.; Kamarudin, N. Automatic Classification of Bagworm, Metisa plana (Walker) Instar Stages Using a Transfer Learning-Based Framework. Agriculture 2023, 13, 442. [Google Scholar] [CrossRef]
  31. Thaer, S.; Kassim, F.A.; Hasbullah, N.A.; Al-obaidi, J.R. Evaluation of bagworm, Metisa plana (Lepidoptera: Psychidae) infestation and beneficial parasitoid in an oil palm plantation, Perak, Malaysia. J. Sci. Math. Lett. 2021, 9, 19–35. [Google Scholar]
  32. Duarte, A.; Borralho, N.; Cabral, P.; Caetano, M. Recent Advances in Forest Insect Pests and Diseases Monitoring Using UAV-Based Data: A Systematic Review. Forests 2022, 13, 911. [Google Scholar] [CrossRef]
  33. Manfreda, S.; McCabe, M.F.; Miller, P.E.; Lucas, R.; Madrigal, V.P.; Mallinis, G.; Dor, E.B.; Helman, D.; Estes, L.; Ciraolo, G.; et al. On the use of unmanned aerial systems for environmental monitoring. Remote Sens. 2018, 10, 641. [Google Scholar] [CrossRef]
  34. Rouse, J.W.; Haas, R.H.; Schell, J.A.; Deering, D.W. Monitoring vegetation system in the great plains with erts. J. Agric. Food Chem. 1976, 24, 24–26. [Google Scholar] [CrossRef]
  35. Gitelson, A.A.; Kaufman, Y.J.; Merzlyak, M.N. Use of a green channel in remote sensing of global vegetation from EOS- MODIS. Remote Sens. Environ. 1996, 58, 289–298. [Google Scholar] [CrossRef]
  36. Gitelson, A.A.; Merzlyak, M.N. Quantitative estimation of chlorophyll-a using reflectance spectra: Experiments with autumn chestnut and maple leaves. J. Photochem. Photobiol. B Biol. 1994, 22, 247–252. [Google Scholar] [CrossRef]
  37. Baret, F.; Guyot, G. Potentials and limits of vegetation indices for LAI and APAR assessment. Remote Sens. Environ. 1991, 35, 161–173. [Google Scholar] [CrossRef]
  38. Gitelson, A.A.; Viña, A.; Ciganda, V.; Rundquist, D.C.; Arkebauer, T.J. Remote estimation of canopy chlorophyll content in crops. Geophys. Res. Lett. 2005, 32, 1–4. [Google Scholar] [CrossRef]
  39. Arlot, S.; Celisse, A. A survey of cross-validation procedures for model selection. Stat. Surv. 2010, 4, 40–79. [Google Scholar] [CrossRef]
  40. Rathore, D.S.; Ram, B.; Pal, B.L.; Malviya, S. Analysis of Classification Algorithms for Insect Detection using MATLAB. In Proceedings of the 2nd International Conference on Advanced Computing and Software Engineering (ICACSE) 2019, Sultanpur, India, 8–9 February, 2019; Volume 2019, pp. 299–304. [Google Scholar] [CrossRef]
  41. Mangewa, L.J.; Ndakidemi, P.A.; Alward, R.D.; Kija, H.K.; Bukombe, J.K.; Nasolwa, E.R.; Munishi, L.K. Comparative Assessment of UAV and Sentinel-2 NDVI and GNDVI for Preliminary Diagnosis of Habitat Conditions in Burunge Wildlife Management Area Tanzania. Earth 2022, 3, 769–787. [Google Scholar] [CrossRef]
  42. Boiarskii, B.; Hasegawa, H. Comparison of NDVI and NDRE Indices to Detect Differences in Vegetation and Chlorophyll Content. J. Mech. Contin. Math. Sci. 2019, 4, 20–29. [Google Scholar] [CrossRef]
Figure 1. Flowchart of the study.
Agriculture 13 01886 g001
Figure 2. The study sites, (a) Serdang, Selangor, (b) Pagoh, Johor, (c) Pagoh, Johor, and (d) Ayer Kuning, Perak.
Agriculture 13 01886 g002
Figure 3. DJI Inspire 2 with Altum-PT Multispectral camera.
Agriculture 13 01886 g003
Figure 4. Illustration of vegetation index extraction.
Agriculture 13 01886 g004
Figure 5. The illustration of 5-fold cross validation.
Agriculture 13 01886 g005
Figure 6. Type of classifier and kernel used.
Agriculture 13 01886 g006
Figure 7. Condition of canopy image: (a) Healthy, (b) Low infestation, (c) Mild infestation, (d) Severe infestation.
Agriculture 13 01886 g007
Figure 8. Average infestation level based on each vegetation index. (a) NDVI, (b) GNDVI, (c) NDRE, (d) SR, (e) GCI, and (f) RECI. Different letters within the bar chart indicate statistical difference by the Tukey’s HSD test at p < 0.05.
Agriculture 13 01886 g008aAgriculture 13 01886 g008b
Figure 9. The performance of each model in distinguishing each infestation level based on combinations of vegetation indices. (a) healthy, (b) low, (c) mild, and (d) severe.
Agriculture 13 01886 g009aAgriculture 13 01886 g009bAgriculture 13 01886 g009c
Table 1. Classification of damage due to bagworm infestation [8].
InfestationClassificationDescription
0NIL
  • There is no obvious bagworm harm.
1Light
  • A leaflet with very few bagworm larvae and pupae.
  • Leaflets start to have small holes and necrosis.
2Medium
  • Most leaflets contain pupae and larvae of bagworms.
  • Leaflets with several holes and light necrosis.
3Serious
  • Numerous bagworm larvae and pupae on the leaflet.
  • Lots of necrosis and numerous holes on the leaflets and drying out and turning brown.
Table 2. Summary of the application of UAV-based imagery with machine learning technique.
Crop TypePurpose of StudySensor TypeVegetation IndicesMachine LearningClassification PerformanceReferences
CoffeeCoffee leaf rust diseaseMultispectral cameraNormalized difference vegetation index (NDVI)
Green Normalized Difference Vegetation Index (GNDVI)
Normalized Difference Red Edge (NDRE)
Modified normalized vegetation red edge (MNDRE)
Modified Green Simple Ratio (MGSR)
Logistic model tree (LMT)F1 score: 91.50% (early stage)
F1 score: 87.50% (late stage)
[19]
WheatYellow rust diseaseMultispectral cameraRatio vegetation index (RVI)
Normalized difference vegetation index (NDVI)
Optimized soil adjusted vegetation index (OSAVI)
Random forest (RF)Precision: 89.20%
Recall: 89.40% Accuracy: 89.3%
(45 days after inoculation)
[20]
ForestBark beetle infestationRGB camera
NIR customized sensor
Greenness Index (GI),
Simple Ratio (SR),
Green Ratio Vegetation Index (GRVI),
Normalized Difference Vegetation Index (NDVI),
Green Normalized Difference Vegetation Index (GNDVI)
Maximum likelihood classifier (MLC)Overall accuracy: 78–96% (across the time periods)[16]
Pine wilt diseaseHyperspectral camera (HI) and LiDARNormalized Difference Vegetation Index (NDVI),
Simple Ratio (SR),
Chlorophyll Index (CI),
Random forest (RF)Overall accuracy (HI + LiDAR): 73.96%
(Early-stage PWD)
[23]
CitrusGreening diseaseMultispectral cameraNormalized difference vegetation index (NDVI)
Simple ratio (SR)
Chlorophyll index (CI)
Green Normalized Difference Vegetation Index (GNDVI)
Normalized Difference Red Edge (NDRE)
Support vector machine (SVM)Overall accuracy: 81.50% [21]
CottonCotton rot diseaseMultispectral cameraGreen, red and NIR band (CIR)Unsupervised: k-means
Supervised: support vector machine (SVM), minimum distance, maximum likelihood, Mahalanobis distance
Overall accuracy: 88.5%[22]
Oil palmBud rot (BR) and red ring disease (RRD)Multispectral cameraNormalized difference vegetation index (NDVI), Green Normalized Difference Vegetation Index (GNDVI), Green vegetation index (GVI)
Visible atmospherically resistant index (VARI)
Lowest Significant Difference (LSD)Statistically significant differences between healthy and diseased palms, (generating the baseline of early responses of BR and RRD)[26]
Bagworm infestationMultispectral cameraThree band combinations;
Green_Red_RedEdge
Green_Red_NIR
Red_RedEdge_NIR
Green_RedEdge_NIR
-
(Visual analysis)
Green_Red_RedEdge
is the best to visually differentiate healthy and infested oil palm
[27]
Ganoderma diseaseMultispectral cameraThree band combinations;
Green_Red_RedEdge
Green_Red_NIR
Red_RedEdge_NIR
Green_RedEdge_NIR
Object-based-image-analysis method (OBIA)>80%[27]
Table 3. Information about selected oil palm plantations.
InfestationLocationArea (ha)CoordinatesNumber of Trees
HealthySerdang, Selangor6.02°59′13″ N
101°43′34″ E
750
LowPagoh, Johor7.02°10′39″ N
102°47′01″ E
800
Mild2.02°10′48″ N
102°47′11″ E
300
SevereAyer Kuning, Perak10.04°11′56″ N
101°07′38″ E
1000
Table 4. Incidence rate and details of bagworm infestation.
ClassificationPercentage of Incident RateDetails of Incident RateNumber of Bagworms per Frond
NIL (Healthy)0%No infested frond detectedNo bagworm detected
Low1–33%Light necrosis was detected10 and below
Mild34–67%Moderate necrosis and hole detected11–50
Severe68–100%Serious necrosis and hole detected50 and above
Table 5. List of vegetation indices (VIs) with formulas.
No.Vegetation IndexFormulaReference
1NDVI N I R R e d N I R + R e d [34]
2GNDVI N I R G r e e n N I R + G r e e n [35]
3NDRE N I R R e d e d g e N I R + R e d e d g e [36]
4SR N I R R e d [37]
5GCI N I R G r e e n 1 [38]
6RECI N I R R e d e d g e 1
Table 6. Tukey’s HSD mean comparison for all vegetation indices based on infestation categories.
InfestationNDVINDREGNDVISRGCIRECI
Healthy
(n = 750)
0.9469 ± 0.00034 a0.6853 ± 0.00130 a0.8874 ± 0.00069 a38.7001 ± 0.23590 a16.6700 ± 0.10268 a4.4696 ± 0.02413 a
Low
(n = 800)
0.8892 ± 0.00082 b0.4908 ± 0.00147 b0.7717 ± 0.00095 b19.1967 ± 0.16968 b7.1558 ± 0.04566 b1.9789 ± 0.01162 b
Mild
(n = 300)
0.7816 ± 0.00042 c0.3319 ± 0.00109 c0.6380 ± 0.00090 c8.2434 ± 0.01708 c3.6012 ± 0.01341 c1.0106 ± 0.00513 c
Severe
(n = 1000)
0.5958 ± 0.00180 d0.1524 ± 0.00088 d0.5213 ± 0.00149 d4.1870 ± 0.02339 d2.2669 ± 0.01316 d0.3643 ± 0.00245 d
Data represents the mean (± standard error). Different letters within the same column indicate statistical difference by the Tukey’s HSD test at p < 0.05.
Table 7. The performance of all classifiers in all combinations, F1 score.
ClassifierKernelNDVI and NDRENDVI and GNDVINDRE and GNDVI
TrainTestDifference (%)TrainTestDifference (%)TrainTestDifference (%)
TreeFine99.6599.890.2499.32100.00 *0.6999.0799.350.29
Medium99.6599.890.2499.32100.00 *0.6999.0799.350.29
Coarse99.7099.780.0999.22100.00 *0.7899.2099.350.15
DiscriminantLinear98.5698.340.2399.18100.00 *0.8298.9097.561.36
Quadratic99.6199.140.4799.5099.080.4399.5298.620.90
Naïve BayesGaussian99.6499.250.4099.1898.760.4399.0999.140.05
Kernel99.7899.460.3299.6099.160.4499.1999.080.10
SVMLinear99.7899.780.0099.4699.780.3399.39100.00 *0.61
Quadratic99.83100.00 *0.1799.4799.780.3199.3999.780.40
Cubic99.7899.780.0099.50100.00 *0.5099.3999.350.04
Fine Gaussian99.69100.00 *0.3199.5199.820.3199.3999.460.07
Medium Gaussian99.7899.680.1099.5599.780.2499.34100.00 *0.66
Coarse Gaussian99.7899.460.3299.41100.00 *0.5999.3099.150.15
KNNFine99.7899.890.1199.5699.890.3399.1999.280.09
Medium99.7399.680.0699.60100.00 *0.4199.26100.00 *0.74
Coarse99.6599.250.4199.55100.00 *0.4599.2699.330.06
Cosine98.2297.340.8997.8998.400.5376.6477.030.51
Cubic99.7399.570.1699.60100.00 *0.4199.34100.00 *0.66
Weighted99.7399.890.1699.6199.890.2999.39100.00 *0.61
* indicates the highest F1 score during testing achieved by the models in each combination.
Disclaimer/Publisher’s Note: The statements, opinions and data contained in all publications are solely those of the individual author(s) and contributor(s) and not of MDPI and/or the editor(s). MDPI and/or the editor(s) disclaim responsibility for any injury to people or property resulting from any ideas, methods, instructions or products referred to in the content.

