


The Development of a Weight Prediction System for Pigs Using Raspberry Pi

1
Department of Statistics, Chonnam National University, Gwangju 61186, Republic of Korea
2
Division of Culture Contents, Chonnam National University, Yeosu 59626, Republic of Korea
*
Author to whom correspondence should be addressed.
Agriculture 2023, 13(10), 2027; https://doi.org/10.3390/agriculture13102027
Submission received: 30 September 2023
/
Revised: 14 October 2023
/
Accepted: 17 October 2023
/
Published: 19 October 2023
(This article belongs to the Special Issue Digital Innovations in Agriculture—Series II)
Abstract
:Generally, measuring the weight of livestock is difficult; it is time consuming, inconvenient, and stressful for both livestock farms and livestock to be measured. Therefore, these problems must be resolved to boost convenience and reduce economic costs. In this study, we develop a portable prediction system that can automatically predict the weights of pigs, which are commonly used for consumption among livestock, using Raspberry Pi. The proposed system consists of three parts: pig image data capture, pig weight prediction, and the visualization of the predicted results. First, the pig image data are captured using a three-dimensional depth camera. Second, the pig weight is predicted by segmenting the livestock from the input image using the Raspberry Pi module and extracting features from the segmented image. Third, a 10.1-inch monitor is used to visually show the predicted results. To evaluate the performance of the constructed prediction device, the device is learned using the 3D sensor dataset collected from specific breeding farms, and the efficiency of the system is evaluated using separate verification data. The evaluation results show that the proposed device achieves approximately 10.702 for RMSE, 8.348 for MAPE, and 0.146 for MASE predictive power.
1. Introduction
Livestock rearing is an industry that significantly incurs costs compared to other industries due to the need for optimal barn management and ample feed grain provision. Furthermore, the demand for processed products derived from livestock is increasing as a result of population growth, improved income levels, and urbanization. Consequently, the global scale of livestock farming, including cattle, pigs, and poultry, is expanding to meet such demand. However, this extensive livestock rearing gives rise to various animal management issues such as diseases and environmental concerns. Additionally, the current practices of raising and managing animals rely heavily on traditional methods based on farmers’ experiences and practices, which require substantial labor and time. Therefore, in order to address these challenges, there is a growing need for various advanced digital technologies based on artificial intelligence, which have been receiving significant attention in modernized livestock farms, to efficiently support livestock rearing.
Additionally, the real-time detection of livestock health status and abnormal behavior can contribute to enhancing job satisfaction among livestock farmers while simultaneously minimizing livestock production costs and effectively managing economic losses caused by diseases and mortality. Hence, there is a pressing need for livestock producers to invest in the development of cutting-edge technologies for real-time livestock monitoring, the implementation of advanced sensor systems, and the creation of streamlined processing systems to ensure the production of top-quality livestock products with reduced processing time. However, in most livestock farms, monitoring the condition, measuring the weight, and observing the behavior or feeding behavior of livestock is usually performed by farmers raising livestock, either visually or manually. Such passive livestock management is laborious, expensive, and imposes stress on the livestock. Therefore, the applicability of computer vision technology and deep-learning algorithms in livestock operations is emerging as an important issue [1,2].
Here, we briefly review previous studies published on problems associated with breeding livestock. First, we consider several review papers that introduce comprehensive information on raising livestock. Femandes et al. [1] presented significant advancements and challenging research areas in computer vision systems that can be applied to animal breeding and commercialization. These technologies are expected to be utilized as high-value industrial applications in livestock farming. In their study, Oliveira et al. [2] conducted a comprehensive examination of recent breakthroughs in computer vision systems and their utilization of deep-learning algorithms in the field of animal science. They specifically highlighted various deep-learning algorithms employed for tasks such as image classification, object detection, object segmentation, and feature extraction. Notable algorithms discussed in their review included Mask R-CNN, Faster R-CNN, YOLO (v3 and v4), DeepLab v3, and U-Net, all of which have found applications in animal science research. Similarly, Wurtz et al. [3] presented a systematic overview of the advancements made in automated high-throughput image detection of farm animal behavioral traits, considering both welfare and production implications. They observed that several studies tended to start from scratch rather than build upon existing research despite there being significant overlap in the methods used for analyzing animal behavior. Nasirahmadi et al. [4] proposed a monitoring system based on images captured from 3D depth cameras to automatically identify and manage various behaviors of livestock, such as feeding, drinking, locomotion, aggression, and reproduction in cattle and pigs. They evaluated the performance of their developed system using metrics such as accuracy, error rate, specificity, and sensitivity. The system proposed by them is expected to contribute significantly to easily detecting abnormal behaviors of livestock in large-scale livestock farming operations.
Livestock such as cattle, pigs, and chickens are commonly raised animals in barns. In this study, we reviewed previous research on the prediction of livestock weight. Wang et al. [5] discussed the preexisting studies that focused on predicting the weight of livestock using techniques such as feature extraction, feature selection, and regression learning models, especially image analysis-based weight prediction methods. Kollis et al. [6] designed and implemented a program based on image analysis to estimate the weight of pigs, along with hardware. Li et al. [7] reviewed various methods for pig weight detection, comparing the structures and pros and cons of the proposed approaches. Kashiha et al. [8] developed an image-processing method that estimates pig weights by calculating the position and area within an ellipse using an ellipse-fitting algorithm. Shi et al. [9] proposed a system for analyzing the correlation between body length (BL), withers height (WH), and weight of 10 pig breeds aged between 14 and 25 weeks in indoor farming conditions (R2 range of 0.91–0.98). Doeschi-Wilson et al. [10] compared the growth curves of two pig breeds between 11 and 20 weeks of age and suggested that size measurements are a consistent indicator of pig growth compared to body weight. Jun et al. [11] proposed a non-contact method for estimating pig weight using 2D images that are not influenced by pig posture or the capture environment. Suwannakhun and Daungmala [12] proposed a system that combines neural networks with various functions such as color and texture analysis, center calculation, measurements of major and minor axis lengths, eccentricity determination, and area calculation for non-contact pig weight estimation. Fernandes et al. [13] also developed a system that includes body measurements, shape descriptors, and weight prediction. Yoshida and Kawasue [14] introduced a weight estimation system that utilizes a camera to screen pigs. By utilizing three-dimensional visual information captured in a single image, they estimated the body weight of pigs. The researchers confirmed the robustness and practicality of the proposed system in measuring moving animals within challenging environments like pig farms. Kaewtapee et al. [15] proposed a method for pig weight estimation employing image processing and artificial neural networks. They utilized images of 88 crossbred pigs (Large White, Landrace, Duroc Jersey) to individually measure heart circumference, body length, and weight. Regression analysis and artificial neural networks were employed to develop a pig weight equation, and the performance of the developed model was evaluated using mean absolute deviation (MAD) and mean absolute percentage error (MAPE) as estimation error metrics. Cang et al. [16] suggested an approach based on deep neural networks for estimating the live weights of pigs in sow stalls. They devised a neural network that takes top-view depth images of the pig’s back as input and produces weight estimates as output. The proposed network, based on a Faster-RCNN architecture with an added regressive branch, integrates pig detection, location, and weight estimation into an end-to-end network, facilitating simultaneous pig recognition and weight estimation. Yu et al. [17] studied how to build a computer vision system with weight prediction over time by collecting RGB-D video to capture top-view RGB (red, green, blue) and depth images of unrestrained growing pigs. They video recorded eight growers at six frames per second for 38 days for approximately three minutes/day. They manually weighed them using electronic scales to collect training materials and developed the system using the image-processing pipes in Python based on OpenCV. He et al. [18] conducted a study to assess the predictive value of feeding behavior data in estimating the body weight of finishing-stage pigs. They collected data from 655 pigs belonging to three different breeds (Duroc, Landrace, and Large White) aged between 75 and 166 days. To forecast the body weight of pigs aged 159–166 days, the researchers employed LASSO regression along with two machine learning algorithms, namely random forest and long short-term memory network [19,20]. They explored four scenarios: the individual-informed predictive scenario, the individual- and group-informed predictive scenario, the breed-specific individual- and group-informed predictive scenario, and the group-informed predictive scenario. For each scenario, they developed four models: Model_Age included only the age variable, Model_FB included only feeding behavior variables, Model_Age_FB and Model_Age_FB_FI incorporated feeding behavior and feed intake measures based on Model_Age as predictors. And deep-learning methods, such as those used in automatic detection systems for livestock breeding, as seen in CowXNet [21] and YOLACT++ [22], are employed.
Among various strategies for effective livestock management, the real-time prediction of livestock weight plays a significant role in determining feed allocation, breeding timing, and market readiness. Additionally, measuring livestock weight can serve as an indirect indicator of their health and growth status. Furthermore, drastic changes in weight can indicate the presence of diseases, the provision of a healthy environment, and the optimal timing for parturition. Therefore, continuous monitoring of weight fluctuations in livestock facilitates the implementation of appropriate measures in terms of feed distribution and addressing abnormal behavior, ultimately leading to the production of high-quality livestock.
Consequently, livestock farmers are faced with the challenge of accurately measuring livestock weight on a regular basis, which proves to be a difficult and labor-intensive task for both farmers and livestock. Moreover, this process can induce excessive stress on the livestock, potentially resulting in weight loss. To address these issues and enable the continuous tracking of livestock weight while reducing stress and workload for farmers, the development of automated prediction systems using image processing and artificial intelligence technologies is required.
In this study, we propose a method for implementing a measurement prediction system that can automatically measure the weight of livestock in real time in livestock farms raising pigs. The proposed system acquires livestock images by mounting a depth camera capable of capturing RGB-D images, segmenting livestock from the input image using the Raspberry Pi module, extracting features from the segmented image, and predicting the weight of pigs. It is configured with an appropriate small-size monitor that can display images. Furthermore, the proposed prediction system is manufactured using cost-efficient parts to enable livestock farmers to purchase it with ease.
The remainder of this paper is organized as follows. Section 2 introduces the process of collecting livestock image data and describes the overall structure of the proposed system. Section 3 presents an experiment to evaluate the performance of the proposed system. Finally, Section 4 concludes this paper.
2. Weight Prediction System for Pigs Using Raspberry Pi
In this section, we describe the collection and construction method of pig image data of the automatic weight prediction device. First, the process of collecting RGB-D images from livestock farms of pigs is described. Second, we describe the overall structure of a device that can automatically predict pig weight using the collected data. Third, the hardware and software used to build the prediction device will be described in detail.
2.1. Pig-Image Collection
The prediction system proposed in this study can be used to predict the weight of pigs with the most realistic applicability among various types of livestock. Therefore, pig images required to implement the system were collected for a certain period of time from actual farms. We selected 15 pigs from a pig-breeding farm, repeatedly photographed them three times with the developed portable device, and measured the actual weight of each pig using a scale. The breed of pigs consists of three crossbred varieties, and they are raised in enclosed facilities isolated from the external environment. During the summer season, cooling systems are employed to maintain temperatures between 20 and 25 degrees Celsius, and continuous lighting is provided 24 h a day. Figure 1 shows a developed portable device that captures pig weights on site and RGB color and depth images.
2.2. Automatic Prediction System
2.2.1. Overall Structure of the Prediction System
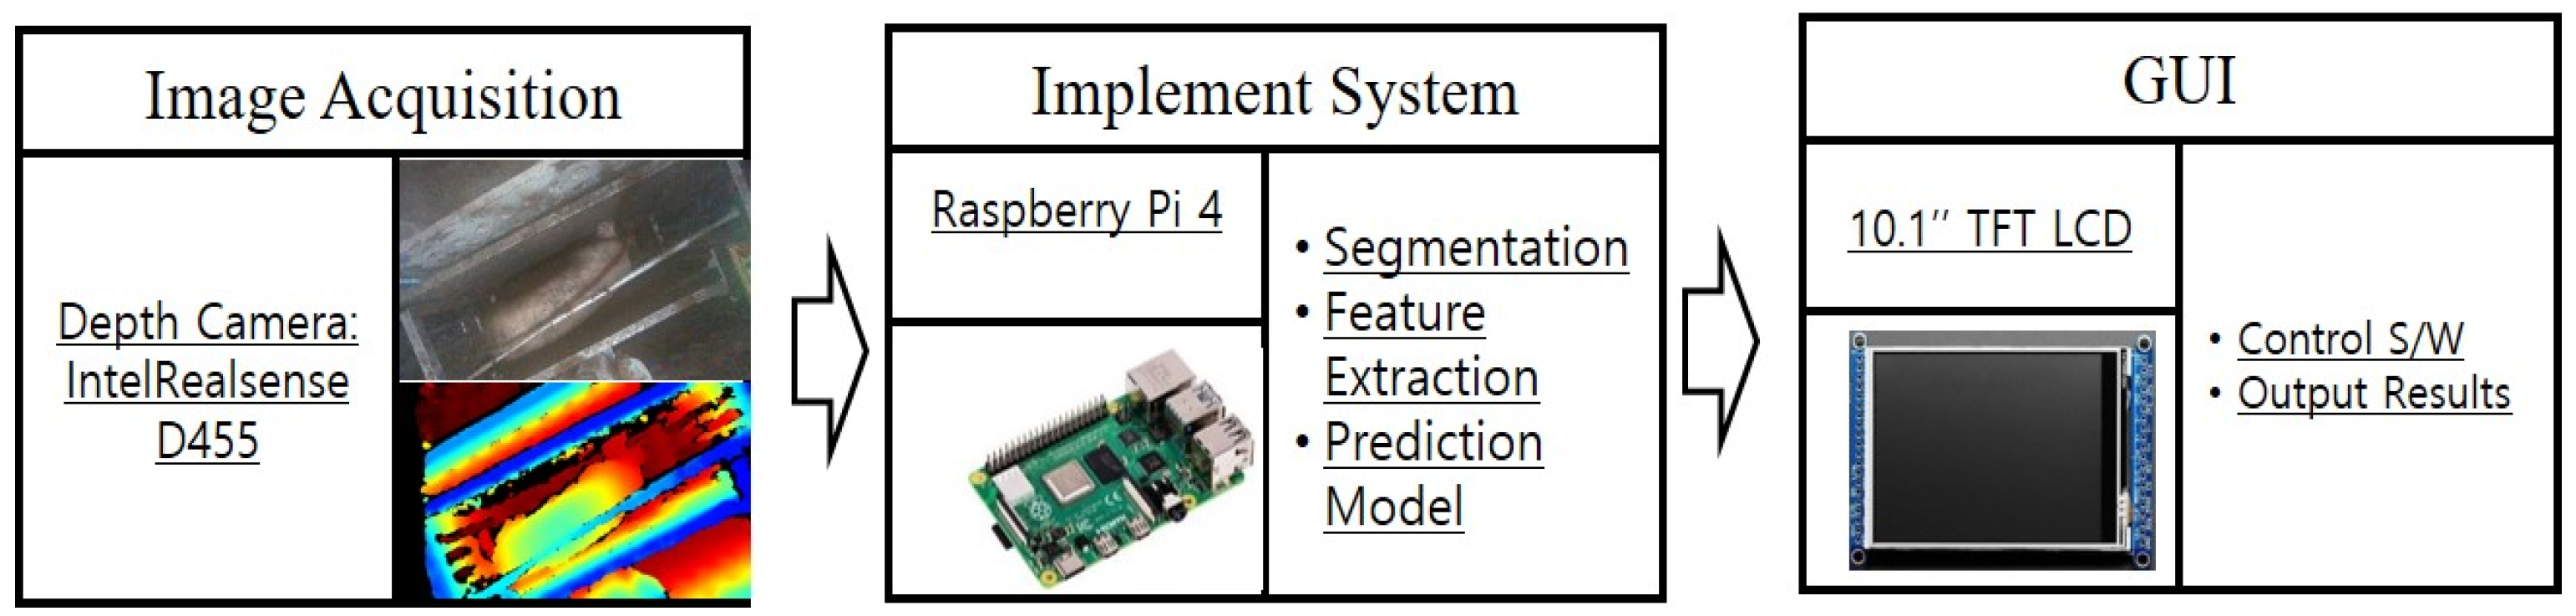
Figure 2 shows the overall structure of the proposed prediction system. The proposed system consists of livestock image capture and input, livestock segmentation, appropriate feature extraction, and weight prediction. First, livestock images are acquired using an RGB-D cameraSecond in the division of the livestock area from the collected image; the object is divided by applying the image-processing technology to each of the RGB color and depth images. Third, as features suitable for weight prediction, shape features representing the appearance of livestock and biometric features representing physical properties are extracted. Finally, we implement a predictive model that can accurately predict the weight of livestock based on the extracted features using various machine learning techniques.
2.2.2. Overall Structure of Implemented Hardware System
Figure 3 shows the overall structure of the hardware implementation of the prediction system. Figure 3a shows the modules for each part of the hardware system. First, an RGB-D depth camera was used to collect pig images. Second, a Raspberry Pi 4-embedded module was used to implement the prediction system. Third, a 10.1-inch touchscreen was used to visually express the prediction results. Figure 3b shows the product design of a portable imaging device packaged by combining each module from various angles.
The detailed hardware module and software specifications used in the proposed portable measurement device are as follows.
- -
- Depth Camera: Intel Real Sense D455;
- -
- Raspberry Pi 4 Model B;
- -
- Memory: 8 GB;
- -
- CPU: 1.5 GHz Quad Core 64-bit Cortex-A72 (ARM v8);
- -
- Giga-bit Ethernet;
- -
- USB 3.0 × 2, USB 2.0 × 2;
- -
- Dual 4 K Display (Micro-HDMI × 2);
- -
- Power: 1.5 V × 4 EA Battery pack;
- -
- Displayer: TFT 10” LCD;
- -
- Wireless: dual-band 802.11ac\n wireless (2.4 GHz or 5 GHz);
- -
- Bluetooth 5.0;
- -
- Python 3.7;
- -
- OpenCV 4.5 on Raspberry Pi 4.
2.2.3. Weight Prediction with GUI
Based on the hardware system, the weight prediction algorithm is implemented in the form of a GUI program for easy operation by users. GUI was developed based on QT, a cross-platform development widget toolkit that runs on various operating systems. The process of developing a platform that can predict the weight of a pig consists of the following four steps: detecting the pig region from the input image, segmenting the pig, extracting appropriate features from the segmented pig region, and obtaining the weight-prediction algorithm. Figure 4 shows the step-by-step process of constructing a platform for estimating pig weight.
Here, we take a detailed look at the step-by-step processing of the proposed pig-weight prediction system. The first step is to detect the bounding box representing the pig region using a deep-learning algorithm from the input RGB color image. We used a single-shot multibox detector (SSD) [23] combined with the Inception V2 feature-extraction algorithm from RGB images to extract the bounding box. In the Single Shot Multibox Detector (SSD), the initial step involves partitioning the input images into smaller kernels across various feature maps to predict anchor boxes for each kernel. Through a single feed-forward Convolutional Neural Network (CNN), the SSD generates a sequence of bounding boxes and scores indicating the presence of objects within each box. Subsequently, the classification scores for each region are calculated based on the scores obtained in the preceding stage. Using the collected pig images, the SSD MobileNet was fine-tuned using Tensorflow object detection API to learn a deep-learning model for livestock detection [24]. Figure 5 shows an example image of the bounding box for the pig region provided by the SSD detector algorithm.
The second step is to accurately segment the pig region by applying the information of the depth image to the pig image in the bounding box. We obtain the median value from the given depth information in the bounding box and select two thresholds: the lower and upper limits. Here, to detect the pig’s area as an RGB-D rectangular region, we set the distance from the camera to the ground as the upper limit and the distance from the camera to the pig as the lower limit in the depth image. If the depth of each pixel in the image falls within the specified lower and upper thresholds, as indicated via Equation (1), a value of 255 is assigned; otherwise, a value of zero is assigned.
The image segmentation process based on depth images is illustrated in Figure 6. Pigs, especially young pigs, are curious; therefore, it is extremely difficult for them to remain in a position suitable for estimating their weight. Therefore, a method for adjusting the acquired pig image to an appropriate posture is required. We calculated the pig’s center and rotation direction by fitting an ellipse to the segmented region to determine the pig’s posture. Subsequently, the pig’s posture was adjusted to be orthogonal to the camera using the fitted angle of the ellipse.
In the third step, various feature vectors are extracted from the segmented 3D pig image, which is necessary for weight prediction. These feature vectors are divided into two types: pig body features and size and shape features. First, a pig’s body features are given by the length, which is given as a straight line from the shoulder to the hip, and the girth, which is the circumference of the pig’s waist. Figure 7 shows the process of calculating the length of the pig in the bounding box obtained from the single-shot detector and inferring the weight.
We obtain the size and shape features from the point cloud in the segmented pig image with additional information to infer a more accurate pig weight. Using the Intel RealSense SDK provided by the camera manufacturer, the image coordinates are mapped to real-world coordinates, resulting in the generation of a point cloud. Figure 8 illustrates the depth pig image and the corresponding point cloud coordinates for the pixels within the designated box.
We transform depth images into 3D point clouds by assigning each pixel its corresponding 3D coordinate vector, which represents the size and shape of a pig. To capture the size cue, we calculate the Euclidean distance between each point and a reference point. The reference point is determined using evenly spaced basis vectors derived from the segmented image, with approximately 50 basis vectors in total. Let , where i ranges from 1 to N, denote the ith point cloud, and represent the reference point. The distance attribute of point with respect to the reference point is given by . We construct an N × N distance matrix . Next, we compute the top ten eigenvalues and eigenvectors from the distance matrix D in descending order of magnitude. The calculated eigenvalues are then normalized and utilized as the size descriptor for the pig.
To calculate the shape features of the pig, we calculate the kernel distance for any two points and as follows and use them to create a kernel distance matrix of size .
By computing the kernel matrix for the point cloud P and evaluating its top 10 eigenvalues, we conduct principal component analysis on the distance matrix K in the following manner.
The eigenvectors are represented by , and the corresponding eigenvalues are denoted by . After normalization, the calculated eigenvalues are used to define the kernel shape feature of the pig.
To capture gradient information in depth maps, we convert depth images into grayscale images. We apply the histogram of oriented gradient (HOG) feature extraction method to the depth image. In particular, we resize the segmented top-view image of the pig to (128 × 64) and divide it into (4 × 8) blocks of size (16 × 16) pixels. Each block is further divided into smaller cells of size (8 × 8) pixels. We calculate histograms of edge gradients with nine orientations from each local cell using Sobel filters. This results in a total of 1152 HOG features, which form a HOG feature vector. However, combining HOG features from all grid locations leads to a large number of features, so dimensionality reduction is necessary. Principal component analysis (PCA) is a commonly used technique for this purpose. Given a set of M-dimensional feature , we compute the covariance matrix as follows:
We performed PCA on the covariance matrix to obtain the top 10 eigenvalues and corresponding eigenvectors .
After normalizing the calculated eigenvalues, we employed the gradient features of the pig as
Figure 9 shows three kernel shape descriptors derived from arbitrarily selected pig images. By incorporating a prior distribution on the regression coefficient vector using the Bayesian ridge regression model, we can leverage the posterior distribution of for optimal estimation. In particular, we assume an independent normal distribution for each , with a mean of zero and a variance of , denoted, , where is a constant. This formulation allows us to calculate the posterior distribution of .
From this expression, we can compute the mode of the posterior distribution, which is also known as the maximum a posteriori (MAP) estimate. It is given as follows.
The Bayesian ridge regression estimate can be obtained by setting . In this way, Bayesian ridge regression can be seen as an extension of the Bayesian inference approach in general linear regression. Lastly, we utilized the estimated regression coefficients from the Bayesian ridge regression method to predict the weight of the pig using the following regression model.
3. Experimental Results
To evaluate the performance of the portable measuring device, the predictive power was examined using the collected pig images. Figure 10 shows a two-dimensional scatterplot between the actual and predicted values. From the given scatterplot, it was confirmed that the proposed portable measuring device predicts the weight of pigs well.
We calculated the correlation coefficient and the coefficient of determination between the predicted value and actual measurement to evaluate the extent to which the developed measuring device can predict the actual weight as presented in Table 1.
We calculated the root mean square error (RMSE), mean absolute predictive error (MAPE), and mean absolute scaled error (MASE) to determine the error between the predicted value and the actual observed weight using the proposed measuring device. Table 2 shows the measured values with respect to the three errors.
Finally, we evaluated how accurately the proposed prediction device can predict the actual weight of pigs from the various measures derived.
4. Conclusions
In this study, we proposed a portable device that can automatically predict the weight of pigs using Raspberry Pi with image-processing techniques and machine learning methods. The proposed portable device is composed of two parts (hardware and software). The hardware part consists of a depth camera, microcontroller, and display device. The software part consists of algorithms for image segmentation, feature extraction, and weight prediction.
An experiment was conducted using RGB-D images of several pigs collected from specific farms to evaluate the performance of the proposed prediction system. From the experimental results, it was confirmed that the proposed system effectively predicted the actual weight of the pigs. Additionally, it was confirmed via various error measures that the prediction device did not significantly cause a difference between the predicted and measured values. Therefore, we believe that the proposed system will be useful for determining the release time of pigs in actual farms.
Still, there are limitations to the proposed system, the high activity levels of pigs make it more challenging to measure their weight accurately while they are feeding, and it is not easy to capture specific individuals separately when they move in groups. Additionally, environmental variables within the barn, such as changes in lighting, pose challenges in obtaining clean images. Since pigs are active, they have various poses. When measuring the weight, various movements of pigs cause deviations in measuring in the system. For a future study, we will upgrade the system that can measure robust pig weighting even in a natural daily breeding environment.
Author Contributions
The authors confirm their contribution to the paper as follows: study conception and design: M.H.N., W.H.C. and I.S.N.; data collection: S.K.K. and M.H.N.; analysis and interpretation of results: I.S.N., W.H.C. and M.H.N.; draft manuscript preparation: W.H.C. and I.S.N. All authors have read and agreed to the published version of the manuscript.
Funding
Korea Institute of Planning and Evaluation for Technology in Food, Agriculture and Forestry (IPET) and Smart Farm R&D Foundation (KosFarm) through the Smart Farm Innovation Technology Development Program, funded by the Ministry of Agriculture, Food and Rural Affairs (MAFRA) and Ministry of Science and ICT (MSIT), and Rural Development Administration (RDA) (421017-04).
Institutional Review Board Statement
Ethical review and approval were waived for this study due to the data collection through observational methods without direct interaction with animal subjects. Therefore, no separate ethical review or approval process was deemed necessary.
Data Availability Statement
The datasets generated or analyzed during this study are available from the corresponding author upon reasonable request, and partial data are not available due to commercial restrictions.
Acknowledgments
We deeply appreciate the assistance provided by Turnitin.com (accessed on September 2023) for conducting plagiarism checks.
Conflicts of Interest
The authors declare no conflict of interest.
References
- Femandes, A.F.A.; Dorea, J.R.R.; Rosa, G.J.M. Image analysis and computer vision applications in animal sciences: An overview. Front. Vet. Sci. 2020, 7, 551269. [Google Scholar] [CrossRef] [PubMed]
- Oliveira, D.A.B.; Pereira, L.G.R.; Bresolin, T.; Ferreira, R.E.P.; Dorea, J.R.R. A review pf deep learning algorithms for computer vision systems in livestock. Livest. Sci. 2021, 253, 104700. [Google Scholar] [CrossRef]
- Wurtz, K.; Camerlink, I.; D’Eath, R.B.; Fernandez, A.P.; Norton, T.; Steibel, J.; Siegford, J. Recording behavior of indoor-housed farm animals automatically using machine vision technology: A systematic review. PLoS ONE 2019, 14, e0226669. [Google Scholar] [CrossRef] [PubMed]
- Nasirahmadi, A.; Edwards, S.A.; Sturm, B. Implementation of machine vision for detecting behavior of cattle and pigs. Livest. Sci. 2017, 202, 25–38. [Google Scholar] [CrossRef]
- Wang, Z.; Shadpour, S.; Chan, E.; Rotondo, V.; Wood, K.M.; Tulpan, D. ASAS-NANP SYMPOSIUM: Application of machine learning for livestock body weight prediction from digital images. J. Anim. Sci. 2021, 99, skab022. [Google Scholar] [CrossRef] [PubMed]
- Kollis, K.; Phang, C.S.; Banhazi, T.M.; Searle, S.J. Weight estimation using image analysis and statistical modeling: A preliminary study. Appl. Eng. Agric. 2007, 23, 91–96. [Google Scholar] [CrossRef]
- Li, Z.; Luo, C.; Teng, G.; Liu, T. Estimation of pig weight by machine vision: A review. In Computer and Computing Technologies in Agriculture VII, Proceedings of the CCTA 2013, Part II, IFIP AICT, Beijing, China, 18–20 September 2013; Springer: Berlin/Heidelberg, Germany, 2014; Volume 420, pp. 42–49. [Google Scholar]
- Kashiha, M.; Bahr, C.; Ott, S.; Moons, C.P.H.; Niewold, T.A.; Ödberg, F.O.; Berckmans, D. Weight estimation of pigs using top-view image processing. In Image Analysis and Recognition, Proceedings of the ICIAR 2014, Part I, LNCS, Vilamoura, Portugal, 22–24 October 2014; Springer: Berlin/Heidelberg, Germany, 2014; Volume 8814, pp. 496–503. [Google Scholar]
- Shi, C.; Teng, G.; Li, Z. An approach of pig weight estimation using binocular stereo system based on LabVIEW. Comput. Electron. Agric. 2016, 129, 37–43. [Google Scholar] [CrossRef]
- Doeschi-Wilson, A.B.; Whittemore, C.T.; Knap, P.W.; Schofield, C.P. Using visual image analysis to describe pig growth in terms of size and shape. Anim. Sci. 2016, 19, 415–427. [Google Scholar]
- Jun, K.; Kim, S.J.; Ji, H.W. Estimating pig weights from images without constraint on posture and illumination. Comput. Electron. Agric. 2018, 153, 169–176. [Google Scholar] [CrossRef]
- Suwannakhun, S.; Daungmala, P. Estimating pig weight with digital image processing using deep learning. In Proceedings of the 2018 14th International Conference on Signal-Image Technology & Internet-Based Systems (SITIS), IEEE Computer Society, Las Palmas de Gran Canaria, Spain, 26–29 November 2018; pp. 320–325. [Google Scholar]
- Fernandes, A.F.A.; Dorea, J.R.R.; Fitzgerald, R.; Herring, W.; Rosa, G.J.M. A novel automated system to acquire biometric and morphological measurements and predict body weight of pigs via 3D computer vision. J. Anim. Sci. 2019, 97, 496–508. [Google Scholar] [CrossRef] [PubMed]
- Yoshida, K.; Kawasue, K. Robust 3D pig measurement in pig farm. In Computer Vision—ECCV 2018 Workshops, Proceedings of the ECCV 2018LNCS, Munich, Germany, 8–14 September 2018; Springer: Cham, Switzerland, 2018; Volume 11129, pp. 387–400. [Google Scholar]
- Kaewtapee, C.; Rakangtong, C.; Bunchasak, C. Pig weight estimation using image processing and artificial neural networks. J. Adv. Agric. Technol. 2019, 6, 253–256. [Google Scholar] [CrossRef]
- Cang, Y.; He, H.; Qiao, Y. An intelligent pig weights estimate method based on deep learning in sow stall environment. IEEE Access 2019, 7, 164867–164875. [Google Scholar] [CrossRef]
- Yu, H.; Lee, K.; Morota, G. Forecasting dynamic body weight of non-restrained pigs from images using an RGB-D sensor camera. Transl. Anim. Sci. 2021, 5, txab006. [Google Scholar] [CrossRef] [PubMed]
- He, Y.; Tiezzi, F.; Howard, J.; Maltecca, C. Predicting body weight in growing pigs from feeding behavior data using machine learning algorithms. Comput. Electron. Agric. 2021, 184, 106085. [Google Scholar] [CrossRef]
- Hong, J.K. LSTM-based sales forecasting model. KSII Trans. Internet Inf. Syst. 2021, 15, 1232–1245. [Google Scholar]
- Tai, D.N.; Na, I.S.; Kim, S.H. HSFE network and fusion model based dynamic hand gesture recognition. KSII Trans. Internet Inf. Syst. 2020, 14, 3924–3940. [Google Scholar]
- Lodkaew, T.; Pasupa, K.; Loo, C.K. CowXNet: An automated cow estrus detection system. Expert Syst. Appl. 2023, 211, 118550. [Google Scholar] [CrossRef]
- Yang, G.; Li, R.; Zhang, S.; Wen, Y.; Xu, X.; Song, H. Extracting cow point clouds from multi-view RGB images with an improved YOLACT++ instance segmentation. Expert Syst. Appl. 2023, 230, 120730. [Google Scholar] [CrossRef]
- Liu, W.; Anguelov, D.; Erhan, D.; Szegedy, C.; Reed, S.; Fu, C.Y.; Berg, A.C. SSD: Single shot multibox detector. In Proceedings of the European Conference on Computer Vision, Amsterdam, The Netherlands, 11–14 October 2016; pp. 8–16. [Google Scholar]
- Zhao, L.; Wang, L. A new lightweight network based on MobileNetV3. KSII Trans. Internet Inf. Syst. 2022, 16, 1–15. [Google Scholar] [CrossRef]
Figure 1.
Developed portable device and color and depth images for pigs in a field.

Figure 2.
Overview of prediction system for pig weight.

Figure 3.
Overall structure of implemented hardware system: (a) internal structure of the system and (b) external structure of the system.
Figure 3.
Overall structure of implemented hardware system: (a) internal structure of the system and (b) external structure of the system.

Figure 4.
Platform for prediction of pig weight with GUI.

Figure 5.
Bounding box for pig area provided by SSD detector algorithm.

Figure 6.
Segmentation process of pig from depth image.

Figure 7.
Process of calculating the length and girth of pig.

Figure 8.
Point cloud data within a bounding box area. (a) Segmented pig image, (b) Three-dimensional coordinates for pixels in box region.
Figure 8.
Point cloud data within a bounding box area. (a) Segmented pig image, (b) Three-dimensional coordinates for pixels in box region.

Figure 9.
Three kernel shape descriptors derived from pig image.

Figure 10.
Scatterplot between actual and predicted values.


Table 1.
Correlation and determination coefficient between the predicted and the actual measurements.
Table 1.
Correlation and determination coefficient between the predicted and the actual measurements.
| Prediction Index | Correlation Coefficient | Determination Coefficient |
|---|---|---|
| Value | 0.9390 | 0.879 |
Table 2.
RMSE, MAPE, and MASE between the predicted and actual measurements.
| Prediction Index | RMSE | MAPE | MASE |
|---|---|---|---|
| Value | 10.702 | 8.348 | 0.146 |
Disclaimer/Publisher’s Note: The statements, opinions and data contained in all publications are solely those of the individual author(s) and contributor(s) and not of MDPI and/or the editor(s). MDPI and/or the editor(s) disclaim responsibility for any injury to people or property resulting from any ideas, methods, instructions or products referred to in the content. |
© 2023 by the authors. Licensee MDPI, Basel, Switzerland. This article is an open access article distributed under the terms and conditions of the Creative Commons Attribution (CC BY) license (https://creativecommons.org/licenses/by/4.0/).
Share and Cite
MDPI and ACS Style
Na, M.H.; Cho, W.H.; Kim, S.K.; Na, I.S. The Development of a Weight Prediction System for Pigs Using Raspberry Pi. Agriculture 2023, 13, 2027. https://doi.org/10.3390/agriculture13102027
AMA Style
Na MH, Cho WH, Kim SK, Na IS. The Development of a Weight Prediction System for Pigs Using Raspberry Pi. Agriculture. 2023; 13(10):2027. https://doi.org/10.3390/agriculture13102027
Chicago/Turabian StyleNa, Myung Hwan, Wan Hyun Cho, Sang Kyoon Kim, and In Seop Na. 2023. "The Development of a Weight Prediction System for Pigs Using Raspberry Pi" Agriculture 13, no. 10: 2027. https://doi.org/10.3390/agriculture13102027
Note that from the first issue of 2016, this journal uses article numbers instead of page numbers. See further details here.