Article

Monitoring the Wear Trends in Wind Turbines by Tracking Fourier Vibration Spectra and Density Based Support Vector Machines

1
National University of Science and Technology Politehnica Bucharest, 060042 Bucharest, Romania
2
Military Equipment and Technology Research Agency, 077025 Clinceni, Romania
3
Concordia Technical University, Montreal, QC H4B 1R6, Canada
*
Author to whom correspondence should be addressed.
Mathematics 2024, 12(9), 1307; https://doi.org/10.3390/math12091307
Submission received: 19 March 2024 / Revised: 9 April 2024 / Accepted: 22 April 2024 / Published: 25 April 2024
(This article belongs to the Special Issue Dynamic Modeling and Simulation for Control Systems, 2nd Edition)

Abstract

:
To make wind power more competitive, it is necessary to reduce turbine downtime and reduce costs associated with wind turbine operation and maintenance (O&M). Incorporating machine learning in the development of condition-based predictive maintenance methodologies for wind turbines can enhance their efficiency and reliability. This paper presents a monitoring method that utilizes Density Based Support Vector Machines (DBSVM) and the evolutionary Fourier spectra of vibrations. This method allows for the smart monitoring of the function evolution of the turbine. A complex optimal function (FO) for 5-degree order has been developed that will be the boundary function of the DBSVM to be timely determined from the Fourier spectrum through the magnitude–frequency and place of the failure occurring in the wind turbine drivetrains. The trend of the failure was constructed with the maximal values of the optimal frequency function for both yesthe cases of the upwind and downwind parts of the gearbox.

1. Introduction

1.1. The Future of Wind Turbines and the Novelty of the Paper

Wind energy has seen remarkable growth over the past decade and continues to be on an upward trend in the power generation industry. In the current context of the reduction in and even abandonment of conventional energy sources, wind energy has become a basic energy source, along with nuclear and hydro energy. In these conditions, the reliability and stability of the operation are necessary to maintain the production capacity for the longest possible periods and with the best possible predictability [1]. With the rapid development of wind turbine technology and in accordance with a higher demand for renewable energy, the number of wind turbine (WT) units has experienced a major increase, but under these conditions, the failure rate has also increased [2]. Power transmission is influenced by all components in the kinematic chain, rotor, gearbox, and generator. After an experience of over 20 years, both in operation and research, it can be concluded that the wind turbine component with the highest level of vulnerability is the gearbox, with a very high failure rate and downtime [1,2,3]. To make wind power more competitive, it is necessary to reduce turbine downtime and increase reliability. Condition monitoring can help reduce the chances of catastrophic failures, enabling cost-effective operation and maintenance practices. Compared to other applications, the representatives of the wind industry were quite late to recognize the benefits and importance of monitoring operating status through the use of artificial intelligence (AI) and vibration analysis [4]. Substantial research has been conducted to establish algorithms based on a large volume of data that train based on specific moments of failure, through machine learning, to obtain specific failure models [4,5].
This paper presents a method that leverages Fourier spectrum analysis and machine learning-based data extraction techniques for predicting wear in wind turbine operation. The novelty of the applied method lies in its utilization of unlabeled and uncategorized data to infer meaningful results for the predictive maintenance of wind turbines. In this study, functions representing the vibration trends of turbines across certain speed parameters, power levels, and wind flow conditions have been constructed. Furthermore, a density-based data filtering technique drawn from a machine learning-based method, Density Based Support Vector Machines (DBSVMs), has been employed at the data acquisition stages of the experiments.
The research was carried out over a period of about two months. The Fourier spectra were analyzed at different points in time while maintaining regulated and controlled parameters. With the help of at least five points from the Fourier spectra, the objective functions were defined. The evolution over time of these Fourier spectra’s maximum points (amplitude–frequency) offers an effective approach to ensuring predictive maintenance. The established objective functions can be utilized to determine the wear evolution in both the low-frequency and high-frequency areas of a wind turbine. As a result of the experiments, the envelope of normal operation and the envelope of the maximum limit of operation are obtained for the gearbox, which is the most vulnerable part of the wind turbine. The envelope of the maximum limit of operation refers to wind turbine operation until the appearance of a defect. These experiments define the frequency–amplitude limits, which allow for the predictive maintenance of turbine components by setting the intervention thresholds without the need for extensive data collection.
The organization of the paper is as follows. Section 1 includes the details of the current scenario of the predictive maintenance of wind turbines and the state-of-the-art methods used for the condition monitoring of wind turbines. The research methods and experiments conducted in this study are discussed in Section 2. The results of the experiments and their interpretations are presented in Section 3, and the conclusion and future work are briefed in Section 4.

1.2. Overview of Wind Turbine Condition Monitoring and Its Need

Wind energy has seen remarkable growth over the past decade and continues to be on an upward trend in the power generation industry [3]. In the current context of the reduction in and even abandonment of conventional energy sources, wind energy emerges as a primary source, along with nuclear energy and hydropower [5]. In these conditions, the reliability and stability of wind turbine operations are crucial to maintaining the production capacity for prolonged periods and with optimal predictability [1].
The monitoring of wind turbine (WT) conditions is defined as a complex process of monitoring the parameters of the state of the machine so that a significant change is detected, which indicates a possible developing fault [6]. This can potentially help in different stages of wear: the early detection of incipient failures, thus reducing the chances of catastrophic failures; accurately assessing the proper functioning of the components and reducing maintenance costs; the analysis of the fundamental causes of the occurrence of defects, which can ensure the optimal determination of the input parameters for an improved operation of the turbine; the establishment of the control strategy and the optimal design of the components [7,8,9,10]. In a broad sense, the CMS of a wind turbine can target almost all of its major subsystems, including the blades, nacelle, power transmission, tower, and foundation [9]. This paper presents a method that focuses on the monitoring of wind turbines and can be applied to the different components of the wind turbine: the rotor shaft with main bearings, the gearbox, and the generator. From a CMS perspective, the three major monitored transmission components are the rotor shaft, the gearbox, and the generator. Of these three components, the gearbox causes the longest downtimes [11,12,13]. For this reason, the gearbox was chosen as the main subsystem targeted in this study. In detail, this paper will cover the typical practices, challenges, and future research opportunities related to CM wind turbine drivetrains [14].
To understand the dynamic behavior of a WT and especially of a planetary gearbox, a number of techniques have been used in research and in the industrial field: vibration analysis, oil condition analysis, thermography, acoustic measurement, boroscopic inspection, electrical parameters effects, the self-diagnostic of sensors, etc. [15]. In order to ensure the optimal conditions for predictive maintenance, a combination of different techniques is needed. Even if the vibration technique has a dominant proportion, it is supported in the decision by the other specific technologies.
However, a vibration analysis on component fault diagnosis in wind turbines is a hard challenge due to the complex mechanical conditions of the power transmission kinematic chain, the variable operating conditions with transient phenomena, and the speed differences between the different elements of the gearbox [15,16,17]. In the use of vibration transducers specifically, piezoelectric accelerometers are the most used method, with different sensitivities depending on the speed and with a rigid fixation on the structure of the components [7,8,9]. The repartition of the sensors in the monitoring process of the wind turbine from the actual stage of the research is shown in Figure 1 and Table 1.
In this paper, the focus is on the monitoring of wind turbine drivetrains. The drivetrains consist of the main bearing, main shaft, gearbox, brake, generator shaft, and generator. From a CM perspective, the three major monitored transmission components are the main bearing, the gearbox, and the generator. Of these three components [6], the gearbox causes the longest downtimes. Other research has also shown that the gearbox is the most expensive subsystem to maintain during the 20-year operating life of a turbine [1,2,3,4,5,6,7]. For this reason, the gearbox was chosen as the main subsystem targeted in this study.

1.3. State of the Art in Turbine Wear Monitoring and Trend Analysis

Current research has led to the identification of the following monitoring techniques and directions, which can be applied to wind turbines [14,15]: vibration analysis; oil condition analysis; the thermography of important elements in the turbine structure (gearbox); the analysis of the physical condition of the materials; the measurement of elastic yielding and deformation of various components; acoustic measurements in various sensitive areas of the turbine; the measurement of various electrical effects; process parameter measurement; visual inspection; performance monitoring by comparing output sizes for the same input data; the use of self-diagnostic sensors (Figure 1).
(a)
Vibration analysis—Vibration analysis is the most well-known technology for monitoring working conditions, especially for rotating equipment [15]. The type of sensors used depends on the frequency range used for monitoring, the position of transducers on the transmission chain for the low-frequency range, the velocity sensor in the 5–1000 Hz frequency domain, the accelerometers for the high-frequency range, and the acoustic sensor for gearbox monitoring or blades.
(b)
Oil analysis—Oil analysis is another evaluation technique, which, coupled with vibration analysis, contributes to decision-making in predictive maintenance. Oil analysis is mostly conducted offline via sampling and also ensuring the quality of the oil. The contamination with dirt from the turbine parts in contact, the moisture, the degradation of additives, and the maintenance of the oil filter are also aspects of this method. However, to protect oil quality, the application of online sensors is used more and more often, especially for particle counters. In addition, protecting the condition of the oil filter is currently mainly applied to both hydraulic oil and lubricating oil. In the case of the excessive pollution of the filter, or a change in the characteristics of the oil, this leads to excessive wear [15].
(c)
Thermography—Thermography is often applied for the monitoring and fault identification of electrical and electronic components [15]. Hot spots due to component degeneration or poor contact can be identified in a simple and fast way using cameras and diagnostic software. Mainly, they are used in generator and power converter monitoring but also for thermal gear contact.
(d)
Inspection of component condition—This type of monitoring mainly focuses on detecting and tracking the evolution of wear using a boroscope device. This method is normally offline and is a very important decision criterion for stopping, limiting, or planning a repair [15,16].
(e)
Deformation measurement—Deformation measurement using manometers is a common technique but is not often applied in the case of wind turbine monitoring. Strain gauges are not robust in the long term [15,16,17]. For wind turbines, deformation measurement can be very useful for life prediction and stress level protection, especially for blades [18] but also for the main shaft.
(f)
Acoustic monitoring—Acoustic monitoring is related to vibration monitoring using noise measurement. Acoustic monitoring technology can be used for blade condition monitoring using an acoustic microphone or for bearing and gearbox monitoring using acoustic emission sensors fixed directly to the housing [15].
(g)
Electrical effects—The electrical parameter monitoring of a generator represents a mandatory condition in based condition maintenance (CBM). The analysis of electrical parameters, such as electrical current, voltage, insulation, power, etc., allows for both the evaluation of the quality of the generated power and the analysis of the potential faults [17].
(h)
Process parameters—Condition monitoring systems (CMSs) are becoming more sophisticated, and their diagnostic capabilities are improving. However, protection is mostly based on level detection or signal comparison, which directly leads to alarm when the signals exceed predefined threshold values. The integration of machine learning is still in the beginning stages, but in the future, solutions using AI will be sought for large-scale development [15].
(i)
Performance monitoring—Wind turbine performance is often gauged through the relationship between power, wind speed, rotor speed, and blade angle, and in the case of large deviations, an alarm sounds or a stop is even initiated [15]. The detection of margins is important to prevent false alarms [19]. Similar to process parameter estimation, more sophisticated methods like performance evolution monitoring are still not a common practice.
Thus, to obtain reliable predictive maintenance results, a combination of different techniques is needed. While vibration analysis may hold a predominant role, it is complemented by other specific technologies to perform decision-making accurately (Figure 1).

2. Applied Research Methods

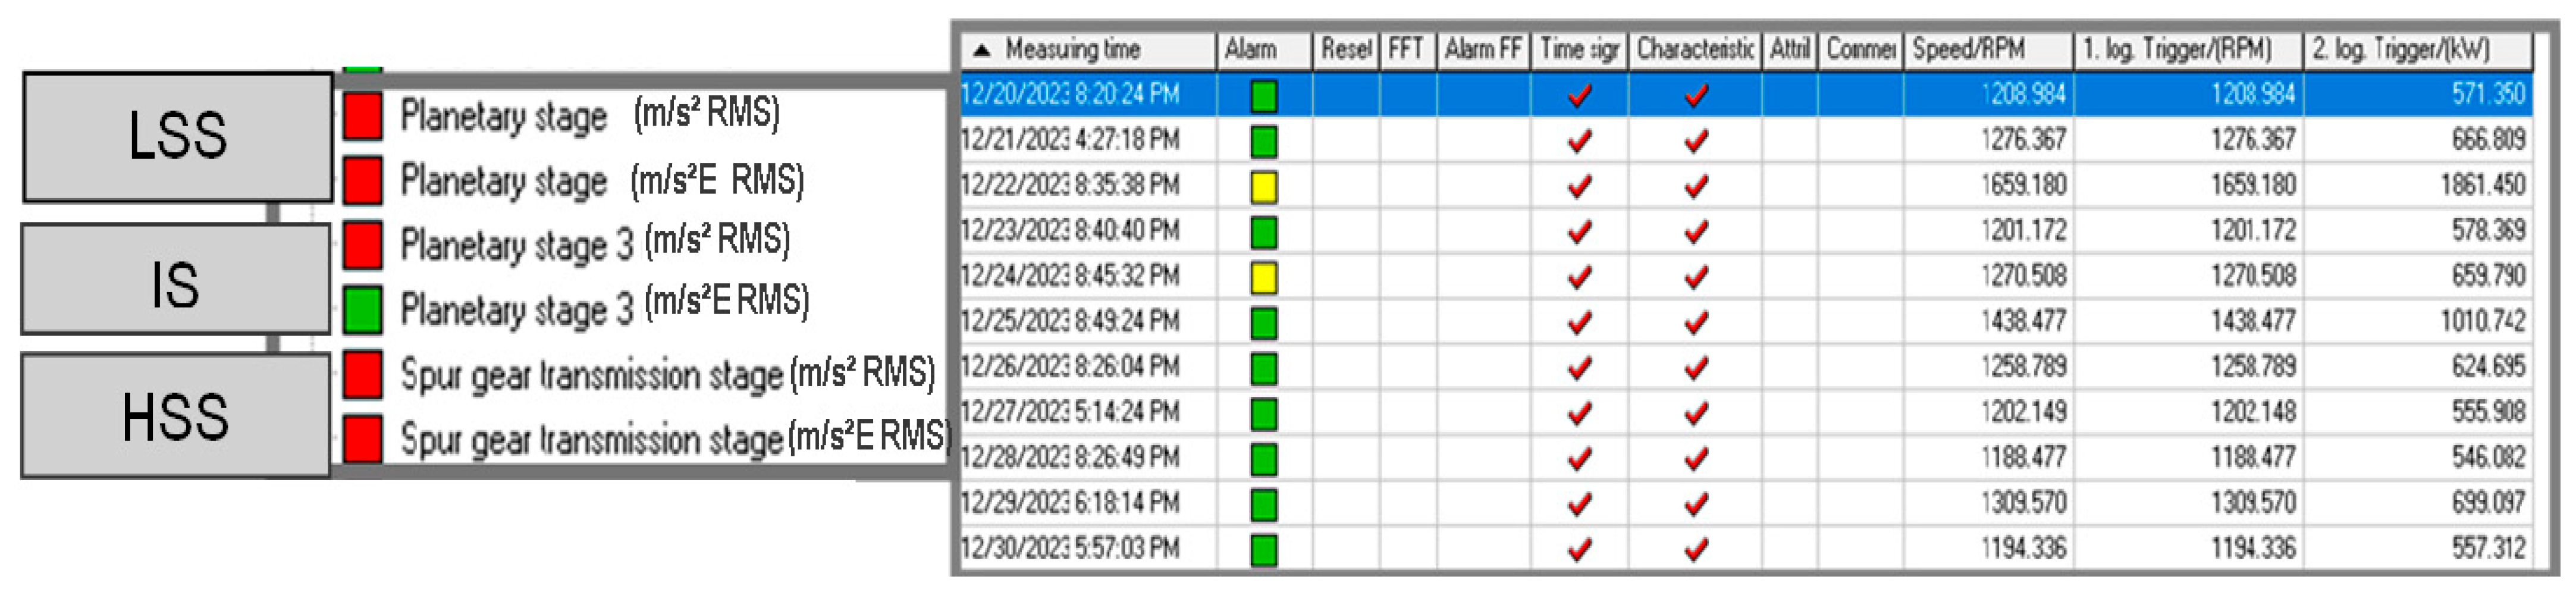
2.1. Condition Monitoring System

In this research, the experimental protocol is based on the Condition Monitoring System (CMS). The data used are part of the online data protocol regarding the wind turbines’ state of operation. The recorded data are analyzed using signal evaluation both in the time domain and in the frequency domain. The CMS provides all datasets as originally optimized for all turbines. The data are collected from a wind turbine gearbox. The repartition of the sensors in the monitoring process of the wind turbine from the actual stage of the research is shown in Figure 2.
The analysis is centered on the gearbox, examining the vibrations at three specific points of the gearbox: the low-speed shaft (LSS), the intermediary shaft (IS), and the high-speed shaft (HSS). The data acquisition is conducted using vibration sensors fixed on the bearings of the kinematic chain, starting from the input, which is the rotor side, and extending to the output, which is the generator side.
The data transmission and processing chain is illustrated in Figure 3. The online acquisition system allows the data to be recorded according to the original settings, thus capturing signals along with their speed and power readings. In this way, the evolution of vibrations can be determined specific to certain values of speed and power [20]. The system allowed the definition of parameters in the frequency domain both in the acquisition and analysis phases. The selected frequency range is according to ISO 10816-21 standards [21], including the rotor, gearbox, generator, and tower/nacelle. Figure 3 shows the datasets according to CMS, for the gearbox in the 3 entry points: LSS, IS, and HSS.
In these experiments, the data from the input of the gearbox, the acceleration in the frequency domain at LSS, and the data of the gearbox output, in the frequency domain at HSS, are taken into account, Figure 4.

2.2. Signal Processing and Defect Detection

The experiment is based on real-time vibration monitoring, using National Instrument equipment cRIO-9076 (Austin, TX, USA), with 12 input channels, a 24-bit resolution, and a 50 k samples/s/ch. max. speed; see Figure 5. The real-time monitoring data are set on a 25 k samples/s speed, a buffer size of 32,768 samples, and a block size of 10 k samples. The vibration monitoring provides the signal data from the 3 accelerometers fixed on the 3 gearbox points: the LSS with the 1–2 stages, the IS with the 3 stages, and the HSS with the spur gear stage. The accelerometers used have a 100 mV/g sensitivity for the IS and HSS points and a 500 mV/g sensitivity for the LSS point. For a precise synchronization between vibration signals and speed signals, a laser speed sensor fixed at the generator side was used.
Signal analysis was performed via numerical processing, taking into account the parameters (frequency and amplitude) being monitored. Thus, Figure 6 shows the waveforms obtained with the help of the monitoring software both in the time domain and in the frequency domain; Figure 7 and Figure 8 show the acceleration signal in the case of the gearbox wear. The vibration parameters are set according to the ISO 10816-21 standard, specifying acceleration in m/s2 RMS, vibration velocity in mm/s RMS, and demodulated acceleration in m/s2E. With the bearing frequency data, the characteristic frequency of the bearing defect can be identified. The structure of the vibration parameters is complex and based on the vibration defect theory [5,22]. The vibration limits for wind turbines, provided by the ISO 10816-21 standard, present an integrated base defining the recommended state of operation [23,24,25]. Even in this situation, many specific cases of the vibration of the wind turbine components are difficult to classify according to this standard [26]. For this purpose, it is proposed to develop a model that can interpret the state of operation in real operating conditions using data provided via the CMS.
The processing data and analysis approach for bearing detection are also applied for gear characterization using the gear mesh frequency data according to the kinematic chain of the gearbox [9,10,11,12]. The signal processing and analysis are performed with Fastview software (v300124), which allows for the use of both vibration monitoring and analysis in real time. The software allows for the identification of the specific failure frequencies of the gear and bearings through the method of vibration demodulating using the envelope function [27] with the dynamic filtering of the specific domain frequencies (Figure 7).
A novelty in the evaluation analysis of the gearbox wear condition is the envelope method using the Hilbert transform [27] with sideband energy coefficient integration, called SER coefficient (Sideband Energy Ratio™, a patent-pending algorithm utilized in the General Electric) [28,29,30,31,32], so that the impact energy generated by the defect can be quantified (Figure 8).
Figure 8 shows the spectrum of the acceleration envelope in the case of the gearbox defect. The quantification of the defective condition is evaluated by means of the gear mesh frequency presence (GMF) in relation to the sidebands, as well as its harmonics. According to the quantification of the level of sidebands in relation to the amplitude of the GMF frequency, it can be found that the ratio is less than one, which means that the defect in the HSS stage is present and is in an advanced state.

2.3. Using DBSVM-Based Data Extraction Technique

The Base density of the Support Vector for Machine Learning (DBSVM) [30] has been beneficial in establishing the basic data for neural network learning. In any monitoring activity, it is more efficient to train the neural network using DBSVM as it reduces the learning input data (decreasing computational complexity) and determines the resulting weights matrices to identify a mechanical failure without being impacted by the outliers. This study exploits this method to find the most relevant data points and establish the objective function (FO).
This data extraction method is based on the filtering of data points based on their population density. The population density of data points refers to the correlation between the population size and the space they occupy. The rationale behind this data filtering is to deal with the data points that are influenced by random noises or gross errors. These data points do not accurately represent the general trend. These points are considered outliers and can affect the accuracy of the established objective functions and, subsequently, the analysis. The densely populated areas in the input space are determined by calculating the Mahalanobis distance (1). The points lying in this region are considered meaningful points while the points lying outside of this region are considered outliers.
The Mahalanobis distance is calculated from the quantity μ which represents the average of the points’ distances, to each point. The cov−1 represents the inverse covariance matrix. This distance is explained in [33,34]. The Mahalanobis distance takes into account the correlation of the dataset and does not depend on the measurement scale [34,35,36]. The population variance is calculated with a variance–covariance matrix [35]. The Mahalanobis distance from the point to the mean of the distribution μ can be calculated by (1), and the Mahalanobis distance from one point to another can be calculated by (2):
          d = x μ T c o v 1 ( x μ )
          d = x y T c o v 1 ( x y )
where the population variance is calculated with [12]
v a r x n = 1 n ( x μ ) 2 n
and population covariance with
c o v x n , y n = 1 n x i μ x y i μ y n
  • If cov(xi) and cov(yi) > 0
  • both of them increase or decrease;
  • If cov(xi) and cov(yi) < 0
  • when xi increases, yi decreases, or vice versa;
  • If cov(xi) and cov(yi) = 0
  • no relation exists between xi and yi;
  • If var(xi) > var(yi)
  • xi increases or decreases faster than yi;
  • End.
The average of d is
a v e r a g e _ d = 1 n x i μ T c o v 1 ( x i μ ) n
where di is the distance between the points and d is the average of these distances
  • If di > d,
  • the point i is in the outlier group;
  • Else
  • the point i will be considered an important (meaningful) point in DBSVM;
  • End.

2.4. Objective Functions

The optimization function (FO) was proposed as a polynomial function of the fifth order with real coefficients that will be constructed using the data from the acquisition of Fourier spectra of the vibrations:
F O = a 1 × x 5 + a 2 × x 4 + a 3 × x 3 + a 4 × x 2 + a 5 × x + a 6
where ai will be determined using the matrix equation:
a 1 a 2 a 6 = x 1 5 x 1   1 x 5 5 x 5   1 x 1 5 x 1   1 x 5 5 x 5   1 T 1 F O 1 F O 5
with the following constraints:
-
xi > 0;
-
xi must be meaningful points, xi  group 1;
-
xi   DBSVM;
where FOi is the amplitude of the vibration evolution in time where the defect will appear and xi is the frequency in time. To define the FO, 5 boundary points (xi, FOi)  DBSVM will be used for each moment of time vs. frequency points but under the same conditions of forced vibration and for the same wind turbine. The DBSVM points must strictly adhere to the condition of belonging to DBSVM, which is that
di < average_d.
The boundary of the FO will be the limit of the optimal functioning of the wind turbine. In this way, the moment of time for the intervention on the gearbox will be determined to eliminate the danger of an imminent defect.

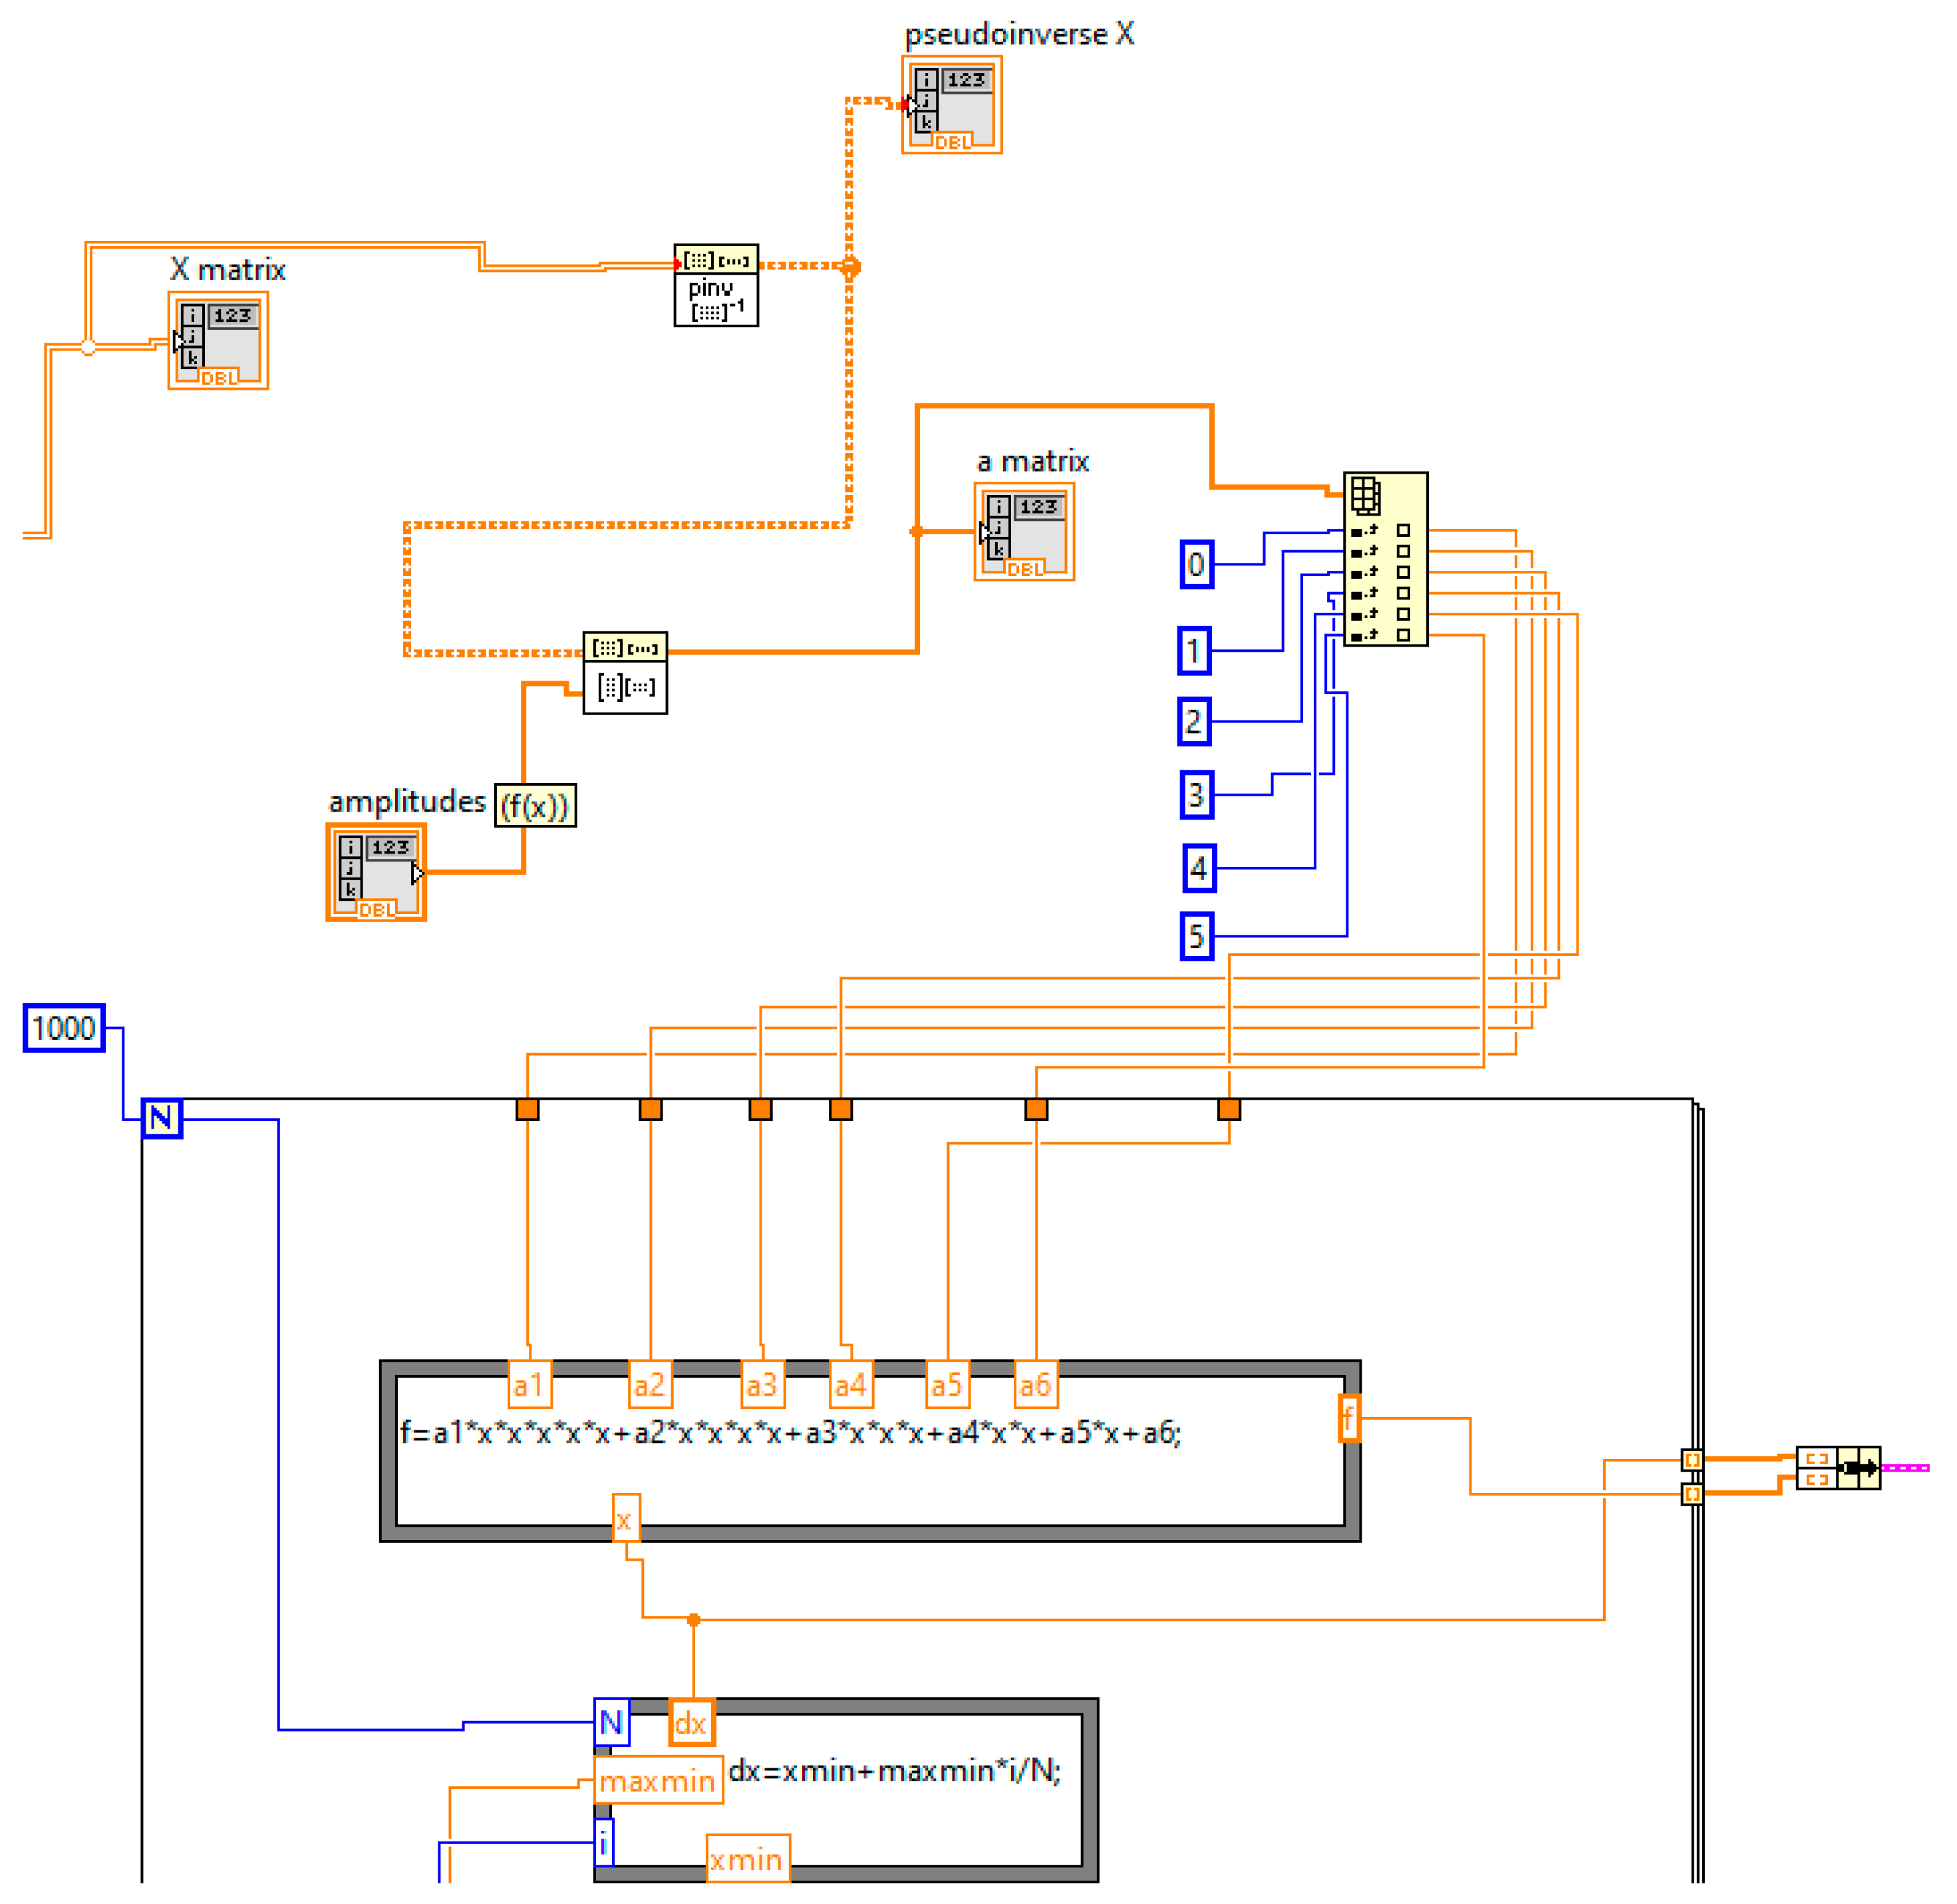
2.5. The Used Proper LabView Virtual Instrumentation for FO

To solve the objective function FO, proper LabView virtual instrumentation was used, and the block schemas are shown in Figure 9, Figure 10 and Figure 11.

2.6. Description of the Used Algorithm

The used algorithm includes the following stages, as depicted in Figure 12 and Figure 13: (i) the acquisition of data at different moments of time for the same parameters of wind, power, and speed; (ii) the application of relation (4) for calculating the distances between points di (max. amplitude and frequency of the Fourier spectra acquired); (iii) applying relation (5) to determine the average distance, d; (iv) defining group 1 of the DBSVM after checking the condition di < d; (v) establishing the boundary curve of DBSVM; (vi) analysis of Fourier spectra from group 1; (vii) defining the 5 maximum points from the Fourier spectra both for the upwind position and for the downwind position of the sensors; (viii) the use of LabView virtual instrumentation to determine the 5th-order objective functions; (ix) plotting multiple objective functions for Fourier spectra acquired during three months of operation, under the same conditions of wind, power, and speed; (x) defining the maximum points of the objectively drawn functions in order to determine the trend; (xi) determining the coefficients of the 5th-order objective functions of the trend for both low and high frequencies, as well as for upwind and downwind of the gearbox sensors positions.

3. Results and Analysis

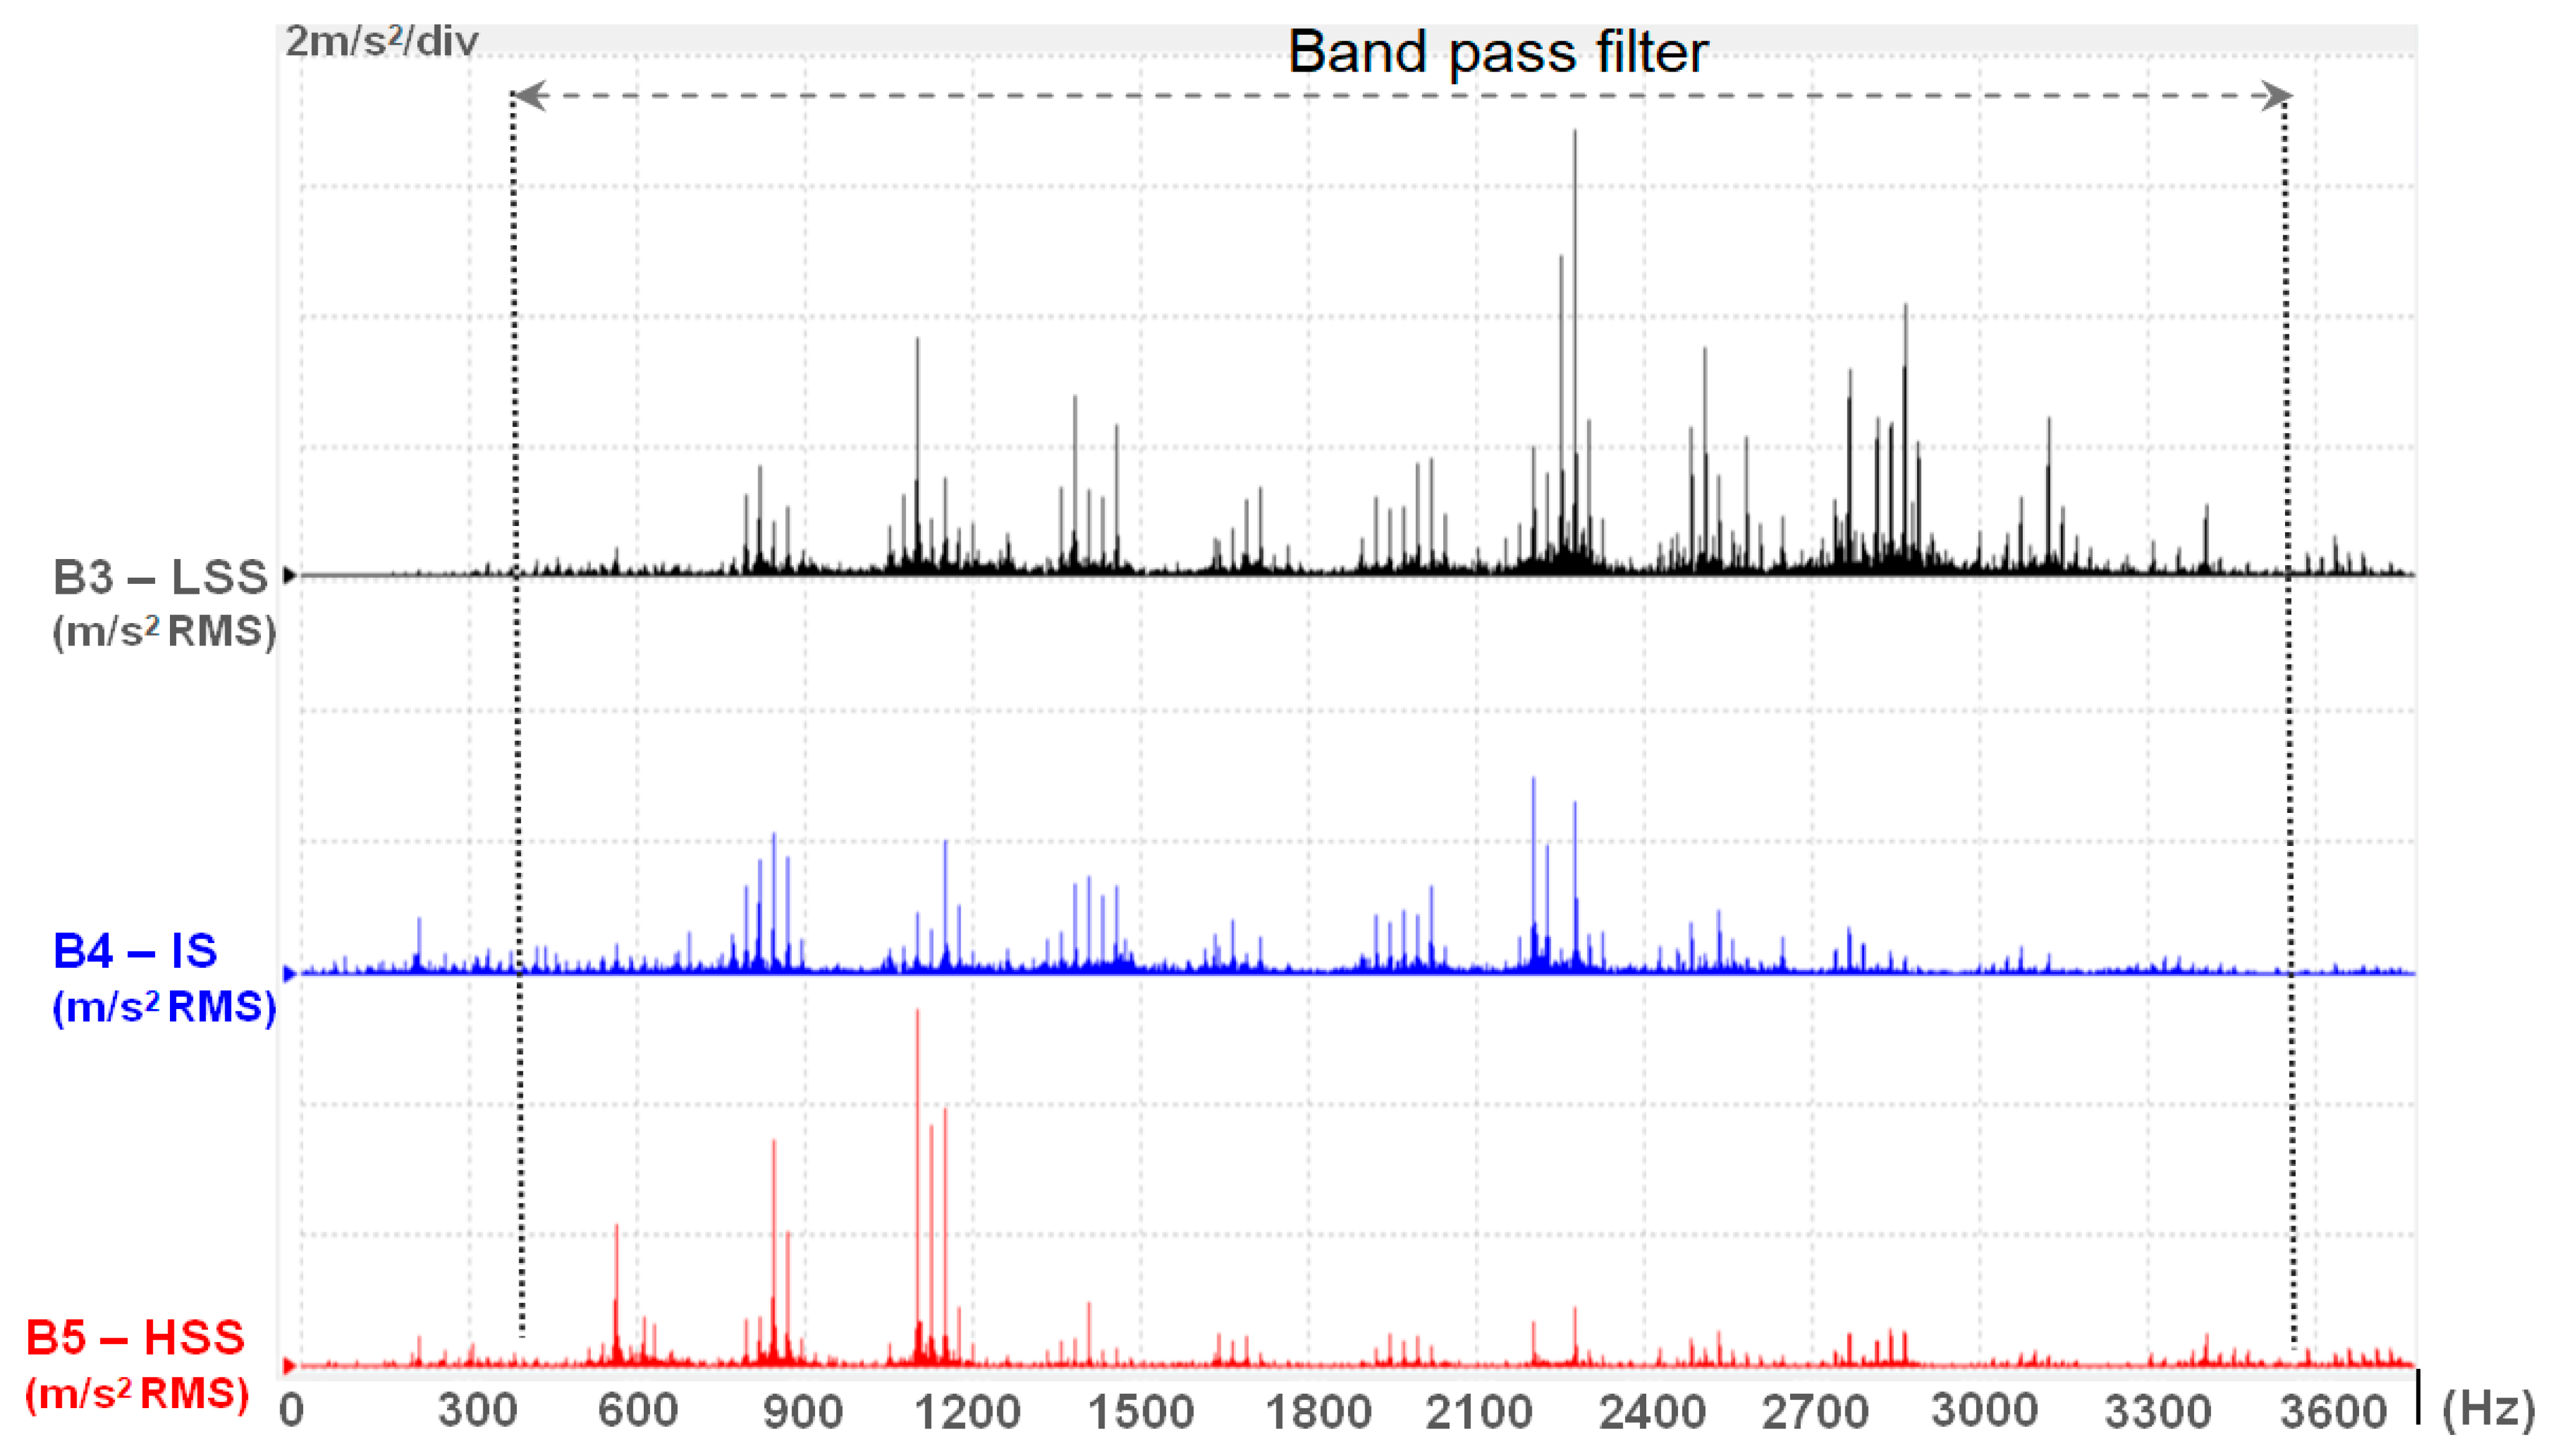
3.1. Establishing FO Boundary of Fourier Spectrum

If the operational limit of the turbine is set at a specific FO, a defect can be easily detected through control at each frequency. This can be performed by checking if the operational point (frequency, magnitude) is in the normal functioning area or outside of this. In this way, it is possible to determine the maximum permissible magnitude of vibration.
In this case, the equation of the FO will be
F O = 6.043 x 5 + 2.233 x 4 + 0.0005 x 3 0.04 x 2 + 0.74 x + 0.225
For predictive maintenance, the following relation would be applied:
F O i ( f i ) < F O j ( x i )
where xi is the frequency for the imposed five points  DBSVM, the points from the boundary limits, and fi represents all the current frequencies that must be checked. If this condition is false, the respective points could be the potential mechanical wear.
Using the Fourier spectra, the objective functions (FOi) were constructed the objective functions (FOi) for each of these datasets. All these FOs are shown in Figure 12, Figure 13, Figure 14 and Figure 15, for upwind and downwind sensors from the wind turbine gearbox. All objective functions, FOs, were determined using the maximal values of magnitude from each of the used Fourier spectra; see the table of each acquisition Fourier spectrum.

3.2. Construct the Objective Functions FO for All Selected Fourier Spectra

To construct the FO for the data acquisition and establish the trend of the maximum values of the vibration magnitude vs. frequency, four Fourier spectra were used for the upwind and downwind bearings; see Figure 15. The results of FOi are shown in Figure 16, Figure 17, Figure 18 and Figure 19.
To validate the mathematical vibration model proposed (Figure 13), the vibration data are obtained from the CMS of a 2.0 MW industrial WT gearbox, based on the acceleration position and data acquisition shown in Figure 2 and Figure 5. The gearbox is a planetary type with a transmission ratio of 116. This model was applied to synthesize the data acquisition of the wind turbine in the period between December 2023 and February 2024. The conditions that were imposed are the following: (i) the data acquisition was for the same, or very similar, wind turbines; (ii) the data acquisition was carried out from the sensors on the gearbox, B3-LSS and B5-HSS, with upwind LSS bearing radial and similarly downwind HSS bearing radial; (iii) the data acquisition was performed in the similar dynamic conditions of wind intensity, speed, and power; (iv) the acquisition data that was synthesized are the data that fall under the condition to be classified as a meaningful point, xi  group 1, xi   DBSVM; see Figure 14.
Using the data from the column matrices ai, the fifth-order equation for FOi will be determined. The FOi for the upwind position of the sensor is shown in relation (11) and for the downwind position in relation (12).
F O = 6.64 x 5 0.00017 x 4 + 0.017 x 3 0.0668 x 2 + 8.84 x + 2.473
F O = 7.44 x 5 0.0002 x 4 + 0.019 x 3 0.762 x 2 + 10.368 x + 2.921
F O = 9.291 x 5 0.00025 x 4 + 0.00246 x 3 0.969 x 2 + 13.1305 x + 3.664
F O = 8.28 x 5 0.00022 x 4 + 0.02 x 3 0.762 x 2 + 9.781 x + 2.735
F O = 3.745 x 5 + 5.323 x 4 0.00025 x 3 + 0.045 x 2 2.447 x 0.054
F O = 1.494 x 5 + 1.68 x 4 0.00062 x 3 + 0.08 x 2 1.056 x 0.04
F O = 5.902 x 5 5.157 x 4 + 0.00014 x 3 0.171 x 2 + 7.366 x + 0.25
F O = 7.391 x 5 6.068 x 4 + 0.00161 x 3 0.161 x 2 + 5.767 x + 0.234
All determined FOs represent different stages of the mechanical condition of the turbine gearbox assembly.

3.3. Determine the FO for the Trend

With the help of these functions, the trend of potential defects in the turbine gearbox area can be assessed. The characteristic frequencies of the WT gearbox in the damage case are presented in Figure 20 and Figure 21, corresponding to LSS-upwind and HSS-downwind. The frequency spectrum of acceleration for the LSS-upwind position shows the fundamental frequency of the planet pin (Figure 20) and the frequency spectrum of the HSS-downwind position shows the existence of the gear mesh frequency (GMF) generated by the HSS pin gear and planet pin gear. In the case of a faulty gear, the amplitude is much higher, reaching up to 10 times higher than in the normal condition case.
At any given moment, it is possible to check whether the function is approaching the period close to the appearance of a defect or not [4,37]. Throughout this timeframe, it will be possible to examine whether the points (frequency, magnitude) fall within the first or last FO or between them, providing information on the proximity of a potential defect, as per relations (11) and (12). The trends of these functions are depicted in Figure 22, represented by the maximum of the FO for each of the cases.
The trend functions are the following:
-
for the low frequency in the upwind position,
  F O = 5.6234 x 5 205.21 x 4 + 2779.11 x 3 16307.64 x 2 + 32142.12 x + 20071.2
-
for high frequency in the upwind position,
F O = 4.306 x 5 0.0096 x 4 + 0.7267 x 3 18.112 x 2 0.9755 x 0.0328
-
for high frequency in the downwind position,
F O = 1.0703 x 5 + 0.0086803 x 4 2.6357 x 3 + 355.109 x 2 17907.9 x 451.047
( M a g n i t u d e ,   f r e q u e n c y ) i c a t a s t r o p h i c   w e a r u p w i n d   o r   d o w n w i n d F O t r e n d u p w i n d   o r   d o w n w i n d
If the first FO objective function is defined after an intervention when the gearbox is working correctly, and the last function is determined close to the appearance of a defect, the position of any point (frequency, amplitude) can be determined between these limits. Intermediate FOs define the intermediate limits. Using this method, it will be possible to implement preventive maintenance and also monitor the normal operation of the gearbox of the wind turbine. The validation of this developed method can be carried out by checking whether the maximum points (frequency, magnitude) from the Fourier spectrum belonging to a certain trend as identified by the objective functions, correspond to any known instances of gearbox malfunction or failure in wind turbines. This would be performed through a collaboration with a wind turbine expert.

4. Conclusions and Future Work

This paper presents a novel approach to addressing the complexities of vibration monitoring and analysis in wind turbine gearboxes. By leveraging mathematical modeling and AI techniques, we have developed a method for evaluating gearbox conditions during operation that can help make meaningful interpretations from uncategorized vibration data from wind turbines. After analyzing the obtained results, the objective functions, and the trend of the monitoring results, we can make the following remarks: (i) the applied method is general and can be applied to many other dynamic monitoring processes; (ii) the designed LabView instrumentation for the synthetic analysis of the obtained acquisition data opens the way to applying more virtual instrumentation in monitoring the dynamic behavior across various mechanical fields; (iii) using DBSVMs to filter out the meaningful data adds a new front to applying machine learning in monitoring processes; (iv) establishing the trend of the FO for each position of the gearbox sensors ensures the design of an intelligent monitoring system for predictive maintenance; (v) the trend for the low frequency in the upwind sensor position is a decrease in frequency and an increase in magnitude; (vi) conversely, the trend involves an increase in both frequency and magnitude for the high frequency; and (vii) in the downwind sensor position, the trend is characterized by an increase in frequency and a decrease in magnitude.
In future work, we propose the generalization of this method and leveraging of neural networks for the rapid establishment of weight matrices, objective functions, and wear trends in wind turbines across all sensors. This will be integrated into a comprehensive matrix comprising objective functions, alongside a monitoring and trend matrix.
In the next stage of this research, SVM Regression analysis will be implemented to predict the magnitude of vibrations based on various input features (e.g., frequency, time). This information will help obtain a quantitative measure of potential defects. Upon a further assessment of the FFT spectra of vibrations leading up to failures or defects, we also aim to study and explore other features (fluctuations in phase, etc.) that could indicate upcoming defects. This condition-based maintenance strategy can also be further enhanced by incorporating supervised classification. We plan to label the datasets indicating different points (labeled points) in time leading up to the developing fault. This would be conducted through collaboration with industry specialists. The classification algorithm can be employed to identify the definite states of the system (normal operation, potential fault, critical fault). The combination of regression and classification would allow for a more comprehensive predictive maintenance approach.
The proposed method is intended to be applied in other industrial applications in the case of condition monitoring of machine tool spindles.

Author Contributions

Conceptualization, C.B. and A.O.; methodology, C.B. and A.O.; software, C.B. and A.O.; validation, C.B., A.O., S.O. and A.A.; formal analysis A.O., S.O. and A.A.; investigation, C.B., A.O., S.O., A.A., N.M. and H.U.; resources, C.B.; writing—original draft preparation, A.O. and C.B.; writing—review and editing, C.B., A.O., S.O., A.A., N.M. and H.U.; supervision, A.O.; funding acquisition, C.B. and A.O. All authors have read and agreed to the published version of the manuscript.

Funding

This work was supported by a grant from the National Program for Research of the National Association of Technical Universities—GNAC ARUT 2023.

Data Availability Statement

The requested data are currently unavailable as the owner has deemed them confidential for economic reasons.

Conflicts of Interest

The authors declare no conflicts of interest.

References

  1. Nie, Y.; Li, F.; Wang, L.; Li, J.; Sun, M.; Wang, M.; Li, J. A mathematical model of vibration signal for multistage wind turbine gearboxes with transmission path effect analysis. Mech. Mach. Theory 2021, 167, 104428. [Google Scholar] [CrossRef]
  2. Spinato, F.; Tavner, P.; van Bussel, G.; Koutoulakos, E. Reliability of wind turbine subassemblies. IET Renew. Power Gener. 2009, 3, 387–401. [Google Scholar] [CrossRef]
  3. Dao, C.; Kazemtabrizi, B.; Crabtree, C. Wind turbine reliability data review and impacts on levelised cost of energy. Wind Energy 2019, 22, 1848–1871. [Google Scholar] [CrossRef]
  4. Ren, B.; Chi, Y.; Zhou, N.; Wang, Q.; Wang, T.; Luo, Y.; Ye, J.; Zhu, X. Machine learning applications in health monitoring of renewable energy systems. Renew. Sustain. Energy Rev. 2024, 189, 114039. [Google Scholar] [CrossRef]
  5. Sheng, S.; Veers, P. Wind Turbine Drivetrain Condition Monitoring—An Overview. In Proceedings of the Mechanical Failures Prevention Group: Applied Systems Health Management Conference 2011, Virginia Beach, VA, USA, 10–12 May 2011. [Google Scholar]
  6. Zhu, Y.; Xie, B.; Wang, A.; Qian, Z. Fault diagnosis of wind turbine gearbox under limited labeled data through temporal predictive and similarity contrast learning embedded with self-attention mechanism. Expert Syst. Appl. 2024, 245, 123080. [Google Scholar] [CrossRef]
  7. Teng, W.; Ding, X.; Zhang, X.; Liu, Y.; Ma, Z. Multi-fault detection and failure analysis of wind turbine gearbox using complex wavelet transform. Renew. Energy 2016, 93, 591–598. [Google Scholar] [CrossRef]
  8. Vamsi, I.; Sabareesh, G.; Penumakala, P. Comparison of condition monitoring techniques in assessing fault severity for a wind turbine gearbox under non-stationary loading. Mech. Syst. Signal Process. 2019, 124, 1–20. [Google Scholar] [CrossRef]
  9. Teng, W.; Ding, X.; Tang, S.; Xu, J.; Shi, B.; Liu, Y. Vibration Analysis for Fault Detection of Wind Turbine Drivetrains—A Comprehensive Investigation. Sensors 2021, 21, 1686. [Google Scholar] [CrossRef] [PubMed]
  10. Liu, L.; Liang, X.; Zuo, M.J. Vibration signal modeling of a planetary gear set with transmission path effect analysis. Measurement 2016, 85, 20–31. [Google Scholar] [CrossRef]
  11. Liang, X.; Zuo, M.J.; Liu, L. A windowing and mapping strategy for gear tooth fault detection of a planetary gearbox. Mech. Syst. Signal Process. 2016, 80, 445–459. [Google Scholar] [CrossRef]
  12. Feng, Z.; Ma, H.; Zuo, M.J. Vibration signal models for fault diagnosis of planet bearings. J. Sound Vib. 2016, 370, 372–393. [Google Scholar] [CrossRef]
  13. Wang, T.; Han, Q.; Chu, F.; Feng, Z. Vibration based condition monitoring and fault diagnosis of wind turbine planetary gearbox: A review. Mech. Syst. Signal Process. 2019, 126, 662–685. [Google Scholar] [CrossRef]
  14. Salameh, J.P.; Cauet, S.; Etien, E.; Sakout, A.; Rambault, L. Gearbox condition monitoring in wind turbines: A review. Mech. Syst. Signal Process. 2018, 111, 251–264. [Google Scholar] [CrossRef]
  15. Hameed, Z.; Hong, Y.; Cho, Y.; Ahn, S.; Song, C. Condition monitoring and fault detection of wind turbines and related algorithms: A review. Renew. Sustain. Energy Rev. 2009, 13, 1–39. [Google Scholar] [CrossRef]
  16. Zhang, M.; Wang, K.; Wei, D.; Zuo, M.J. Amplitudes of characteristic frequencies for fault diagnosis of planetary gearbox. J. Sound Vib. 2018, 432, 119–132. [Google Scholar] [CrossRef]
  17. McNiff, B.; Keller, J.; Fernandez-Sison, A.; Demtroder, J. A Revised International Standard for Gearboxes in Wind Turbine Systems. In Proceedings of the Conference for Wind Power Drives, Aachen, Germany, 21–22 March 2023. [Google Scholar]
  18. Cao, L.; Liu, S. Vibration Suppression of an Input-Constrained Wind Turbine Blade System. Mathematics 2023, 11, 3946. [Google Scholar] [CrossRef]
  19. Peng, J.; Bian, Y.; Tian, D.; Liu, P.; Gao, Z. Vibration alleviation for wind turbine gearbox with flexible suspensions based on modal interaction. J. Low Freq. Noise Vib. Act. Control 2023, 42, 1390–1418. [Google Scholar] [CrossRef]
  20. Global Energy Research Council. Global Wind Report. 2009. Available online: http://www.gwec.net/fileadmin/documents/Publications/Global_Wind_2007_report/GWEC_Global_Wind_2009_Report_Lowres_15th.520Apr./pdf (accessed on 1 April 2024).
  21. BS ISO 10816-21:2015; Mechanical Vibration. Evaluation of Machine Vibration by Measurements on Non-Rotating Parts Horizontal Axis Wind Turbines with Gearbox. International Organization for Standardization: Geneva, Switzerland, 2015.
  22. Verbruggen, T.W. Condition Monitoring: Theory and Practice. In Proceedings of the 2009 Wind Turbine Condition Monitoring Workshop, Broomfield, CO, USA, 8–9 October 2009. [Google Scholar]
  23. Germanischer Lloyd. Guideline for the Certification of Condition Monitoring Systems for Wind Turbines; Germanischer Lloyd WindEnergie GmbH: Hamburg, Germany, 2007. [Google Scholar]
  24. Gellermann, T.; Walter, G. Requirements for Condition Monitoring Systems for Wind Turbines; AZT Report No. 03.01.068; AZT: London, UK, 2003. [Google Scholar]
  25. Wind Stats Newsletter, 2003–2009, Vol. 16, No. 1 to Vol. 22, No. 4. Haymarket Business, Media: London, UK. Available online: https://www.nrel.gov/docs/fy13osti/58774.pdf (accessed on 2 April 2024).
  26. Veers, P. Databases for Use in Wind Plant Reliability Improvement. In Proceedings of the 2009 Wind Turbine Condition Monitoring Workshop, Broomfield, CO, USA, 8–9 October 2009. [Google Scholar]
  27. Bisu, C.F.; Zapciu, M.; Cahuc, O.; Gérard, A.; Anica, M. Envelope Dynamic Analysis: A New Approach for Milling Process Monitoring. Int. J. Adv. Manuf. Technol. 2011, 62, 471–486. [Google Scholar] [CrossRef]
  28. Zhang, M.; Cui, H.; Li, Q.; Liu, J.; Wang, K.; Wang, Y. An improved sideband energy ratio for fault diagnosis of planetary gearboxes. J. Sound Vib. 2021, 491, 115712. [Google Scholar] [CrossRef]
  29. Pattabiraman, T.R.; Srinivasan, K.; Malarmohan, K. Assessment of sideband energy ratio technique in detection of wind turbine gear defects. Case Stud. Mech. Syst. Signal Process. 2015, 2, 1–11. [Google Scholar]
  30. Hanna, J.; Hatch, C.; Kalb, M. Detection of Wind Turbine Gear Tooth Defects Using Sideband Energy Ratio; GE Enregy: New York, NY, USA, 2012. [Google Scholar]
  31. Verbruggen, T.W. Wind Turbine Operation and Maintenance Based on Condition Monitoring; Energy Research Center of the Netherlands: Petten, The Netherlands, 2003; Available online: https://www.ecn.nl/publicaties/PdfFetch.aspx?nr=ECN-C--03-047 (accessed on 20 April 2024).
  32. Dodge, Y. The Concise Encyclopedia of Statistics; Springer: Berlin/Heidelberg, Germany, 2008. [Google Scholar]
  33. Nazari, Z.; Kang, D.; Endo, H. Density Based Support Vector Machines. In Proceedings of the 29th International Technical Conference on Circuits/Systems, Computers and Communications (ITC-CSCC), Phuket, Thailand, 1–4 July 2014; pp. 1–3. [Google Scholar]
  34. El Moutaouakil, K.; El Ouissari, A.; Olaru, A.; Palade, V.; Ciorei, M. OPT-RNN-DBSVM: OPTimal Recurrent Neural Network and Density-Based Support Vector Machine. Mathematics 2023, 11, 3555. [Google Scholar] [CrossRef]
  35. Available online: https://www.geeksforgeeks.org/covariance-matrix/ (accessed on 2 April 2024).
  36. Nazari, Z.; Kang, D. Density Based Support Vector Machines for Classification. Int. J. Adv. Res. Artif. Intell. 2015, 4, 040411. [Google Scholar] [CrossRef]
  37. Valikhani, M.; Jahangiri, V.; Ebrahimian, H.; Moaveni, B.; Liberatore, S.; Hines, E. Inverse modeling of wind turbine drivetrain from numerical data using Bayesian inference. Renew. Sustain. Energy Rev. 2023, 171, 113007. [Google Scholar] [CrossRef]
Figure 1. The position of the sensors for the monitoring process.
Mathematics 12 01307 g001
Figure 2. Schema of the experimental stand with the position of the used sensors.
Mathematics 12 01307 g002
Figure 3. Synopsis of data acquisition and signal processing.
Mathematics 12 01307 g003
Figure 4. Example of CMS data presentation.
Mathematics 12 01307 g004
Figure 5. Vibration monitoring devices.
Mathematics 12 01307 g005
Figure 6. Signal processing and defect detection from the CMS.
Mathematics 12 01307 g006
Figure 7. Acceleration signal in the case of gearbox wear.
Mathematics 12 01307 g007
Figure 8. Envelope acceleration in the case of gearbox wear.
Mathematics 12 01307 g008
Figure 9. Part of the block schema of the LabView virtual instrumentation to determine the FO5 order.
Mathematics 12 01307 g009
Figure 10. Part of the block diagram represents the FO (polynomial function of the 5-degree order) characteristic.
Mathematics 12 01307 g010
Figure 11. Front panel with the results of the optimization function FO for known points from the DBSVM (the maximal values from the Fourier spectrum).
Mathematics 12 01307 g011
Figure 12. Block schema of the part of the used algorithm to establish the DBSVM of the collected data.
Mathematics 12 01307 g012
Figure 13. Block schema of the part of the used algorithm to establish the objective functions (FOs) using the Fourier spectrum collected from the boundary of the DBSVM.
Mathematics 12 01307 g013
Figure 14. The acquisition data distribution and the establishment of boundary values for group 1, representing meaningful points of DBSVM, occur under similar dynamic conditions of speed and power. This characteristic is constructed by applying the DBSVM algorithm.
Mathematics 12 01307 g014
Figure 15. Fourier spectrum from data acquisition between December 2023 and February 2024, in an upwind and downwind position of the sensors in the gearbox of WTs. (a) Fourier spectrum at 1514 RPM and 1037.4 kW on 25 December 2023, in an upwind position. (b) Fourier spectrum at 1577 RPM and 1169.4 kW on 18 January 2024, in an upwind position. (c) Fourier spectrum at 1492 RPM and 1027.6 kW on 26 January 2024, in an upwind position. (d) Fourier spectrum at 1552 RPM and 1158 kW, on 30 January 2024, in an upwind position. (e) Fourier spectrum at 1523 RPM and 1054 kW on 25 December 2023, in a downwind position. (f) Fourier spectrum at 1455 RPM and 971.4 kW on 11 January 2024, in a downwind position. (g) Fourier spectrum at 1471 RPM and 982 kW on 18 January 2024, in a downwind position. (h) Fourier spectrum at 1481 RPM and 1006.5 kW on 26 January 2024, in a downwind position.
Mathematics 12 01307 g015aMathematics 12 01307 g015bMathematics 12 01307 g015cMathematics 12 01307 g015d
Figure 16. Objective functions (FOi) for all four selected acquisition data spectra in the upwind sensor position.
Mathematics 12 01307 g016
Figure 17. The front panel of the used LabView VI-s with input and output data for the upwind position sensor.
Mathematics 12 01307 g017
Figure 18. Objective functions (FOi) for all four selected acquisition data spectra in a downwind sensor position.
Mathematics 12 01307 g018
Figure 19. The front panel of the used LabView VI-s with input and output data for the downwind position sensor.
Mathematics 12 01307 g019
Figure 20. The frequency spectrum at the LSS position in the case of gearbox defect.
Mathematics 12 01307 g020
Figure 21. The frequency spectrum at the HSS position in the case of gearbox defect.
Mathematics 12 01307 g021
Figure 22. The trend of the magnitude–frequency points from the FO. (a) Trend of the FO in the upwind position of the gearbox sensor in a low frequency. (b) Trend of the FO in the upwind position of the gearbox sensor in a high frequency. (c) Trend of the FO in the downwind position of the gearbox sensor.
Mathematics 12 01307 g022aMathematics 12 01307 g022b
Table 1. Sensor notation and position on the wind turbine.
Sensor LabelDescription
B1-MB-RSMain bearing accelerometer—rotor side
B2-MB-GSMain bearing accelerometer—generator side
B3-LSSGearbox accelerometer—low-speed shaft
B4-ISGearbox accelerometer—intermediary shaft
B5-HSSGearbox accelerometer—high-speed shaft
B6-G-DEGenerator accelerometer—drive end side
B7-G-NDEGenerator accelerometer—non-drive end side
Disclaimer/Publisher’s Note: The statements, opinions and data contained in all publications are solely those of the individual author(s) and contributor(s) and not of MDPI and/or the editor(s). MDPI and/or the editor(s) disclaim responsibility for any injury to people or property resulting from any ideas, methods, instructions or products referred to in the content.

