1. Introduction
Smart manufacturing/Industry 4.0 is going to be the future development trend of manufacturing enterprises [
1]. In the various stages of the implementation of Industry 4.0, each sector of the manufacturing industry in various nations will have its own major directions and development aspects [
2]. The core feature of the industrial internet in the United States, Germany’s Industry 4.0 strategy, and made in China 2025 is interconnection, the essence of which is to shift from economies of scale to economies of scope through the automated flow of data, and to build out heterogeneous and customized industries at a homogeneous and scaled cost, thus promoting the reform of industrial structure [
3,
4,
5,
6,
7,
8]. According to the data compiled by some of the scholars, Chinese manufacturing companies have great enthusiasm and expectation for Industry 4.0. A total of 76% of Chinese manufacturing companies believe that the use of Industry 4.0 strategy will greatly enhance the competitiveness of manufacturing industry, compared to 54% in the United States, 51% in Japan, and a low of 47% in Germany [
9]. Chinese manufacturers are indeed very enthusiastic about Industry 4.0 and have high expectations for it, yet there are significant concerns and challenges with its implementation. While interviewing Chinese manufacturing companies, only 53% of them said that they are fully prepared for Industry 4.0 strategy, compared to 71% and 68%, in the US and Germany, respectively. Among them, state-owned enterprises are the most conservative, only 44% of the surveyed state-owned enterprises said that they are ready for Industry 4.0 strategy; the proportion of private manufacturing enterprises is as high as 68% [
10]. One of the reasons is that the digital foundation for the development of intelligent manufacturing is relatively weak. The development of manufacturing industry as a whole is still in the transition stage from mechanical automation to digital automation. As far as the Industry 4.0 is considered in Germany as a reference system, the overall is still in the 2.0 era, but some enterprises are moving towards the 3.0 era. Therefore, most of China’s manufacturing industry still needs to use lean management to reduce costs and increase efficiency, as well as use Industry 4.0 technology to upgrade and transform. Lean management is the soft aspect of overall optimization of manufacturing and management processes; while intelligent manufacturing is the hard aspect of intelligent upgrading of production factors and information systems. Chinese manufacturing companies must combine “hard and soft” and employ lean management to build a strong foundation for manufacturing companies to execute smart manufacturing in this wave of global manufacturing transformation and upgrading.
The rapid development of industry and the excessive use and waste of resources by human beings have led to the depletion of resources. In addition, a large amount of industrialized production also causes environmental pollution [
11]. Existing manufacturing methods are causing climate warming and resource depletion, and are unsustainable. In order to solve this global challenge, Industry 4.0 is developed. Therefore, the first connotation of Industry 4.0 is to be smart, green, lean, and humanized. The pursuit of personalized items is gradually becoming more and more challenging for traditional production methods to generate personalized or customized products in large quantities due to the changing needs of consumers. The smart factory in Industry 4.0 environment aims to produce precise, high-quality, and personalized smart products, so that the efficiency and cost of single-piece small batch production can reach the same level of mass production. It can be customized for enterprise customers in large scale and small batch, and also for individual users in small batch and single product. The logistics and transportation system from raw materials to final products is completed by intelligent logistics. The lean production method is a great way to produce high quality and low consumption, under mixed production conditions of multiple varieties and small batches. Green first term refers to the use of alternative, non-traditional clean energy. It can reduce traditional energy consumption, effectively alleviate resource depletion, but also produces fewer pollutants, meaning effective protection of the environment. No matter how a product is made, its use and disposal have little effect on the environment across its entire life cycle, and they could be recovered and repurposed to promote sustainable development. Therefore, lean management and green manufacturing are the cornerstones for digital transformation to bring benefits. At the same time, John et al. (2021) showed that the goal of implementing lean-green manufacturing in manufacturing companies is at the same time the goal to be achieved by Industry 4.0, where lean-green manufacturing promotes a more time-efficient and resource-efficient of Industry 4.0 factory, which in turn further enhances lean-green manufacturing [
12]. It can help substantiate this theory: the integration of lean-green manufacturing into the same framework in an Industry 4.0 context.
In summary, it is crucial for manufacturing companies to integrate and collaborate on the implementation of lean-green manufacturing systems in the process of Industry 4.0 transformation and upgrading. However, the lack of confidence and preparedness of Chinese manufacturing companies regarding the Industry 4.0 strategy is largely due to two major challenges: high-quality development, and improving total factor productivity. Therefore, it is necessary for the vast majority of manufacturing companies in China to determine how to integrate the collaborative implementation of lean-green manufacturing systems in a smart manufacturing/Industry 4.0 scenarios, and what are their drivers and relationships. In order for effectively collaborative integration implementation of lean-green manufacturing system under Industry 4.0, this research framework addresses the following research questions:
Question 1. What are the drivers for integrated and collaborative implementation of lean-green manufacturing systems?
Question 2. What are the most critical drivers?
Question 3. What is the cause-and-effect relationship between them?
Question 4. What are the steps that need to be taken to better motivate these drivers to work? How about to achieve the goal?
In the context of Industry 4.0, this manuscript analyzes the driving factors for collaboratively integrating the implementation of a lean-green manufacturing system. Aiming at the uncertainty and correlation problems in the process of driving factors identification, this study proposes an Interpretation Structure Model (ISM) of fuzzy comprehensive Analytic Hierarchy Process (AHP), based on decision making trial and evaluation laboratory (DEMATEL) to determine the importance of the driving factors. Combined with the complex network theory, the evaluation index system is divided into four levels from eight categories of factors, including endogenous lean-green driving factors and exogenous driving factors. The fuzzy AHP-DEMATEL-ISM is used to analyze the relationship between indicators and the structure of the indicator system, and the complex network composed of the indicator system is divided into different levels. The importance of indicators is analyzed from the perspective of the global network, and the important factors and key factors affecting the driving of lean-green system are analyzed. By paying special attention to the main impact indicators and actively cultivating the key impact indicators, the lean-green manufacturing system integration and synergy of the organization are promoted to jointly drive the enterprise to achieve sustainable development.
The paper consists of five parts. The rest of the paper is structured as follows:
Section 2 presents the analysis of the driving factors of collaborative integration implementation of lean-green manufacturing system. The research methodology is discussed in
Section 3, followed by a presentation of the case study in
Section 4. In the last section, some conclusions are drawn.
2. Analysis of the Driving Factors of Collaborative Integration Implementation of Lean-Green Manufacturing System
There have been related research conducted by foreign scholars on the integrated implementation of lean-green manufacturing, for example, Mittal et al. (2017) proposed a new manufacturing strategy for manufacturing companies to increasing customer choice, address environmental issues in the manufacturing process and enhance their own competition among global manufacturers, thus adopting a lean-green-agile manufacturing system to coordinate trade-offs to meet the economic, environmental and social demands of modern manufacturing systems [
13]. A recent study by Teresa et al. (2022) used a questionnaire to verify the operational, environmental, and financial performance of manufacturing companies implementing lean and green practices in Portugal, ultimately confirming that the widespread adoption of lean and green practices produced better overall operational, environmental and financial performance, and that the integrated implementation of lean and green management practices in companies resulted in superior return on investment [
14]. A new paradigm of lean-green manufacturing is made possible by the Industry 4.0 era in the manufacturing sector. Industry 4.0 can be understood as digital lean with an emphasis on green. That is to say, there will always be pressure to raise standards of productivity, quality, agility, environmental friendliness, and customer service in order to stay profitable and competitive in today’s corporate environment. Lean-green manufacturing is the foundation for achieving smart factories. A comprehensive review of the lean-green literature by the author team and related scholars in this paper indicates that there is a lack of research to analyze the drivers of integrated lean-green integrated synergistic implementation [
15,
16,
17,
18,
19,
20]. Several scholars and researchers have studied the integration paradigm of lean and green, and their research has mainly focused on the practical approach of the integration of lean and green and its impact on operational and environmental performance. Some scholars have also studied the internal barriers to the implementation of lean-green manufacturing, and have taken countermeasures to eliminate the existing barriers [
18,
19,
20]. The corresponding initiative is to study and activate the drivers of lean-green manufacturing system implementation in order to better collaborate and integrate the development of these systems.
The existing literature has confirmed the conclusion that the core concept of lean manufacturing is the creation of value and the elimination of activities that do not add value to the product in the manufacturing process. The lean model is seen to reduce waste, reduce costs, improve quality and productivity, make better use of resources, and create value for customers. The green manufacturing is designed to reduce negative environmental risks and impacts throughout the product life cycle process, while increasing resource productivity and eliminating environmental waste in the organization. The overlap (synergy) between lean-green manufacturing models consists of the following common attributes: waste and manufacturing process waste reduction or elimination techniques, people and organization, lead time reduction and thus production cycle time reduction, supply chain relationships, KPI: service levels and other specific practices. The main commonality between the two can be found in the target attributes of waste elimination and waste reduction in manufacturing processes. The waste (waste) reduction techniques of the two advanced manufacturing models, lean-green, are often similar, with a focus on operational and production practice processes. Both lean and green manufacturing models look at how to integrate product and process redesign to extend product life, make products easily recyclable and make processes more efficient (i.e., reduce waste). The development and success of improvement projects during the lean-green manufacturing model practices require a high level of employee involvement, encouragement of employee participation and empowerment of responsibility to streamline the realization of lean and green practices. When it comes to supply chain relationships, both models rely on close collaboration with supply chain partners, with collaboration supporting the sharing of information and best practices across the chain to serve the goal of an integrated supply chain.
While the two have much in common, there are also incompatible differences between lean-green. Green manufacturing is now no longer optional for manufacturing companies and by introducing green practices into a lean operating environment will have to make certain trade-offs between multiple objectives that are not entirely compatible. The differences between lean and green practices are: their focus, what is considered waste, customers, product design and manufacturing strategy, end of product lifecycle, KPIs, costs, key tools used, and certain specific practice approaches, for example, replenishment frequency, where lean emphasizes multiple batches and multiple frequencies, whereas there is an inconsistency in green’s emphasis on reducing carbon emissions.
Lean-green manufacturing systems are an emerging area of research in the introduction and implementation of modern advanced manufacturing models in manufacturing enterprises. Therefore, the integration of lean and green manufacturing models is an important part of the sustainable development of enterprises, especially in the context of China’s manufacturing industry, which has become a supporting industry, and there is a need to explore and study the integration of lean and green manufacturing systems in the context of China’s economic development and the current situation of enterprise operations. Lean-green manufacturing’s integrated and collaborative implementation is driven by both endogenous and exogenous factors, which together drive the company to achieve sustainable development. Endogenous lean-green drivers include managers and internal employees. However, to study the synergistic effect generated by the integrated implementation of lean-green manufacturing also requires exogenous driving elements including shareholders, upstream and downstream companies, consumers, competitors, the public, and government agencies, which can be used as four levels for dividing evaluation indicators (or evaluation indicators can be divided into four categories).
The drive intensity evaluation indicators were divided into categories according to the different types of elements in the endogenous and exogenous green drives. It should be especially noted that since these indicators are derived from published research results, their scientific validity and effectiveness have been widely accepted by experts and scholars. These identified evaluation indicators are both scientifically valid and systematically comprehensive. The above factor indicators can be illustrated in
Figure 1.
In today’s highly competitive global environment, business organizations need to improve not only their operational performance but also their eco-efficiency. This has led many scholars to explore the possible merging and convergence of the lean and green paradigms, which in the traditional approach to business organization management practices are often implemented separately and deployed to achieve different corporate strategic goals. Dozens of corresponding papers were found through the corresponding databases (Elsevier, Springer, Emerald, Google Scholar, T&F, Wiley, IEEE, etc.) that delve into the compatibility, synergies, and success key indicator systems between the two. In terms of the search strings, they are specified based on the main topics of the phenomena under investigation. Thus, we searched strings with titles, abstracts, keywords, and articles from January 1997 to 30 September 2022, including (lean green), (lean Industry 4.0), (green Industry 4.0), (lean-green Industry 4.0), (lean environment), (lean environmental), and (lean sustainability). The driver indicators in this thesis are sourced from existing research papers. In the schematic diagram of the classification of driver evaluation indicators shown in
Figure 1, the specific meaning of each evaluation factor indicator is as follows.
2.1. Internal Driving Factors
Managers and enterprises are directly driven by external pressure, or by their own awareness of the management benefits of carrying out lean and green manufacturing, or they can also be driven by the spontaneous actions of internal employees based on their awareness of environmental efficiency and cost of their own economic and environmental interests.
Employee awareness and training (D1): Awareness and acceptance of the Lean-green concept by employees within the company and the company’s training to raise awareness of Lean-green among internal employees [
15,
18,
20,
21,
22,
23].
Senior management awareness and commitment (D2): Awareness and public support from senior management and their commitment to the long-term competitive advantage of lean and green management in the company [
18,
22,
23,
24,
25,
26,
27,
28].
Integrated strategic planning and communication (D3): The extent to which top management incorporates lean manufacturing, green production, and environmental protection into its planning; the degree to which middle and lower-level managers are aware of and support the application of lean-green; and the level of collaboration between corporate departments to advance lean-green management [
15,
19,
23,
24,
25,
26,
27,
28,
29,
30].
Continuous Improvement (D4): Using lean-green tools for continuous improvement to solve internal problems and continuous improvement to eliminate waste, improve efficiency, reduce costs, etc., and lead to business sustainability and reduce the seven major wastes in the lean-green domain [
15,
18,
20,
21,
22,
23,
24,
25,
26,
27,
28].
Business Process Reengineering and Change (D5): Lean and green thinking is a useful strategy for streamlining business operations. Lean and green tools help companies to follow and use globally accepted methods and standards, to promote the streamlining of business processes, and fit the requirements of organizational lean and green change [
15,
18,
19,
26,
27,
28,
29,
30,
31,
32,
33].
Technology Upgrade (D6): Using energy and resource efficient advanced technologies to achieve production technology, equipment performance, and product performance that meet environmental requirements and industry leading levels [
25,
28,
34,
35,
36,
37,
38].
Total employee participation and employee empowerment (D7): Manufacturing companies attempting to build lean and green enterprises need all employees to share responsibility for all business functions, all employees to review and suggest ideas to solve problems that arise in business operations, and companies to motivate and empower employees to carry out lean and green project improvement activities in their daily business activities and provide institutional and financial support [
15,
16,
17,
18,
19,
20,
21,
22,
23,
24,
25,
26,
27,
28,
29,
30,
31,
32,
33,
34,
35,
36,
37,
38,
39,
40,
41,
42,
43,
44,
45,
46,
47,
48].
Organizational Culture (D8): Establish a dynamic company culture that is open to new concepts and management models, and create a good work environment and atmosphere that promotes lean-green initiatives [
31,
35,
45,
48].
2.2. Economic and Market Drivers
Through differentiated “lean-green” competitive strategies, companies can drive cost savings and quickly deliver green products to customers to meet market demand.
Cost savings (D9): Reduce energy and resource consumption, eliminate all work methods that do not add value, and even if the work adds value, the time and resource effort spent does not exceed the minimum threshold [
15,
16,
17,
18,
19,
20,
21,
22,
23,
24,
25,
26,
27,
28,
29,
30,
31,
32,
33,
34,
35,
36,
37,
38,
39,
40,
41,
42,
43,
44,
45,
46,
47,
48,
49,
50,
51].
Competitive advantage (D10): Maintain a competitive advantage in the market through the concept of greening products, while giving the company a competitive advantage by saving costs, optimizing product quality, and responding quickly to customer needs [
15,
16,
17,
18,
19,
20,
21,
22,
23,
24,
25,
26,
27,
28,
29,
30,
31,
32,
33,
34,
35,
36,
37,
38,
39,
40,
41,
42,
43,
44,
45,
46,
47,
48,
49,
50,
51].
2.3. Policy Drivers
The lean and green role of companies is driven by government agencies and several other organizations, mostly through required and industry-specific rules and industry barriers, such as, industry certifications, and through internal incentive systems that promote the active promotion and implementation of lean and green-related strategies, systems and plans by all departments and employees.
Government laws and regulations (D11): Government laws and regulations related to environmental protection, pollution control, landfill tax, emission standards, and other measures required by enterprises [
15,
18,
21,
35,
48].
Professional certified management systems (D12): The adoption, implementation, improvement, and certification of ISO9000 quality management system, ISO14000 environmental management system, OHSAS80000 occupational health and safety management system, and ISO50000 energy management system promote the continuous lean and green direction of the enterprise [
49,
50,
51,
52,
53,
54,
55].
Incentive mechanism (D13): Government agencies reward and punish managers and companies in the industry in which they operate for carrying out green management [
21,
23,
43,
44,
45,
46,
47,
48].
2.4. Consumer and Other Social Stakeholder Drivers
Consumers use their “monetary votes” to drive the lean-green of enterprises through price, responsiveness, and green consumption. By increasing public knowledge, keeping an eye on the government’s environmental management responsibilities, and supporting company greening, the public indirectly drives the greening of companies.
Green brand image (D14): The lean-greening of enterprises is driven by the awareness of building a positive brand image through green products, as well as the positive degree of eco-trademark or brand image of products and the degree of customer recognition of the company’s green trademark [
15,
21,
29,
46,
48,
51,
53].
Public pressure (D15): It includes demands and monitoring from the local community where the company is located, such as partners in the supply chain, shareholders of the company, NGOs, and media [
15,
18,
21,
35,
48,
56,
57].
The effect factor indicators of lean-green drivers on the collaborative implementation of lean-green manufacturing systems in manufacturing enterprises have varying degrees of influence. Therefore, the magnitude of influence, i.e., weight, of each influence factor indicator on the lean-green system will directly affect the overall evaluation results, so it is important to choose the weight calculation method reasonably. AHP, which is highly preferred for its simplicity and flexibility, uses a combination of qualitative and quantitative analysis to construct a two-by-two judgment matrix between each influence factor and calculate the initial weight value of each influence factor.
There may be correlative influence relationships among the impact evaluation indicators of lean-green drivers. Assuming that the 15 indicators in the four categories are kept independent of each other, and do not overlap with each other, then it does not mean that there is no interrelated influence relationship among these indicators. For example, at the internal driver level, if top management has sufficient awareness of the company’s green competitive advantage, and has made commitments to government agencies and the public, then the degree to which green production combined with lean production and environmental protection are included in the planning will increase, and the company’s green management activities will receive sufficient attention and support. Therefore, the awareness and commitment of top management (D2) will have an impact on other factors, such as lean-green integrated strategic planning and communication (D3), continuous improvement (D4), and employee awareness and training (D1). Other indicators’ adoption and the outcomes attained will, in turn, have an impact on top management’s knowledge and commitment. The implementation of other indicators and the results achieved will in turn influence the awareness and commitment of top management (D2), and strengthen the belief and will of top management, forming a virtuous circle that will facilitate the further progress of the company on the road to lean and green. At the same time, there may be a correlative influence relationship between the driving evaluation indicators belonging to different lean-green driving factors. For example, if there is a substantial demand from end users for quick delivery, high quality, and ecologically friendly products, then it may promote a strong willingness of manufacturing companies to establish a good market image of the brand based on green products through the advantages that can be created by lean production. In addition, on the other hand, it may cause sufficient attention and support for lean-green business management activities within the company, so that the formation of a green brand image (D14) at the level of consumer and other social stakeholder drivers can affect the establishment and maintenance of competitive advantage (D10) at the level of economic and market drivers, etc.
In light of the foregoing, the four categories and 15 evaluation indicators used to reflect the relationship between supply-lean-green drive can be thought of as a complex network with intricate correlated influence relationships between elements. The significance effect that an indicator or factor has by connecting other indicators or factors determines the importance of the indicator in a complex network [
58]. The decision laboratory analysis (DEMATEL) method in complex network theory is able to reveal important influencing factors as well as internal constructions by analyzing the logical relationships between factors in the system with the direct influence matrix to calculate the degree of influence, the degree of being influenced, the degree of cause, and centrality of the factor [
59]. Therefore, quantitative evaluation based on the DEMATEL method was used to analyze the lean-green drive intensity evaluation index system.
5. Results, Discussion, and Implications
5.1. Degree of Influence and Degree of Influenced Analysis
Through the comprehensive influence matrix analysis, it can be concluded from
Table 8 that the causal factors (factors with causality degree greater than zero) affecting Lean-green implementation are, in descending order of importance, top management awareness and commitment (D
2), public pressure (D
15), incentives (D
13), professional certification management system (D
12), laws and regulations set by the government (D
11), integrated strategic planning and communication (D
3), Business Process Reengineering and Change (D
5), and Employee Awareness and Training (D
1).
As can be seen from
Figure 2, the awareness and commitment of top management (D
2) has the greatest degree of cause. Therefore, the top management of manufacturing companies must be aware of and committed to making decisions regarding the introduction of lean-green advanced manufacturing models in their organizations if the analysis of the drivers of lean-green implementation in manufacturing companies is to be successful. It can be used to provide continuous attention and resources to support them during the implementation promotion process, and to establish a process change and organizational corporate culture for companies to adapt to Lean-green. This also indicates whether the implementation of a lean-green manufacturing system is valued by the company. The company can be guaranteed to support the lean-green manufacturing system if top management values and supports it in this area and provides adequate financial, human, and policy assistance. Next, public pressure (D
15), incentives (D
13), professional certification management system (D
12), government laws and regulations (D
11), and integrated strategic planning and communication (D
3) are also key drivers. The key factors of public pressure (D
15), incentive mechanism (D
13), and laws and regulations set by the government (D
11) are also the external facilitators of external pressure on companies to respond to external voices of government, society, and informal organizations in order to better expand market share and build green brands and competitive advantages. The professional certification management system (D
12), and integrated strategic planning and communication (D
3) are the internal pressure and action guide and direction for the implementation of lean-green manufacturing system within the company. To adopt internal lean-green measures to accomplish the integration of economic, environmental, and social benefits, the top management set a lean-green strategy as well as certification requirements for each individual management system.
The outcome factors (factors with less than zero cause) are, in descending order of importance: competitive advantage (D10), cost savings (D9), green brand image (D14), continuous improvement (D4), organizational culture (D8), full participation and employee empowerment (D7), and technology upgrades (D6). The outcome factor is the influence of other factors on the implementation of lean-green. So, the root cause can be traced to identify the most primitive influencing factors, so as to realize the smooth, convenient, and profitable implementation of lean-green in the enterprise from the root.
5.2. Centrality and Comprehensive Weighting Analysis
From
Table 8, we can conclude that the importance of centrality in descending order is continuous improvement (D
4), professional certification management system (D
12), top management awareness and commitment (D
2), full participation and employee empowerment (D
7), competitive advantage (D
10), organizational culture (D
8), green brand image (D
14), public pressure (D
15), cost saving (D
9), business process Re-engineering and Change (D
5), Employee Awareness and Training (D
1), Technology Renewal and Upgrading (D
6), Integrated Strategic Planning and Communication (D
3), Incentives (D
13), and Laws and Regulations Established by the Government (D
11).
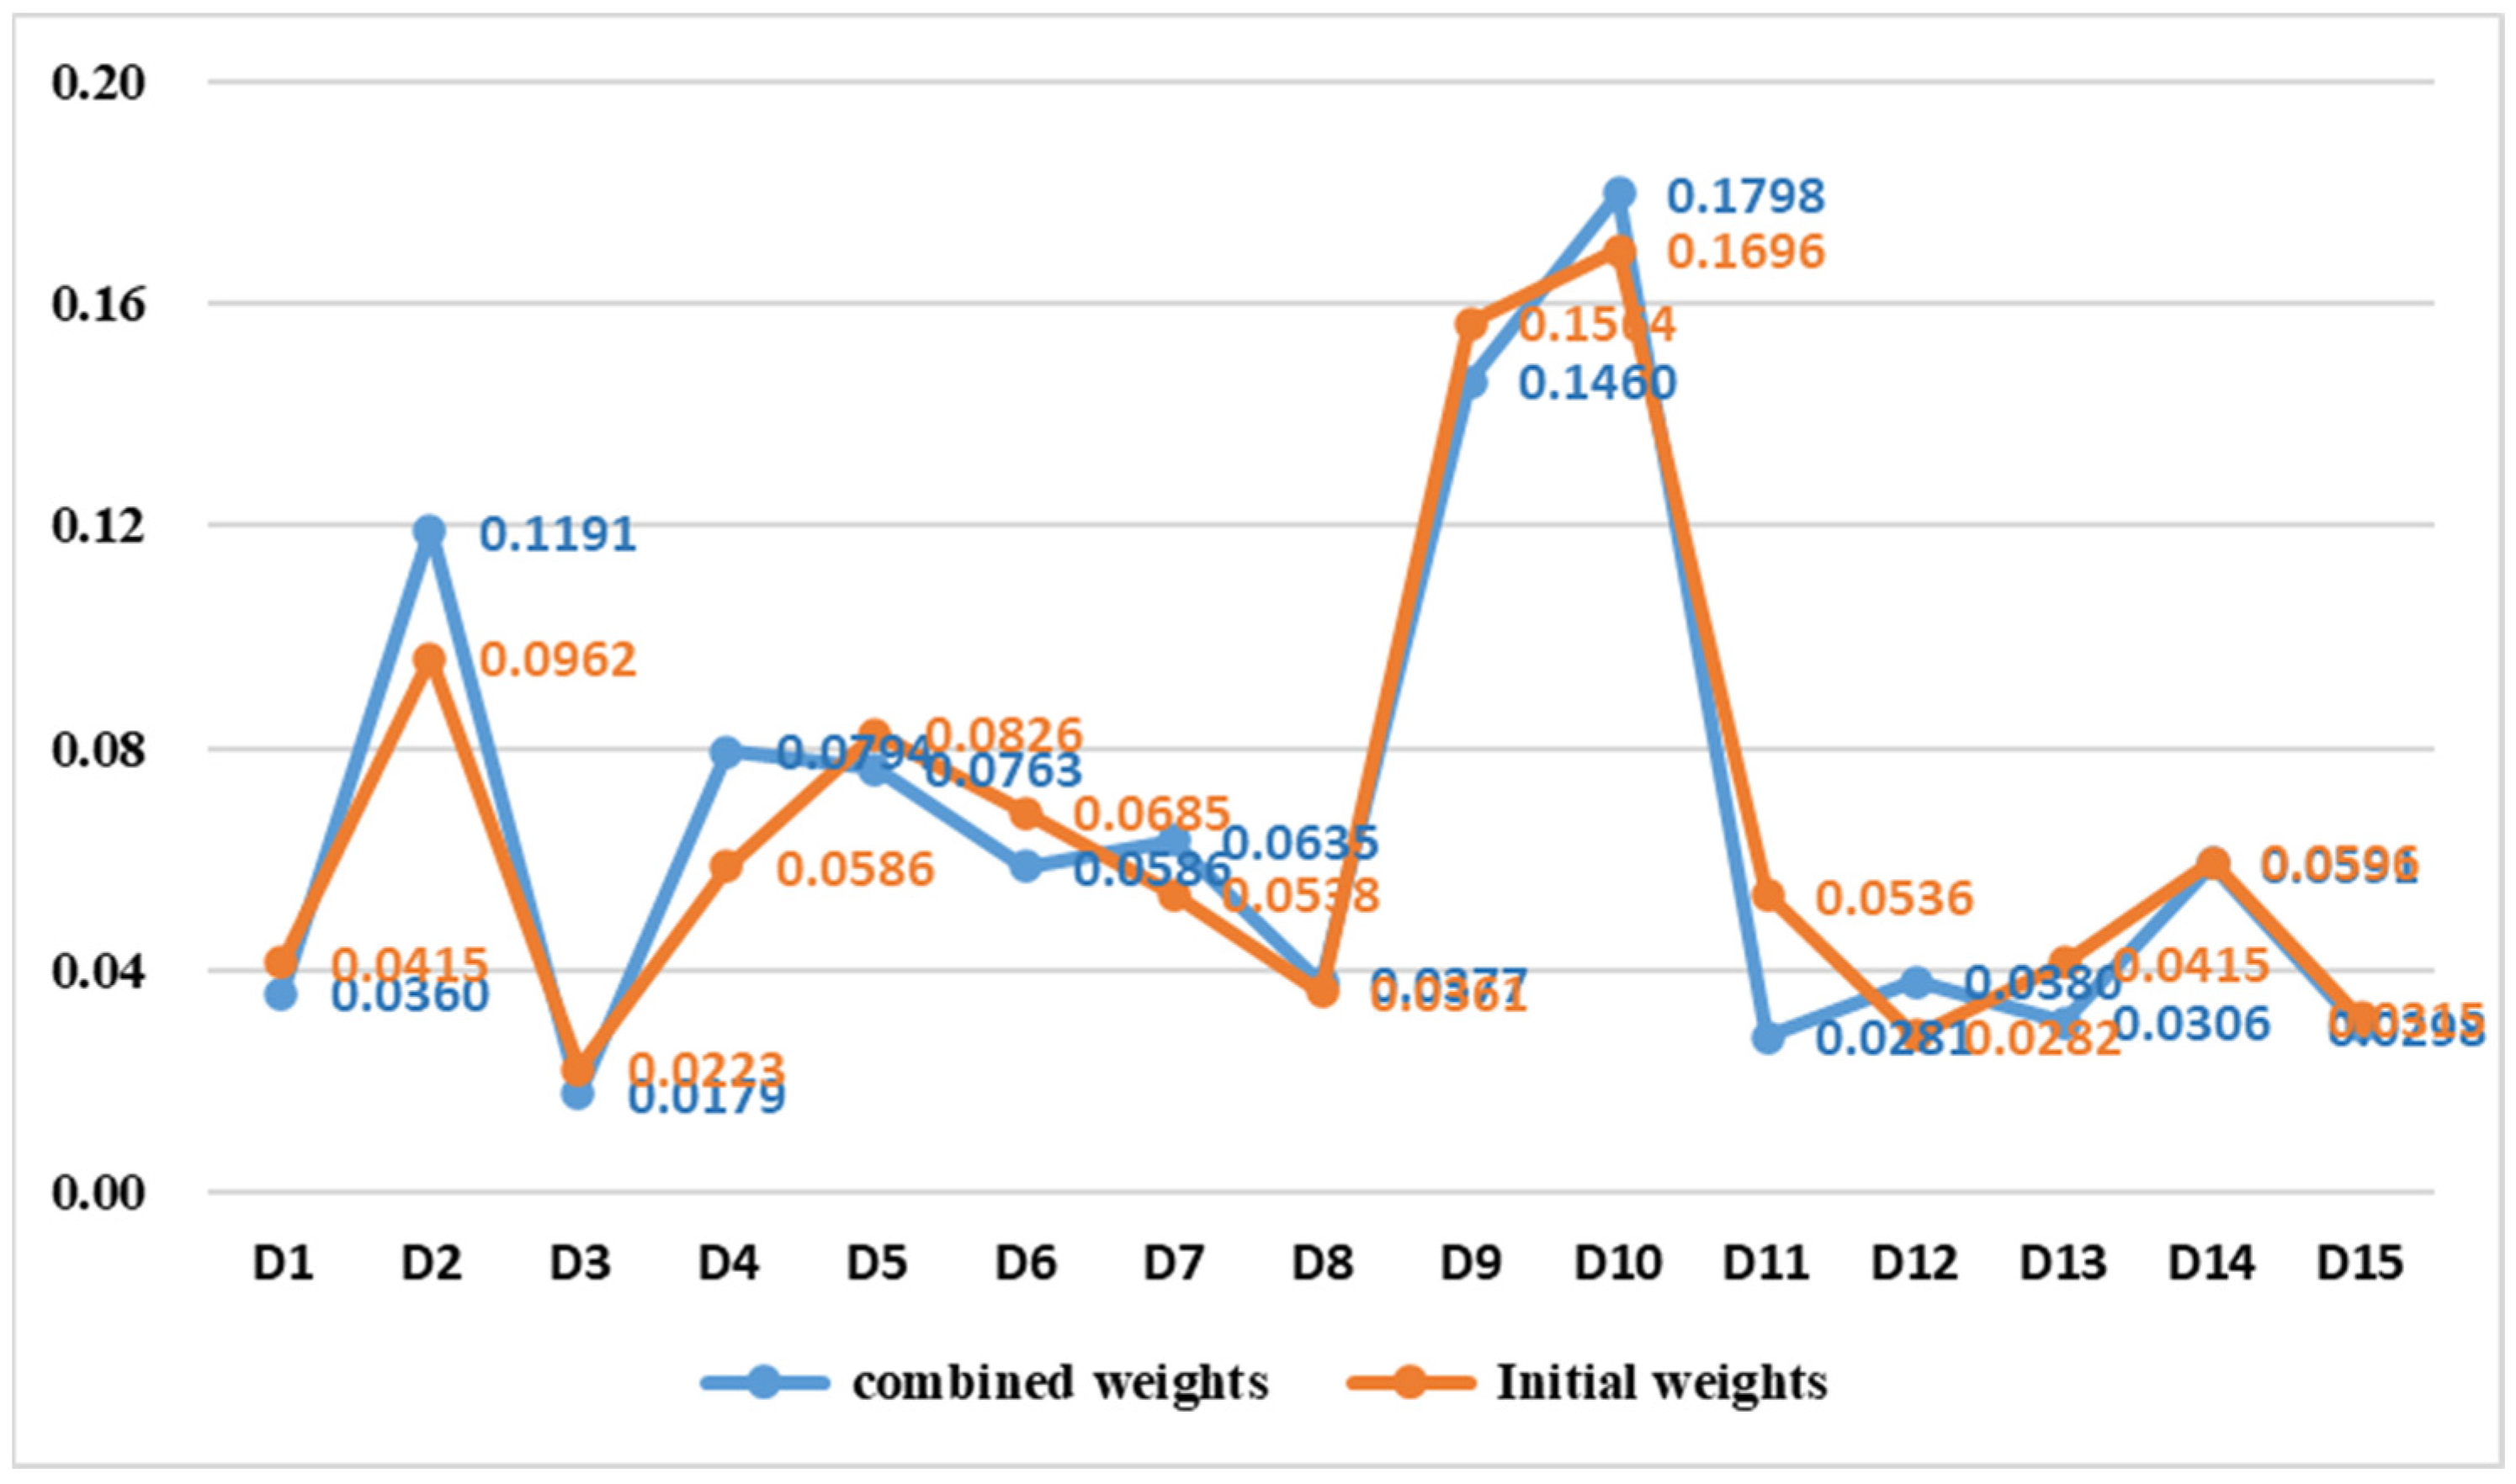
Table 9 and
Figure 4 show the initial weights and centrality of each factor indicator considering the interaction between the internal factors to obtain the combined weight and ranking. It can be seen that competitive advantage (D
10) has the largest weight value of 0.1798, followed by cost savings (D
9) and top management awareness and commitment (D
2) with 0.146 and 0.1191, respectively. Continuous improvement (D
4) also has a large influence, with a weight of 0.08 or more. After considering the correlation, the weight of business process reengineering and change (D
5) increases, and the weight of professional certification management system (D
12) and full participation and employee empowerment (D
7) decreases. Manufacturing businesses operate in a competitive environment, and the market- and economy’s external drivers serve as the initial impetus for implementing various management operation models. Following this, the businesses make internal adjustments to strengthen their competitive position and satisfy external customers’ needs and desires while achieving sustainable business practices.
5.3. Analysis of ISM Results
As can be seen in
Figure 5, the 15 factor indicators are divided into 6 levels, with a clear hierarchy of each influencing factor indicator. The uppermost factor indicators are the direct causes that result in the integration of collaborative lean-green manufacturing systems, and the middle factor indicators are the indirect causes that drive the integrated collaborative lean-green system implementation. The closer to the bottom level indicates that the driving factors are more fundamental. The drivers are more fundamental the closer we get to the bottom. When motivating the contributing drivers, it is important to improve from the fundamental factors to the direct factors, and to change and motivate the intermediate factors to facilitate the positive cycle of lean-green manufacturing system integration and collaboration.
Therefore, the following points are primarily focused on in order to determine whether the implementation of a lean-green manufacturing system in manufacturing enterprises can be successful and obtain the necessary economic, environmental, and social benefits: (1) Continuous improvement in internal processes, the elimination of all consumption, the conservation of raw materials and energy, among other things, are necessary for the adoption of lean-green in manufacturing enterprises to be successful. This is also used to reduce costs, improve quality, and increase efficiency while achieving more green products. (2) Manufacturing enterprises to implement lean-green measures within the enterprise, should introduce ISO9000 quality management system, ISO14000 environmental management system, OHSAS80000 occupational health and safety management system, and ISO50000 energy management system as far as possible. The implementation and use of these management systems may unintentionally or intentionally give the impression that the business is going green. (3) The support of top management plays a very important role in the introduction and implementation of lean and green management models. The establishment of a lean and green organizational culture can be a champion and a model, thus promoting sustainable development. (4) For government agencies, to give full play to the incentive-driven role of government agencies, the focus of policy incentives should be on managers.
5.4. Conclusions
From the perspective of stakeholders, this paper studies the driving factors of collaborative Integration implementation of lean-green manufacturing system in the context of Industry 4.0. Through literature analysis, the lean-green manufacturing integrated and collaborative implementation drivers are identified as being composed of endogenous and exogenous factors that come together to drive a manufacturing company towards sustainability. The 15 factor indicators identified are derived from published research papers and other results, and their scientific validity and effectiveness have been widely accepted by experts and scholars as the drivers for the integrated and collaborative implementation of lean-green manufacturing systems in Chinese manufacturing companies. The 15 drivers include endogenous lean green drivers including managers and internal staff, and exogenous drivers including shareholders, upstream and downstream companies, consumers, competitors, the public and government agencies, which are divided into four levels of evaluation indicators.
In order to identify the most critical drivers, the relationships between indicators and the structure of the indicator system are analyzed using fuzzy AHP-DEMATEL-ISM, the hierarchy of the complex network constituted by the indicator system is divided, the importance of the indicators is analyzed from a global perspective of the network, and the important factors and major factors influencing the driving lean green system are analyzed. The factors at the bottom of the hierarchy are the awareness and commitment of top management (D2) and public pressure (D15). The factors at the bottom of the hierarchy influence the other hierarchies through direct and indirect transmission, and are the essential causes of the integrated implementation of lean-green manufacturing systems in Chinese manufacturing enterprises. This is influenced by employee awareness and training (D1), integrated strategic planning and communication (D3), government regulations (D11), professional certification management systems (D12) and incentives (D13). The two middle layers are the deep causal layers, which are based on continuous improvement (D4) and have a complex relationship between other factors and this base, so that if there is a change, it can be passed on quickly, triggering a series of changes and linking to the transitional causal factors at the higher levels through the base factors, thus achieving a coupling of endogenous and exogenous factors. Green brand image (D14) and cost savings (D9) are transitional drivers, influenced by numerous other indirect factors, necessary for deeper drivers to act on top-level factors, potential influencers of system drivers that cannot be ignored, and the basis for top-level direct drivers. The top-level factor indicator Competitive Advantage (D10) is the direct inducement driver for manufacturing companies to implement a lean-green manufacturing system, the proximate causal factor, and the factor with the largest combined weighting, and the key to achieving sustainable business.
The causal relationships of the 15 driver indicators for the integrated implementation of lean-green manufacturing systems in Chinese manufacturing companies can be explained and illustrated by the explanatory structural progressive order model diagram in
Figure 5. The driver indicator system can be divided into six tiers, the structure of which is related to the characteristics of the factors. The drivers are located in the lower two tiers of the hierarchy and are the deeper causal factors of the driver indicator system, driving the other factors. The indicators with high correlation to other factors are located in the middle level of the skeleton diagram, they come out to be closely related to each other, and also carry on the top and bottom to link the factors indicators to form an interlinked system. Top-level factors largely influence the key to the implementation of lean-green manufacturing systems in manufacturing companies, directly affecting the drive, firmness, and sustainability of the driving system from economic, social and environmental aspects.
5.5. Managerial Implications
In conclusion, the cornerstone and secret to sustainable business in a worldwide economy is for manufacturing enterprises to generate a green brand image and their own distinct competitive advantage. However, the integrated and collaborative implementation of a lean-green manufacturing system within a manufacturing company is the result of a combination of external stakeholders, such as internal and external consumers and government, especially external public pressure (consumers) that further drives the determination and will of managers within the company. The fuzzy AHP-DEMATEL-ISM analysis method is constructed to explore the internal linkage of the drivers of integrated and collaborative implementation of lean-green system and to clearly obtain the weights, hierarchy, and influence paths where the key factors are located. This allows for a thorough and scientific analysis of the drivers of integrated and collaborative implementation of lean-green manufacturing systems. This method provides a new analysis idea for the causal analysis of similar responsible system events. Although the method still has some subjectivity, but it is still an effective method for analyzing the drivers of integrated collaborative implementation of lean-green manufacturing systems. For example, in order to describe the relationship between the factors as non-independent and correlated at a later stage in the research process, the ANP method can be used instead of the AHP method. Moreover, in order to classify the system of driving indicators, the Cluster Analysis method can be used to manage the classification. There are input class indicators and output class indicators in the driving indicators, which can be analyzed using Data Envelopment Analysis in order to the relative validity of a particular unit. Moreover, in order to rank the indicator system, TOPSIS or VIKOR methods can be used. These multi-criteria decision tools can be used individually or in combination. The combined use of these methods allows for more scientific, verifiable, and robust research results.
However, this research project can also identify the root causes that drive the synergistic implementation of lean-green manufacturing system integration from other methods, which will lead to better solutions. In addition, more research is required to complete and further validate the elements that drive the synergistic deployment of lean-green manufacturing systems as this project is still at the preliminary level of quantitative research. Further validation is also needed for different industrial environments, such as process industries, and especially across industries, such as service industries. Moreover, the analytical approach will be extended to other areas, such as improving energy efficiency and reducing water consumption. More research is therefore needed to show that the metrics system driving the integrated and collaborative implementation of lean-green manufacturing systems can be applied across the entire product lifecycle and across all economic activities. In the future, similar studies can be conducted in other developing economies, such as Southeast Asia and India. The structural equation modeling approach can be used to validate the results. In addition, a nonlinear approach with artificial neural networks can also be used. In order to effectively adopt lean-green systems under smart manufacturing in manufacturing companies in China, research on people and other corresponding role factors is needed.


