Article

Thiourea Derivative Metal Complexes: Spectroscopic, Anti-Microbial Evaluation, ADMET, Toxicity, and Molecular Docking Studies

by
Ahmed T. F. Al-Halbosy
1,
Adnan A. Hamada
1,
Ahmed S. Faihan
1,
Abdulrahman M. Saleh
2,
Tarek A. Yousef
3,4,*,
Mortaga M. Abou-Krisha
3,5,
Mona H. Alhalafi
6 and
Ahmed S. M. Al-Janabi
1,*
1
Department of Chemistry, College of Science, Tikrit University, Tikrit 34001, Iraq
2
Pharmaceutical Medicinal Chemistry & Drug Design Department, Faculty of Pharmacy, Al-Azhar University, Cairo 11884, Egypt
3
College of Science, Chemistry Department, Imam Mohammad Ibn Saud Islamic University, Riyadh 11623, Saudi Arabia
4
Department of Toxic and Narcotic Drug, Forensic Medicine, Mansoura Laboratory, Medicolegal Organization, Ministry of Justice, Cairo 11435, Egypt
5
Department of Chemistry, South Valley University, Qena 83523, Egypt
6
Department of Chemistry, College of Science Al-Zulfi, Majmaah University, Al-Majmaah 11952, Saudi Arabia
*
Authors to whom correspondence should be addressed.
Inorganics 2023, 11(10), 390; https://doi.org/10.3390/inorganics11100390
Submission received: 21 August 2023 / Revised: 20 September 2023 / Accepted: 25 September 2023 / Published: 30 September 2023

Abstract

:
The treatment of N-Phenylmorpholine-4-carbothioamide (HPMCT) with bivalent metal ions in a 2:1 mol ratio without a base present affords [MCl2(κ1S-HPMCT)2] {M = Cu(1), Pd(2), Pt(3), and Hg(4)} in a good yield. Furthermore, the reaction of two equivalents of HPMCT and one equivalent of bivalent metal ions in the presence of Et3N has afforded [M(κ2S,N-PMCT)2] {M = Ni(5), Cu(6), Pd(7), Pt(8), Zn(9), Cd(10), and Hg(11)}. Infrared, 1H, 13C Nuclear Magnetic Resonance molar conductivity, and elemental analysis were used to characterize the synthesized complexes. The results suggest that HPMCT is bonded as monodentate via an S atom in Complexes (14), whereas linkage as a bidentate chelating ligand via S and N atoms gives two chelate rings. Moreover, the synthesized ligand and the complexes were screened for antibacterial activity, which displayed that the very best antibacterial activities for Complexes (1), (6), and (3). In addition, the cytotoxic activity of the HPMCT ligand, [PdCl2(HPMCT)2] (2), and [PtCl2(HPMCT)2] (3) were screened on breast cancer cell lines (MCF-7), and Complex (3) reveals the most promising activity with an IC50 value 12.72 ± 0.4 μM. Using the B3LYP method and 6-311++G(d,p) basis sets for the ligand and the SDD basis set for the central metal, the synthesized complexes utilizing the prepared ligand were optimized. Various quantum parameters such as hardness, electron affinity, dipole moment, vibrational frequencies, and ionization energy for the ligand and its complexes have been calculated. In general, a favorable agreement was found between the experimental results and the obtained theoretical results.

1. Introduction

In the previous 50 years, thioureas, an important ligand, have received a lot of attention. Their multi-donor sites have contributed to their coordination chemistry. The literature is well-versed in the coordination chemistry of thioureas and their derivatives [1,2,3,4,5,6,7]. Different coordination possibilities may arise from attaching various groups to the thiouredio moiety (Figure 1I–VI). Thioureas can be coordinated through their S atom as a neutral monodentate mode [8] or anionic monodentate mode [9]. They can also be coordinated through both of their N, S donor atoms in a bidentate mode [10]. Moreover, thioureas with a multi-dentate mode have also been reported including an M-M bridging mode (Figure 1) [11]. Due to these interesting coordination behaviors, thioureas have been reported to participate in various fields such as organo-catalysts, anticorrosion, and synthesis of bio-molecule [12,13,14,15,16].
Even though N-Phenylmorpholine-4-carbothioamide (HPMCT) was reported and its X-ray structure was determined [17], only a few examples of its metal complexes have been reported. For instance, Yuen et al. have reported the synthesis of mixed ligand complexes of Ni derived from HPMCT and dppe [18]. To the best of our knowledge, this ligand has not been well-represented in the literature. We therefore sought to expand on this work by using various metal ions and examining their biological and quantum characteristics. Herein, we report a series of divalent metal complexes (MII = Ni, Cu, Pd, Pt, Zn, Cd, and Hg) derived from HPMCT, studying their quantum and biological applications.

2. Results and Discussion
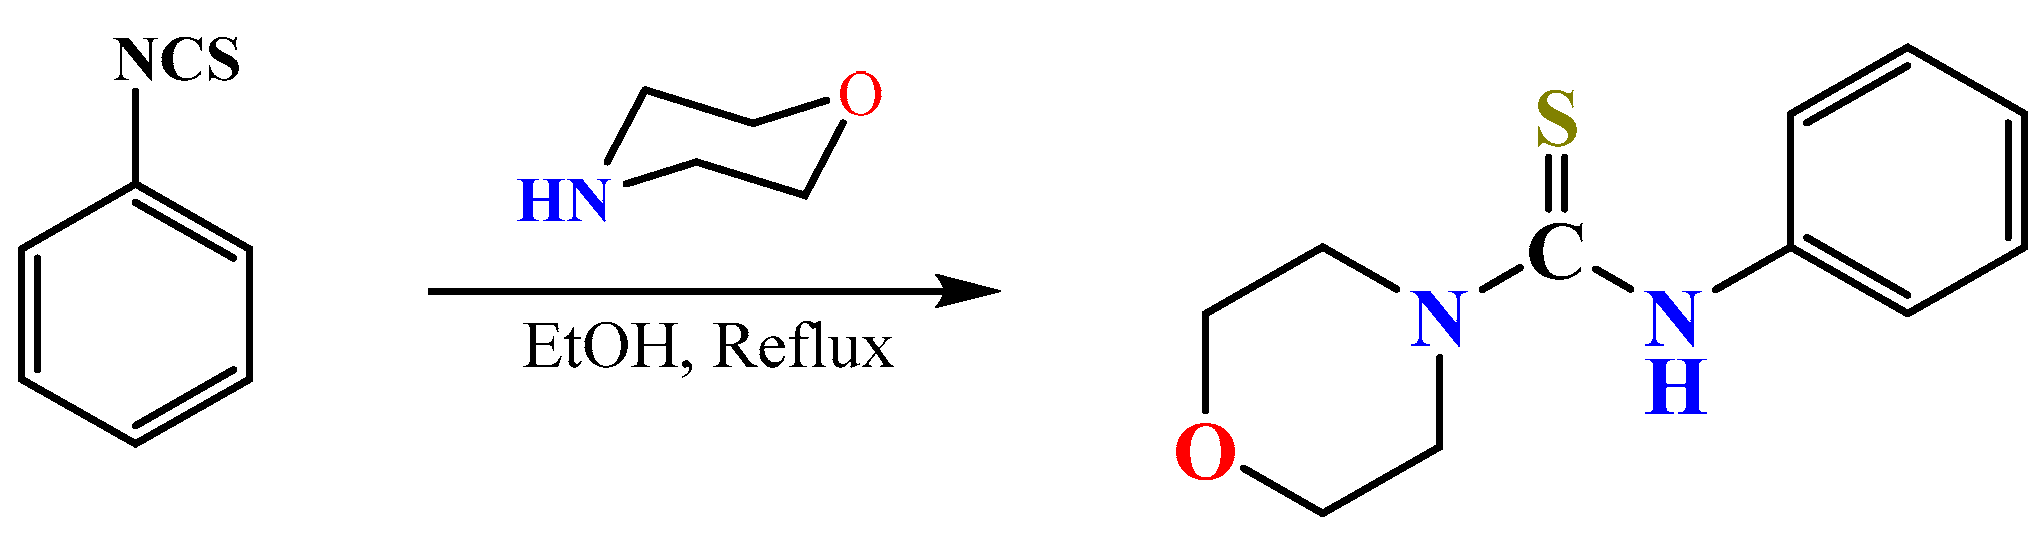
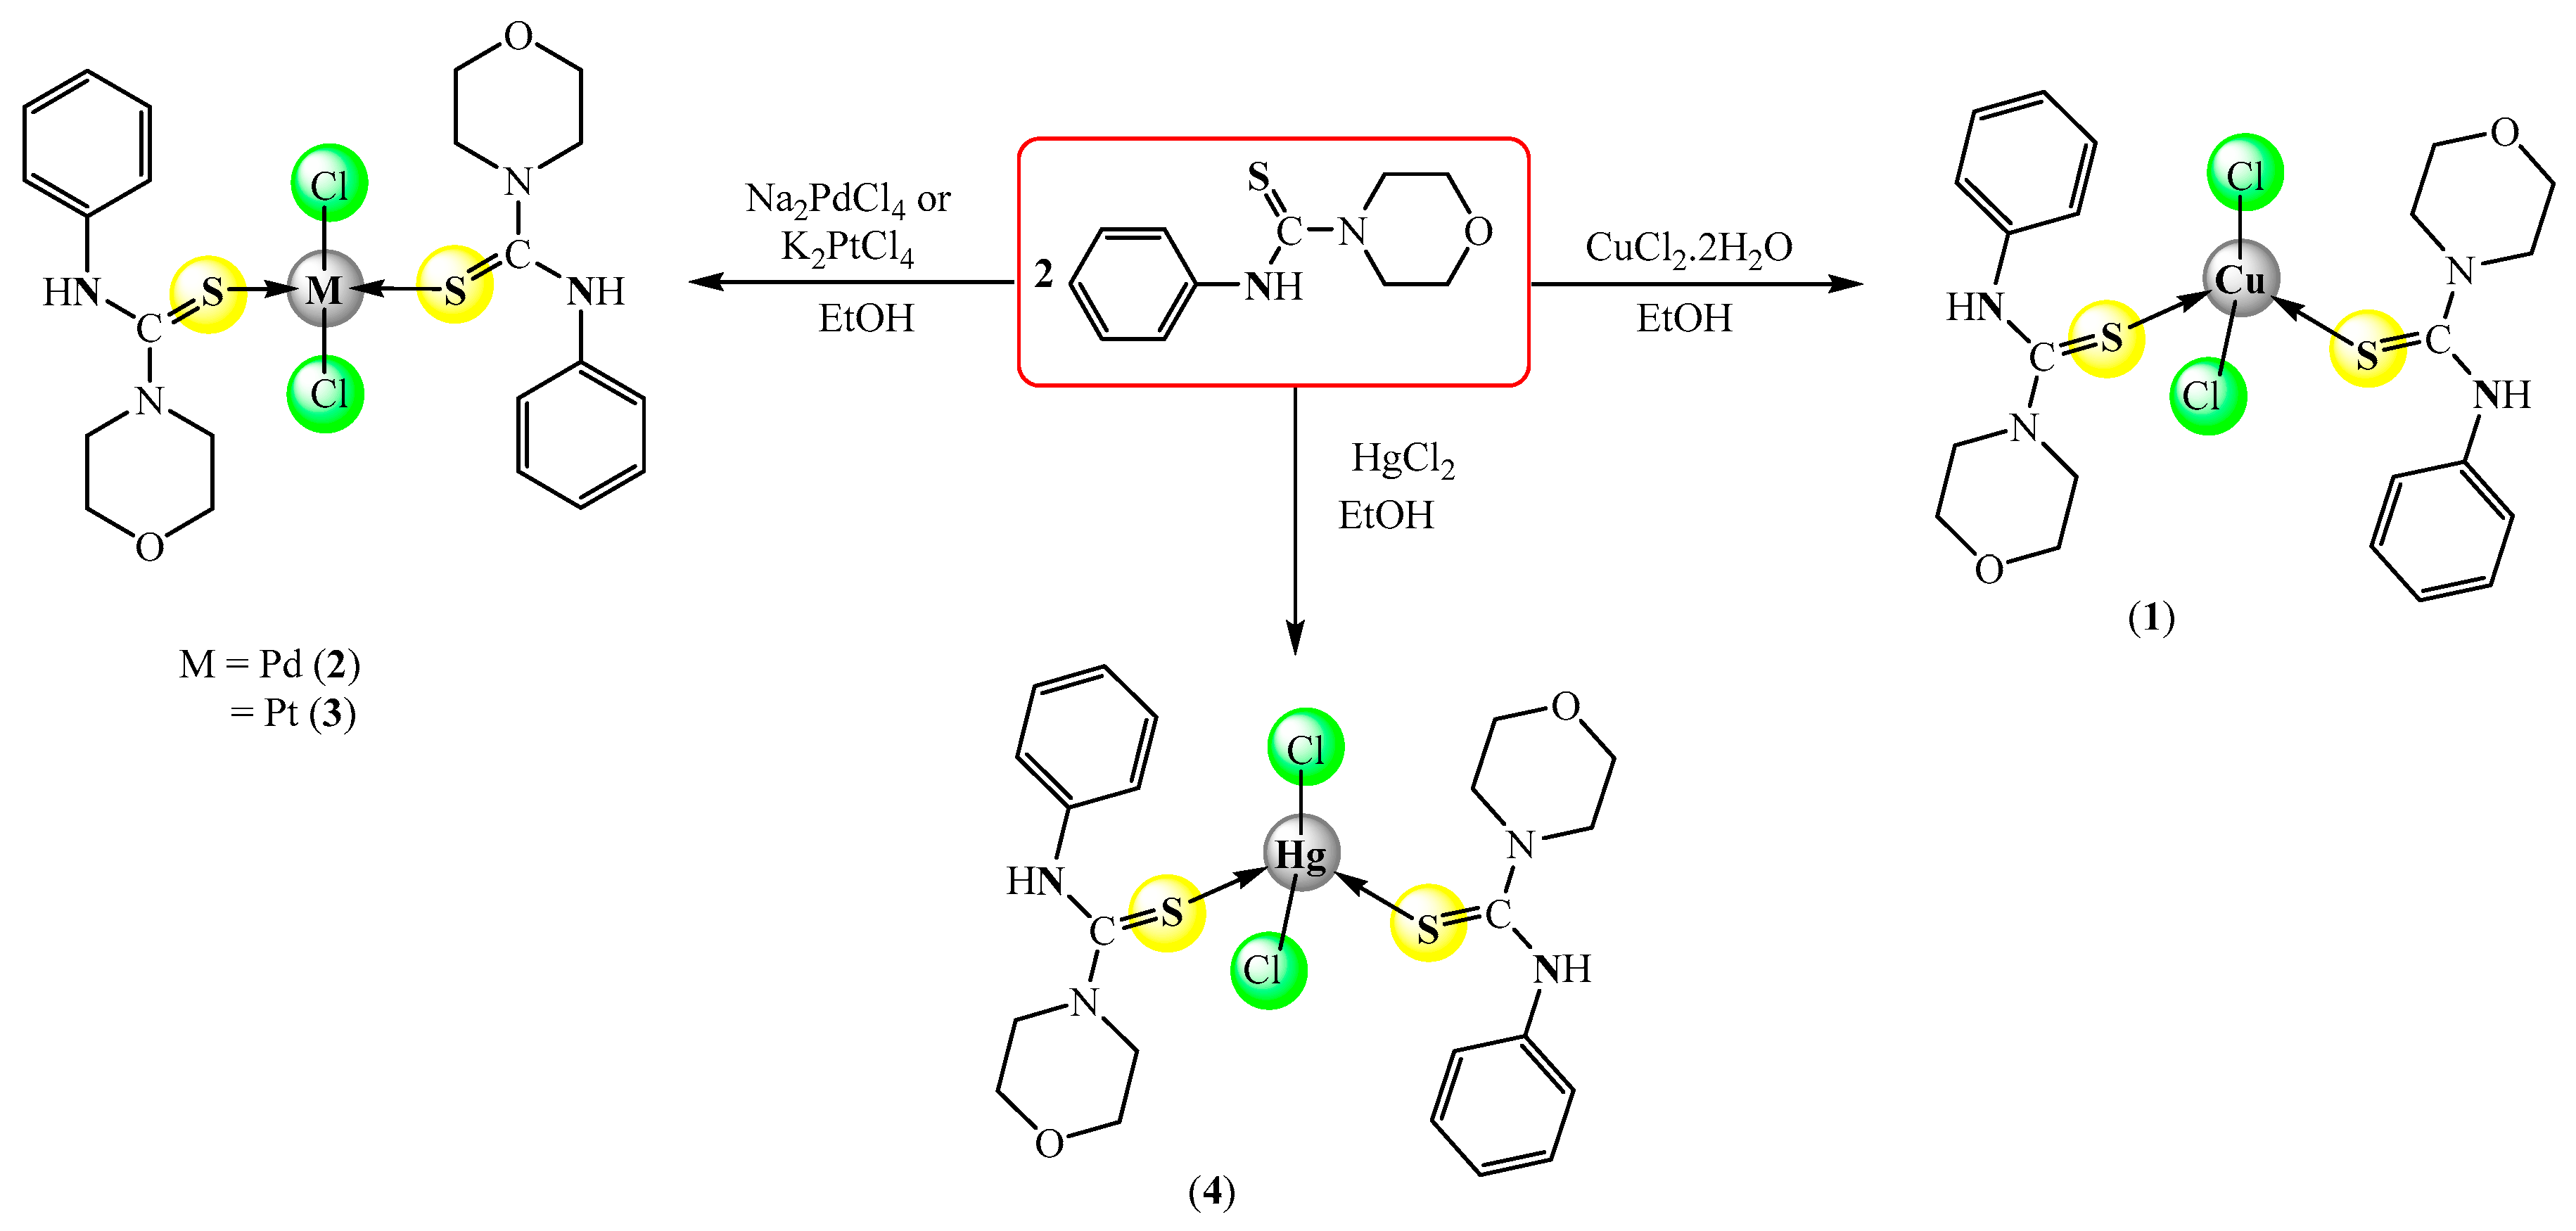
2.1. Synthesis

The ligand HPMCT was synthesized by following a modified literature method [19] (Scheme 1). The reaction of morpholine with phenylisothiocyanate in an equal ratio gave the desired ligand as a white solid in a high yield 90% yield.
Reaction of the thiourea derivative (HPMCT) ligand with inorganic salts {CuCl2·2H2O, Na2PdCl4, K2PdCl4 and HgCl2} in EtOH as a solvent afforded [MCl2(κ1S- HPMCT)2] {MII = Cu(1), Pd(2), Pt(3), and Hg(4)} in a high yield (73 and 95)% (Scheme 2).
The treatment of two moles of the N-Phenylmorpholine-4-carbothioamide ligand with one mole of {NiCl2·6H2O, CuCl2·2H2O, Na2PdCl4, K2PdCl4, ZnCl2, Cd(NO3)2·2H2O, and HgCl2 } in a basic medium afforded complexes of the type [M(κ2S,N-PMCT)2] {MII = Ni(5), Cu(6), Pd(7), Pt(8), Zn(9), Cd(10), and Hg(11)}. The reactions were carried out at room temperature in ethanol and distilled water. All complexes were obtained in good yields (range 67–91%) (Scheme 3).
The synthesized HPMCT ligand and its complexes [MCl2(κ1S-HPMCT)2] {MII = Cu(1), Pd(2), Pt(3), and Hg(4)} and [M(κ2S,N-PMCT)2] {MII = Ni(5), Cu(6), Pd(7), Pt(8), Zn(9), Cd(10), and Hg(11)} are stable and readily soluble in DMF and DMSO. The analytical data of the HPMCT and its complexes are listed in Table 1. With the help of FT-IR, 1H- and 13C NMR spectroscopic techniques, conductivity measurements, and CHN analysis, the structure of the complexes has been studied further. The nanostructures of the synthesized HPMCT ligand and its complexes were studied by XRD and SEM techniques. The complexes (111) prepared in DMSO solvent at 10−3 M (3–19) Ω−1 cm−1 mol−1 showed that the complexes are non-electrolytes in data obtained from conductivity measurements [20]. The CHN analysis agreed with the suggested structures of the prepared compounds.

2.2. Spectroscopic Data

IR Spectra

IR spectroscopic data of HPMCT and its complexes are measured within the 400–4000 cm−1 range using a KBr disc (Table 2 and Figures S1–S11). A comparison of free HPMCT and its complexes designated the bond of the relevant ligand with ions via the S atom as monodentate or through S, N atoms in a bidentate fashion. Through the coordination, certain changes such as increases or decreases in frequency corresponding to NH, CH aliphatic, CH aromatic, CS, and NCN bonds could be expected [21].
The IR spectrum of the HPMCT ligand (Figure S1) showed an NH peak at 3176 cm−1; this band was found in the range (3174–3336) cm−1 for Complexes (14). The νCS stretching frequency for HPMCT was shown at 707 cm−1; this band was shifted towards the lower side (11–42) cm−1. This indicates that the HPMCT ligand was bonded to ions through the sulfur atom [1,2,13,19]. The νC-N band displayed within (1269–1303) cm−1; this band was shifted to higher frequencies indicating the flow of electron density through the C=S bond towards the metal ion further strengthening the bond in the N-C-N fragment. A strong to medium band is shown in the IR spectra of the complexes within the (1022–1031) cm−1 range assigned to the ν(C-O); the slight shift of this band compared with that of the free ligand indicates that the C-O group does not participate in bonding. The IR spectra of Complexes (511) exhibited the absence of the stretching vibration of υ(NH), which appeared at 3176 cm−1 in the free ligand; this indicates the formation of the proposed complexes. And the frequency of CS stretching appeared within the (665–696) cm−1 range and shifted to a high frequency in the CN stretching frequency which appeared within (1265–1274) cm−1, indicating that the ligand is coordinated to center ions through sulfur and nitrogen atoms as a bidentate chelating mode [1,2,13,19].

2.3. NMR Spectra

The 1H and 13C NMR spectra of the prepared complexes (Figures S12–S22) showed many sets of peaks for the same functional groups. Some of these ligand groupings are disappearing or are more negatively impacted than others. We also took the NMR spectra of the free HPMCT ligand and its complexes to assign resonance signals more precisely. For ease of comparison, Table 3 and Table 4 list the chemical shifts of the groups that are more susceptible to changes in the chemical environment (Table 3 and Table 4).
The 1H nmr spectrum of the free ligand showed four separated signals which represent four different proton groups in the ligand structure, and a singlet peak at δ9.29 ppm due to the proton of the NH group, while the methylene protons of the morpholine ring were displayed as two triplet peaks at δ3.84 ppm and δ3.61 ppm, whereas the phenyl protons exhibit as a multiplet within the δ7.04–7.28 ppm range.
The 13C-NMR spectrum of the HPMCT ligand is in good agreement with the suggested structure, since HPMCT has seven different types of carbon atoms (see Figure S20). The significant peaks in the 13C NMR spectrum are the carbon peaks of the C=S group at δ182.35 ppm and the methylene groups of the morpholine ring at δ66.30 ppm and δ48.96 ppm [19]. Other chemical shifts are listed in Table 4.
In Complexes (24), the 1H NMR spectra contain NH signals at δ10.28 ppm (2), δ9.59 ppm (3), and δ10.37 ppm (4). It is worth noting that the chemical shifts of the proton of the NH group were shifted to a high chemical shift compared with the free ligand, suggesting increased electron density on this proton and that coordination happened through the sulfur atom of the thiocarbonyl group. This NH peak disappeared in the spectra of Complexes (5, 711) which supports the existence of ligands in a deprotonated form on complexation. All spectra of Complexes (25, 711) displayed two triplet peaks, with the first peak at δ3.56–3.92 ppm (approx. J = 8.00 Hz) corresponding to four protons assigned to the protons of the methylene groups of morpholine (O-CH2). The second triplet peak at δ3.38–3.75 ppm (approx. J = 8.00 Hz) corresponding to four protons was assigned to the protons of the second methylene groups of morpholine (N-CH2). In addition, the aromatic protons of Complexes (25, 711) appear in the range of 6.87–7.81 ppm.
The above results were supported by the 13C NMR spectra which showed low-frequency peaks at δ174.80–177.31 ppm. These recorded shifts reflected a down-field shift of about 6 ppm from the free thiourea ligand, suggesting decreased electron density on the thiocarbonyl carbon and that the coordination happened through the sulfur atom. In a similar view, the chemical shift of the methylene group (NCH2) was increased upon being coordinated with metal ions, which showed at δ50.52–50.61 ppm. Other chemical shifts are listed in Table 4.

2.4. XRD and SEM Data

The XRD pattern of Complexes (6) and (7) (Figure 2C,D) displayed sharp peaks within the 10–45° range which demonstrate that the complexes are well crystalline, whereas in the XRD spectra of Complexes (1), (5), and (10) (Figure 2A,B,E), wide peaks and non-regular spectra indicated that these complexes indicated a low crystallinity and the presence of an amorphous phase. Depending on the Scherrer equation [22], the average particle size of complexes was recorded for the highest five peaks and the obtained results verify that the calculated particle size was within the range of 2.68–49.93 nm, and the average particle size was equal to 29.26 nm, 23.95 nm, 25.48 nm, 32.06 nm, and 24.70 nm in Complexes (1), (5), (6), (7), and (10), respectively.
The SEM images of Complex (1) (Figure 3a) showed fused irregular shapes with each other at different nano-scale sizes within 87–103 nm, whereas the SEM images of Complexes (5) and (7) (Figure 3b,d) appeared as nano-rods with different nano-scale sizes within 12–104 nm. Also, Complex (5) contains nano-sheets distributed between the nano-rods.
Complex (6) in SEM images (Figure 3c) was displayed as nano-sheets within 40–98 nm, while the thickness of the nano-sheets was within 9–11 nm.
Finally, Complex (10) appeared in SEM images (Figure 3e) as nanostructures like wool with small nano-scale sizes within 2–3 nm. Also, the image contained irregular structures distributed on the complex surface with different nano-scale sizes within 95–105 nm.

2.5. Biological Studies

In view of the importance of thiourea or derivatives in the medical field and their vital efficacy towards many bacteria or fungi and their important role having a good activity against many types of cancer cell lines [23], we have decided to study the effectiveness of the HPMCT ligand and its complexes as antibacterial against three pathogenic bacteria and cytotoxicity activity against the MCF-7 cell lines.

2.5.1. Antibacterial Activity

The biological activity of the HPMCT ligand and its complexes was evaluated against three types of bacteria (Escherichia coli, Staphylococcus aurous, and Klebsiella pneumoniae) at a 10−3 M concentration and the results were compared with tetracycline as a positive control and DMSO solvent as a negative control. The DIZ (mm) of the obtained results is shown in Figure 4.
Apart from the ligand (HPMCT), all of the compounds demonstrated strong antibacterial action against harmful bacteria, suggesting their potential for development. These compounds have not, however, surpassed the ordinary tetracycline’s antibacterial effectiveness. The Cu(II) (1 and 6) and Pt(II) (3 and 8) complexes have also been found to be particularly effective at inhibiting the chosen microorganisms. On the other hand, the sequence of complexes in terms of inhibition was as follows:
1 > 6 > 3 > 8 > 2 > 9 > 5 > 7 > HPMCT
All complexes displayed a good activity against E. coli in comparison with other two species when compared against the tetracycline standard (Figure 4). Thus, from the above study, it was concluded that these synthesized compounds may be targeted as antibacterial agents for further investigations.

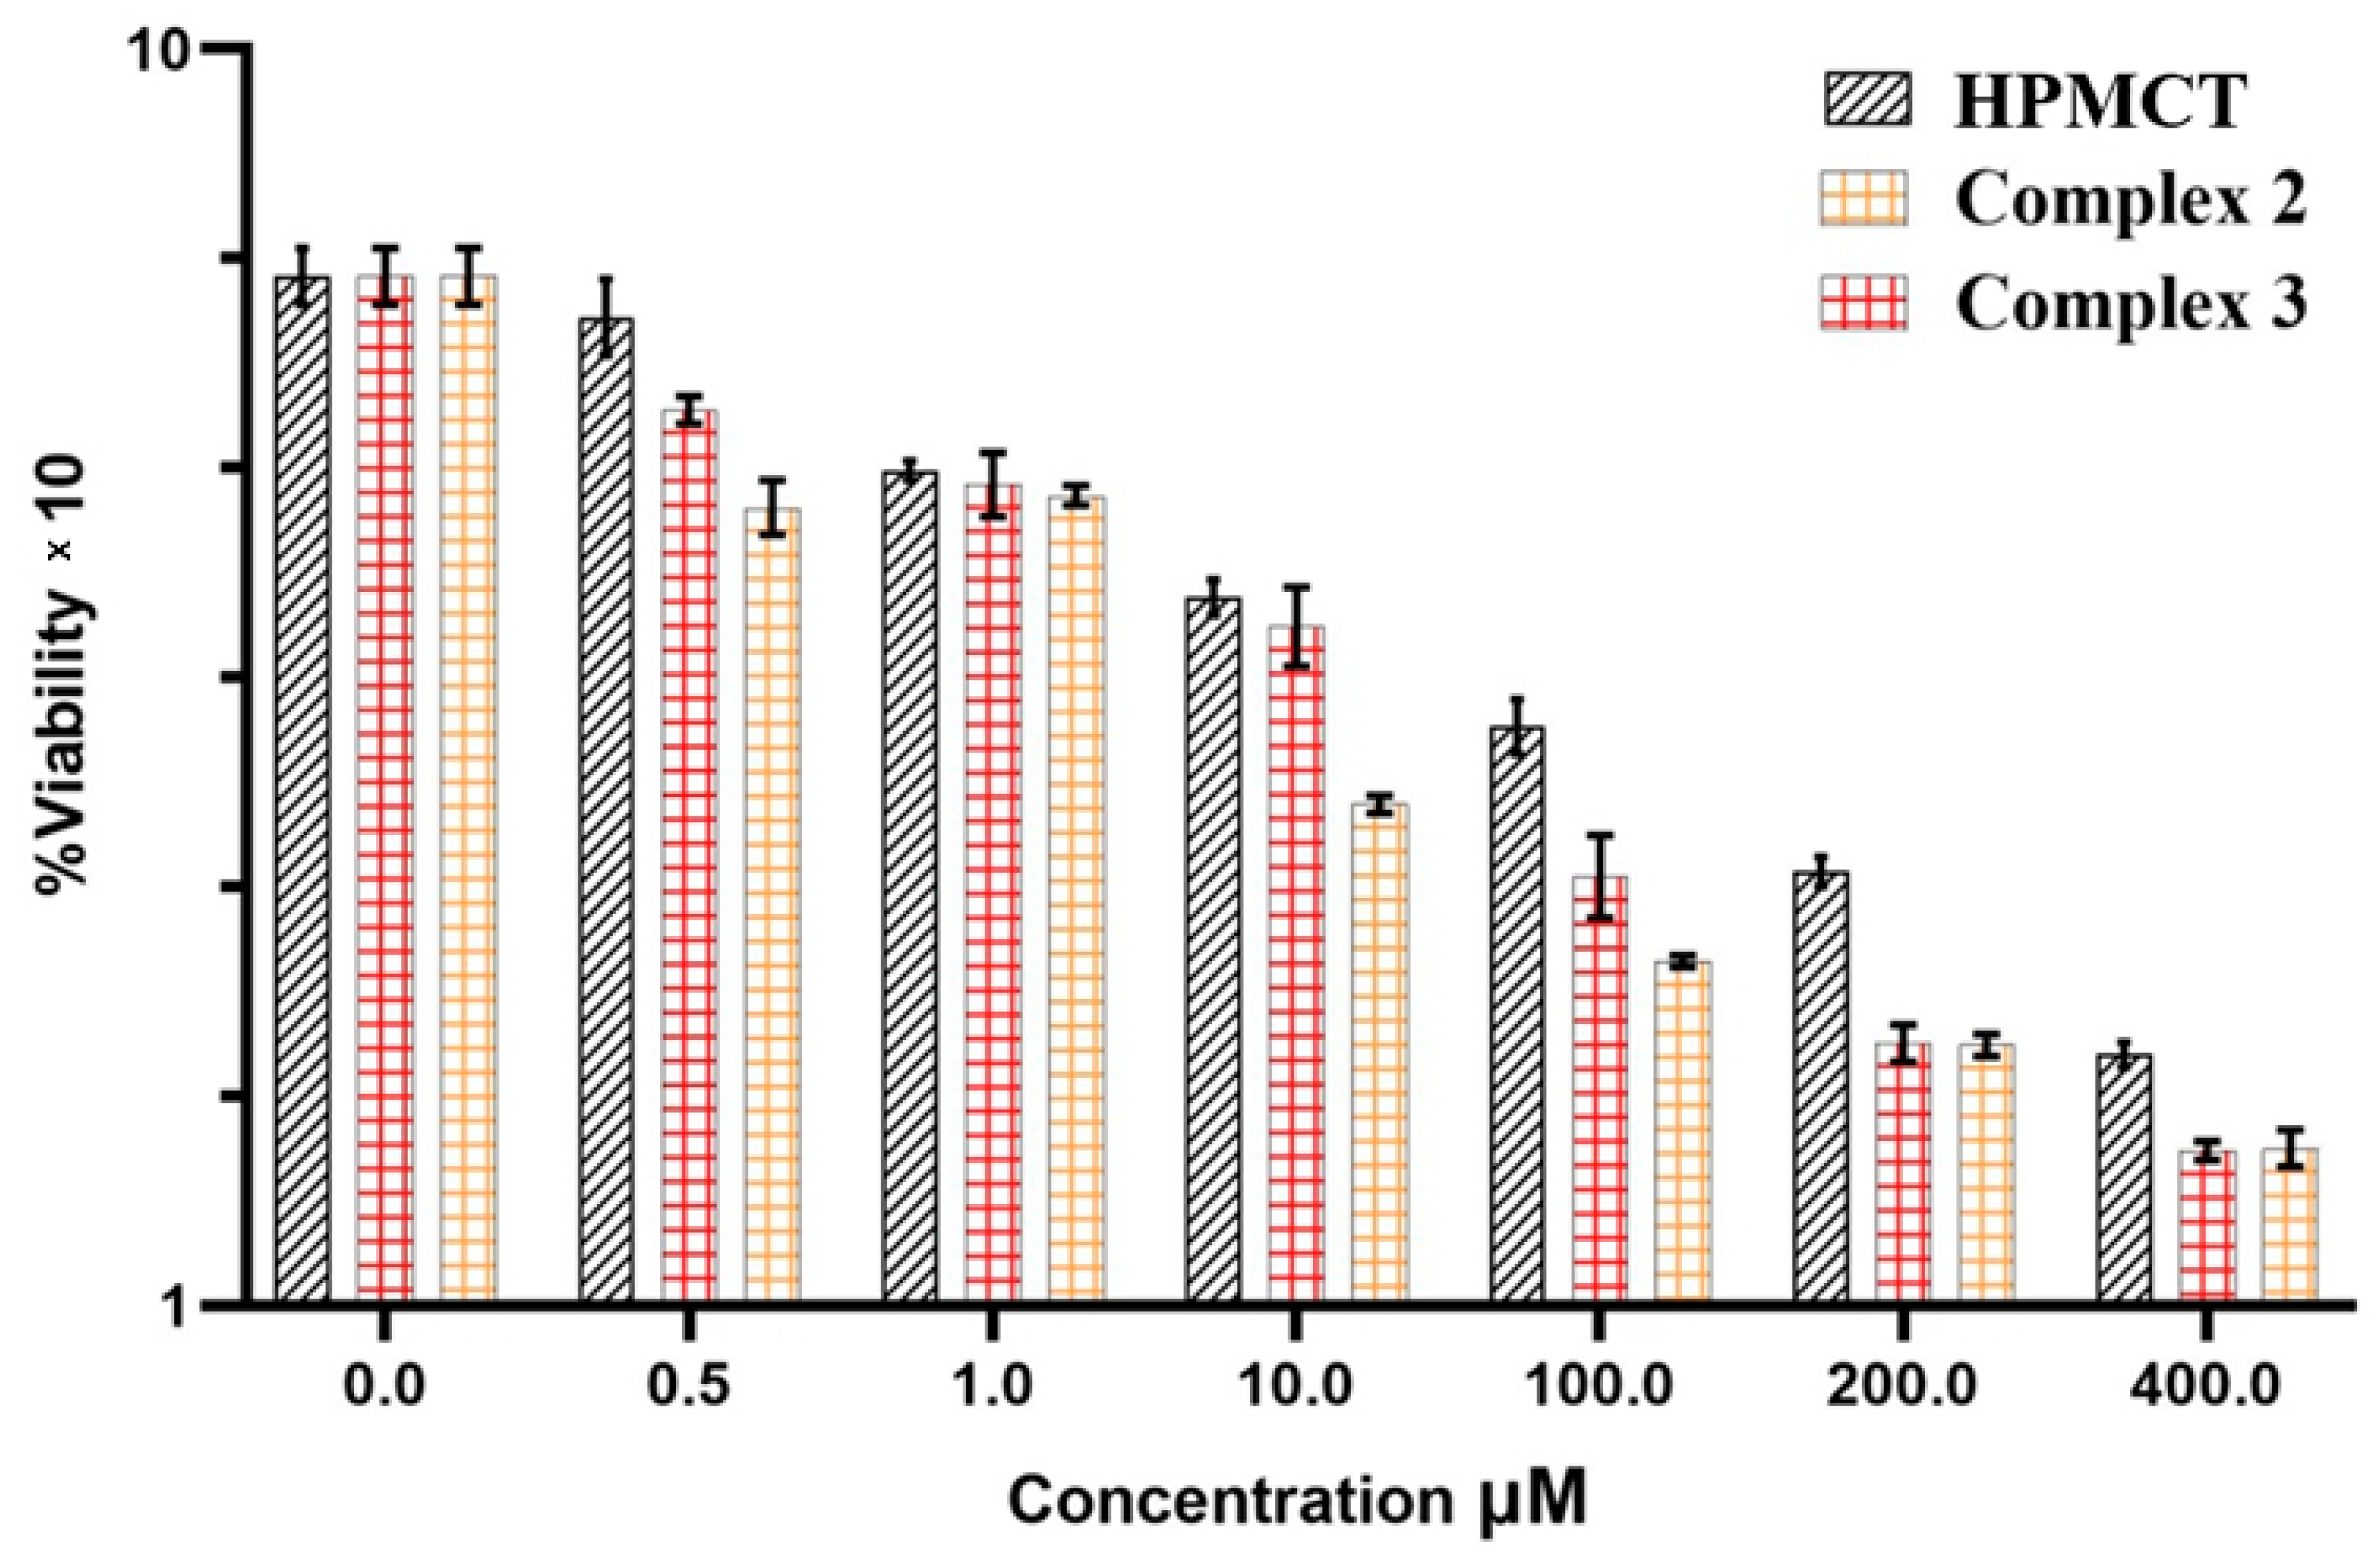
2.5.2. Anti-Cancer Activity

The cytotoxic activity of the free HPMCT ligand and its complexes (2) and (3) was evaluated using the MTT colorimetric assay [24] against the MCF-7 cell line in 0.01 µM–100 µM. The free HPMCT ligand showed a negligible effect, whereas the Pt(II) complex (3), exhibited a good inhibitory effect and the highest activity compared with the Pd(II) complex (2) against the MCF-7 cell line. The IC50 value of the HPMCT LH ligand is 80.30 ± 1.905 µM. The complexes [PdCl2(HPMCT)2] (2) and [PtCl2(HPMCT)2] (3) appeared to have a good inhibitory effect against the MCF-7 cell line with IC50 = 28.93 ± 0.795 μM and 12.72 ± 0.376 μM, respectively (see Figure 5 and Table 5). These results indicate that Complexes (2) and (3) have a good cytotoxicity but are less effective than cis-platin.

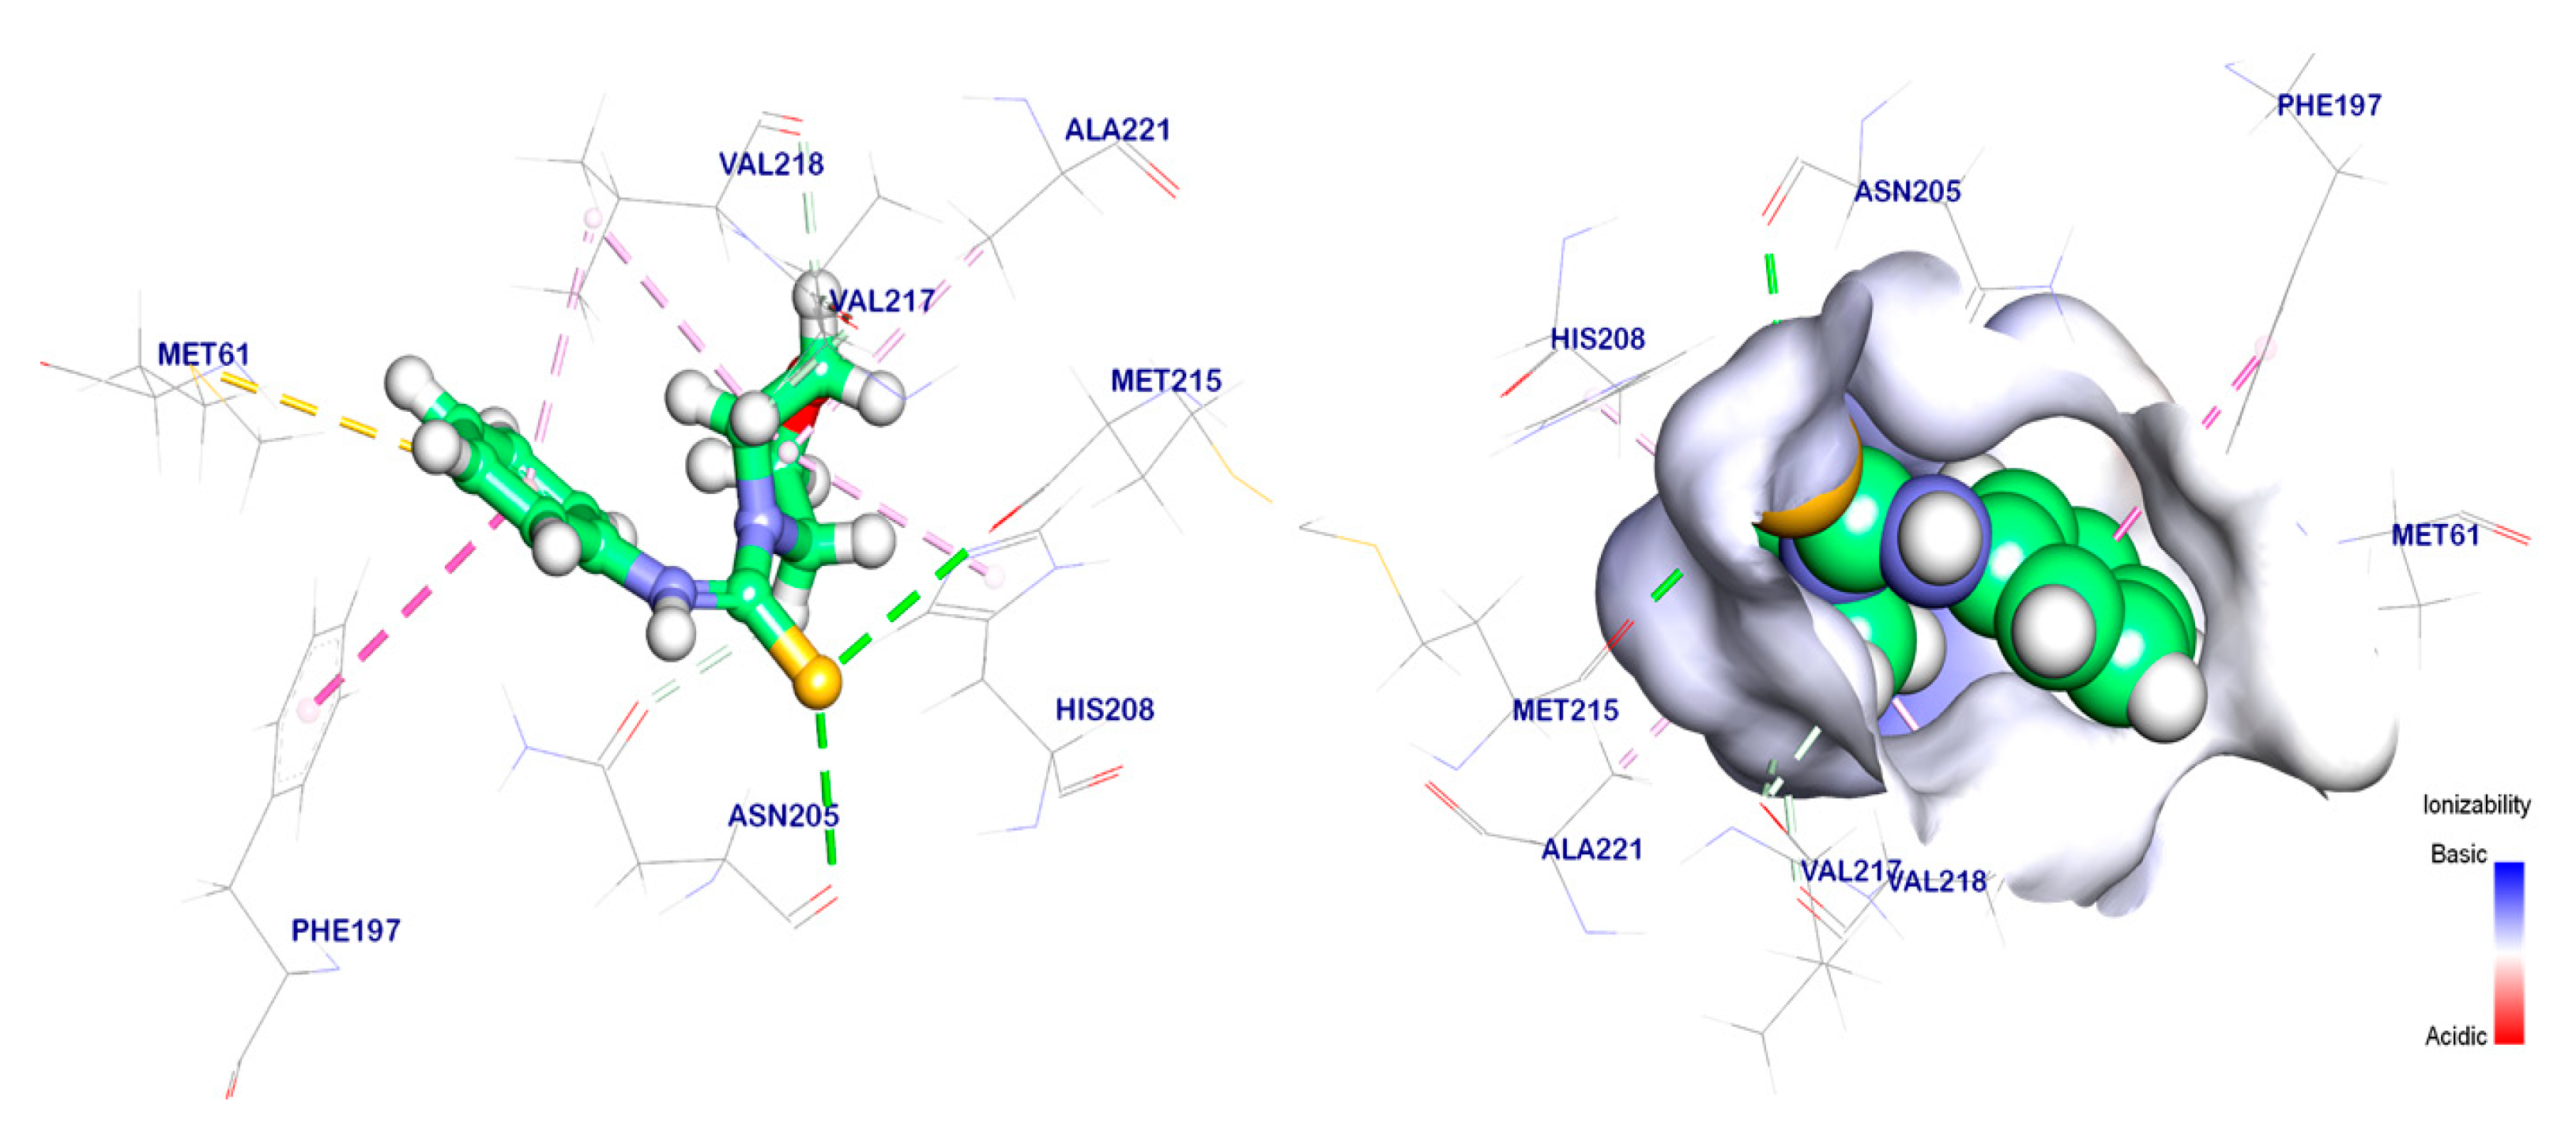
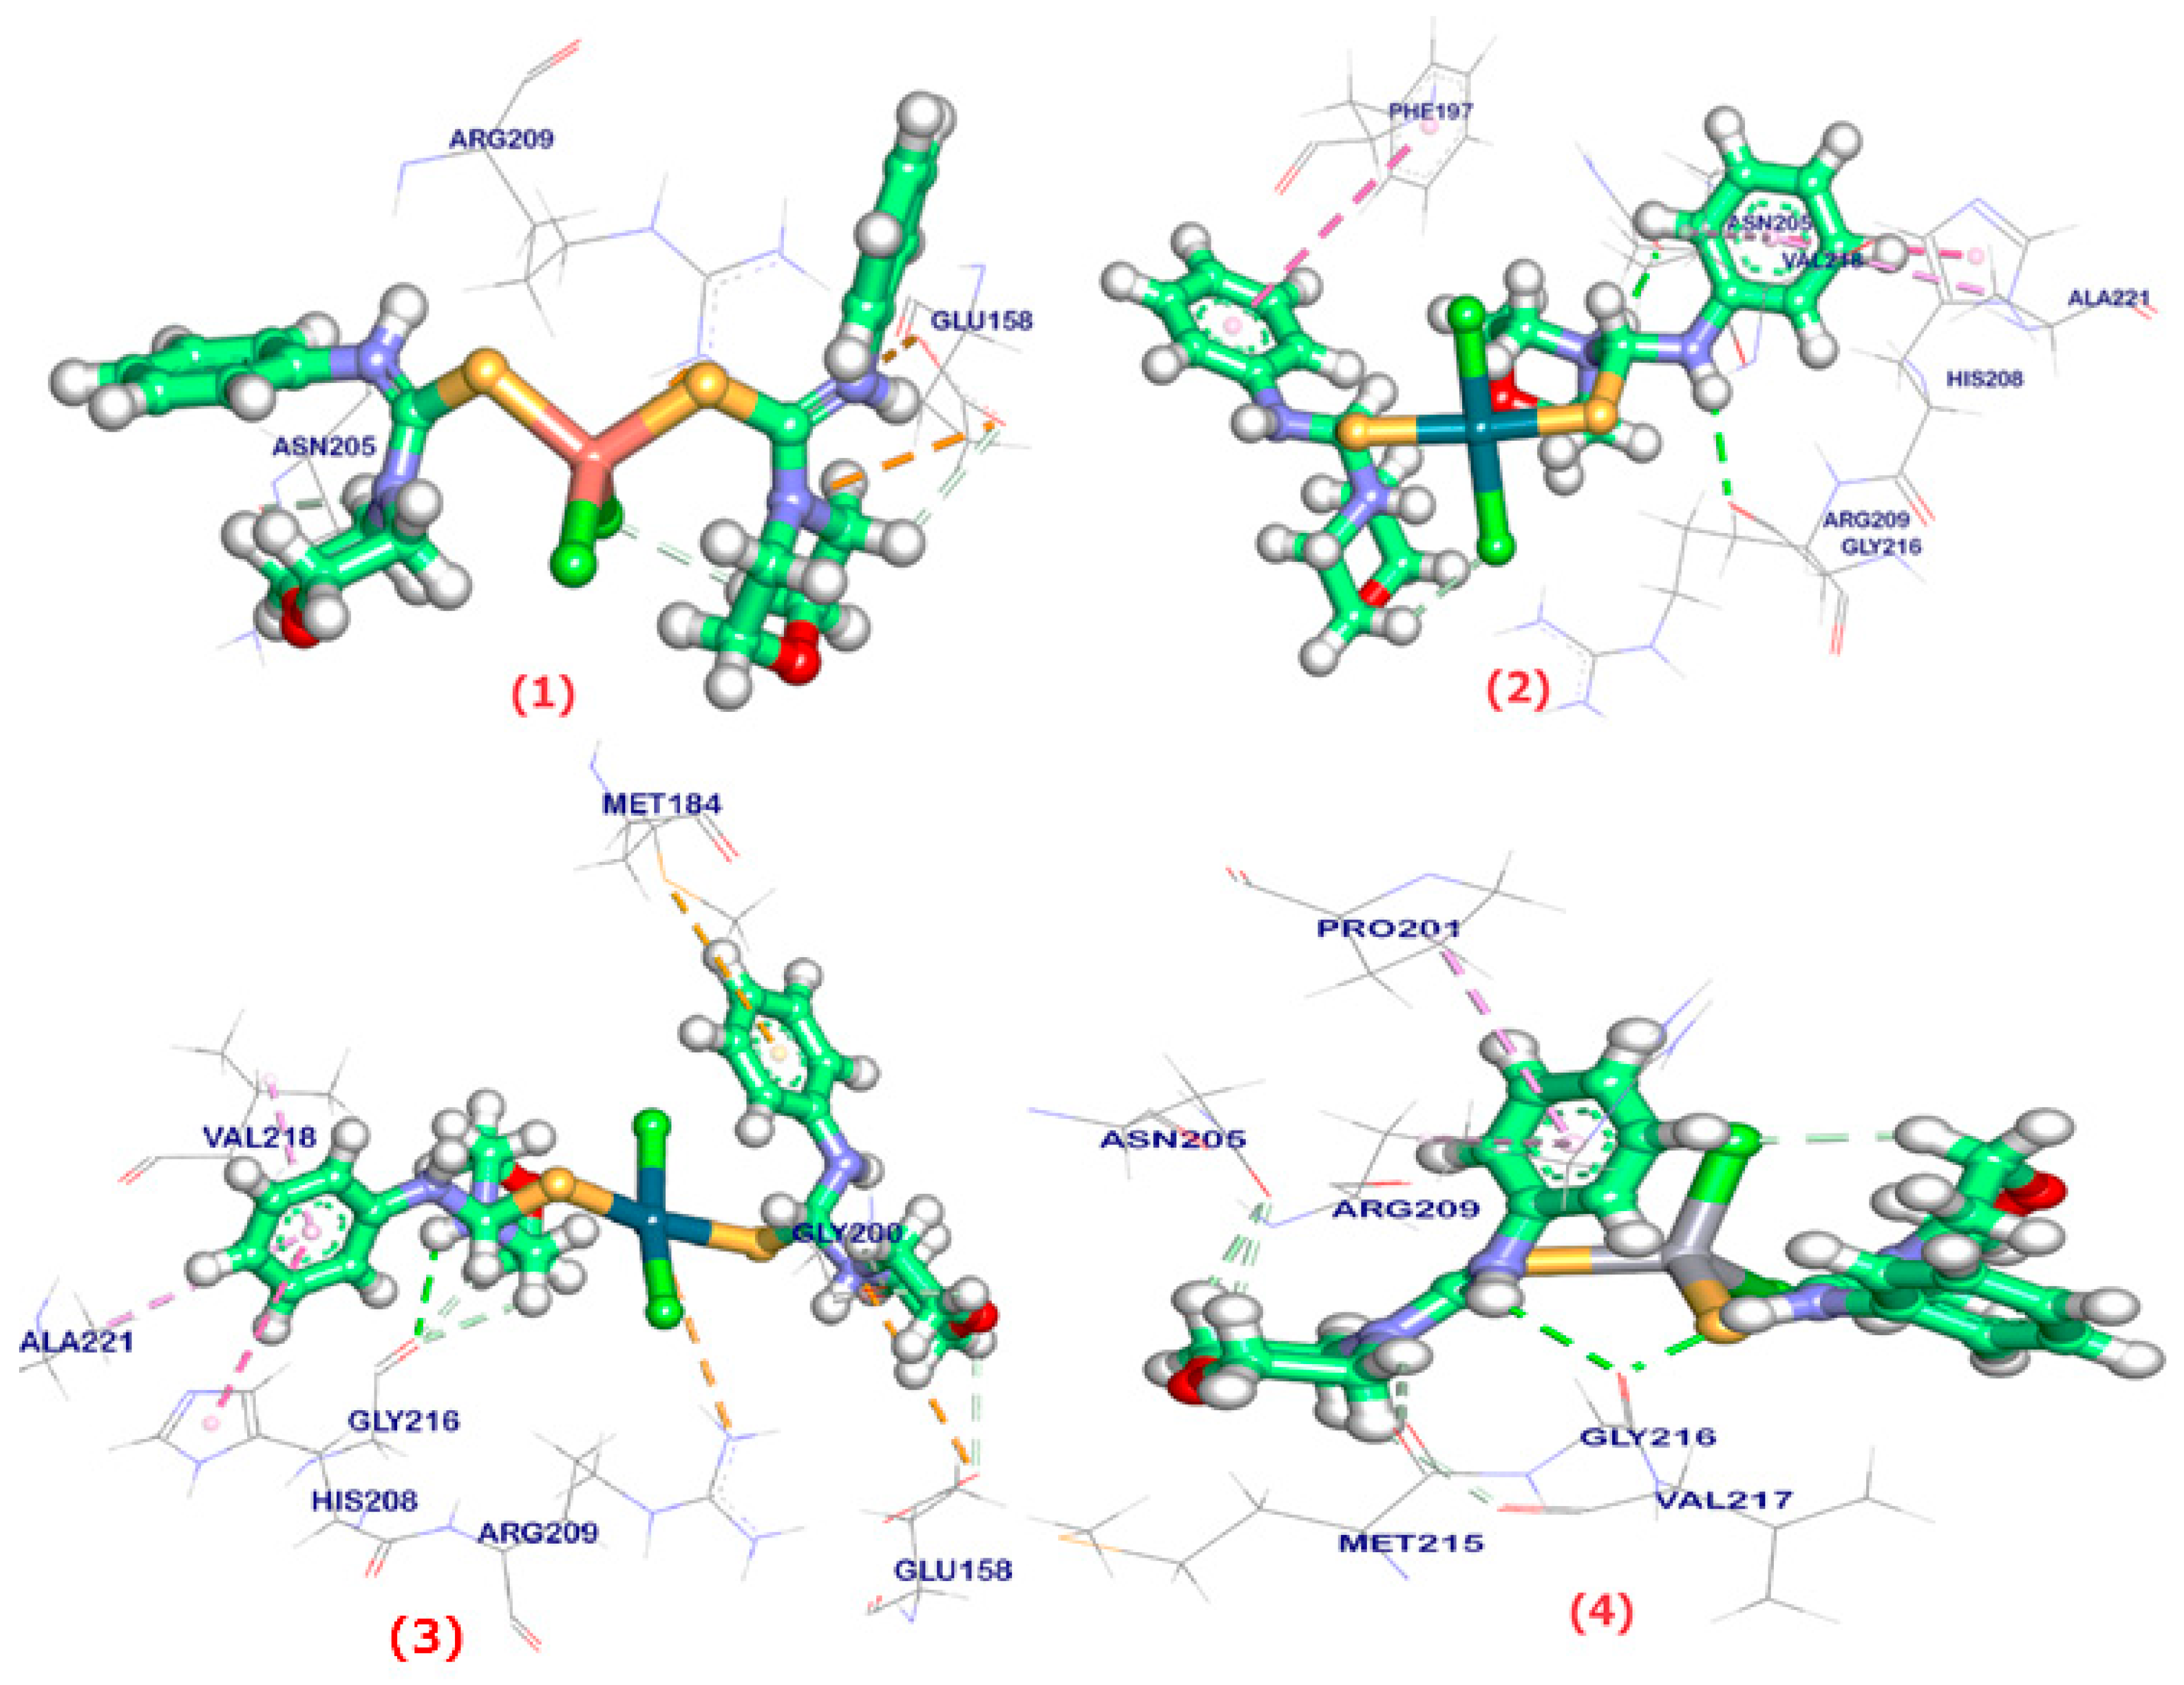
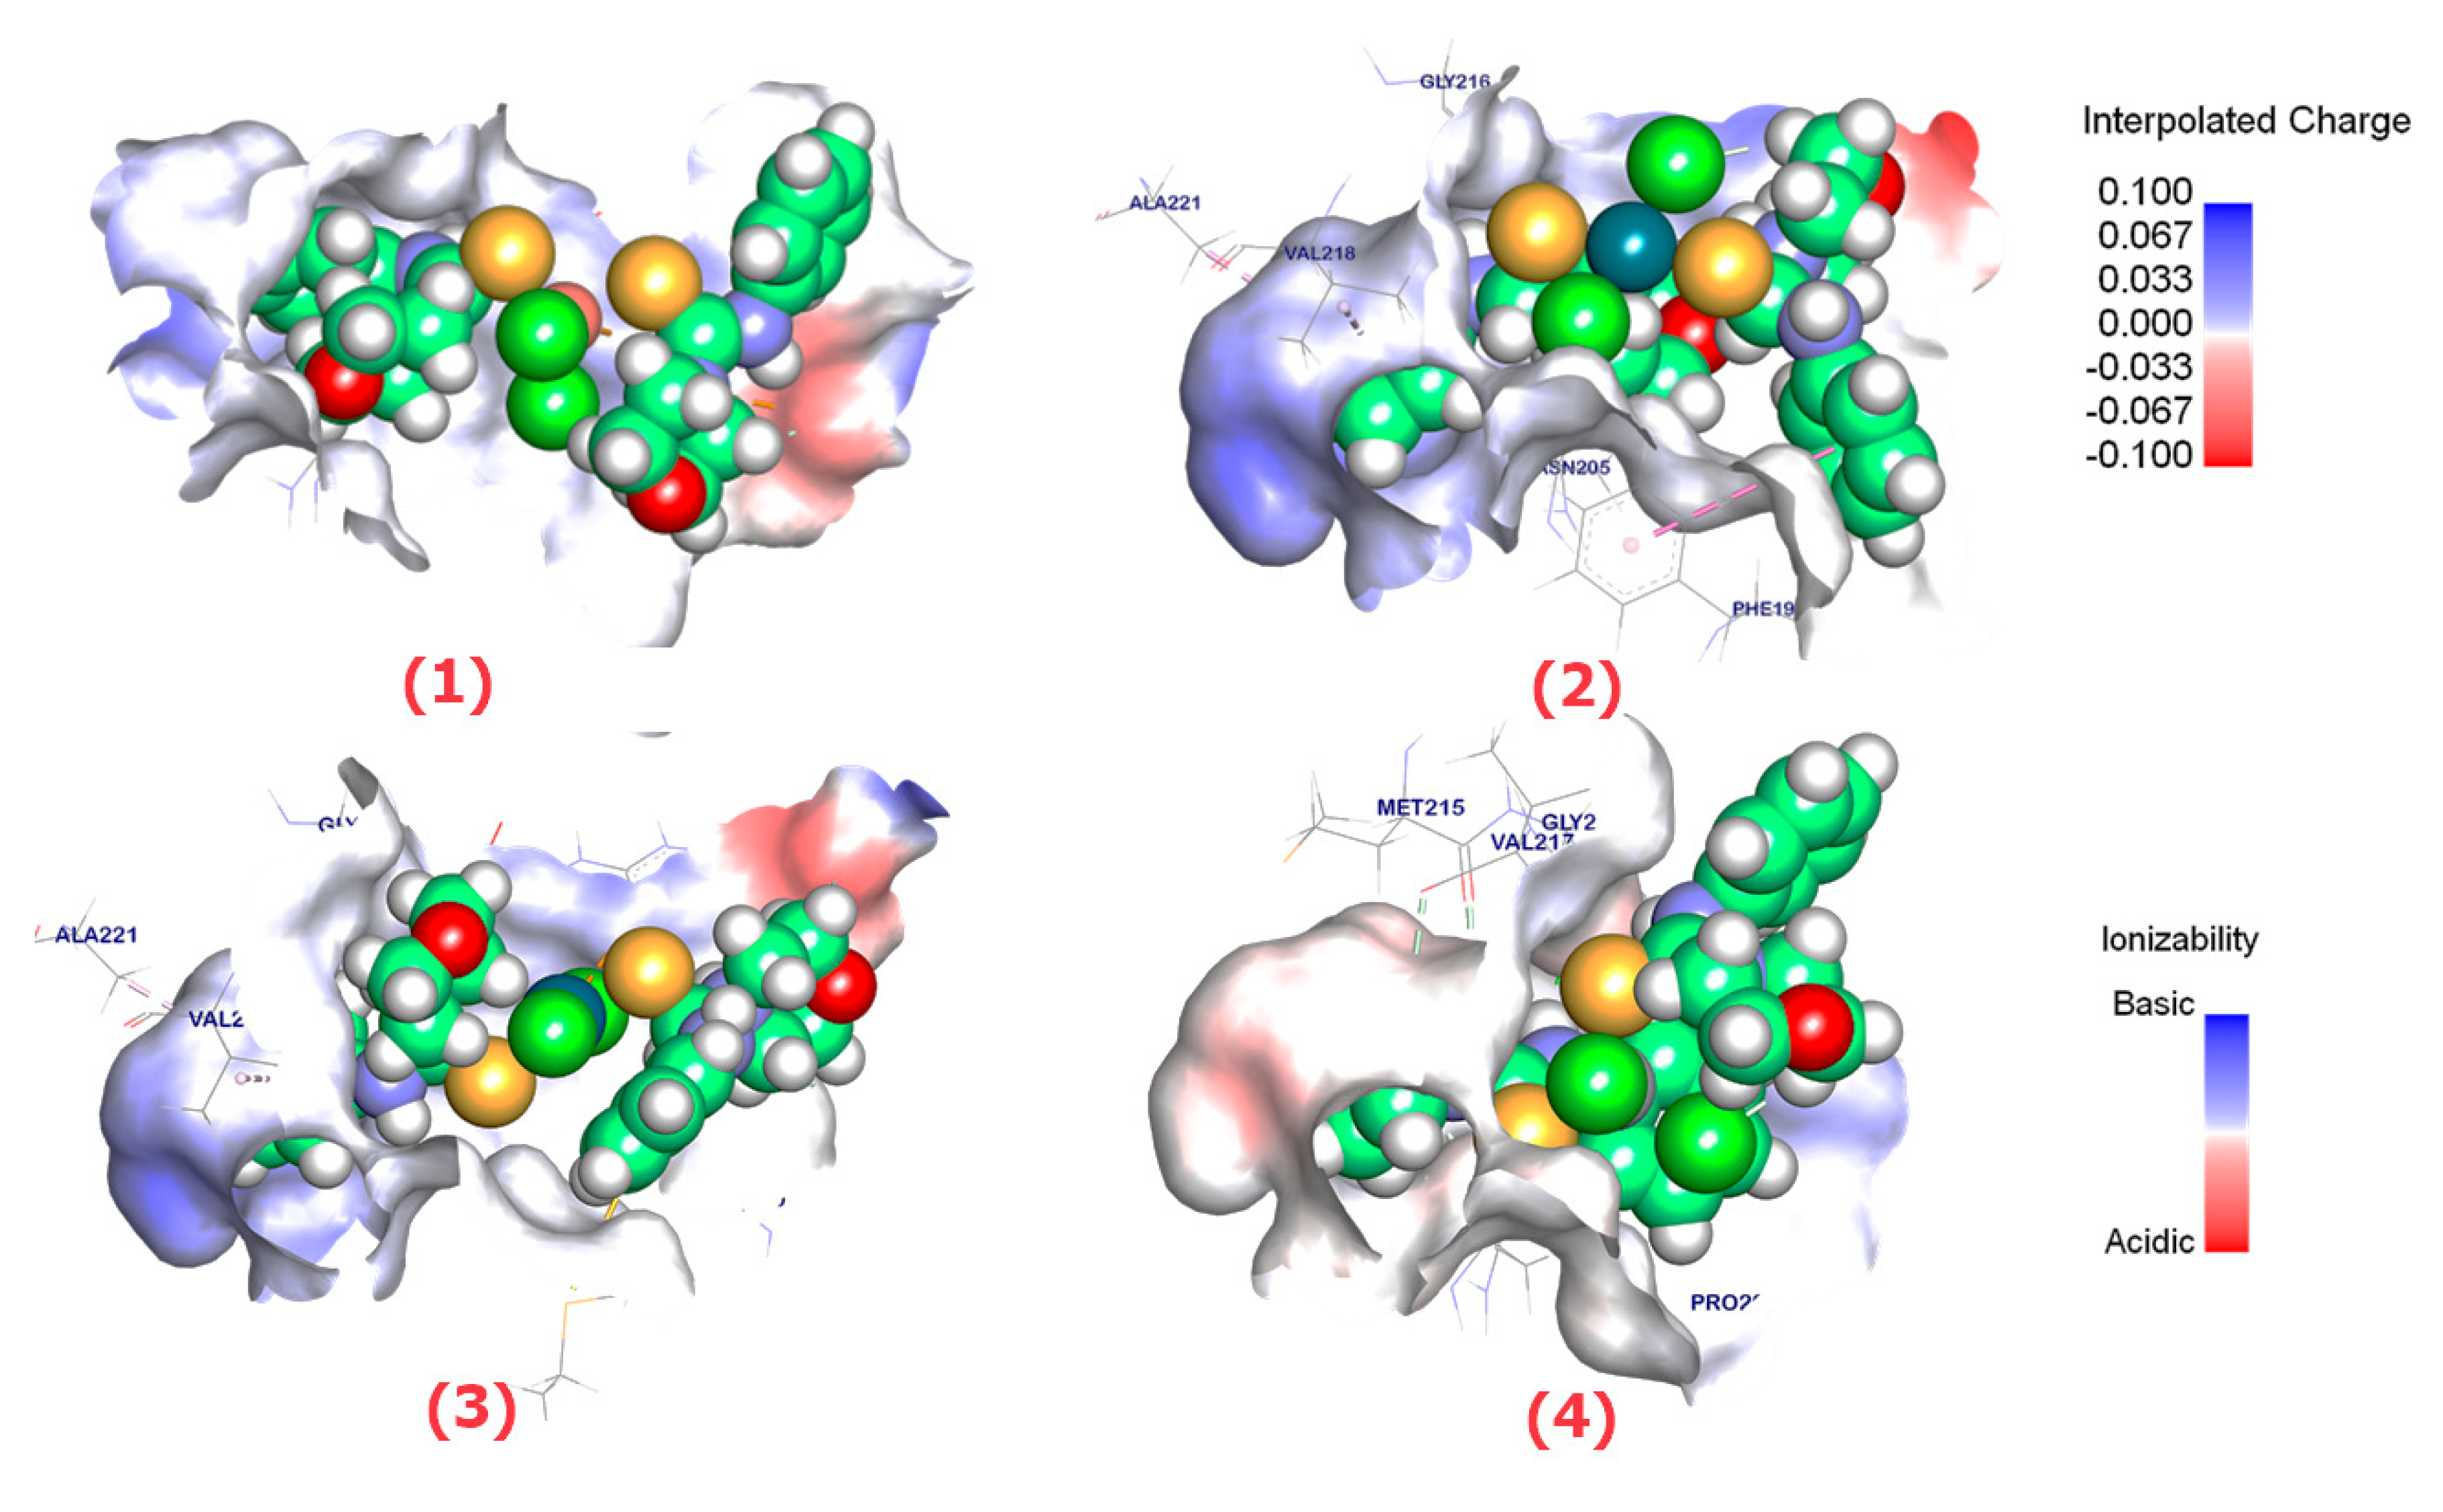
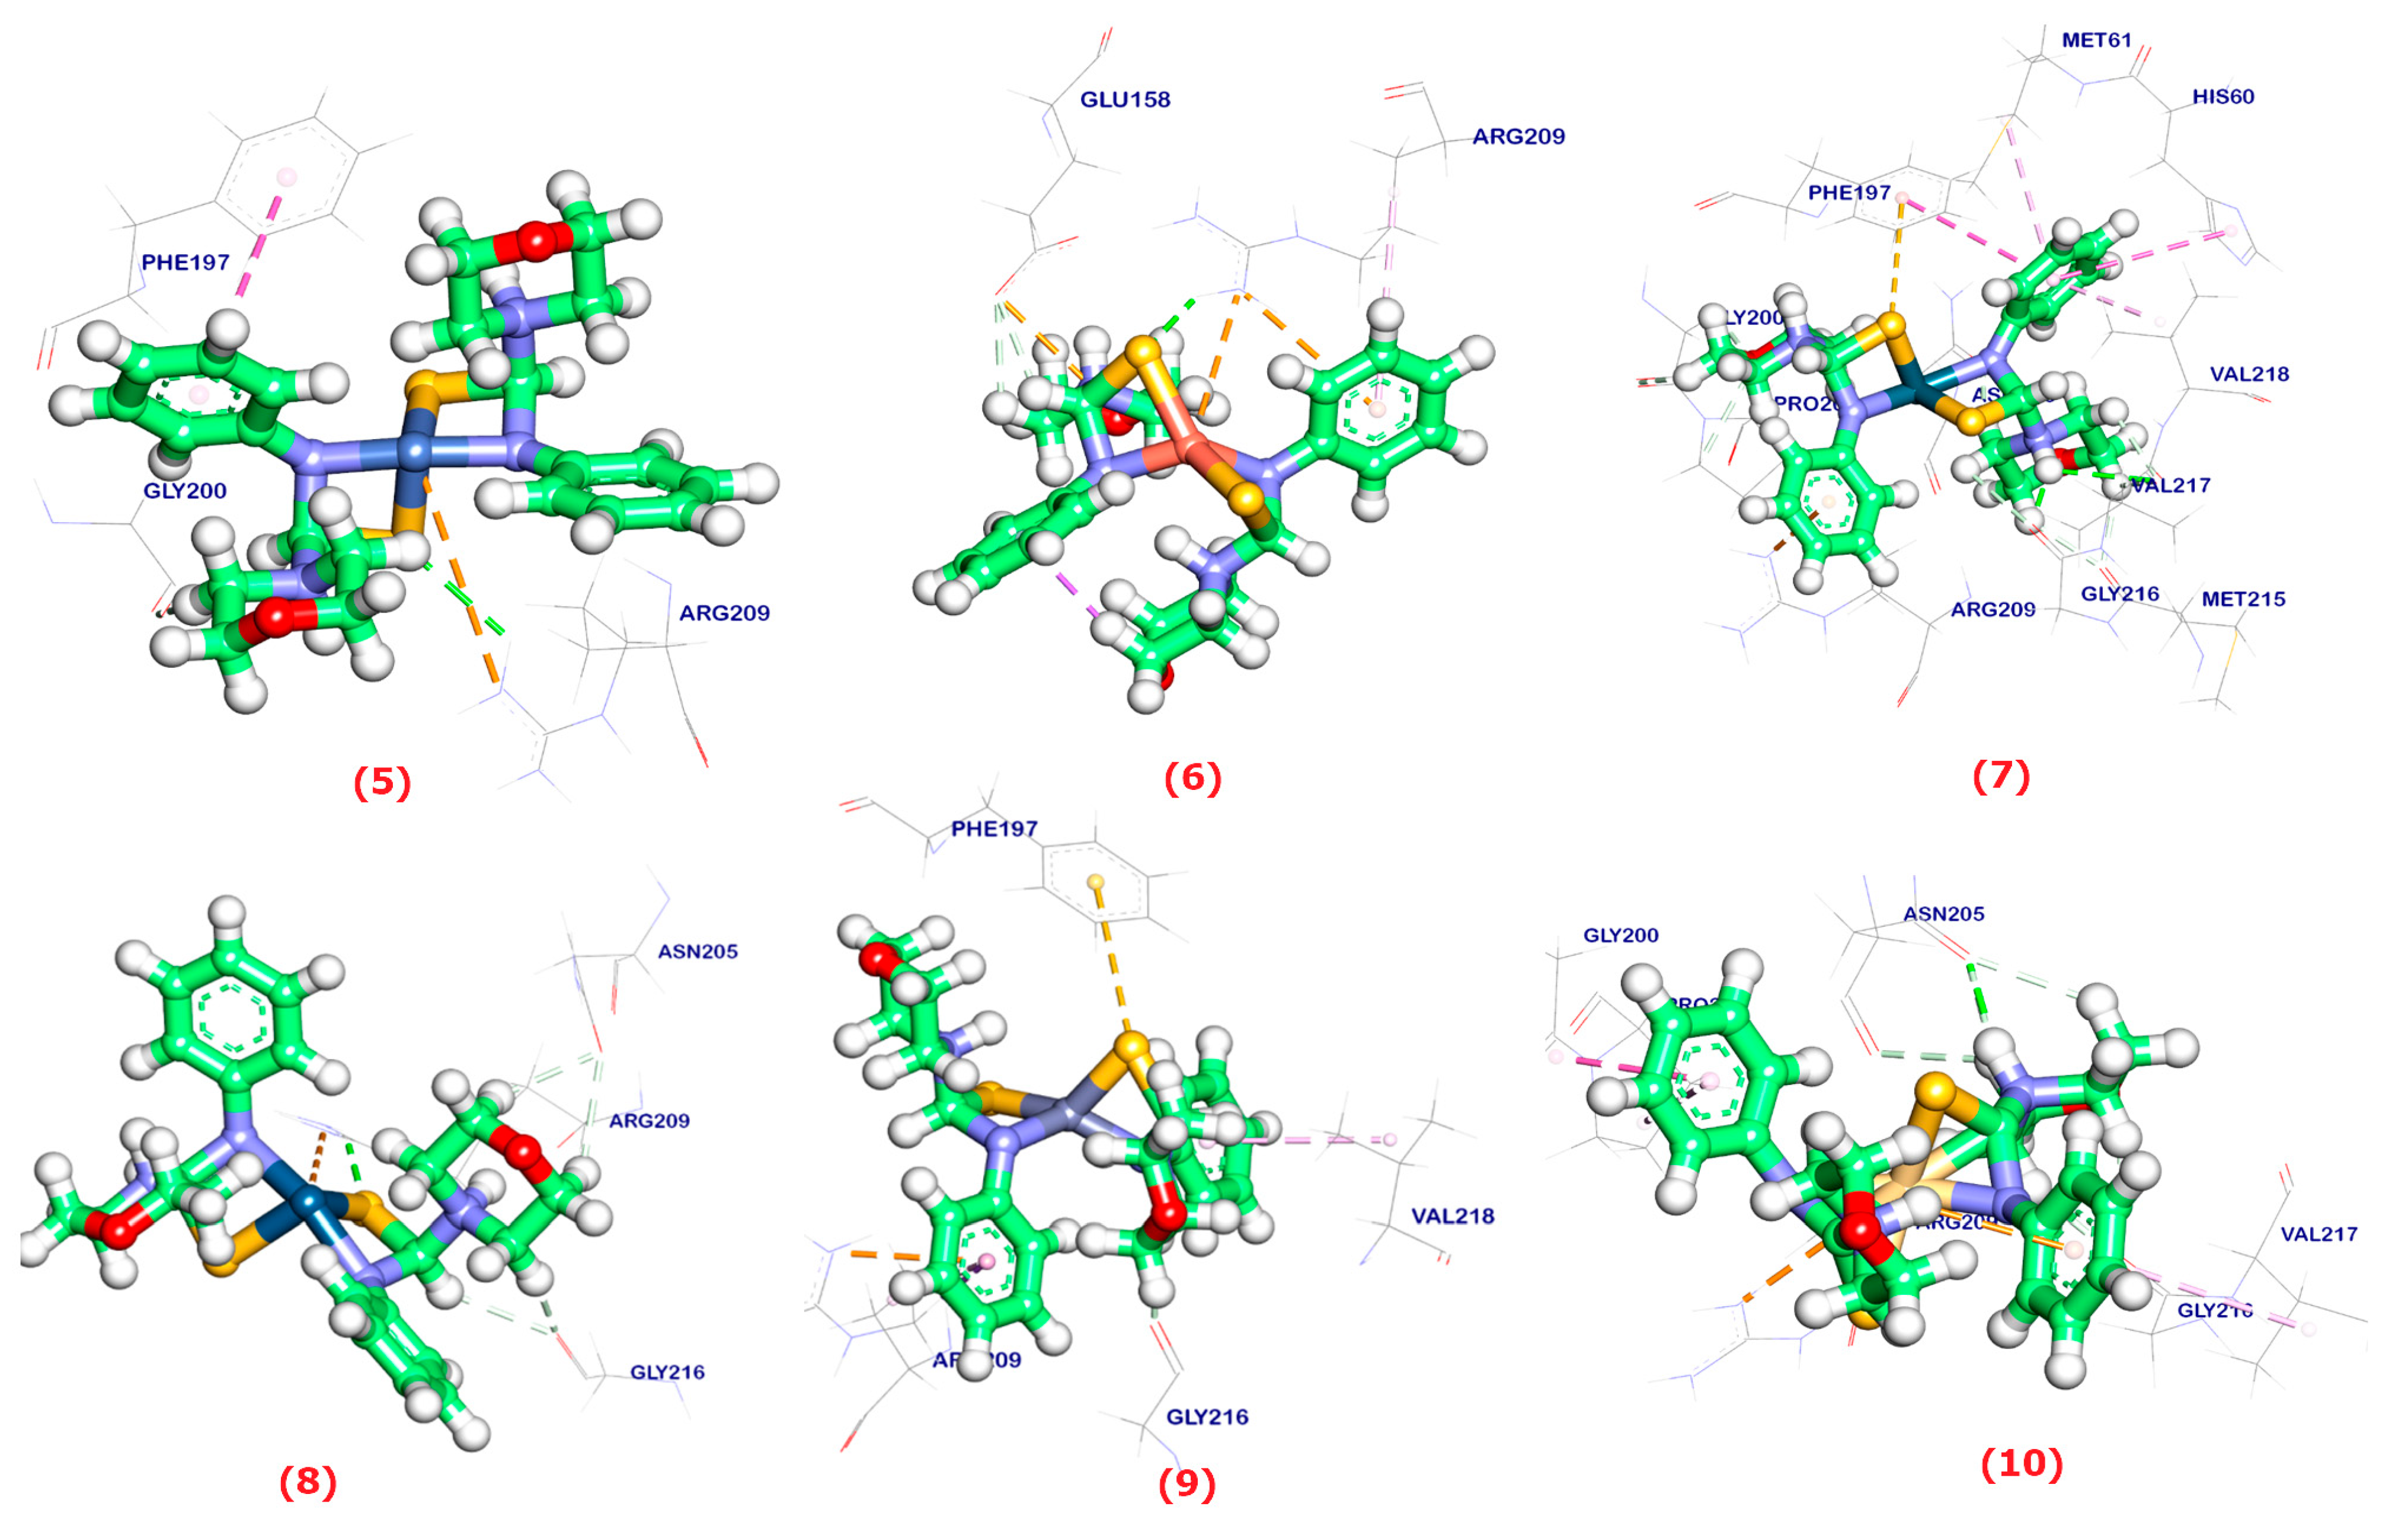
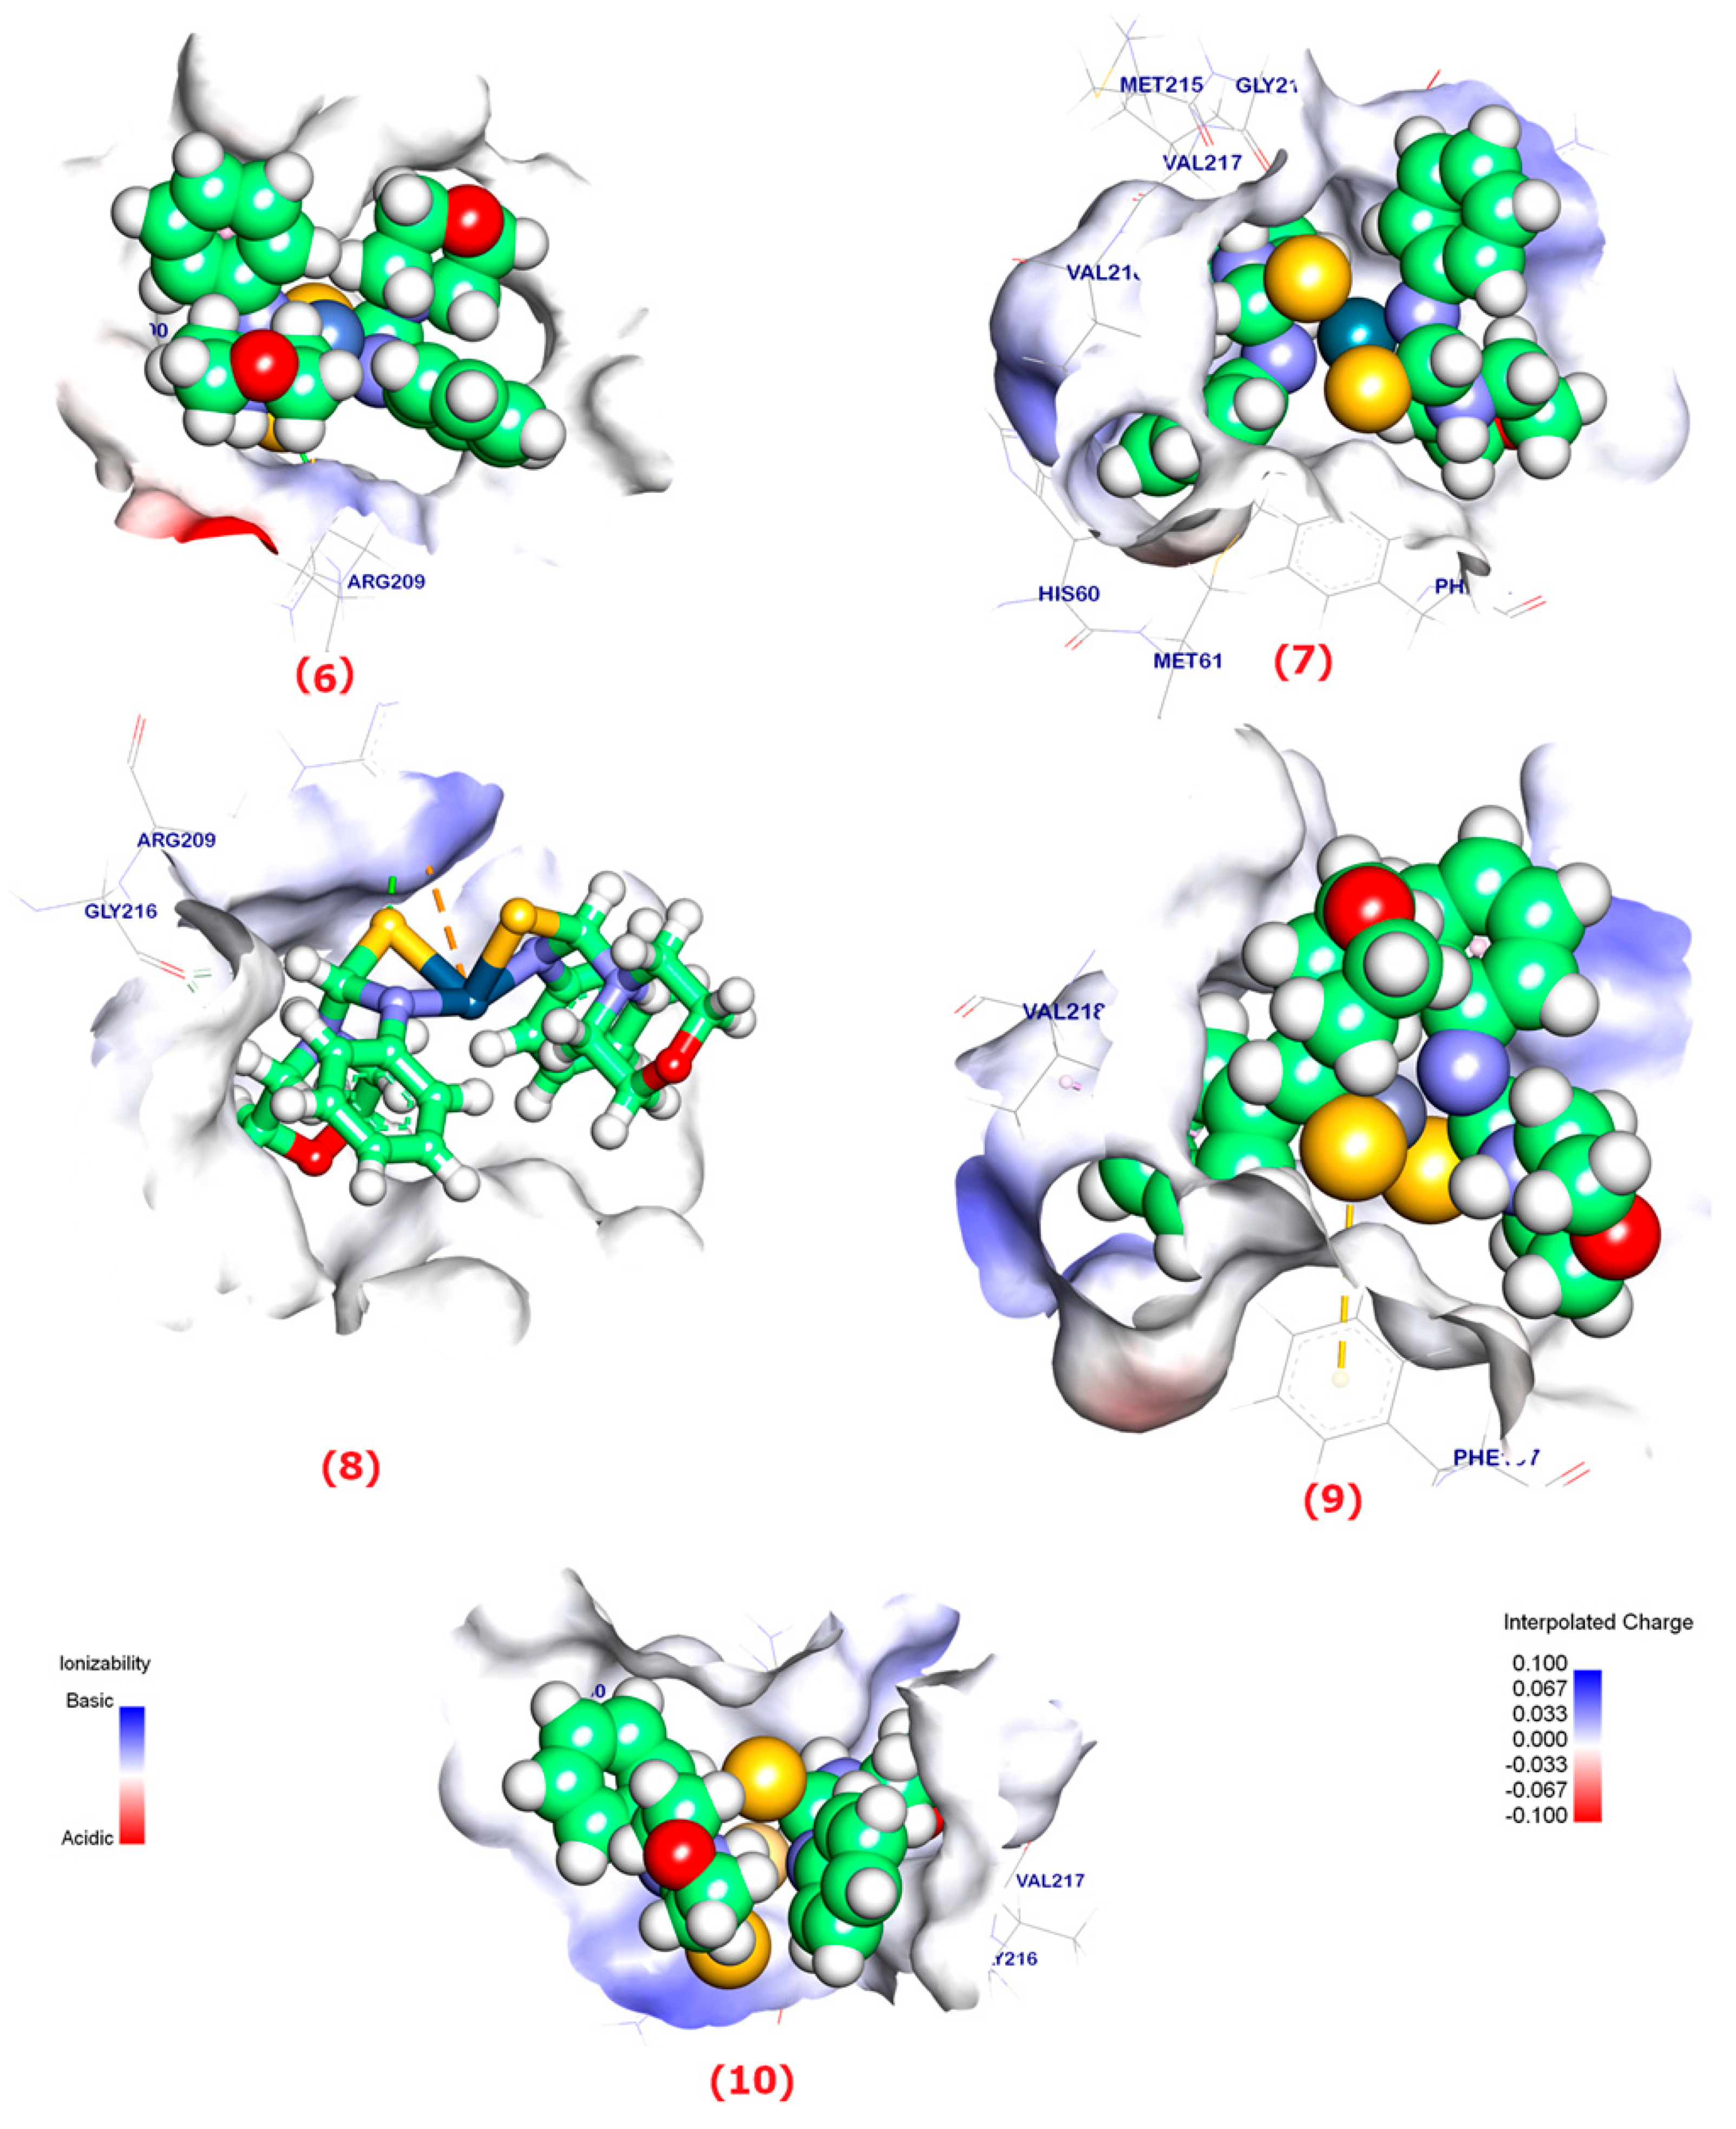
2.6. Molecular Docking

Bacterial tyrosinase was bound by the free HPMCT ligand with an energy of −7.01 kcal/mol, and five π-π and π-alkyl interactions with Pro201, His60, Ala221, His208, and Val2018 were formed. Two hydrogen bonds with Arg209 and Asn205 are formed at distances of 1.67 and 1.79 Å, as well as halogen interaction binding with His231 (Figure 6).
The binding mode of Complexes (1, 2, 3, and 4) exhibited an energy binding of −6.11, −6.15, 6.32, and −5.86 Kcal/mol against bacterial tyrosinase (Figure 7 and Table 6). Complex (1) creating pi-cation and attractive interactions with Glu158 and Arg202. Complex (2) interacted with Asn205 and Gly216 by two hydrogen bonds with π-π and π-alkyl interactions with His208, Phe197, Val221, and Val218, while Complex (3) formed π-π, π-sulfur, and π-alkyl interactions with His208, Met184, and Ala221. Moreover, it interacted with Gly216, Arg209, and Glu158 by hydrogen bond and attractive interactions. Complex (4) interacted with Arg209, Pro201, and Phe197 by π-alkyl, π-π, and attractive interactions and additionally formed hydrogen bonds with Gly216 and Arg209, respectively. Furthermore, we studied the interaction of the synthesized complexes (14) with the active pocket of the bacterial tyrosinase enzyme, and Figure 8 shows this interference through the surface mapping in addition to the color gradient of the interpolated charge and ionizability during the interference of the prepared complex with the active pocket of the enzyme.
Similarly, Complexes (511) were docked against the bacterial tyrosinase enzyme and the energy binding values are −5.20, −5.10, −5.13, −5.56, −5.36, −4.02, and −5.20 Kcal/mol, for Complexes (511), respectively (Figure 9 and Table 6). Complex (5) interacted with Arg209, Pro201, and Phe197 by π-alkyl, π-π, and attractive interactions, and one hydrogen bond with Gly216 and Arg209, respectively, whereas Complex (6) showed π-cation interactions and hydrogen bonding with Glu158 and Arg209. Also, Complex (7) exhibited two hydrogen bonds with Gly216 and Val217 and π-π, π-cation with His60, Val218, Met61, Phe197, and Arg209, respectively. Complex (8) enacted attractive and hydrogen bonding with Arg209, while Complex (9) bound with Phe197, Arg, and Val218; moreover, Complexes (10) and (11) formed a hydrogen bond with Asn205 or Met215 and Asn205 and π-alkyl, π-π, and attractive interactions with Val217, Pro201, Gly200, Arg209 Phe197, Val218, Ala221, His208, and Met61. Moreover, the mapping surface studied the interaction of the synthesized complexes (511) with the active pocket of the bacterial tyrosinase enzyme, and Figure 10 shows this interference through the color gradient of the interpolated charge and ionizability during the interference of the prepared complex with the active pocket.
According to the molecular docking of HPMCT, the reference ligand demonstrated a fitted binding to bacterial tyrosinase with a docking score of −7.01 kcal/mol, Compounds (14) exhibited binding energies ranging from −5.86 to −6.32 kcal/mol which bound with the essential amino acids in the target pocket with a similar mode of the reference ligand; additionally, Compounds (511) had binding energies ranging from −4.02 to −5.56 kcal/mol when docked with bacterial tyrosinase. They exhibited diverse binding modes, involving interactions like π-alkyl, π-π, π-cation, and hydrogen bonding with various key residues in the enzyme’s active site.

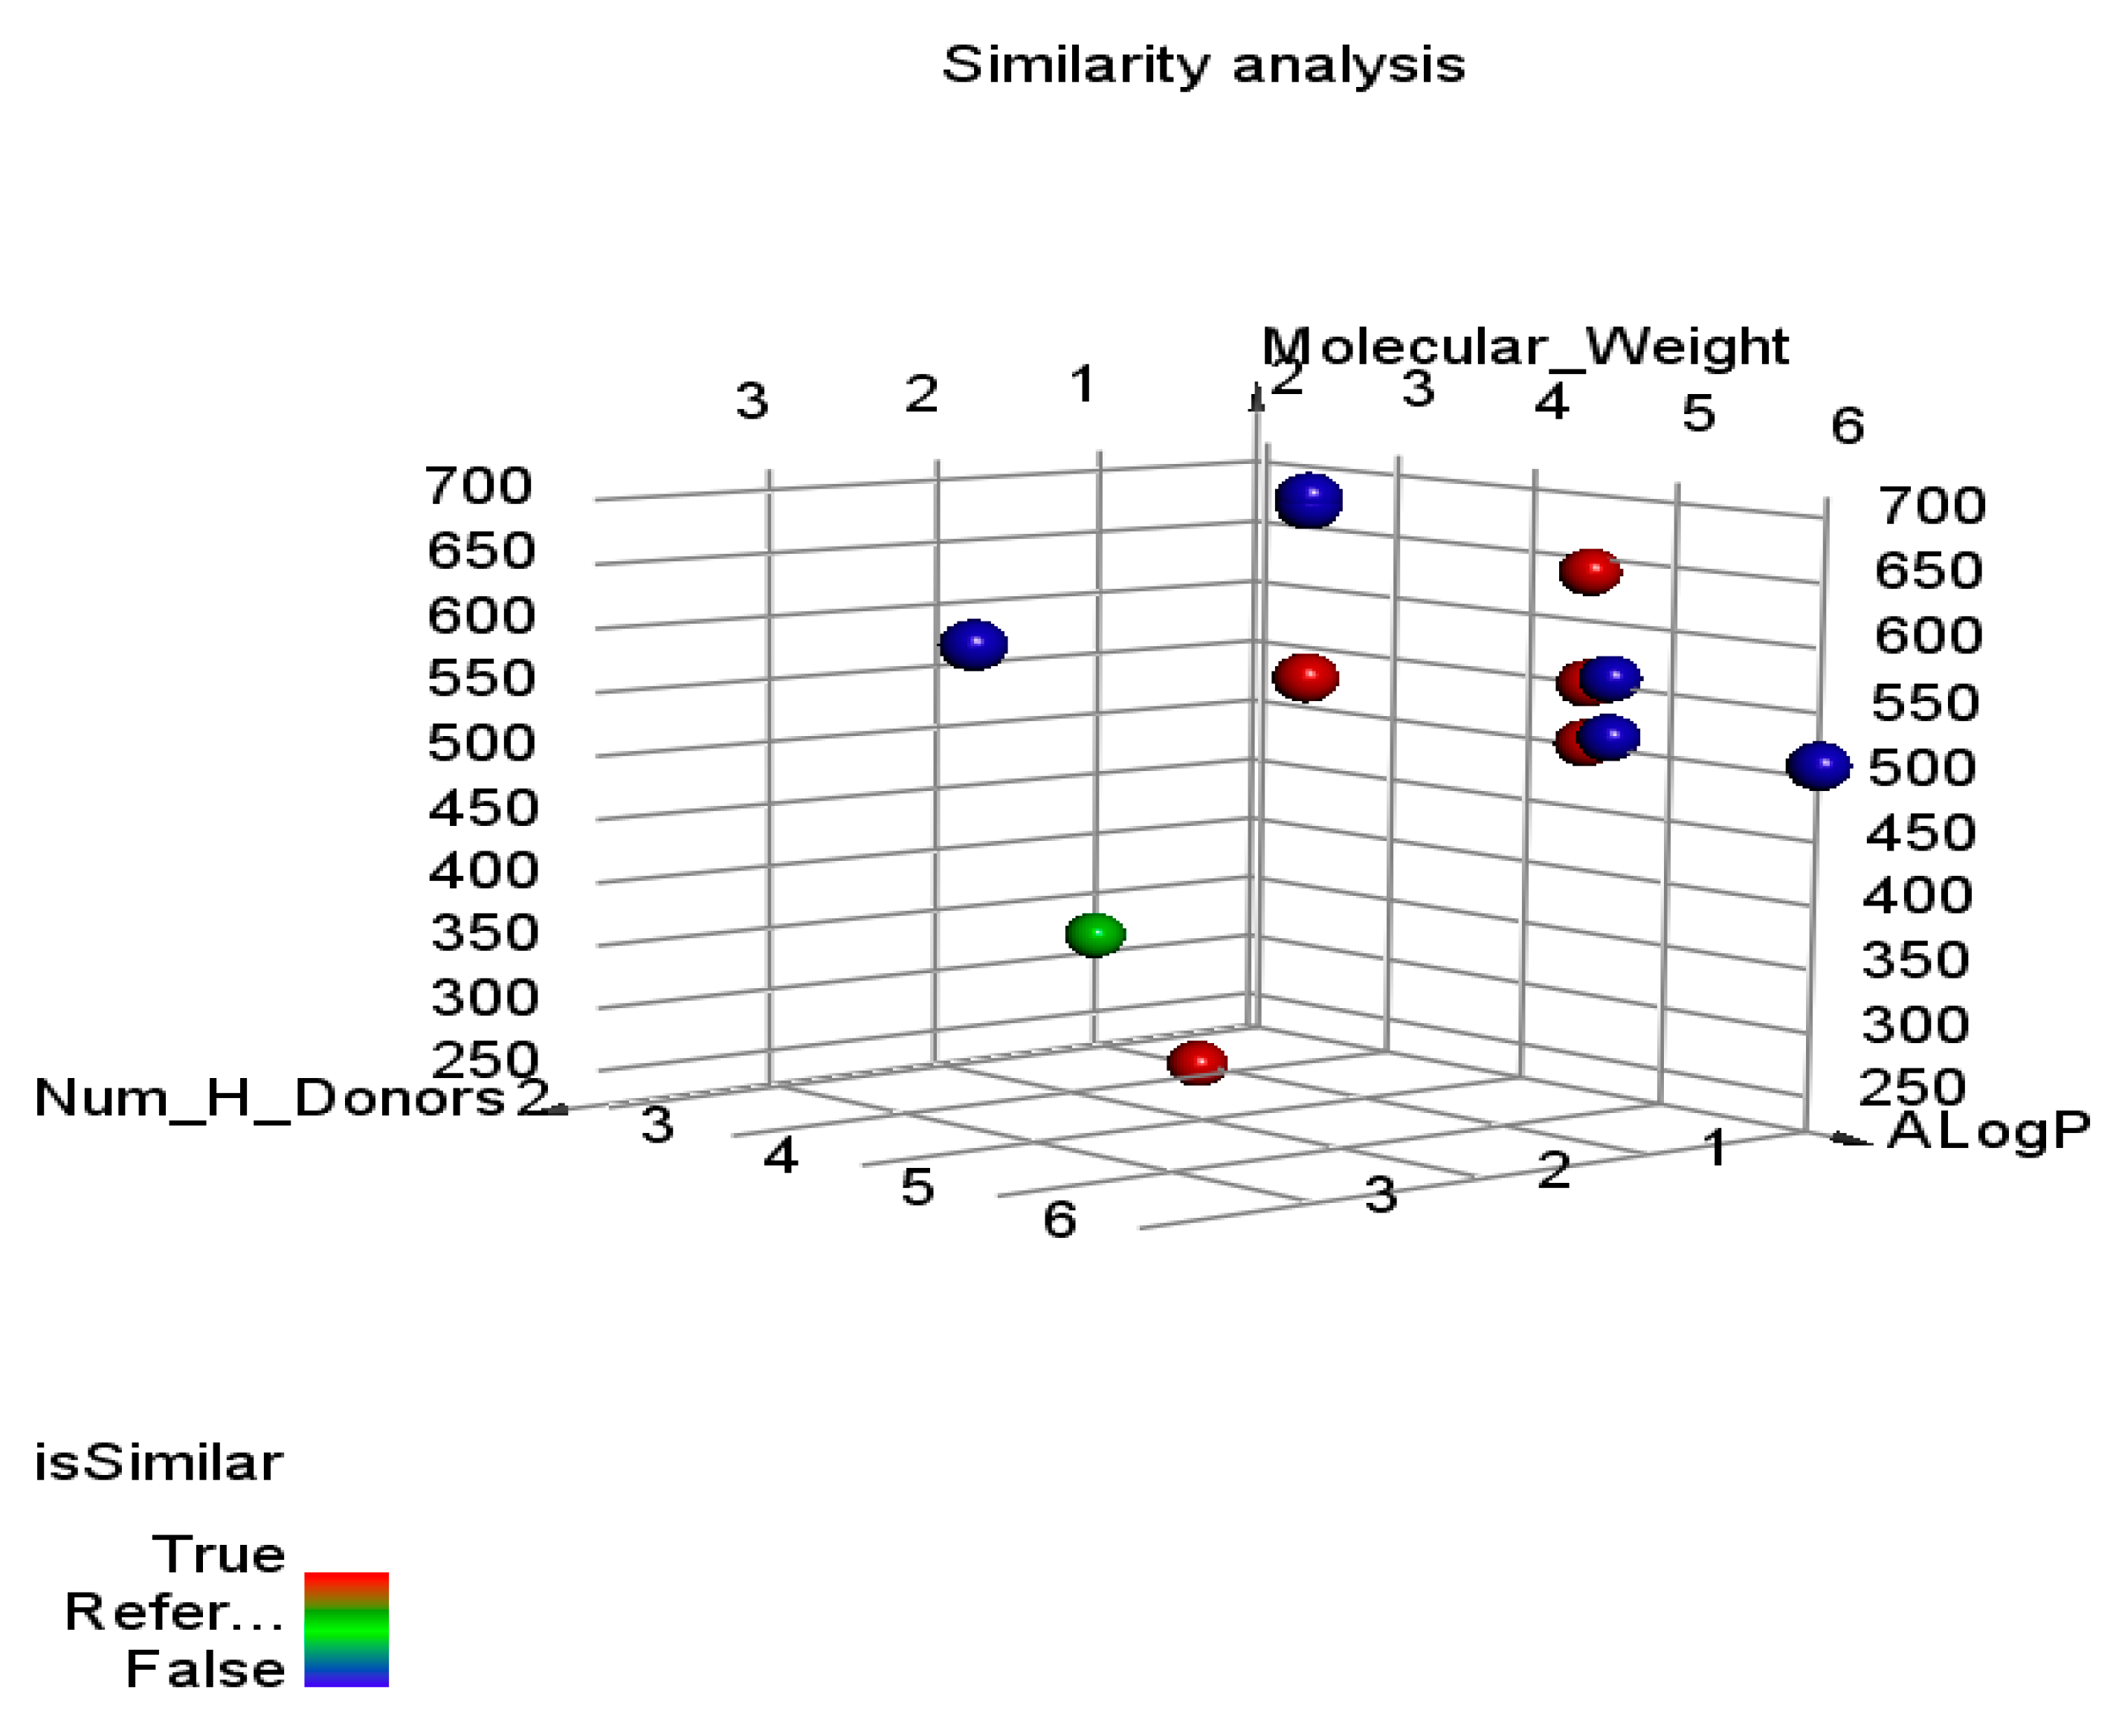
Molecular Similarity
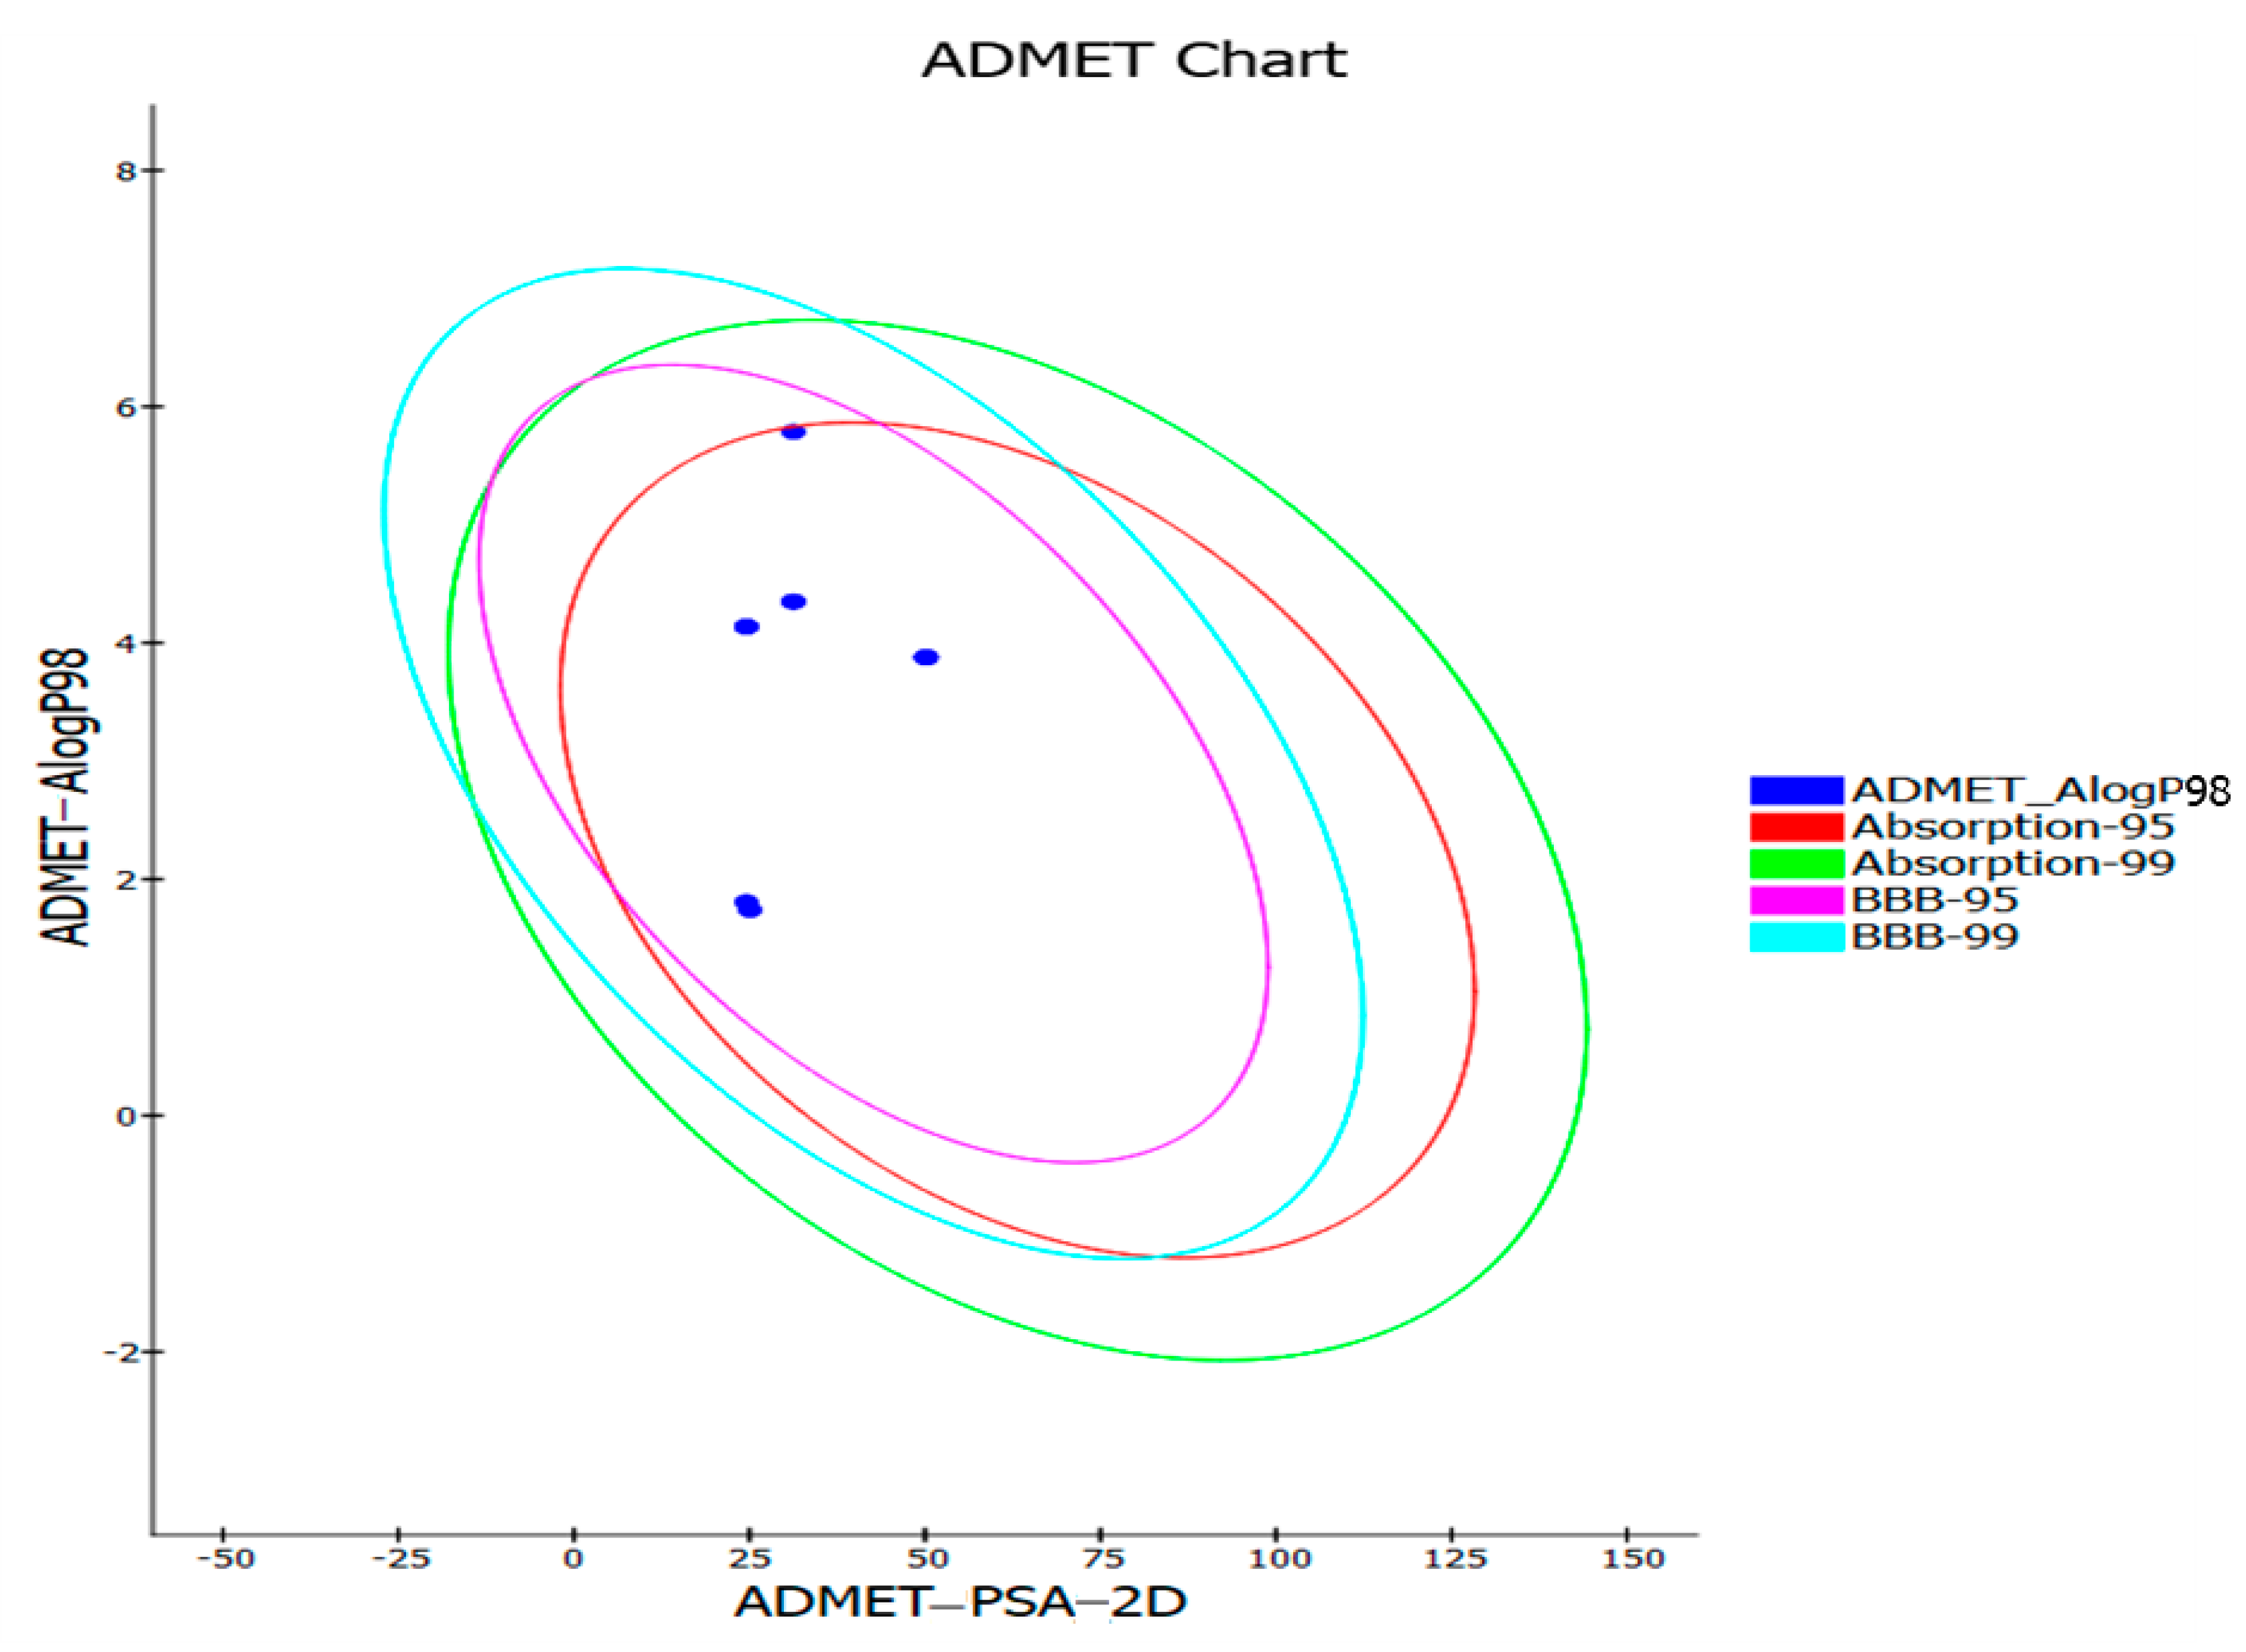
Drug design has always been a focus area of interest that has motivated a continued effort for developing new strategies toward finding similar molecules. The relationship between a certain chemical structure and its biological activity has always been related. These studies have been improved by including the idea of similar chemical structures when creating new drug-like molecules. Studies on molecular similarity have considered a wide range of descriptors. The molecular descriptors that are being studied include partition coefficient, hydrogen bond acceptors, hydrogen bond donors, and molecular weight (M.W.) (ALog p). In addition, numerous parameters have also been investigated such as the number of rotatable bonds [25], number of rings, and aromatic rings [26], as well as the molecular fractional polar surface area (MFPSA) [27] (Table 7). A binary array (the total number of binary bits) is used to represent the compound under examination. The descriptions were created using the software Discovery Studio for the candidates that had undergone testing, and they were then contrasted with the reference ligand. Figure 11 shows reference ligands (green balls), compounds with reduced similarities (blue balls), and compounds with good similarities as red balls. The level of molecular similarity or likeness between two substances is assessed using a similarity coefficient that generates a quantitative score. That resulting score, which is equal to the degree of similarity, was developed based on the computed values of a variety of structural descriptors. How similar two molecules are to one another is inversely associated with the computed distance between them in the descriptor space [28]. To compare the descriptor similarity between the tested compounds and the reference ligands, the distances between the various descriptors were computed in this study. The calculated distances describe how far apart two places are from one another. The overall degree to which the tested candidates’ actions reflect those of the reference ligands is shown by typed graph distances (Figure 10). Five of the examined options were picked as the favorites by the study.
The comparative analysis of molecular properties and structural similarity revealed distinct profiles among the compounds. Several compounds exhibited structural similarity to the reference compound such as Compounds (7, 1, 5, 8 and 11) which showed a high similarity with the reference ligand based on the calculated minimum distances and molecular fingerprint-based similarity (MFPSA) values.

2.7. ADMET Studies

Pharmacokinetics is one of the important indications about how drugs interact with the human body; from the previous study, analysis provides valuable insights into the pharmacological properties and predictive factors of the tested compounds. Differences in BBB permeability, solubility, absorption, hepatotoxicity, and predictive factors like CYP2D6 and PPB predictions are indicative of variations in how these compounds may interact with biological systems and exhibit pharmacological effects.
HPMCT was used as a reference drug in ADMET studies for the synthesized molecules using Discovery Studio 2019 software and the summarized results are shown in Figure 12 and listed in Table 8.
The toxicity data for a set of compounds (Comp. 111) reveal significant variations in the toxicological properties and carcinogenic potential of the tested compounds. Compounds (1, 4, 3, and 11) were classified as single carcinogens, indicating their potential to induce cancer. The remaining compounds (Comp. 2, 5, 6, 7, 8, 9, and 10) were categorized as non-carcinogens, suggesting a lower risk of carcinogenicity. There were variations in LD50 values among the compounds, with some compounds having a lower toxicity than others. Additionally, all compounds were classified as non-toxic in terms of developmental toxicity potential, suggesting they were not able to cause harm during development.

2.8. Toxic Effective

Toxic effective calculations of the synthesized compounds were examined by Discovery Studio 2019 software and listed in Table 9, which were founded on validated and assembled models as follows: FDA rat carcinogenicity [29,30], carcinogenic potency TD50 [31], rat maximum tolerated dose (MTD) [32,33], rat oral LD50 [34], rat chronic LOAEL [35,36], ocular irritancy [37], and skin [38].

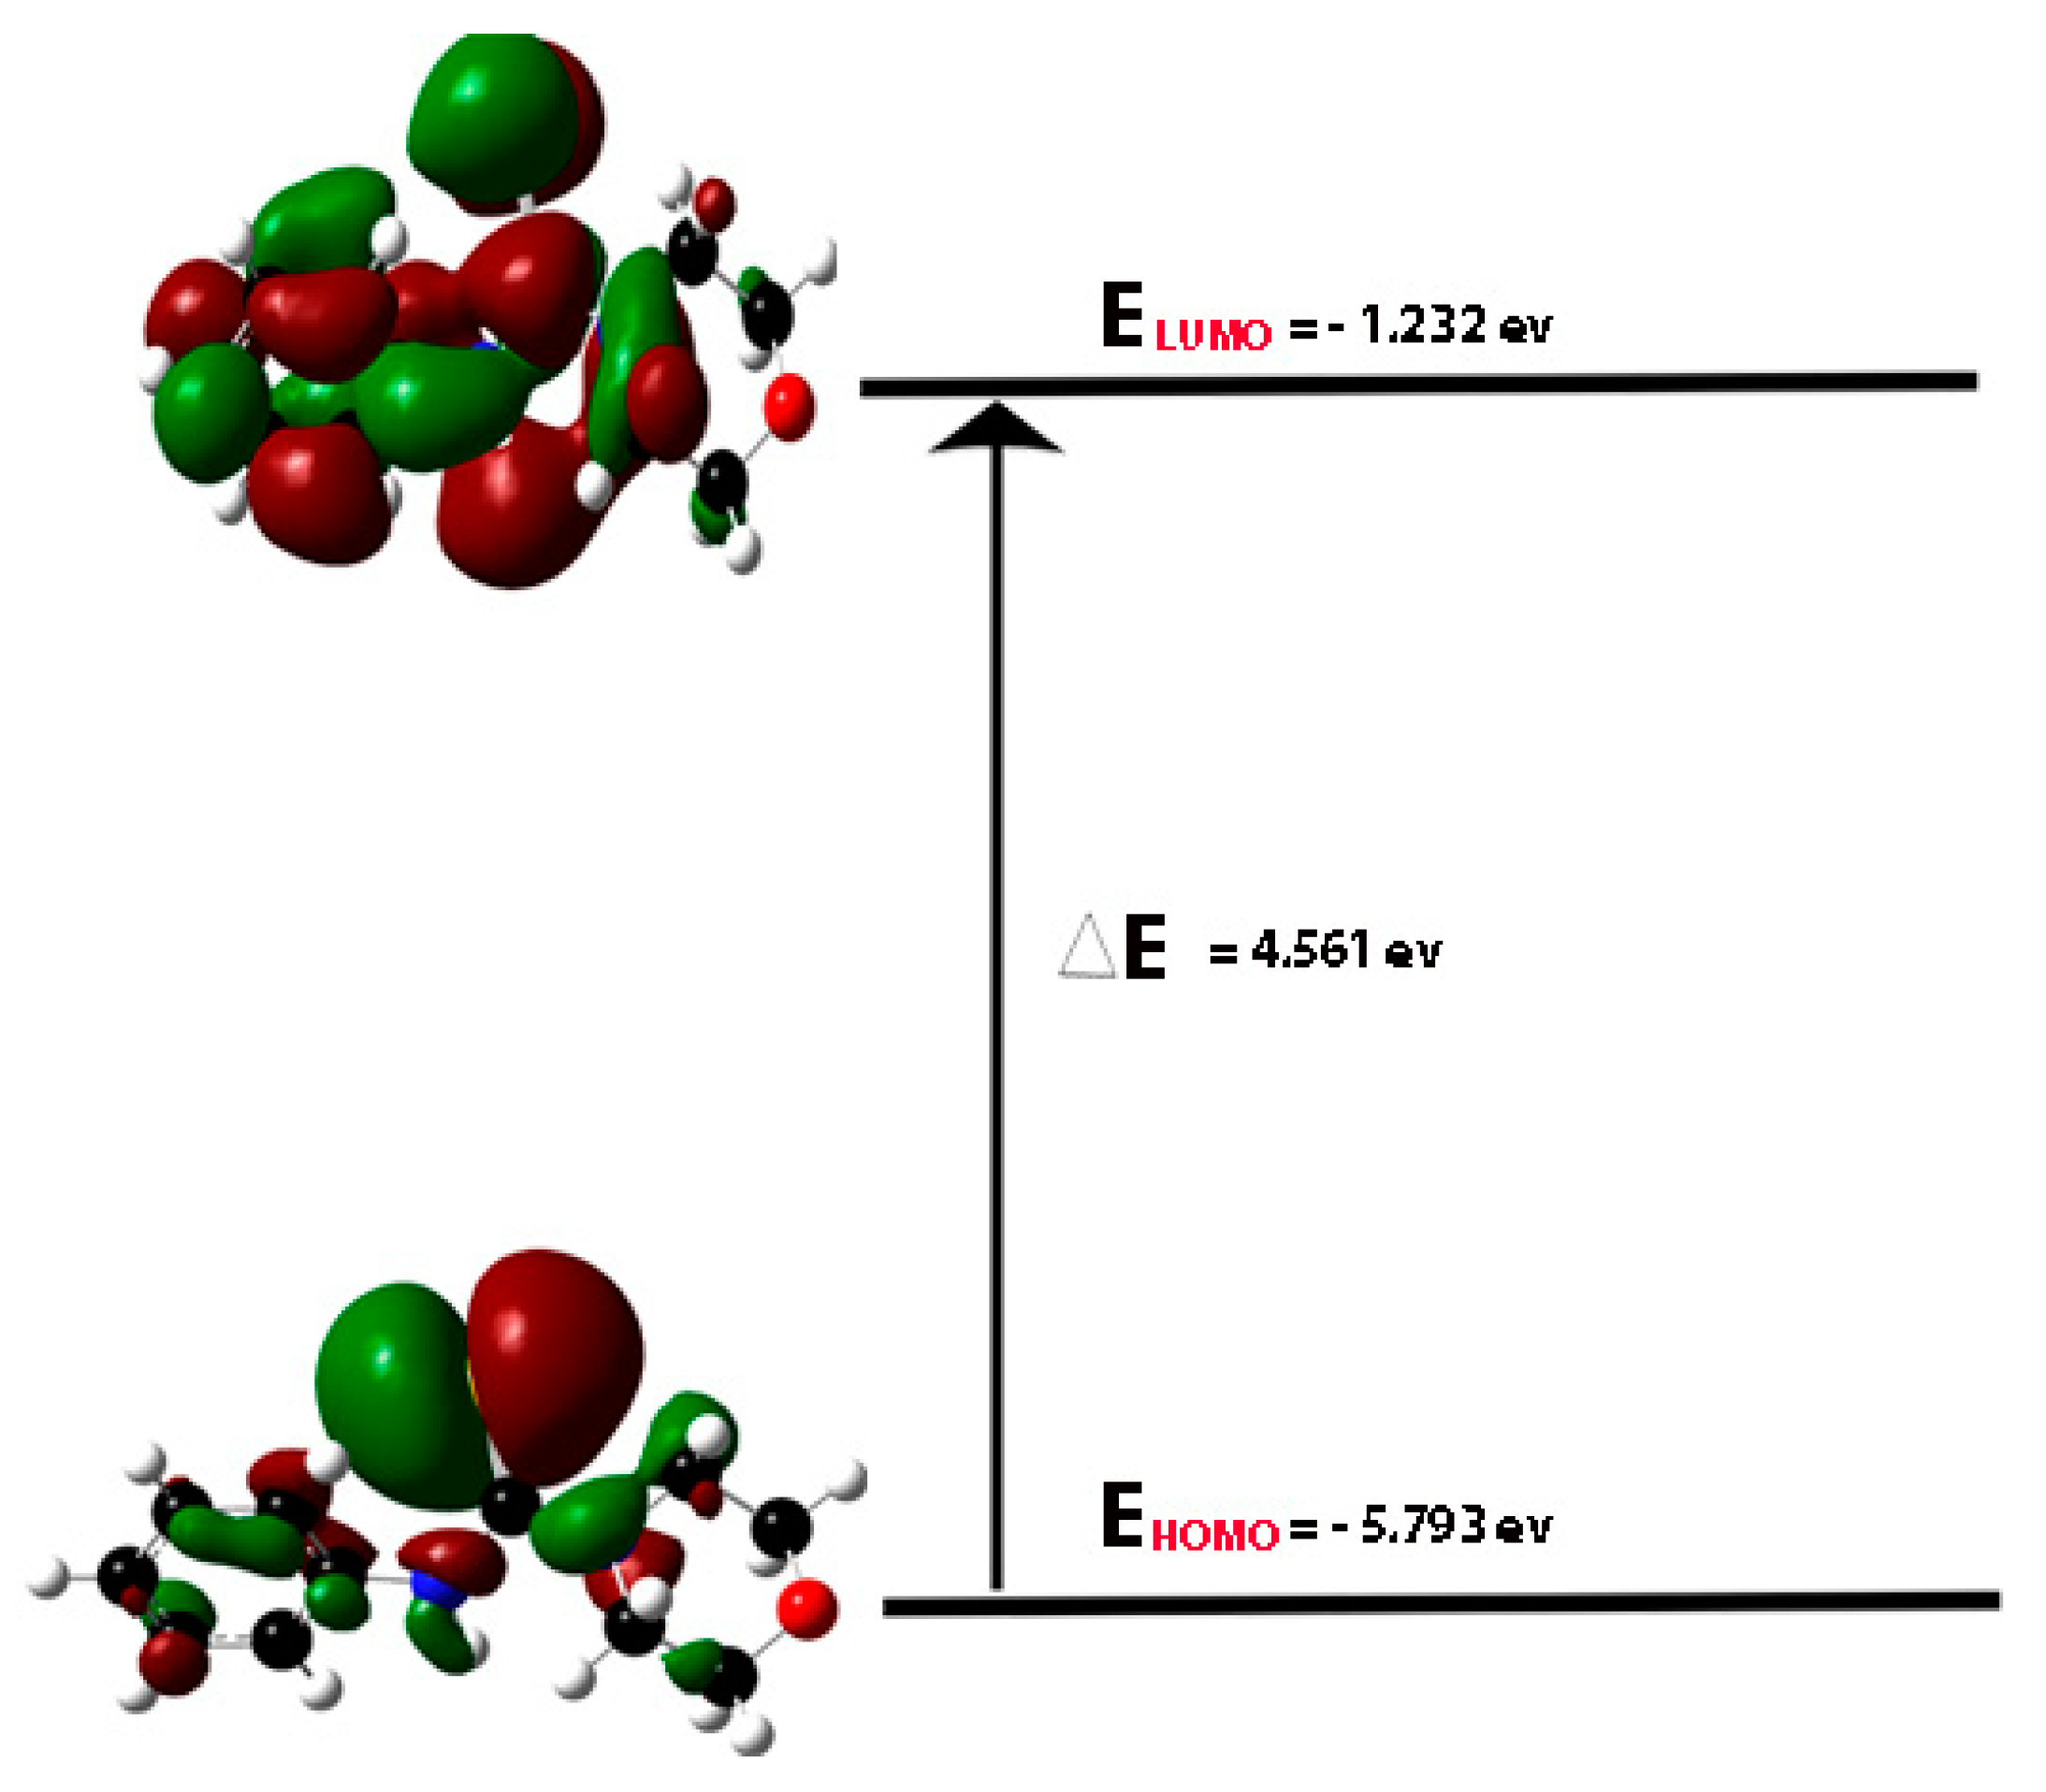
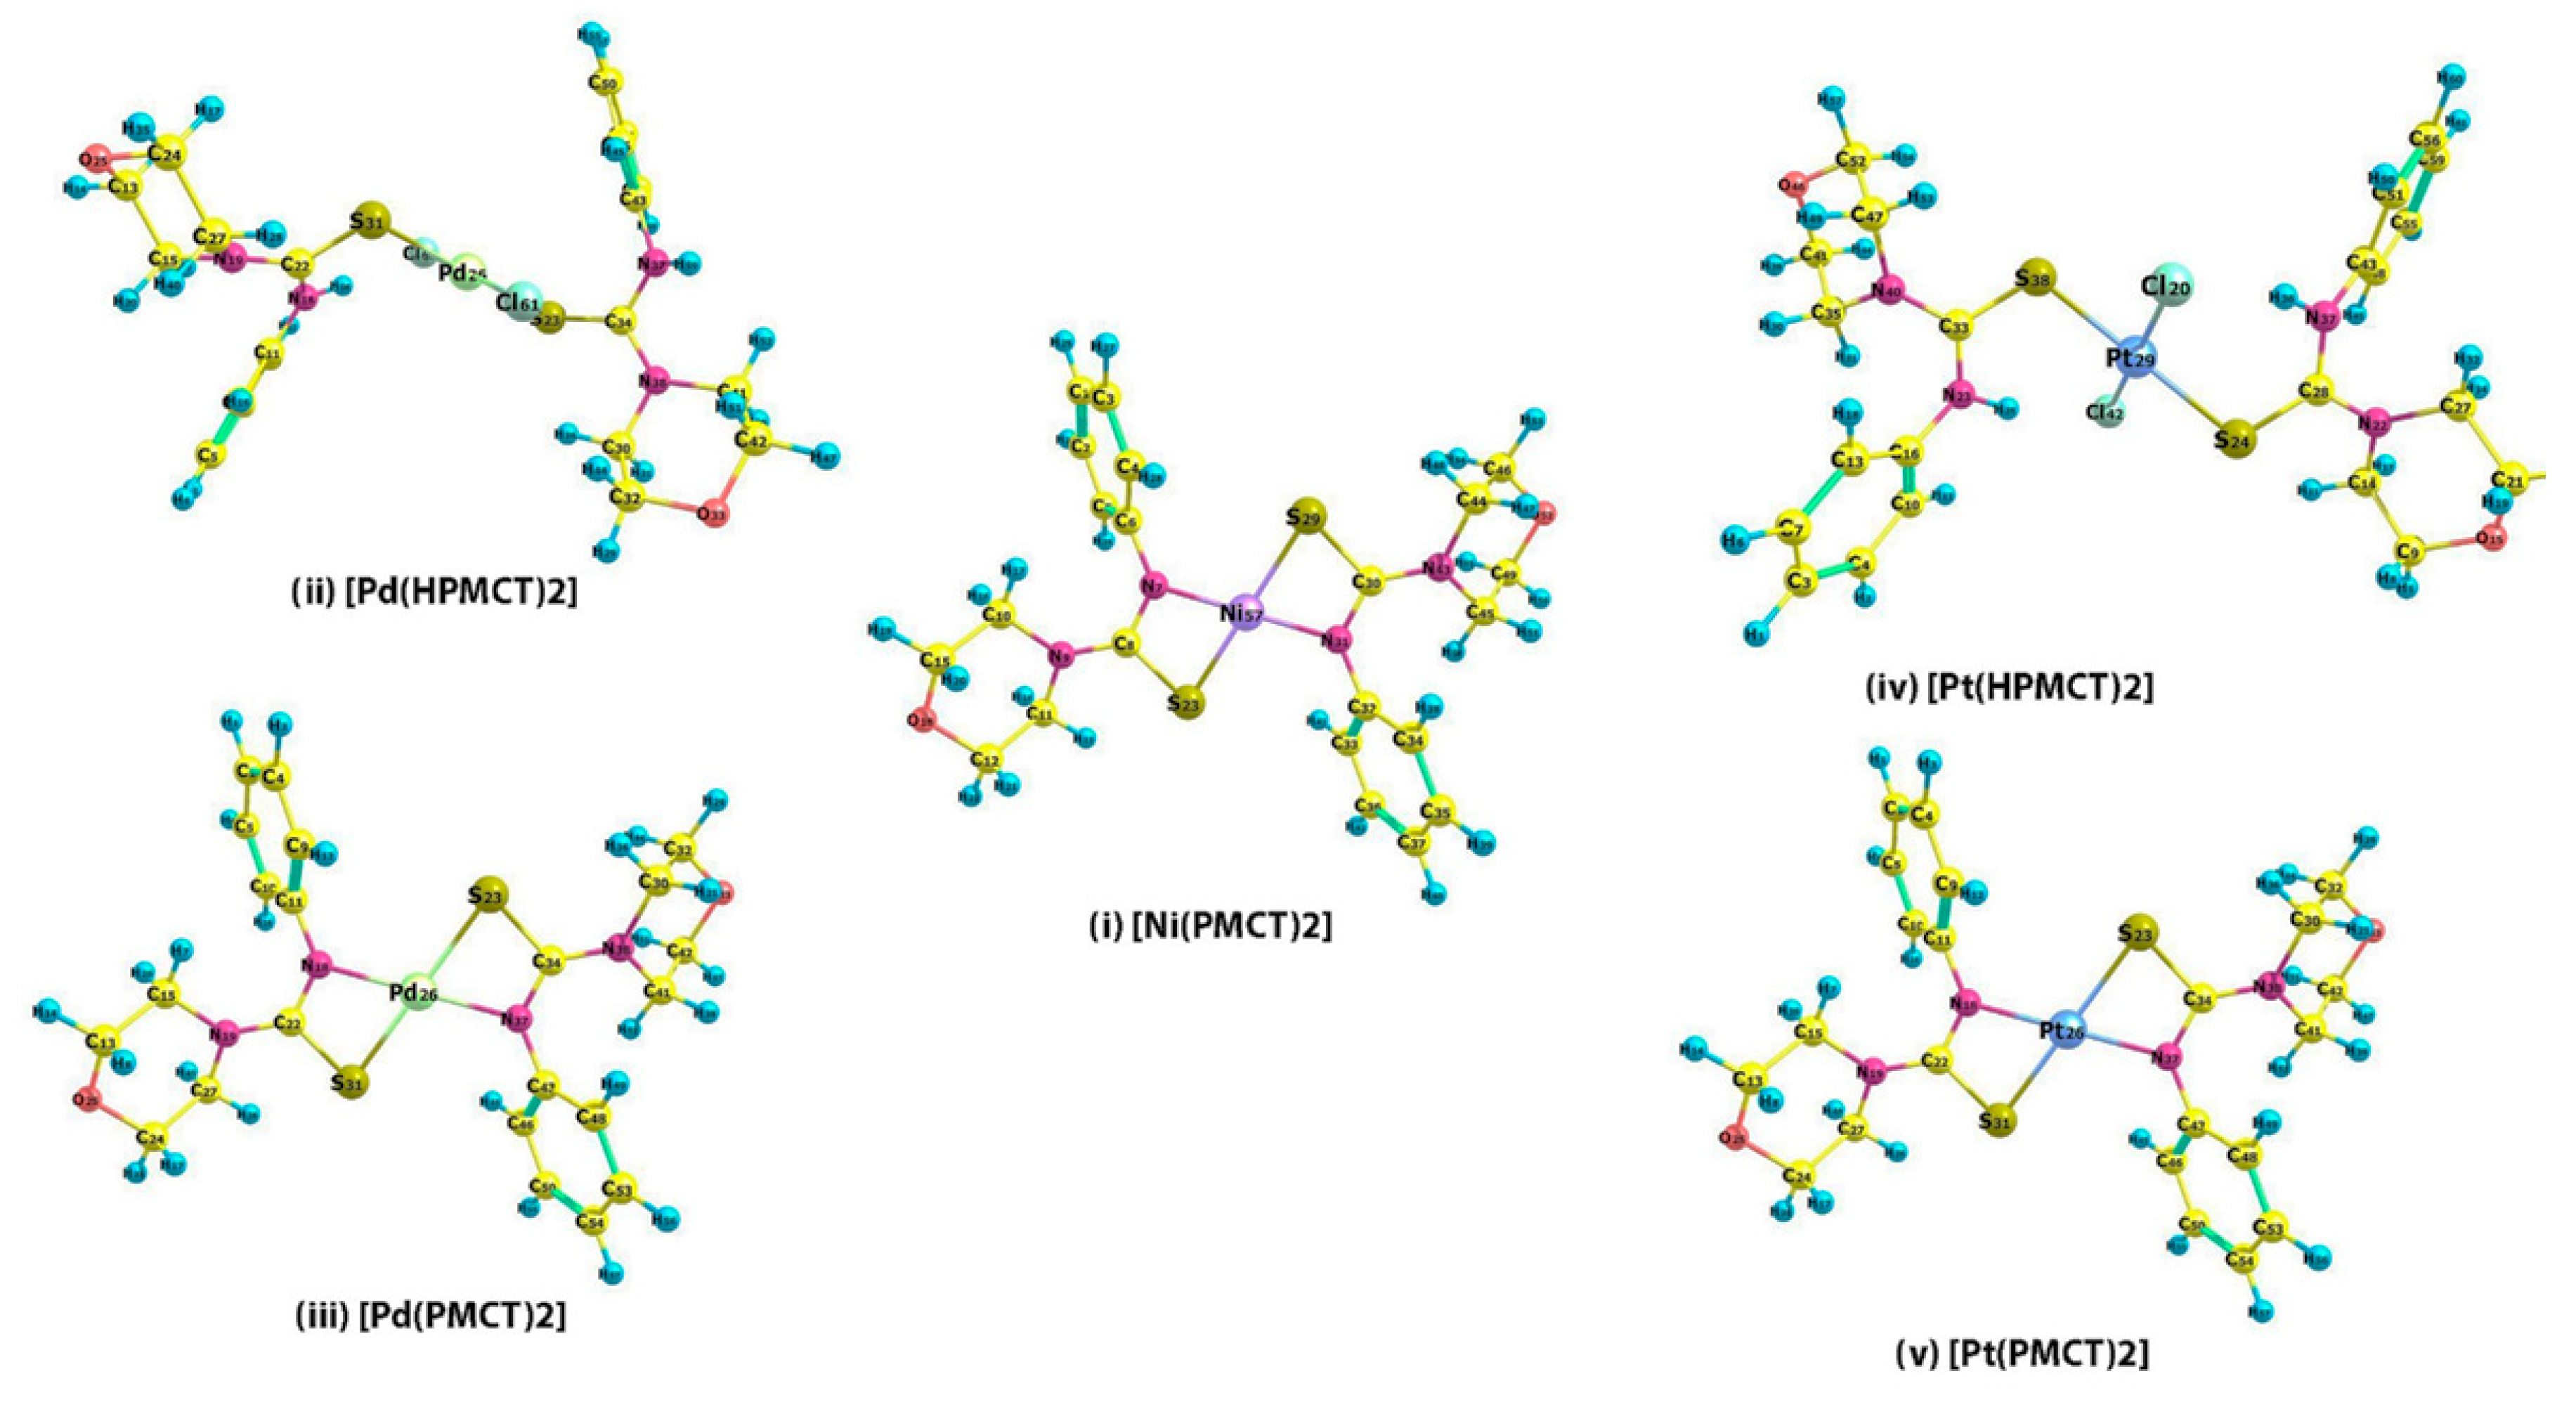
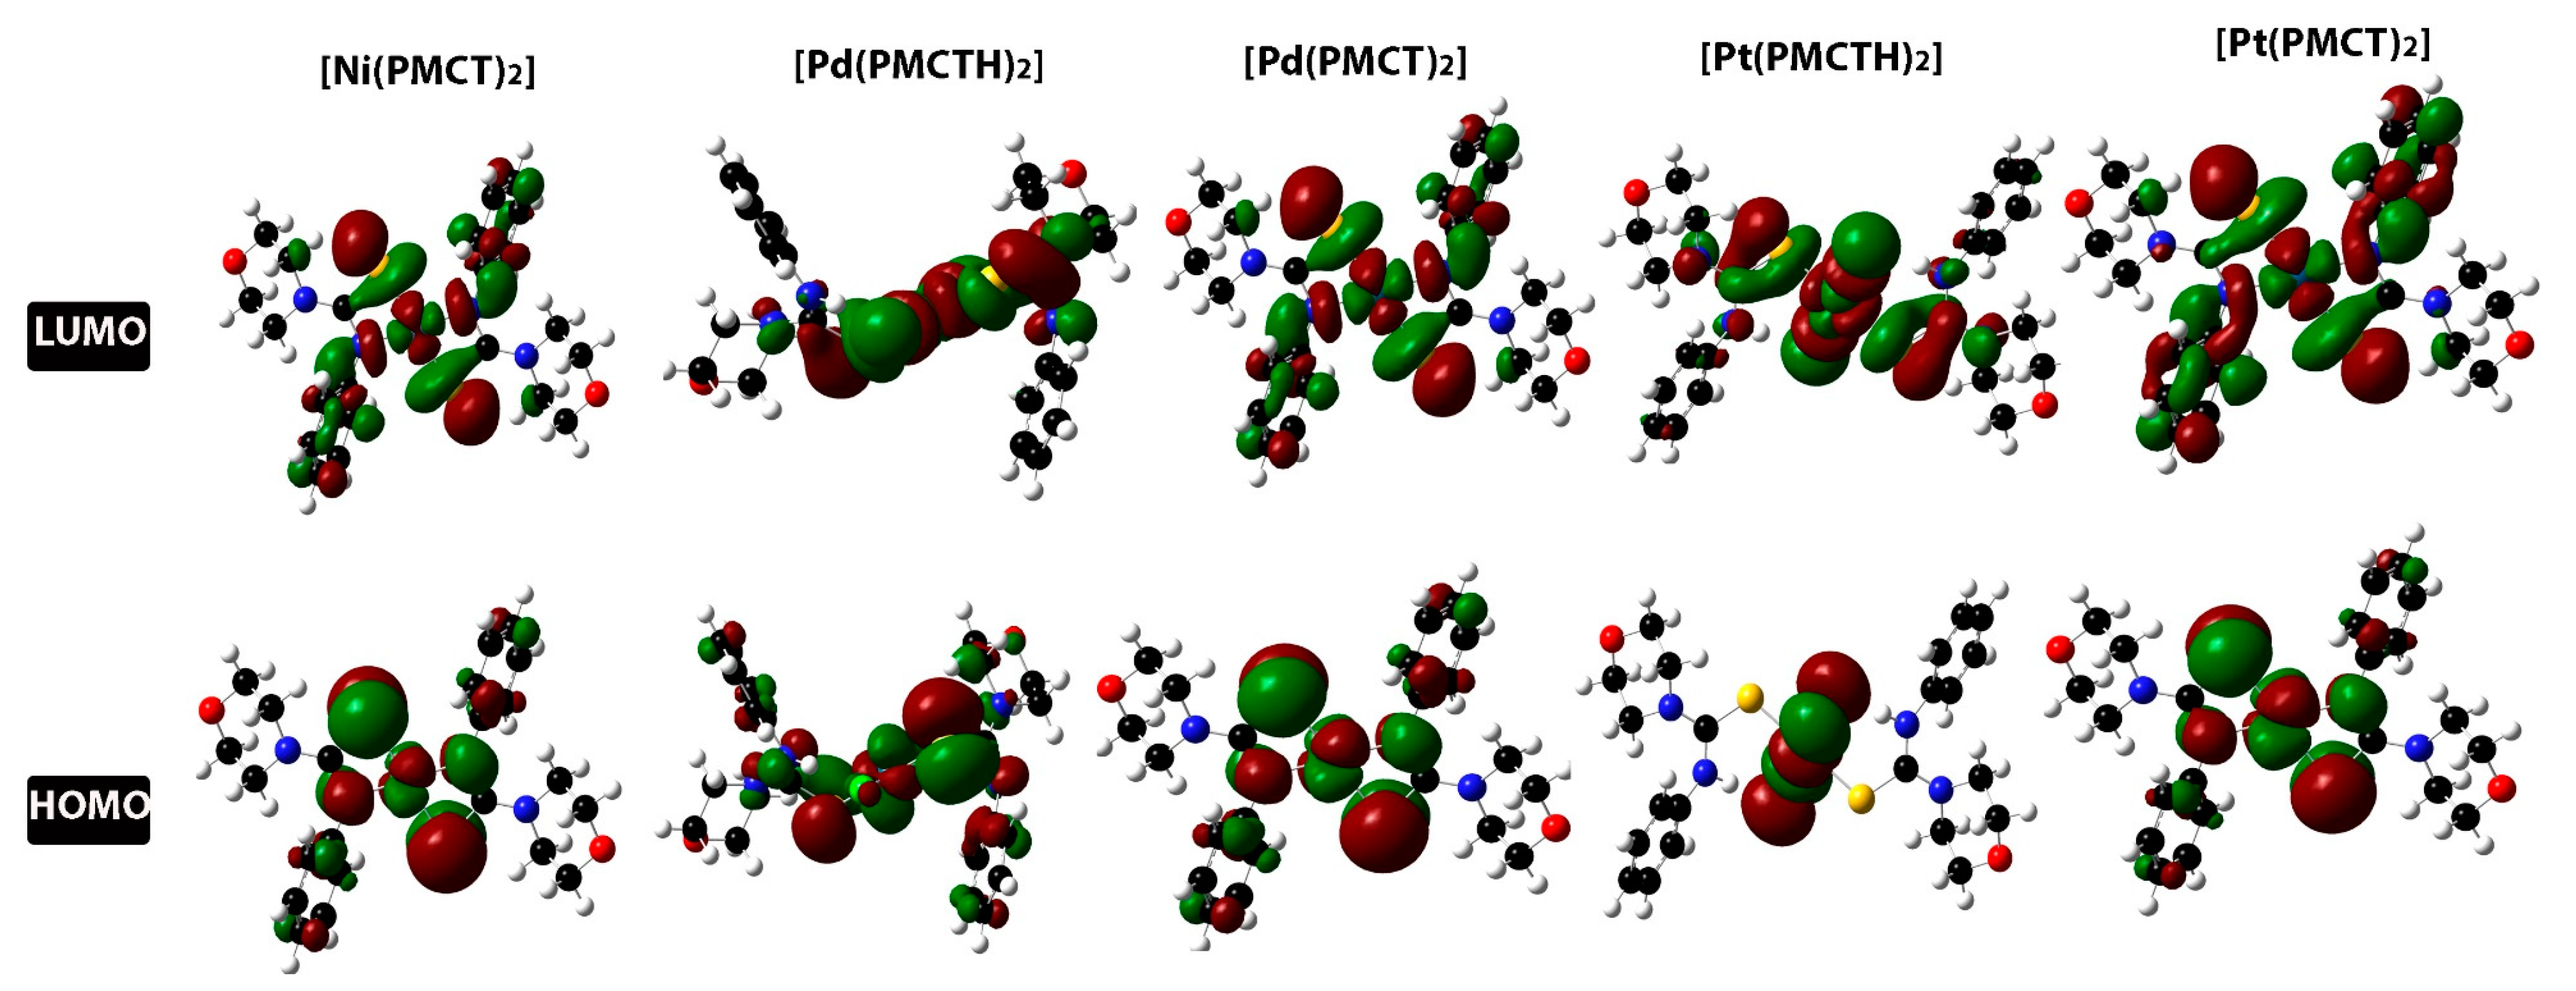
2.9. DFT Data Analysis

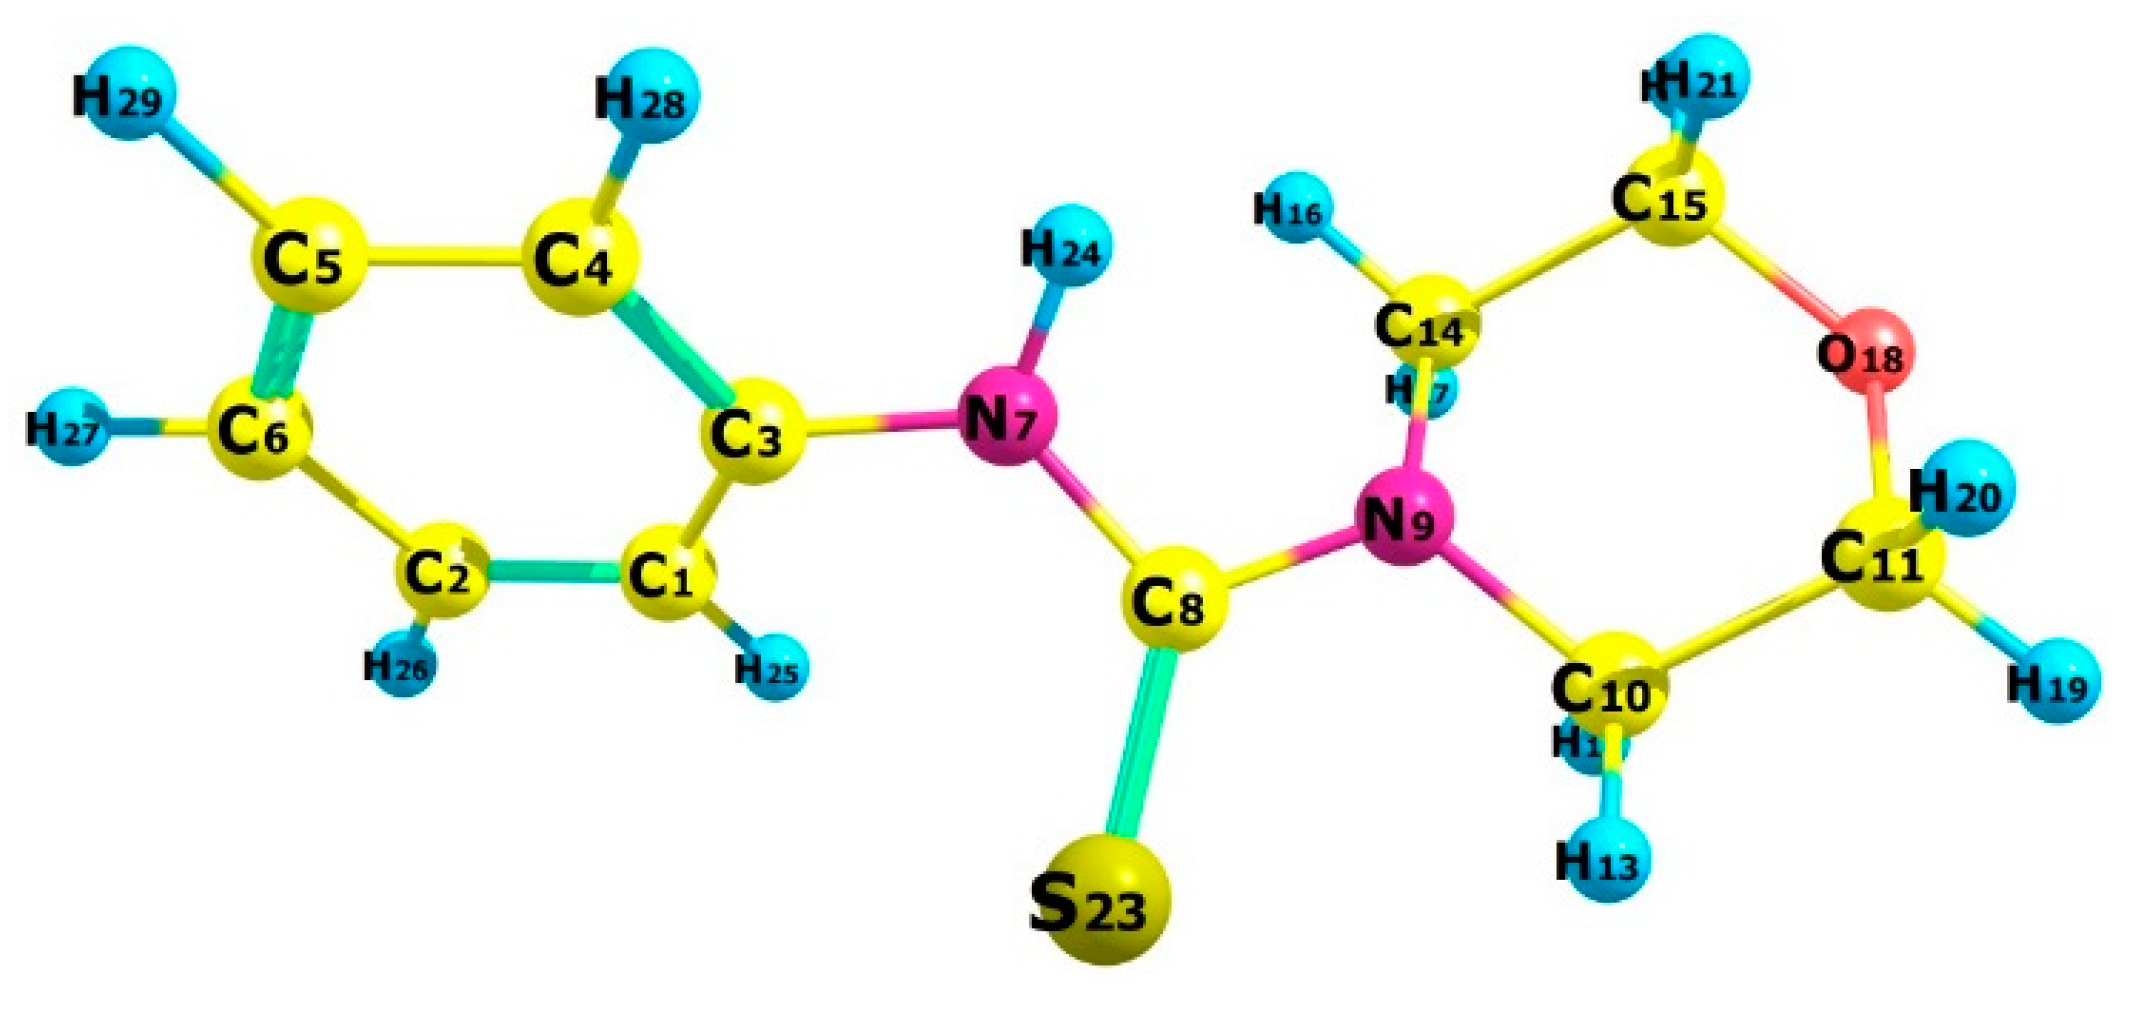
2.9.1. Geometry Optimization of HPMCT

The mother ligand N-Phenylmorpholine-4-carbothioamide (HPMCT) was optimized and its structure was determined (Figure 13). It was found that the total energy of the HMPCT is (−634,215.3996 Kcal/mol). Moreover, the energies of the HOMO and LUMO were found to be (−5.793 ev, −1.232 ev), respectively, while the energy gap difference was (4.561 ev) (Figure 14). Additionally, the two structures’ predicted electron affinity, ionization energy, dipole moment, and hardness values were 1.232, 5.793, 3.817 Debye, and 2.2805, respectively. Additionally, the bond lengths and angles for the HPMCT were assessed and contrasted with the experimental values. In the case of the (C=S) group, the bond distance is (1.67318 A), which is extremely near to the experimental result (1.690 A) [39]. The following bond distances were shown: (N7-C8 = 1.37945 Å, C10-N8 = 1.38048 Å, N7-C3 = 1.41745 Å, N9-C11 = 1.46629 Å). On the other hand, the angles of the following bonds were as shown: (S23-C8-N7 = 123.613, S23-C8-N9 = 123.463, N7-C8-N9 = 112.888 and C8-N9-C10 = 120.221).
In order to study the geometry changes, the structures of the synthesized complexes (59) were optimized (Figure 15 and Figure 16). Following complexation, each compound’s bond length, bond angles, and overall energy were examined (Table 10), with particular attention paid to elements like sulfur and nitrogen that are coordinated to the core metals. Two distinct traits can be seen in the resulting complexes. In the absence of a base, for instance, the geometric characteristics of the reaction between the ligand HPMCT and Pd(II) or Pt(II) demonstrate a mono coordination behavior of the ligand. In a basic media, however, the ligand forms a bidentate manner of attachment to the core metal. The center metal binds to the ligand via the sulfur atom in a neutral medium and to the sulfur and nitrogen atoms in a basic medium.
For Pd and Pt complexes in monodentate mode, the calculated bond length of C34-S23 is 1.738 Å and 1.727 Å, respectively, while for Pd and Pt complexes in bidentate mode, the calculated bond distance for C8-S23 is 1.769 Å. These numbers show that the CS group has a single bond character for the latter complex and a double bond character for the first complex. Further evidence for a resonance structure between the NCS moiety is provided by the bond distances of C8-N7, which are 1.333 Å for Pd and Pt, respectively, and 1.335 Å for Pd (Table 11).

2.9.2. Vibration Analysis

Calculated and experimental data were compared for the ligand and its complexes’ vibrational frequencies. In contrast to the experimental results, which showed the N-H stretching band to be present at 3176 cm−1, the ligand exhibits the unique N-H stretching band at 3140 cm−1. The four unique thioamide absorption bands also appeared at the following wavelengths: 1570 cm−1, 1350 cm−1, 1210 cm−1, and 550 cm−1 (supplementary data) [1,13,40]. The four thioamide absorption bands were discovered at 1530 cm−1, 1462 cm−1, 1211 cm−1, and 601 cm−1 in the experimental results. The neutral ligand is anticipated to maintain its absorption after complexation with minimal changes. For instance, the complex [MCl2(HPMCT)2] estimated FT-IR absorptions showed a strong peak at 3260 cm−1, which is in the N-H absorption band. At 1591 cm−1, 1450 cm−1, and 1210 cm−1, respectively, the thioamide absorptions were visible. On the other hand, the ligand coordinates to the central metal in a bidentate mode when it is deprotonated through its anionic sulfur and nitrogen atoms. According to theoretical vibrational frequencies, the [M(PMCT)2] complex does not absorb N-H in the range of 3000–3500 cm−1. Additionally, the (C=S) absorption band, which was seen between 1200 and 1300 cm−1, disappeared. The fact that the quantum calculations were carried out in the gas phase, excluding any input from the surrounding molecules and the solvent molecules, is the cause of the discrepancies between the experimental and theoretical values.

3. Experimental Part

3.1. Instrumental and Materials

All the reagents bought were of correct commercial fulfillment and have been utilized without purification. The ligand N-Phenylmorpholine-4-carbothioamide (HPMCT) was prepared following a modified protocol from the literature [19]. All chemical materials were obtained from Merck (USA), Alfa Aesar (China), and BDH (India) companies. Nuclear Magnetic resonance (NMR), Fourier-transform infrared spectroscopy (FT-IR), Mass, Ultra violet–Visible (Uv-vib.), XRD, and Scanning electronic microscope (SEM) techniques were used to characterize the synthesized complexes. The FT-IR spectra (KBr pellets; 400–4000 cm−1) were recorded on a Shimadzu FT-IR 8400 spectrophotometer, NMR spectra on a Bruker Advance II 400 MHz spectrometer, Tehran - Iran, and mass spectra on a Xevo G2-XS QT of Mass Spectrometer, Tehran - Iran. UV–Visible spectra were recorded on the Shimadzu UV–Vis spectrophotometer, Japan within the range of 200–1000 nm in dimethyl sulfoxide (DMSO).

3.2. Preparation of N-Phenylmorpholine-4-Carbothioamide (HPMCT)

To a stirred solution of morpholine (1.742 g, 20 mmol) in 40 mL ethanol, phenylisothiocyanate was added (2.700 g, 20 mmol). The reaction mixture was refluxed for 4 h, which resulted in a white solid. Cooled ethanol was used to wash the obtained solid after filtering, and then it was dried in a vacuum oven. White crystals (3.981 g, 90% yield) were obtained after recrystallization from ethanol.

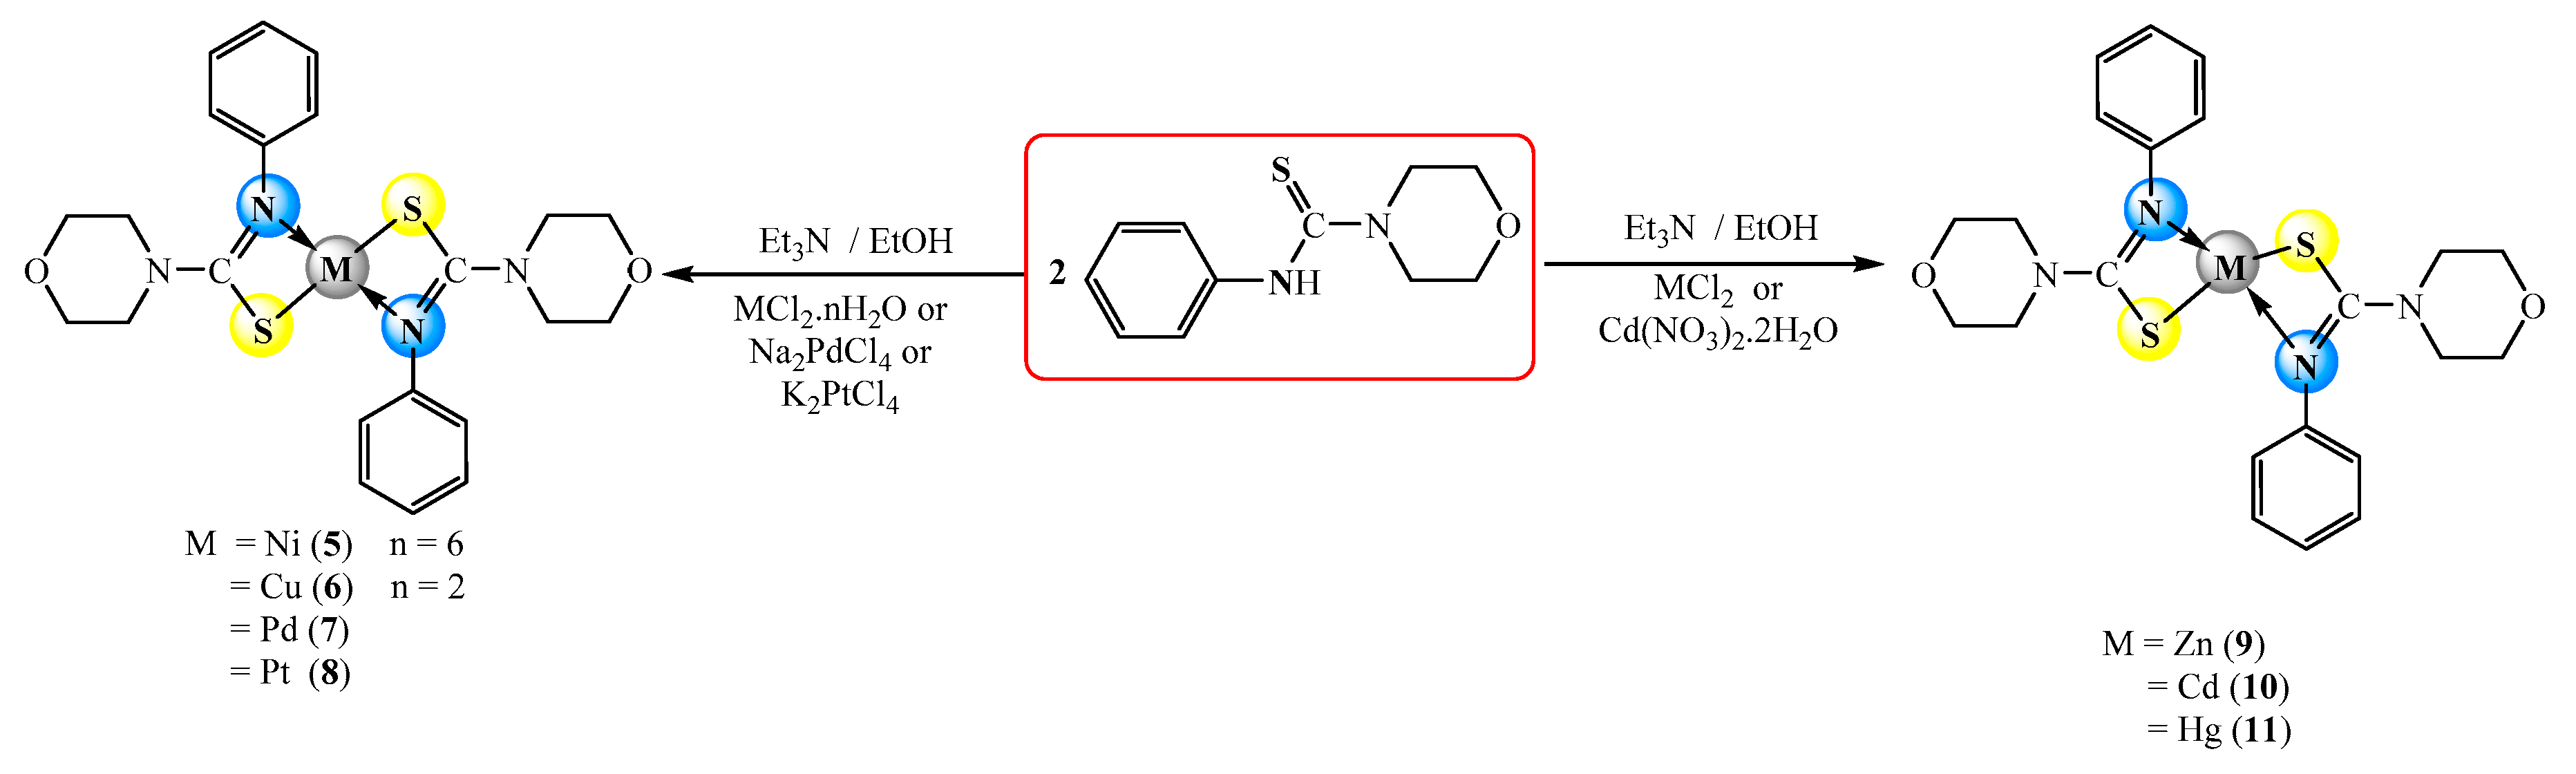
3.3. Synthesis of Complexes

3.3.1. General Procedure for the Synthesis of [MCl21S-HPMCT)2] (14)

An ethanolic solution (20 mL) of (HPMCT) (0.500 g, 2.200 mmol) was added to a solution of metal salts (CuCl2·2H2O, Na2PdCl4, K2PdCl4, and HgCl2) (1.100 mmol) in ethanol (15 mL) with stirring. The precipitate obtained from the filtrate of the stirred mixture was dried for 3 h, in a vacuum after washing with distilled H2O/EtOH.

3.3.2. Synthesis of [Ni(PMCT)2] (511)

An ethanolic solution (10 mL) of the HPMCT ligand (0.050 g, 0.210 mmol), containing some drops of triethyl amine, was added to an aqueous solution (10 mL) of NiCl2·6H2O (0.050 g, 0.210 mmol) with stirring. A light olive precipitate was formed. The mixture was stirred for 3 h, then filtered off, washed with ethanol and distilled water, and dried in a vacuum (yield: 0.05 g, 80%, m.p °C = 175–178). The following complexes were identified: [Cu(κ2S,N-mpt)2] (6), [Pd(κ2S,N-PMCT)2] (7), [Pt(κ2S,N-PMCT)2] (8), [Zn(κ2S,N-PMCT)2] (9), [Cd(κ2S,N-PMCT)2] (10), and [Hg(κ2S,N-PMCT)2] (11).

3.4. Antibacterial Studies

The antibacterial activities of the synthesized compounds were tested against three bacteria species, Escherichia coli, Staphylococcus aurous, and Klebsiella pneumoniae. At a 10−3 M concentration of the prepared complexes, these three bacteria species were used to study the antibacterial activity of the synthesized complexes. The result was in contrast with tetracycline as an effective antibiotic drug and DMSO as a negative control. The activity effect of the complexes used was examined using a technique called agar disc diffusion, which was first described by Bauer [41].

3.5. Anti-Cancer Studies

Cell Culture Conditions

The in vitro studies were conducted using a breast cancer cell line (MCF-7) (supplied by Mohamed Rajiue Center for Cell Culture, Isfahan, Iran). The MCF-7 cells were cultured in Eagle’s minimum essential medium (EMEM). And the medium was supplemented with 10% fetal bovine serum (FBS) (v/v) and 1% penicillin–streptomycin (100 units/mL–100 μg/mL) (v/v). Furthermore, the medium for MCF-7 cells was enriched with 2 mM glutamine and 1% non-essential amino acids (NEAA) (v/v). Cells were cultured at 37 °C in a humidified atmosphere with 5% CO2 (v/v).
The researchers tested the anti-tumor activity of free ligands (HPMCT) and their complexes (2,3) toward breast cell lines (MCF-7) using MTT (3-[4,5-dimethylthiazol-2-yl]-2,5-diphenyl-2H-tetrazolium bromide) as described by Tan et al. [24]. The results of the anti-cancer study of the free ligand and its complexes were compared with cis-platin.
Briefly, 0.8 × 10⁴ cells for the (MCF-7) cell line were seeded in different 96-well culture plates (Eppendorf Products Pvt. Ltd.) at the density of 1 × 10⁴ viable cells/well with Dulbecco’s Modified Eagle Medium (DMEM) and incubated overnight to allow cell adherence in the CO2 incubator. After 24 h of incubation, the spent medium was discarded, and the cells were incubated with different concentrations of each sample (0.01 to 100 µM) for 24 h. After 24 h, the drug-containing medium was discarded followed by the addition of 90 µL medium and 10 µL of 5 mg/mL MTT in Phosphate-buffer solution (PBS), pH 7.4, into each well of the plate followed by another 2 h of incubation at 37 °C. Then, the MTT dissolved in the medium was removed and 100 µL of DMSO was added to dissolve the MTT formosan crystals. Finally, the absorbance of samples was taken at 570 nm by a microplate reader and cytotoxicity was measured by using the percentage inhibition.

3.6. Molecular Docking

3.6.1. Preparation of Targeted Proteins

The site where bacteria tyrosinase attaches was produced using synthetic complexes that are in the shape of the protein [PDB codes: 6EI4 (https://www.rcsb.org, 21 August 2023)]. This was achieved with the help of software called MOE 19.0901. Initially, water molecules were deleted from the structure. Then, crystallographic disorders and empty valence atoms were corrected using protein reports and utility and smooth protein options. Protein energy was once minimized by making use of MMFF94 force fields. The inflexible shape of the binding site is created by making use of a fixed atom constraint. The protein essential amino acids are described and organized for the docking performance [42].

3.6.2. Preparation of Tested Ligands and Receptor

The 2D structures of the compounds have been drawn by using Chem-Bio Draw Ultra17.0 as an MDL-SD format; this file was opened with the aid of MOE 19.0901 software [43]. The 3D structure used was protonated, and the partial charge was fixed, and the energy used was minimized by making use of a 0.1 Root mean-square-deviation RMSD kcal/mol MMFF94 force field. Next, the minimized structures were prepared for docking using a ligand preparation protocol.

3.7. DFT Studies

All computations were carried out using the Gaussian 09 W software package [44]. The ligand and its complexes were successfully optimized by utilizing the B3LYP method [45,46,47], utilizing the 6-311++G(d,p) [48,49] basis set for the ligand while the SDD basis set was implemented for Pd and Pt atoms [50]. No symmetry constraints were applied during the geometry optimization [51]. The vibrational frequencies of each molecule have been determined at the same level of theory. The obtained structures were assessed in the Chemcraft v1.6 package [52] and GaussView 5.0.9 version [53].

4. Conclusions

We describe the synthesis, characterization, and in vitro antibacterial and cytotoxic activity of new 1-mropholyl-3phenyl thiourea ligands and associated metal complexes in this paper. The thiourea ligand coordinates as monodentate through a sulfur atom in Complexes (14), or as bidentate chelating in Complexes (511) where it coordinates to the central ions via N and S atoms. In comparison to the free ligand, all of the investigated compounds exhibit a good antibacterial effectiveness. Compounds (2) and (3) are observed as having a good cytotoxic activity against MCF-7 cell lines with appropriate IC50 values, respectively. The bioactivities of the produced compounds range from modest to good; however, by adding active groups to the ligand structure, new and more potent thiourea derivatives can be created. The prepared compounds exhibited diverse binding modes, involving interactions like π-alkyl, π-π, π-cation, and hydrogen bonding with key amino acid residues within the enzyme’s active site. The compounds also showed a high similarity with the reference ligand based on the calculated minimum distances and MFPSA values. Moreover, DFT calculations were also performed for Complexes (59) showing bond distance and bond angle changes upon complexation between the metal and the ligand. As expected, the five complexes adopt a square planar geometry with the metal being centered. The calculated vibrational frequencies of the five complexes showed similar absorption bands to those of the reported results.

Supplementary Materials

The following supporting information can be downloaded at: https://www.mdpi.com/article/10.3390/inorganics11100390/s1, Figure S1: IR spectrum of complex HPMCT ligand, Figure S1A: Theoretical IR spectrum of complex HPMCT ligand, Figure S2: IR spectrum of complex 1, Figure S3: IR spectrum of complex 2, Figure S3A: Theoretical: IR spectrum of complex 2, Figure S4: IR spectrum of complex 3, Figure S4A: Theoretical: IR spectrum of complex 3, Figure S5: IR spectrum of complex 4, Figure S6: IR spectrum of complex 5, Figure S6A: Theoretical: IR spectrum of complex 5, Figure S7: IR spectrum of complex 6, Figure S8: IR spectrum of complex 7, Figure S7A: Theoretical: IR spectrum of complex 7, Figure S9: IR spectrum of complex 8, Figure S9A: Theoretical: IR spectrum of complex 8, Figure S9: IR spectrum of complex 9, Figure S10: IR spectrum of complex 10, Figure S11: IR spectrum of complex 11, Figure S12: 1H NMR spectrum of HPMCT, Figure S13: 1H NMR spectrum of complex 2, Figure S14: 1H NMR spectrum of complex 3, Figure S15: 1H NMR spectrum of complex 4, Figure S16: 1H NMR spectrum of complex 7, Figure S17: 1H NMR spectrum of complex 8, Figure S18: 1H NMR spectrum of complex 10, Figure S19: 1H NMR spectrum of complex 11, Figure S20: 13C NMR spectrum of HPMCT, Figure S21: 13 C NMR spectrum of complex 4, Figure S22: 13 C NMR spectrum of complex 11.

Author Contributions

A.S.M.A.-J.: Supervision, writing—review and editing. A.T.F.A.-H., A.A.H., A.S.F., T.A.Y., M.M.A.-K., M.H.A. and A.M.S.: Conceptualization, methodology, investigation, data curation, writing—review and editing, software, investigation, data curation. All authors have read and agreed to the published version of the manuscript.

Funding

The authors extend their appreciation to the Deputyship for Research and Innovation, Ministry of Education in Saudi Arabia, for funding this research through the project number IFP-IMSIU-2023004. The authors also appreciate the Deanship of Scientific Research at Imam Mohammad Ibn Saud Islamic University (IMSIU) for supporting and supervising this project.

Data Availability Statement

The data that support the findings of this study are available from the corresponding author upon reasonable request.

Acknowledgments

The authors extend their appreciation to the Deputyship for Research & Innovation, Ministry of Education in Saudi Arabia, for funding this research through the project number IFP-IMSIU-2023004. The authors also appreciate the Deanship of Scientific Research at Imam Mohammad Ibn Saud Islamic University (IMSIU) and Tikrit University for supporting and supervising this project.

Conflicts of Interest

The authors declare that they have no known competing financial interest or personal relationships that could have appeared to influence the work reported in this paper.

References

  1. Faihan, A.S.; Al-Jibori, S.A.; Hatshan, M.R.; Al-Janabi, A.S. Antibacterial, spectroscopic and X-ray crystallography of newly prepared heterocyclic thiourea dianion platinum (II) complexes with tertiary phosphine ligands. Polyhedron 2022, 212, 115602. [Google Scholar] [CrossRef]
  2. Faihan, A.S.; Al-Jibori, S.A.; Al-Janabi, A.S. Novel base-free dianion complexes of Pt (II) and Pd (II) derived from heterocyclic thiourea and tertiary phosphine ligands. J. Mol. Struct. 2022, 1251, 131966. [Google Scholar] [CrossRef]
  3. Bharati, P.; Bharti, A.; Maiti, M.K.B.; Butcher, R.J.; Singh, N.K. Square planar Ni(II) complexes of pyridine-4-carbonyl-hydrazine carbodithioate, 1-phenyl-3-pyridin-2-yl-isothiourea and 4-(2-methoxyphenyl)piperazine-1-carbodithioate involving N–S bonding: An approach to DFT calculation and thermal studies. Polyhderon 2013, 63, 156–166. [Google Scholar] [CrossRef]
  4. Al-Jibori, S.A.; Dayaaf, N.A.; Mohammed, M.Y.; Merzweiler, K.; Wagner, C.; Hogarth, G.; Richmond, M.G. cis–trans Isomerism at Square-Planar MN2S2 Centers (M = Pd, Pt): Crystal Structures of N-Phenyl-N-(2-thiazoyl)thiourea Complexes trans-Pd(S2N3C10H8)2 and cis-Pt(S2N3C10H8)2 and Density Functional Calculations. J. Chem. Crystallogr. 2013, 43, 365–372. [Google Scholar] [CrossRef]
  5. Yousef, T.A.; Alduaij, O.K.; El-Reash, G.M.A.; El Morshedy, R.M. Semiempirical studies, spectral analysis, in vitro antibacterial and DNA degradation studies of heterocyclic thiosemicarbazone ligand and its metal complexes. J. Mol. Liq. 2016, 222, 762–776. [Google Scholar] [CrossRef]
  6. Yousef, T.A.; El-Reash, G.M.A. Synthesis, and biological evaluation of complexes based on thiosemicarbazone ligand. J. Mol. Struct. 2020, 1201, 127180. [Google Scholar] [CrossRef]
  7. Al-Hayaly, L.J.; Abdullah, B.H.; Aldulaimi, A.A.N.; Al-Jibori, S.A. Palladium(II) and Platinum(II) complexes containing the mixed ligands N-phenyl-N-(2-pyridyl or 2-methylpyridyl) thiourea and diphosphines Ph2P(CH2)nPPh2 (n = 1–4). Orient. J. Chem. 2008, 24, 381–388. [Google Scholar]
  8. Fun, H.K.; Razak, I.A.; Pakawatchai, C.; Khaokong, C.; Chantrapromma, S.; Sajthong, S. Tris(N,N′-diethylthiourea-S)iodocopper(I) and Tris(N,N′-diethylthiourea-S)iodosilver(I). Acta Cryst. C 1998, 54, 453–456. [Google Scholar] [CrossRef]
  9. Henderson, W.; Nicholson, B.K.; Dinger, M.B.; Bennett, R.L. Thiourea monoanion and dianion complexes of rhodium(III) and ruthenium(II). Inorg. Chim. Acta 2002, 338, 210. [Google Scholar] [CrossRef]
  10. Bodensieck, U.; Carraux, Y.; Stoeckli-Evans, H.; Suss-Fink, G. Tris(N,N′-diphenylthioureato)-chromium(III). Inorg. Chem. Acta 1992, 195, 135–137. [Google Scholar] [CrossRef]
  11. Kitagawa, S.; Munakata, M.; Shimono, H.; Matsuyama, S. Synthesis and crystal structure of hexanuclear copper(I) complexes of µ3-pyridine-2-thionate. Dalton Trans. 1990, 2105. [Google Scholar] [CrossRef]
  12. Kodomari, M.; Suzuki, M.; Tanigawa, K.; Aoyama, T. A convenient and efficient method for the synthesis of mono- and N,N-disubstituted thioureas. Tetrahedron Lett. 2005, 46, 5841–5843. [Google Scholar] [CrossRef]
  13. Faihan, A.S.; Hatshan, M.R.; Alqahtani, A.S.; Nasr, F.A.; Al-Jibori, S.A.; Al-Janabi, A.S. New divalent metal ion complexes with 1,8-diaminonapthalene-2-thione: Synthesis, Spectroscopic, anti-bacterial and anticancer activity studies. J. Mol. Struct. 2022, 1247, 131291. [Google Scholar] [CrossRef]
  14. Veale, E.B.; Tocci, G.M.; Gunnlaugsson, T. Demonstration of bidirectional photoinduced electron transfer (PET) sensing in 4-amino-1,8-naphthalimide based thiourea anion sensors. Org. Biomol Chem. 2009, 7, 3447–3454. [Google Scholar] [CrossRef] [PubMed]
  15. Gopiraman, M.; Selvakumaran, N.; Kesavan, D.; Kim, I.S.; Karvembu, R. Chemical and Physical Interactions of 1-Benzoyl-3,3-Disubstituted Thiourea Derivatives on Mild Steel Surface: Corrosion Inhibition in Acidic Media. Ind. Eng. Chem. Res. 2012, 51, 7910–7922. [Google Scholar] [CrossRef]
  16. Ren, J.S.; Diprose, J.; Warren, J.; Esnouf, R.M.; Bird, L.E.; Ikemizu, S.; Slater, M.; Milton, J.; Balzarini, J.; Stuart, D.L.; et al. Phenylethylthiazolylthiourea (PETT) Non-nucleoside Inhibitors of HIV-1 and HIV-2 Reverse Transcriptases: STRUCTURAL AND BIOCHEMICAL ANALYSES. J. Biol. Chem. 2000, 275, 5633–5639. [Google Scholar] [CrossRef] [PubMed]
  17. Sayala, C.; Willemse, W.P.; Cras, J.A. Nickel(II) complexes of deprotonated thiourea; Crystal structure of Ni[(C6H5)NC(S)N{(C2H4)2O}]2. Recl. J. Neth. Chem. Soc. 1980, 99, 356–369. [Google Scholar]
  18. Yuen, H.Y.; Henderson, W.; Oliver, A.G. Nickel(II) complexes of di- and tri-substituted thiourea mono- and di-anions. Inorg. Chim. Acta 2011, 368, 1–5. [Google Scholar] [CrossRef]
  19. Faihan, A.S.; Hatshan, M.R.; Kadhim, M.M.; Alqahtani, A.S.; Nasr, F.A.; Saleh, A.M.; Al-Jibori, S.A.; Al-Janabi, A.S. Synthesis, spectroscopic, crystallographic, quantum and molecular docking investigations of cis-4,5-diphenylimidazolidine-2-thione. J. Mol. Struct. 2022, 1252, 132198. [Google Scholar] [CrossRef]
  20. Geary, W.J. The use of conductivity measurements in organic solvents for the characterisation of coordination compounds. Coord. Chem. Rev. 1971, 7, 81. [Google Scholar] [CrossRef]
  21. Rahman, F.U.; Bibi, M.; Altaf, A.A.; Tahir, M.N.; Farhat-Ullah, D.; Ur-Rehman, Z.; Khan, E.J. Zn, Cd and Hg complexes with unsymmetric thiourea derivatives; syntheses, free radical scavenging and enzyme inhibition essay. Mol. Struct. 2020, 1211, 128096. [Google Scholar] [CrossRef]
  22. Patterson, A. The Scherrer Formula for X-Ray Particle Size Determination. Phys. Rev. 1939, 56, 978–982. [Google Scholar] [CrossRef]
  23. Bai, W.J.; Ji, J.X.; Huang, Q.; Wei, W. Synthesis and evaluation of new thiourea derivatives as antitumor and antiangiogenic agents. Tetrahedron Lett. 2020, 61, 152366. [Google Scholar] [CrossRef]
  24. Tan, C.H.; Sim, D.S.Y.; Heng, M.P.; Lim, S.H.; Low, Y.Y.; Kam, T.S.; Sim, K.S. Evaluation of DNA Binding and Topoisomerase I Inhibitory Activities of 16’-Decarbomethoxydihydrovoacamine from Tabernaemontana corymbosa. Chem. Sel. 2020, 5, 14839–14843. [Google Scholar] [CrossRef]
  25. Hagras, M.; El Deeb, M.A.; Elzahabi, H.S.; Elkaeed, E.B.; Mehany, A.B.; Eissa, I.H.J.J.O.E.I. Discovery of new quinolines as potent colchicine binding site inhibitors: Design, synthesis, docking studies, and anti-proliferative evaluation. J. Enzym. Inhib. Med. Chem. 2021, 36, 640–658. [Google Scholar] [CrossRef]
  26. Eissa, H.; Dahab, M.A.; Ibrahim, M.K.; Alsaif, N.A.; Alanazi, A.; Eissa, S.I.; Mehany, A.B.; Beauchemin, A.M.J.B.C. Design and discovery of new antiproliferative 1, 2, 4-triazin-3 (2H)-ones as tubulin polymerization inhibitors targeting colchicine binding site. Bioorg. Chem. 2021, 112, 104965. [Google Scholar] [CrossRef]
  27. Alanazi, M.M.; Eissa, I.H.; Alsaif, N.A.; Obaidullah, A.J.; Alanazi, W.A.; Alasmari, A.F.; Albassam, H.; Elkady, H.; Elwan, A.J.J.O.E.I. Design, synthesis, docking, ADMET studies, and anticancer evaluation of new 3-methylquinoxaline derivatives as VEGFR-2 inhibitors and apoptosis inducers. J. Enzym. Inhib. Med. Chem. 2021, 36, 1760–1782. [Google Scholar] [CrossRef]
  28. Yousef, R.G.; Sakr, H.M.; Eissa, I.H.; Mehany, A.B.; Metwaly, A.M.; Elhendawy, M.A.; Radwan, M.M.; ElSohly, M.A.; Abulkhair, H.S.; El-Adl, K.J.N.J.O.C. New quinoxaline-2 (1 H)-ones as potential VEGFR-2 inhibitors: Design, synthesis, molecular docking, ADMET profile and anti-proliferative evaluations. New J. Chem. 2021, 45, 16949–16964. [Google Scholar] [CrossRef]
  29. Xia, X.; Maliski, E.G.; Gallant, P.; Rogers, D.J. Classification of kinase inhibitors using a Bayesian model. J. Med. Chem. 2004, 47, 4463–4470. [Google Scholar] [CrossRef]
  30. BIOVIA. QSAR, ADMET and Predictive Toxicology. Available online: https://www.3dsbiovia.com/products/collaborative-science/biovia-discovery-studio/qsar-admet-and-predictive-toxicology.html (accessed on 23 July 2022).
  31. Venkatapathy, R.; Wang, N.C.Y.; Martin, T.M.; Harten, P.F.; Young, D. Structure–Activity Relationships for Carcinogenic Potential. Gen. Appl. Syst. Toxicol. 2009, 234, 209–221. [Google Scholar] [CrossRef]
  32. Goodrnan, G.; Wilson, R. Comparison of the dependence of the TD50 on maximum tolerated dose for mutagens and nonmutagens. Risk Anal. 1992, 12, 525–533. [Google Scholar] [CrossRef]
  33. National Research Council (US). Correlation between carcinogenic potency and the maximum tolerated dose: Implications for risk assessment. In Issues in Risk Assessment; National Academies Press (US): Washington, DC, USA, 1993. [Google Scholar]
  34. Diaza, R.G.; Manganelli, S.; Esposito, A.; Roncaglioni, A.; Manganaro, A.; Benfenati, E. Comparison of in silico tools for evaluating rat oral acute toxicity. SAR QSAR Environ. Res. 2015, 26, 1–27. [Google Scholar] [CrossRef]
  35. Pizzo, F.; Benfenati, E. Silico Methods for Predicting Drug Toxicity; Springer: Berlin/Heidelberg, Germany, 2016; Volume 163. [Google Scholar]
  36. Venkatapathy, R.; Moudgal, C.J.; Bruce, R.M. Assessment of the oral rat chronic lowest observed adverse effect level model in TOPKAT, a QSAR software package for toxicity prediction. J. Chem. Inf. Comput. Sci. 2004, 44, 1623. [Google Scholar] [CrossRef]
  37. Alesawy, M.S.; Elkaeed, E.B.; Alsfouk, A.A.; Metwaly, A.M.; Eissa, I.H. In silico screening of semi-synthesized compounds as potential inhibitors for SARS-CoV-2 papain-like protease: Pharmacophoric features, molecular docking, ADMET, toxicity and DFT studies. Molecules 2021, 26, 6593. [Google Scholar] [CrossRef]
  38. Eissa, I.H.; Alesawy, M.S.; Saleh, A.M.; Elkaeed, E.B.; Alsfouk, B.A.; El-Attar, A.-A.M.; Metwaly, A.M. Ligand and structure-based in silico determination of the most promising SARS-CoV-2 nsp16-nsp10 2′-o-Methyltransferase complex inhibitors among 3009 FDA approved drugs. Molecules 2022, 27, 2287. [Google Scholar] [CrossRef]
  39. Okuniewski, A.; Chojnacki, J.; Becker, B. N, N′-Diphenylthiourea acetone monosolvate. Acta Cryst. E 2011, 67, o55. [Google Scholar] [CrossRef]
  40. Creighton, J.R.; Gardiner, D.S.; Grovin, A.C.; Gutteridge, C.; Jackson, A.R.W.; Raper, E.S.; Sherwood, P.M.A. Copper (I) halide complexes of imidazole thiones: Crystal structure of dimeric monochloro bis (1-methylimidazoline-2-thione) copper (I). Inorg. Chim. Acta 1985, 103, 195. [Google Scholar] [CrossRef]
  41. Bauer, A.W. Single-disk antibiotic-sensitivity testing of staphylococci: An analysis of technique and results. Arch. Intern. Med. 1959, 104, 208. [Google Scholar] [CrossRef]
  42. Abbass, E.M.; Khalil, A.K.; Mohamed, M.M.; Eissa, I.H.; El-Naggar, A.M.J.B.C. Design, efficient synthesis, docking studies, and anticancer evaluation of new quinoxalines as potential intercalative Topo II inhibitors and apoptosis inducers. Bioorg. Chem. 2020, 104, 104255. [Google Scholar] [CrossRef]
  43. El-Adl, K.; Ibrahim, M.-K.; Alesawy, M.S.; Eissa, I.H. [1,2,4]Triazolo [4,3-c]quinazoline and bis([1,2,4]triazolo)[4,3-a:4′,3′-c]quinazoline derived DNA intercalators: Design, synthesis, in silico ADMET profile, molecular docking and anti-proliferative evaluation studies. Bioorg. Med. Chem. 2021, 30, 115958. [Google Scholar] [CrossRef]
  44. Becke, A.D. Density-functional thermochemistry. III. The role of exact exchange. J. Chem. Phys. 1993, 98, 5648. [Google Scholar] [CrossRef]
  45. Johnson, B.G.; Frisch, M.J. Analytic second derivatives of the gradient-corrected density functional energy. Effect of quadrature weight derivatives. Chem. Phys. Lett. 1993, 216, 133. [Google Scholar] [CrossRef]
  46. Lee, C.; Yang, W.; Parr, R.G. Development of the Colle-Salvetti correlation-energy formula into a functional of the electron density. Phys. Rev. B 1988, 37, 785. [Google Scholar] [CrossRef]
  47. Ditchfield, R.; Hehre, W.J.; Pople, J.A. Self-Consistent Molecular Orbital Methods. 9. Extended Gaussian-type basis for molecular-orbital studies of organic molecules. J. Chem. Phys. 1975, 54, 724. [Google Scholar] [CrossRef]
  48. Schafer, A.; Huber, C.; Ahlrichs, R.J. Fully optimized contracted Gaussian basis sets of triple zeta valence quality for atoms Li to Kr. Chem. Phys. 1994, 100, 5829. [Google Scholar] [CrossRef]
  49. McLean, A.D.; Chandler, G.S. Contracted Gaussian basis sets for molecular calculations. I. Second row atoms, Z = 11–18. J. Chem. Phys. 1980, 72, 5639. [Google Scholar] [CrossRef]
  50. Ulic, S.E.; Vedova, C.O.D.; Hermann, A.; Mack, H.-G.; Oberhammer, H.J. Preparation and Properties of Trifluorothioacetic Acid-S-(trifluoromethyl) ester, CF3C(O)SCF3. Phys. Chem. A 2008, 112, 6211. [Google Scholar] [CrossRef]
  51. Reed, A.E.; Weinhold, F.J. Natural bond orbital analysis of near-Hartree–Fock water dimer. Chem. Phys. 1983, 78, 4066. [Google Scholar] [CrossRef]
  52. Available online: http://www.chemcraftprog.com (accessed on 23 July 2022).
  53. Dennington, R.; Keith, T.; Millam, J. GaussView, Version 5; Semichem Inc.: Shawnee Mission, KS, USA, 2009. [Google Scholar]
Figure 1. Different coordination possibilities of thiourea derivatives.
Inorganics 11 00390 g001
Scheme 1. Preparation of N-Phenylmorpholine-4-carbothioamide (HPMCT).
Inorganics 11 00390 sch001
Scheme 2. Preparation of Complexes (14).
Inorganics 11 00390 sch002
Scheme 3. Preparation of Complexes (3) and (4).
Inorganics 11 00390 sch003
Figure 2. XRD patterns of (A) Complex 1, (B) Complex 5, (C) Complex 6, (D) Complex 7, and (E) Complex 10.
Inorganics 11 00390 g002
Figure 3. SEM images of (a) Complex 1, (b) Complex 5, (c) Complex 6, (d) Complex 7, and (e) Complex 10.
Inorganics 11 00390 g003
Figure 4. Histogram of biological activities of synthesized compounds.
Inorganics 11 00390 g004
Figure 5. Cytotoxicity diagram of HPMCT, [PdCl2(HPMCT)2] (2), and [PtCl2(HPMCT)2] (3) against the MCF-7 cell line at different concentrations (μM). p value = 0.005 in each case.
Inorganics 11 00390 g005
Figure 6. The mapping surface displays the crystal ligand filling the active pocket of bacterial tyrosinase, with hydrogen bonds (green) and the pi interactions shown by purple lines. The HPMCT ligand is docked in the enzyme.
Inorganics 11 00390 g006
Figure 7. Complexes (14) docked in the bacterial enzyme tyrosinase are shown with hydrogen bonds (green) and pi interactions as purple lines.
Inorganics 11 00390 g007
Figure 8. Mapping the surface of the complexes (14) that the bacterial tyrosinase uses as its active pocket.
Inorganics 11 00390 g008
Figure 9. Complexes (510) docked in the bacterial tyrosinase are shown, together with hydrogen bonds (green) and π– interactions (purple lines).
Inorganics 11 00390 g009
Figure 10. Mapping of the complexes (610) that reside on the surface of the bacterial tyrosinase’s active pocket.
Inorganics 11 00390 g010
Figure 11. Comparative comparison of the compounds that were tested and colchicine. Reference ligands are represented by green balls, comparable complexes by red balls, and dissimilar ligands by blue balls.
Inorganics 11 00390 g011
Figure 12. ADMET image for the synthesized compounds.
Inorganics 11 00390 g012
Figure 13. The optimized structure of HPMCT.
Inorganics 11 00390 g013
Figure 14. The energies of HOMO—LUMO of HPMCT.
Inorganics 11 00390 g014
Figure 15. Optimized geometry of; (i) [Ni(PMCT)2], (ii) [PdCl2(HPMCT)2], (iii) [Pd(PMCT)2], (iv) [Pt(HPMCT)2], and (v) [Pt(PMCT)2].
Inorganics 11 00390 g015
Figure 16. An illustration of the molecules’ highest occupied and lowest vacant molecular orbitals of [Ni(PMCT)2], [PdCl2(HPMCT)2], [Pd(PMCT)2], [Pt(HPMCT)2], and [Pt(PMCT)2].
Inorganics 11 00390 g016
Table 1. Color, yield (%), M.p.(°C), molar conductivity (Cond.), and CHN analysis of the ligand and its complexes.
Comps.ColorYield(%)Mp.°CCond.Elemental Analysis % Calc. (Found)
CHN
HPMCTWhite90145–147--59.43
(59.29)
6.35
(6.33)
12.60
(12.78)
1Greenish yellow73130–1321045.63
(45.66)
4.87
(4.90)
9.68
(9.71)
2Dark red95148–1501742.49
(42.52)
4.54
(4.57)
9.01
(9.04)
3Dark yellow90178–1801937.18
(37.21)
3.97
(4.07)
7.88
(7.91)
4White74188–190236.90
(36.93)
3.94
(3.97)
7.82
(7.85)
5Light olive79175–178352.71
(52.74)
5.23
(5.26)
11.18
(11.21)
6Dark yellow77158–161452.21
(52.24)
5.18
(5.21)
11.07
(11.10)
7Dark yellow76120–123848.13
(48.16)
4.77
(4.80)
10.20
(10.23)
8Dark yellow91142–144841.44
(41.47)
4.11
(4.14)
8.79
(8.82)
9White67190–193652.02
(52.05)
5.16
(5.19)
11.03
(11.06)
10White70192–1941247.61
(47.64)
4.72
(4.75)
10.09
(10.12)
11Gray82118–1211141.08
(41.11)
4.07
(4.10)
8.71
(8.74)
Table 2. Selected IR bands of the ligand and its complexes.
Comps.νNHν(C-H)δNHνC=N
νC=N
νC=CνC-NνC-OνC=SνM-S
νM-N
Ar.Aliph.
HPMCT3176s3030s2918m
2868m
1595s--1531s1211s1028s707s--
13336b3049w2968w
2860w
1626s--1489s1276s1031m694m495w
23174b3055w2960w
2858w
1597s--1558s1269s1028s696m503w
33207s3059w2966s
2854s
1645s--1583s1303s1028s694s493s
43184b3057w2966w
2858w
1597s--1558s1269s1026s684s482w
5--3024w2918w
2841w
--1550s1481m1276m1026s692m418w
518w
6--3061w2960w
2848w
--1529s1485m1267m1022s694m470w
515w
7--3053w2968w
2856w
--1541s1487w1267m1028m696m420w
516w
8--3051w2964w
2852w
--1541s1485m1269m1028s694m461w
516w
9--3028m2976m
2854m
--1531s1491m1265m1028s665m472w
507w
10--3057w2962w
2854w
--1519s1435m1269m1026s696m466w
516w
11--3051w2962m
2848w
--1581s1485m1274m1024s686m489w
586w
Table 3. Proton chemical shifts (in ppm) of HPMCT and its complexes.
Comps.δNHδH
Phenyl
δH
OCH2
δH
NCH2
HPMCT9.29 (s, 1H)7.04–7.28 (m, 5H)3.84 (t, J8.00 Hz, 4H)3.61 (t, J8.00 Hz, 4H)
210.28 (s, 2H)7.05–7.81 (m, 10H)3.91 (t, J7.80 Hz, 8H)3.75 (t, J7.80 Hz, 8H)
39.59 (s, 2H)7.33–7.81 (m, 10H)3.92 (t, J7.90 Hz, 8H)3.66 (t, J7.90 Hz, 8H)
410.37 (s, 2H)7.21–7.36 (m, 10H)3.88 (t, J8.00 Hz, 8H)3.71 (t, J8.00 Hz, 8H)
7-7.62 (d, J8.00 Hz, 4H), 7.29–7.34 (m, 4H), 7.04 (t, J7.60 Hz, 2H)3.92 (t, J8.00 Hz, 8H)3.66 (t, J8.00 Hz, 8H)
8-7.48–7.76 (m, 10H)3.56 (t, J7.60 Hz, 8H)3.38 (t, J7.60 Hz, 8H)
9-7.20–7.67 (m, 10H)3.82 (t, J8.00 Hz, 8H)3.70 (t, J8.00 Hz, 8H)
10-7.21–7.36 (m, 10H)3.88 (t, J7.80 Hz, 8H)3.71 (t, J7.80 Hz, 8H)
11-6.87–7.24 (m, 10H)3.74 (t, J8.00 Hz, 8H)3.61 (t, J8.00 Hz, 8H)
Table 4. Carbons chemical shifts (in ppm) of HPMCT and its complexes.
Comps.C=SδC
Phenyl
δC
OCH2
δC
NCH2
HPMCT182.35141.45, 128.56, 125.97, 124.9266.3048.96
2176.78139.41, 126.23, 124.34, 122.1064.4451.45
3177.31137.26, 126.11, 124.09, 122.4563.7150.61
4174.80139.59, 129.59, 127.14, 126.7765.8650.52
7168.51136.02, 127.81, 124.75, 121.9366.5248.22
8167.37137.34, 127.63, 124.93, 121.8167.0147.39
11168.89136.02, 128.94, 125.01, 122.1366.3446.19
Table 5. IC50 values of HPMCT, [PdCl2(HPMCT)2], and [PtCl2(HPMCT)2] against the MCF-7 cell line.
CompoundsIC50 (μM)
HPMCT80.30 ± 1.905
[PdCl2(HPMCT)2]28.93 ± 1.105
[PtCl2(HPMCT)2]12.72 ± 0.576
cis-platin3.19 ± 0.097
Table 6. ΔG (kcal/mol) of synthesized compounds against the bacterial tyrosinase target site PDB ID: 6EI4.
LigandRMSD Value (Å)Docking Score
(kcal/mol)
Interaction
H.Bπ
HPMCT1.35−7.0125
11.97−6.11--
21.69−6.1525
32.10−6.3215
42.40−5.8612
51.23−5.2011
61.26−5.1011
71.13−5.1325
81.75−5.561-
91.72−5.36-3
102.03−4.0214
111.32−5.2026
Table 7. ALog p, Mwt, HBA, HBD, rotatable bonds, MFPSA, minimal separation, and resemblance of the produced complexes to reference compound.
Comp.A-Log pMwt.HBAHBDRotatable BondsRingsAromatic RingsMFPSAMinimum DistanceIs Similar
7 4.407549.017604620.1851.81736TRUE
1 4.691579.065628420.1471.82746TRUE
5 4.407501.291604620.1971.82961TRUE
8 4.407637.675604620.1841.89913TRUE
11 2.735222.307213210.2431.90748TRUE
Reference1.915313.389113320.074-Reference
6 6.004508.159804620.1862.27628FALSE
10 4.567555.008804620.2282.18775FALSE
9 4.567508.006804620.2322.17541FALSE
2 4.807625.971448420.1682.01066FALSE
4 4.691716.109628420.1441.9746FALSE
3 4.691710.597628420.1461.97191FALSE
Table 8. Predicted ADMET for the synthesized compounds.
Comp.BBB Level aSolubility Level bAbsorption Level cHepatotoxicityCYP2D6 Prediction dPPB Prediction e
10 1 1 0 Falsefalsetrue
6 0 1 0 Falsefalsetrue
5 0 2 0 Falsefalsetrue
7 0 2 0 Falsefalsetrue
8 0 2 0 Falsefalsetrue
9 1 1 0 Falsefalsetrue
1 1 2 0 Falsefalsetrue
4 1 2 0 Falsefalsetrue
2 1 3 0 Falsetruefalse
3 1 2 0 Falsefalsetrue
11 2 3 0 Falsefalsefalse
a BBB level, blood brain barrier level, 0 = very high, 1 = high, 2 = medium, 3 = low, 4 = very low. b Solubility level, 1 = very low, 2 = low, 3 = good, 4 = optimal. c Absorption level, 0 = good, 1 = moderate, 2 = poor, 3 = very poor. d CYP2D6, cytochrome P2D6, TRUE = inhibitor, FALSE = non-inhibitor. The classification of whether a compound is a CYP2D6 inhibitor using the cutoff Bayesian score of 0.161. e PBB, plasma protein binding, FALSE means less than 90%, TRUE means more than 90%. The classification of whether a compound is highly bounded (≥90% bound) to plasma proteins using the cutoff Bayesian score of −2.209.
Table 9. In silico toxicity properties of the synthesized compound.
Comp.FDA Rodent Carcinogenicity (Male, Mouse)Carcinogenic Potency TD50 (Rat) aRat Maximum Tolerated Dose (Feed) bDevelopmental Toxicity PotentialRat Oral LD50 bRat Chronic LOAEL bOcular Irritancy (Rat)Skin Irritancy (Rat)
10 Non-Carcinogen 0.599 00.00750 Non-Toxic 00.07350 00.01560 NoneMild
6 Non-Carcinogen 00.6550 00.01850 Non-Toxic 00.06980 00.00990 ModerateMild
5 Non-Carcinogen 04.1340 00.01270 Non-Toxic 00.09350 00.02980 NoneMild
7 Non-Carcinogen 03.0130 00.00680 Non-Toxic 00.10710 00.01920 ModerateMild
8 Non-Carcinogen 03.1360 00.00270 Non-Toxic 0.0998 0.0201 ModerateMild
9 Non-Carcinogen 0.581 0.0120 Non-Toxic 0.0756 0.0151NoneMild
1 Single-Carcinogen5.481 0.0225 Non-Toxic 0.5264 0.0075 MildNone
4 Single-Carcinogen 5.721 0.0054 Non-Toxic 0.4634 0.0079 MildNone
2 Non-Carcinogen 11.41 0.0306 Non-Toxic01.17706 0.0050 SevereMild
3 Single-Carcinogen 5.716 0.0057 Non-Toxic 0.4662 0.0079 MildNone
11 Single-Carcinogen 231.5 0.0666 Non-Toxic 0.3213 0.0249 MildNone
a Unit: mg/kg body weight/day. b Unit: g/kg body weight.
Table 10. Global reactivity descriptors of M-HPMCT or M-PMCT complexes.
Parameters[Ni(PMCT)2][Pd(HPMCT)2][Pd(PMCT)2][Pt(HPMCT)2][Pt(PMCT)2]
Etotal (Kcal/mol)−1,374,759.30−1,926,136.774−1,347,751.571−1,920,786.055−1,342,397.088
EHOMO,ev−5.365−5.829−5.413−5.805−5.128
ELUMO,ev−1.497−2.419−1.815−1.807−1.211
Eg,ev (ELUMO-EHOMO)3.8683.413.5983.9983.917
Hardness
(½(ELUMO-EHOMO))
1.9341.7051.7991.9991.9585
Dipole Moment (debye)0.0007352.2914950.0035710.0041760.001631
LE (-EHOMO ev)5.3655.8295.4135.8055.128
EA (-ELUMO ev)1.4972.4191.8151.8071.211
Table 11. Selected bond lengths and bond angles of M-HPMCT or M-PMCT complexes.
Bond Length[PdCl2(HPMCT)2][PtCl2(HPMCT)2]Bond Length[Ni(PMCT)2][Pd(PMCT)2][Pt(PMCT)2]
S23-M2.4022.377S23-M2.2772.3992.405
---------------N7-M1.9132.0712.079
----------------N31-M1.9132.3992079
S31-M2.3792.377S29-M2.2772.0712.405
C34-N371.3651.360C8-N71.3341.3331.335
N38-C341.3541.366N9-C81.3651.3661.365
C34-S231.7381.727C8-S231.7661.7691.769
C22-S311.7231.727C30-S291.7661.7691.769
Bond Angles[PdCl2(HPMCT)2][PtCl2(HPMCT)2]Bond Length[Ni(PMCT)2][Pd(PMCT)2][Pt(PMCT)2]
S23-M-S31178.966179.994S23-M-S29179.994179.986179.995
Cl60-M-Cl61177.999179.996N7-M-N31179.995179.993179.991
S23-M-Cl6085.74187.216S23-M-N773.92869.25468.497
S23-M-Cl6193.79292.781N31-M-S2973.93069.24868.499
S31-M-Cl6093.40592.790S23-M-N31106.076110.739111.50
S31-M-Cl6187.04387.213N7-M-S29106.066110.759111.505
Disclaimer/Publisher’s Note: The statements, opinions and data contained in all publications are solely those of the individual author(s) and contributor(s) and not of MDPI and/or the editor(s). MDPI and/or the editor(s) disclaim responsibility for any injury to people or property resulting from any ideas, methods, instructions or products referred to in the content.

