Article

Optimal Design and Control of a z-Tilt Piezoelectric Based Nano-Scale Compensation Stage with Circular Flexure Hinges

Center for Measurement Standards, Industrial Technology Research Institute, Hsinchu 300, Taiwan
Inventions 2016, 1(3), 15; https://doi.org/10.3390/inventions1030015
Submission received: 5 May 2016 / Revised: 3 August 2016 / Accepted: 5 August 2016 / Published: 19 August 2016

Abstract

:
The Taguchi method is widely used for the optimization of mechanical design and this study is used it in the design of a 2D circular flexure hinge for a z-tilt piezoelectric based nano-scale compensation stage. Maximum displacement of the stage is 16 μm at z-axis and ±30 arcsec at θx and θy. The most important design parameters for such a flexure hinge are minimal diameter, body height, and notch radius. The important requirements for the optimal design of a flexure hinge is that the z-tilt stage should have the highest possible natural frequency and the smallest coupling displacement. Simulation results show the nano-stage to have a higher natural frequency (626 Hz) and lower coupling displacement (0.032%). A kinematic model for the z-tilt stage has also been proposed in this study and the experimental results show the actual natural frequency of 510 Hz to be slightly lower than in the simulation. By keeping the angular displacement less than ±30 arcsec for z-tilt motion of the stage, the results of tracking experiments show a coupling displacement of 300 nm for the z-axis and 1 arcsec for θx while the θy tracked a sine wave of 1 Hz and an amplitude of 5 arcsec.

Graphical Abstract

1. Introduction

The important features of a nano- or micro-scale compensation stage are fast response, high positioning resolution, and excellent positioning repeatability. The two most common kinds of nano-scale compensation stage are x-y-yaw and z-tilt. The x-y-yaw stage is like that proposed by Lee et al. [1], and the z-tilt stage is like another proposed by Liu et al. [2]. The structure of z-tilt stages is usually simpler than that of x-y-yaw stages. However, the shape of the flexure hinges in a z-tilt stage influences stage bandwidth and coupling displacement more than in an x-y-yaw stage. Both types of nano-scale compensation stage can be of a coplanar design. Although, a coplanar stage has many advantages such as small size, a low center of gravity (which means a higher frequency response), low cumulative mechanical setup error and so on, coupling displacement is intensely influencing positioning accuracy [3]. For example, when the stage is moved in the y-direction, displacement in the x-direction will not be zero. To decrease the coupling displacement, flexure hinges with reduced stiffness should be considered. However, lowering the stiffness of the flexure hinges can also lower the system bandwidth. Design of the flexure hinges should provide for an optimal coupling displacement to stage bandwidth ratio.
A Scott–Russell amplifying mechanism which was employed one-dimensional flexure hinges was analyzed by Chen et al. [4]. Ahuett-Garza et al. conducted a study about large deflection planar compliant mechanisms constructed by one-dimensional flexure hinges which is similar to the Chen’s study [5]. In Ahuett-Garza’s study, three kinds of one-dimensional flexure hinge were simulated. Tian et al. is using adaptive Simpson integration and polynomial approximation techniques to develop the dimensionless empirical equations for three kinds of one-dimensional flexure hinges [6,7]. The results show that the dimension and form of flexure hinges influence the stiffness and rotational precision. Although above research can analyze one-dimensional flexure hinges very well, there are too many parameters that are difficult for analyzing. The Taguchi method can be used to figure out the optimal parameters for such a system without a lot of experimentation and complex mathematical calculation being necessary. Some studies applied the Taguchi method to design the mechanics which are employed in one-dimensional flexure hinges [8,9,10].
This study used Taguchi to find the optimal design parameters for a two-dimensional flexure hinges of a z-tilt compensation stage. The three motions of the z-tilt stage are the linear motion in the z-axis, angular motion in the xx) and y
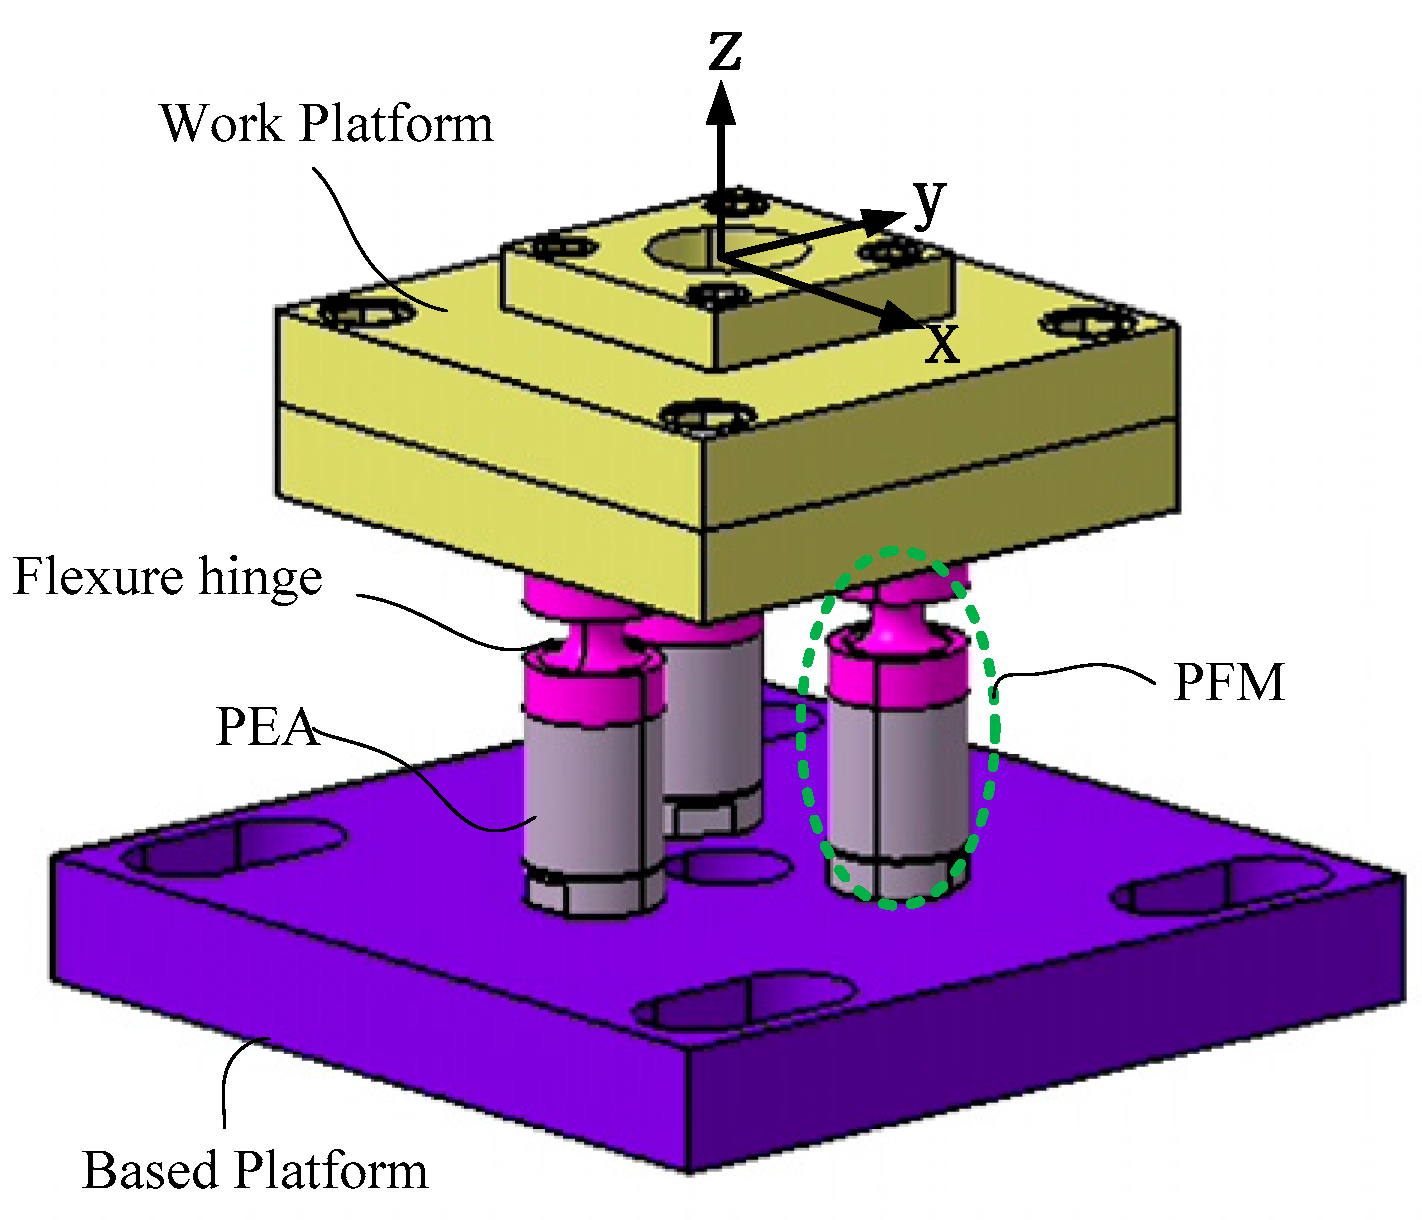
y) axes. The easiest way to achieve 
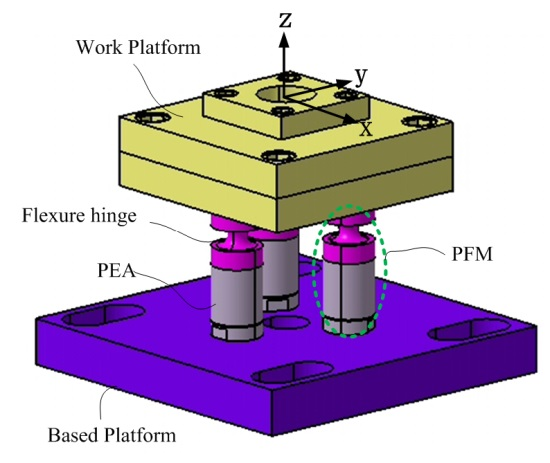
z-tilt motion is to use three piezoelectric-flexure-hinge modules (PFM) as shown in Figure 1. Here, each PFM consists of a flexure hinge and a piezoelectric actuator. 
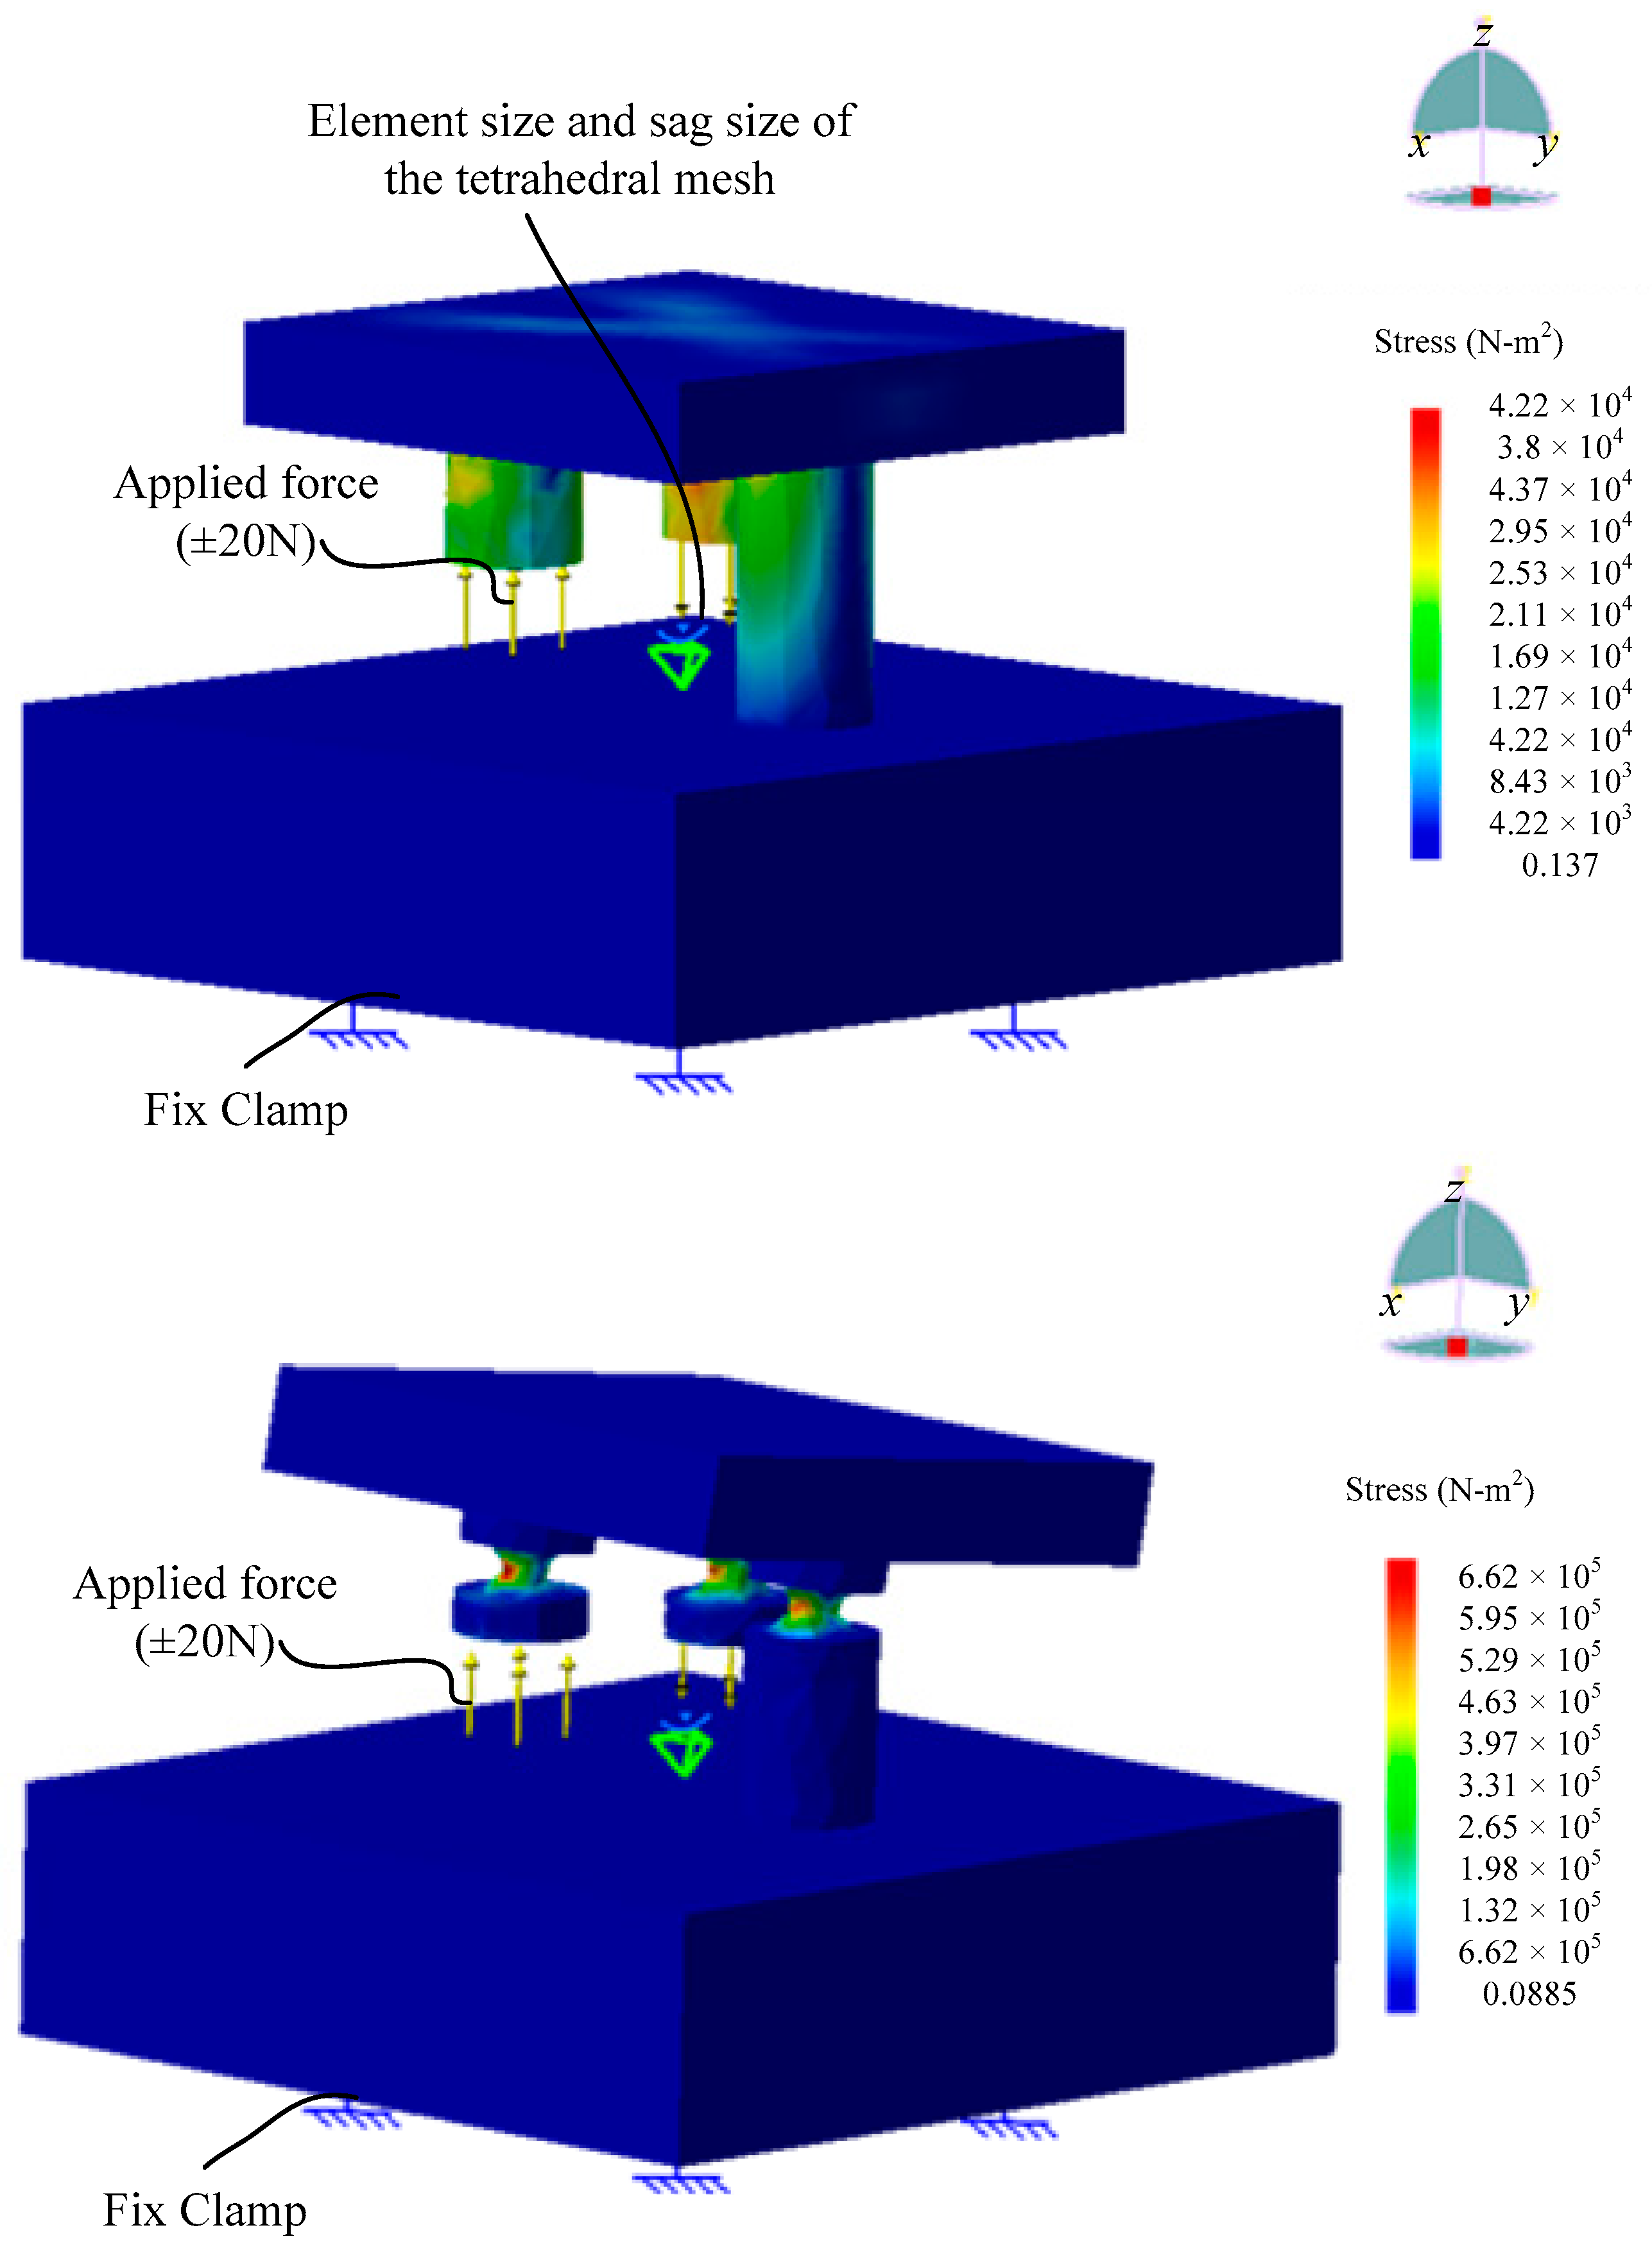
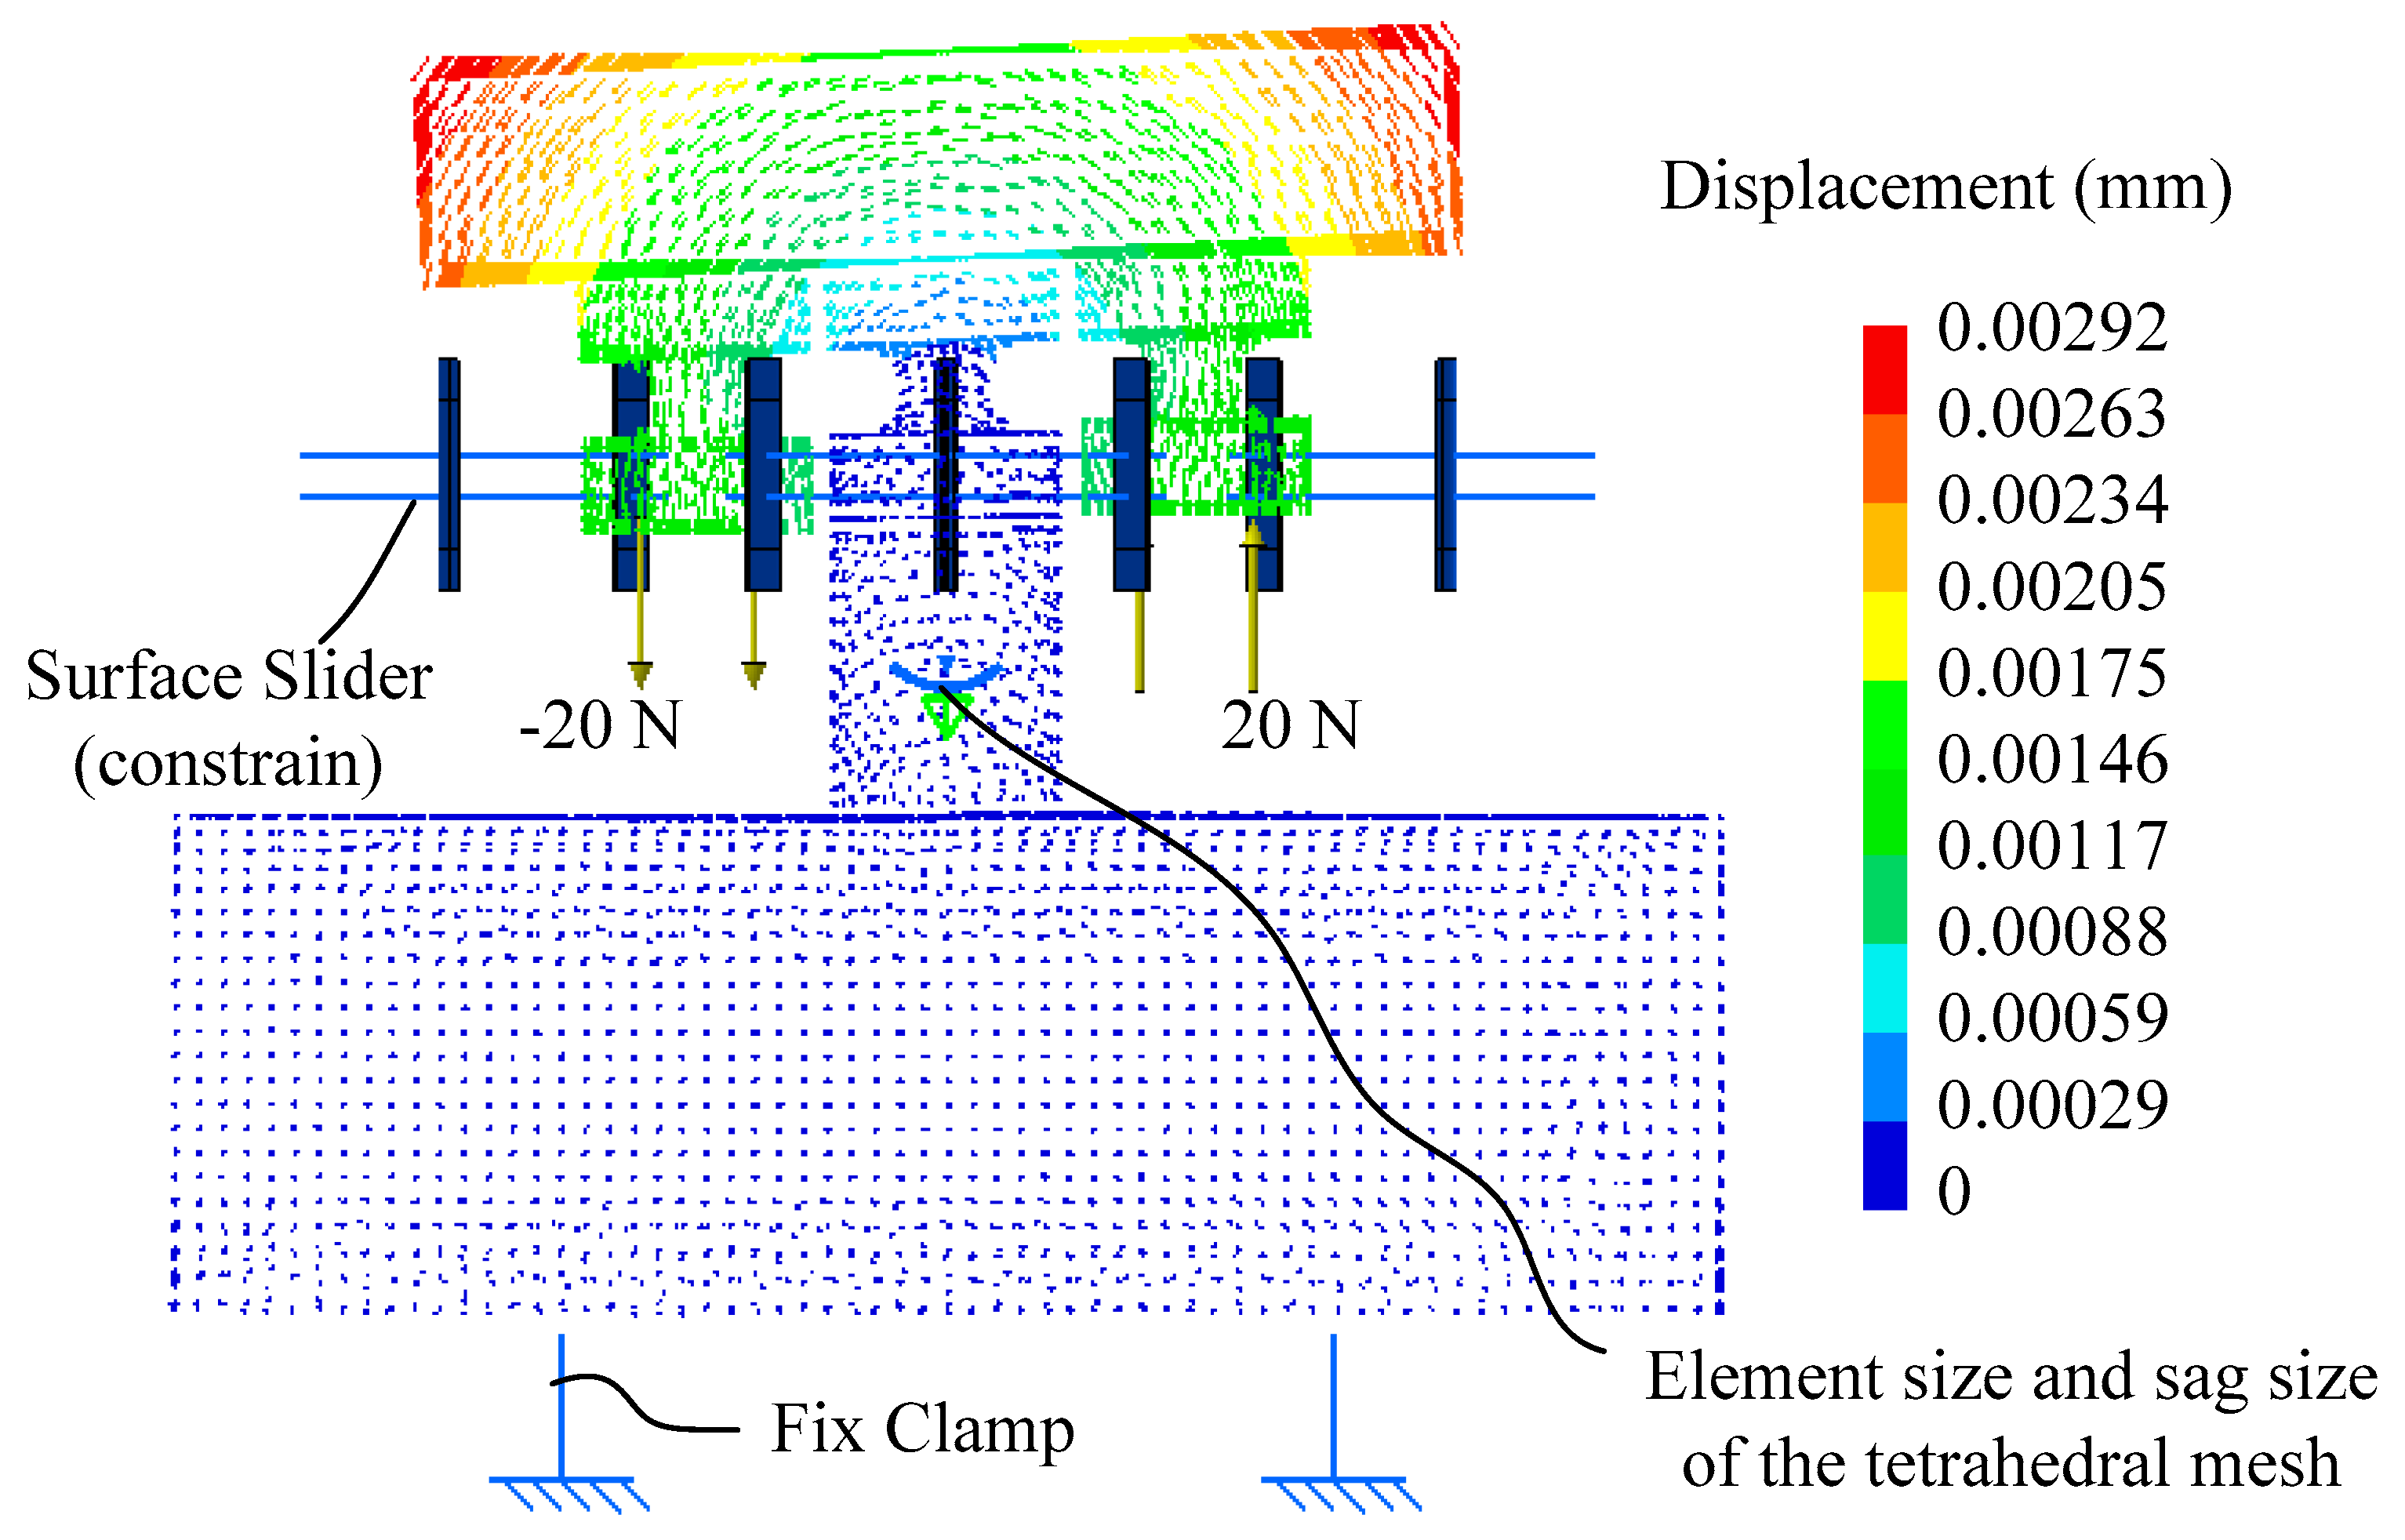
Figure 2 shows a simulation that explains why flexure hinges are needed for a z-tilt stage. The upper one shows the stress concentrated on the piezoelectric actuator and deformation that occurs on the work platform if there is no flexure. This problem can be avoided by the use of flexure hinges. Two kinds of flexure hinge are commonly used, notched and circular [11]. Circular flexure hinges are usually employed on z-tilt stages because motion is two-dimensional. Other kinds of flexure hinges with special shapes have been proposed by Jywe [12]. Flexure hinges are not limited to use on nano-scale stages, but can also be used in such applications as tool compensation as proposed by Andrew Woronko et al. [13]. The main problem of piezoelectric actuator usage is hysteresis which causes low positioning accuracy. For increased positioning accuracy, Lin et al. adopted a hysteresis observed control method [14]. Banning et al. built a hysteresis model for hysteresis displacement compensation [15]. There are some different models are used for hysteresis compensation such as the classical Preisach model [16], Inverse Preisach Model [17], Bouc–Wen model [18], and so on. The improvement of mathematical model compensation methods is limited. Thus, some studies using a compensator with a PID (proportional–integral–derivative) controller to improve the steady state error and dynamic tracking performance like Ru et al. proposed [19]. Beside mathematical compensation methods (e.g., feed-forward compensator), Liu et al. employed a capacitor in the piezoelectric driving circuit for hysteresis reduction and the method is called capacitor insertion method [2]. This study was concerned with positioning accuracy. Thus, only a PI (proportional–integral) controller was used.
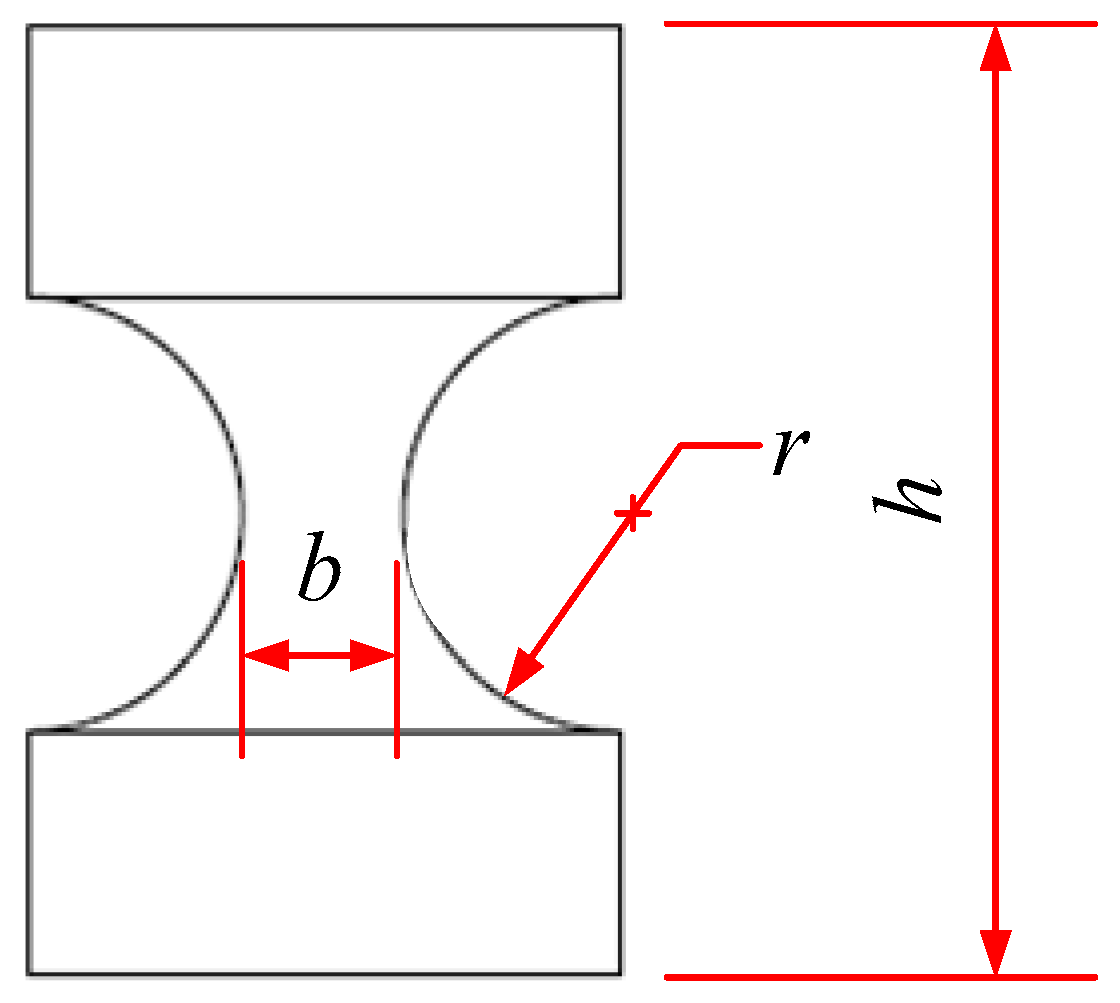
There are three parameters which need to be taken into account in the design of a 2D circular flexure hinge: the minimum diameter (b); the body height (h); and the notch radius (r), as shown in Figure 3. Estimating of the static performance of a z-tilt stage, such as coupling displacement and stage stiffness, can be made using simulation and stepwise displacement experiments. The dynamic performance of a z-tilt stage can be tested by a tracking experiment [2,20]. The first part of this study describes the use of the Taguchi method to optimize design of the circular flexure hinges. The second part is a description of dynamic performance tests of the proposed z-tilt stage. At the last in this study, some experiments were performed to check whether the results achieved the design intent.

2. Flexure Hinge Optimal Design

The S/N (signal-to-noise) ratio η is used as a performance evaluation index for optimal design results obtained by the Taguchi method. In this study, quality characteristics include: (1) the smaller the better (STB), the ideal value being zero, such as the poisoning error of a machine tool; (2) the larger the better (LTB), the ideal value here being infinity, such as the lifetime of a device; and (3) nominally the best (NTB), the special value of a target, such as the wavelength of a laser interferometer. In this study, eight steps were followed to arrive at an optimal design for the 2D circular flexure hinges.
Step 1. Deciding the design parameters:
As previously mentioned, the three parameters this study is concerned with are the minimum diameter (b), the body height (h), and the notch radius (r), as shown in Figure 3.
Step 2. Setting the parameter levels:
All parameters were set at three levels, as listed in Table 1, according to the required dimension of the stage, design experience, heuristics, machining rationality, notch sensitivity, and research results [8,21]. Please note, the optimal results based on level belong to local optimization, and are not global.
Step 3. Building an orthogonal array:
In this study an OA9(33) orthogonal array (OA) was used in the simulation as shown in Table 2 where each level (A1, A2, A3, B1, …, C2, and C3) appears three times. The OA is balanced and there is no repeated permutation.
Step 4. Defining the output response:
Two output responses were defined for the evaluation index:
(1)
Natural frequency (η1): The natural frequencies of the z-tilt stage with no load and when loaded. For such a stage, the system bandwidth is usually proportional to the natural frequency and so the LTB equation was used for performance evaluation:
η 1 = 10 × log ( 1 n i = 1 n 1 y i 2 )   ( dB )
(2)
Coupling angular displacement (η2): The ideal value of coupling displacement is zero, so the STB equation was used for evaluation:
η 2 = 10 × log ( 1 n i = 1 n y i 2 )   ( dB )
In Equations (1) and (2), yi represents the simulation output value, for example, the natural frequency (units can be ignored); n represents the number of output response (n = 1 for η1; n = 1 for η2).
Step 5. Performing simulation:
Dassault Systèmes CATIA V5R15 was used for simulation in this study. For natural frequency simulation, this study used a 
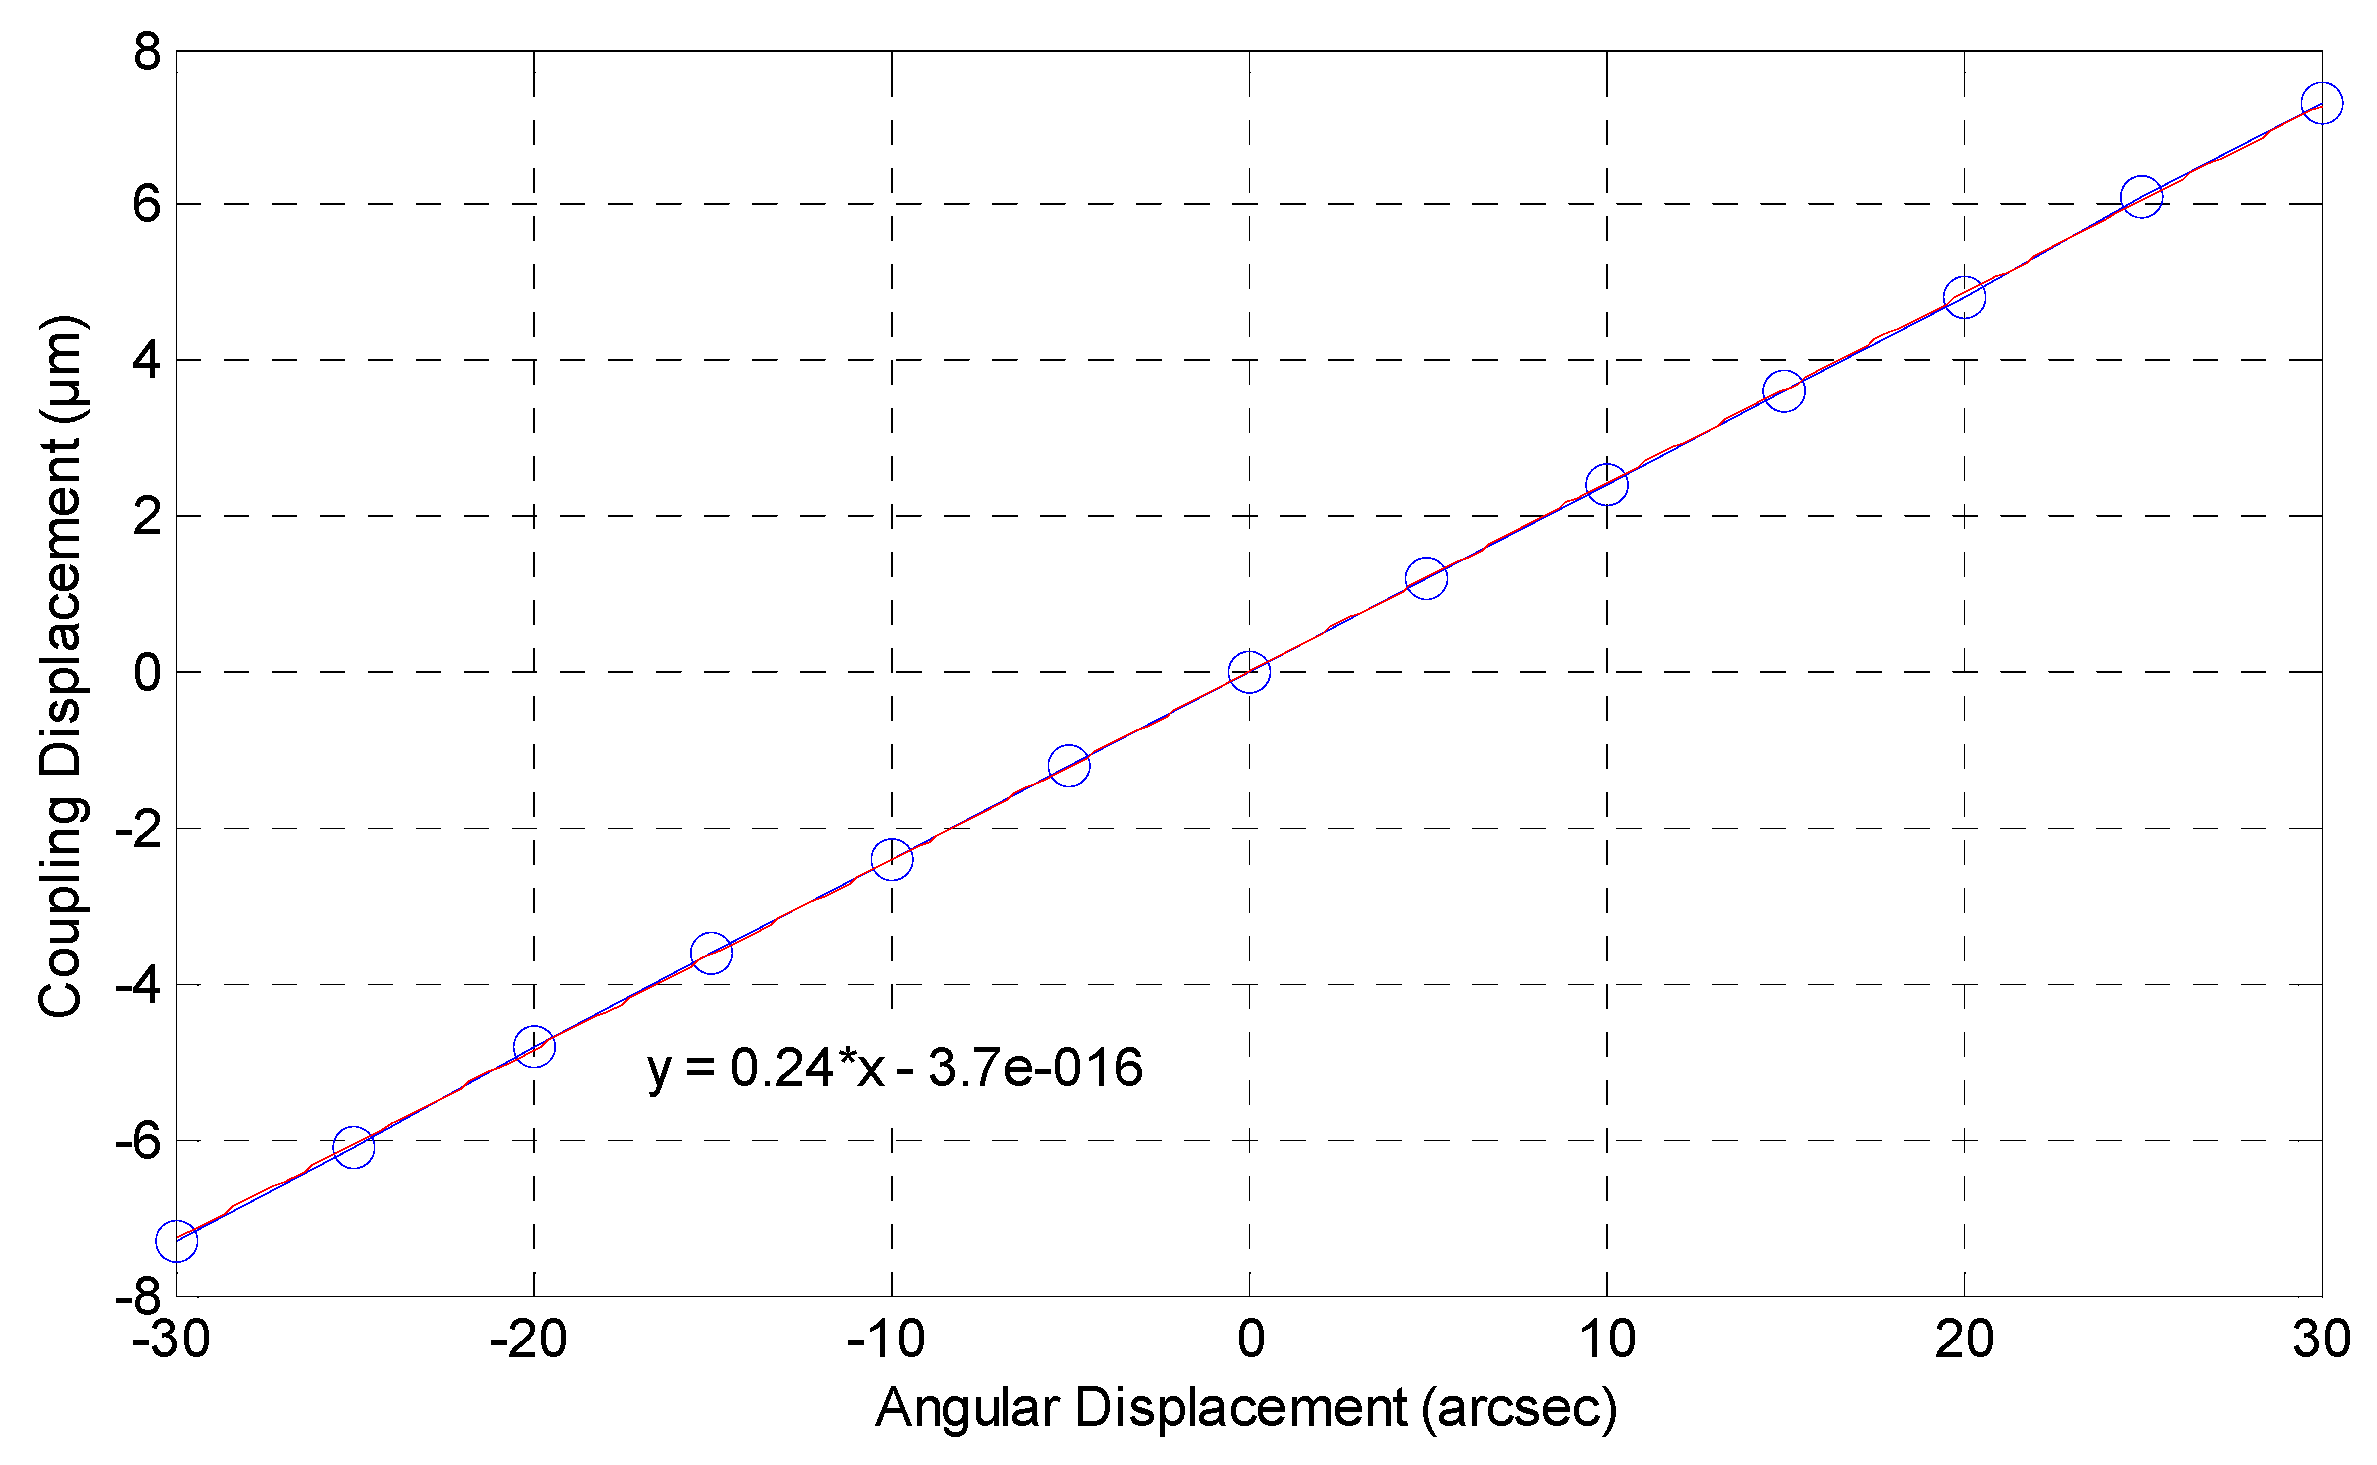
z-tilt stage loading of zero and 5 kg. For coupling angular displacement simulation, the z-tilt stage was rotated on the y-axis (θy) and observed the angular displacement of x-axis (θx). Please note that, for a z-tilt stage, coupling displacement for the z-direction motion is zero. Figure 4 shows the simulation setup and result, in which the applied force is ±20 N. The simulation results are shown in Table 3 and Table 4. Note that, since the stage is moved by constant force while simulation, displacement θy for each trail is different. This study is employed percentage for judging the simulation result.
Step 6. To compute the S/N ratio:
According to Equations (1) and (2) and Table 3, the S/N ratio for each trial can be computed as shown in Table 5. The average S/N ratio denoted of η ¯ , for example, for A1 and B2 are:
η ¯  for  A 1 : η ¯ A 1 = ( 56.377 ) + ( 55.891 ) + ( 55.394 ) 3 = 55.887 ,  and  η ¯  for  B 2 : η ¯ B 2 = ( 55.891 ) + ( 56.465 ) + ( 57.480 ) 3 = 56.612
After computation, Table 6 and Table 7 were built. In the tables, δ represents the maximum variation of average S/N Ratio of a single influencing parameter, which can be computed using the following equation:
δ = η ¯ max η ¯ min
The value of δ also represents the degree of influence. A large value for δ means the parameter has more influence than others. For example, for a z-tilt stage the natural frequency and minimum diameter are the most important. Table 7 were constructed and ranking was made according to the degree of influence.
Step 7. Deciding the optimal parameters:
From Table 6 and Table 7, the optimal value of each parameter of the flexure hinge can be decided based on the following principium:
  • If the output responses of the experiments have the same trend, select the level with the highest S/N ratio.
  • If the output responses of the experiments have no similar trend and have different ranking, select that with the lowest ranking.
  • If the output responses of the experiments have no similar trend and have same ranking, select the level with the highest S/N ratio.
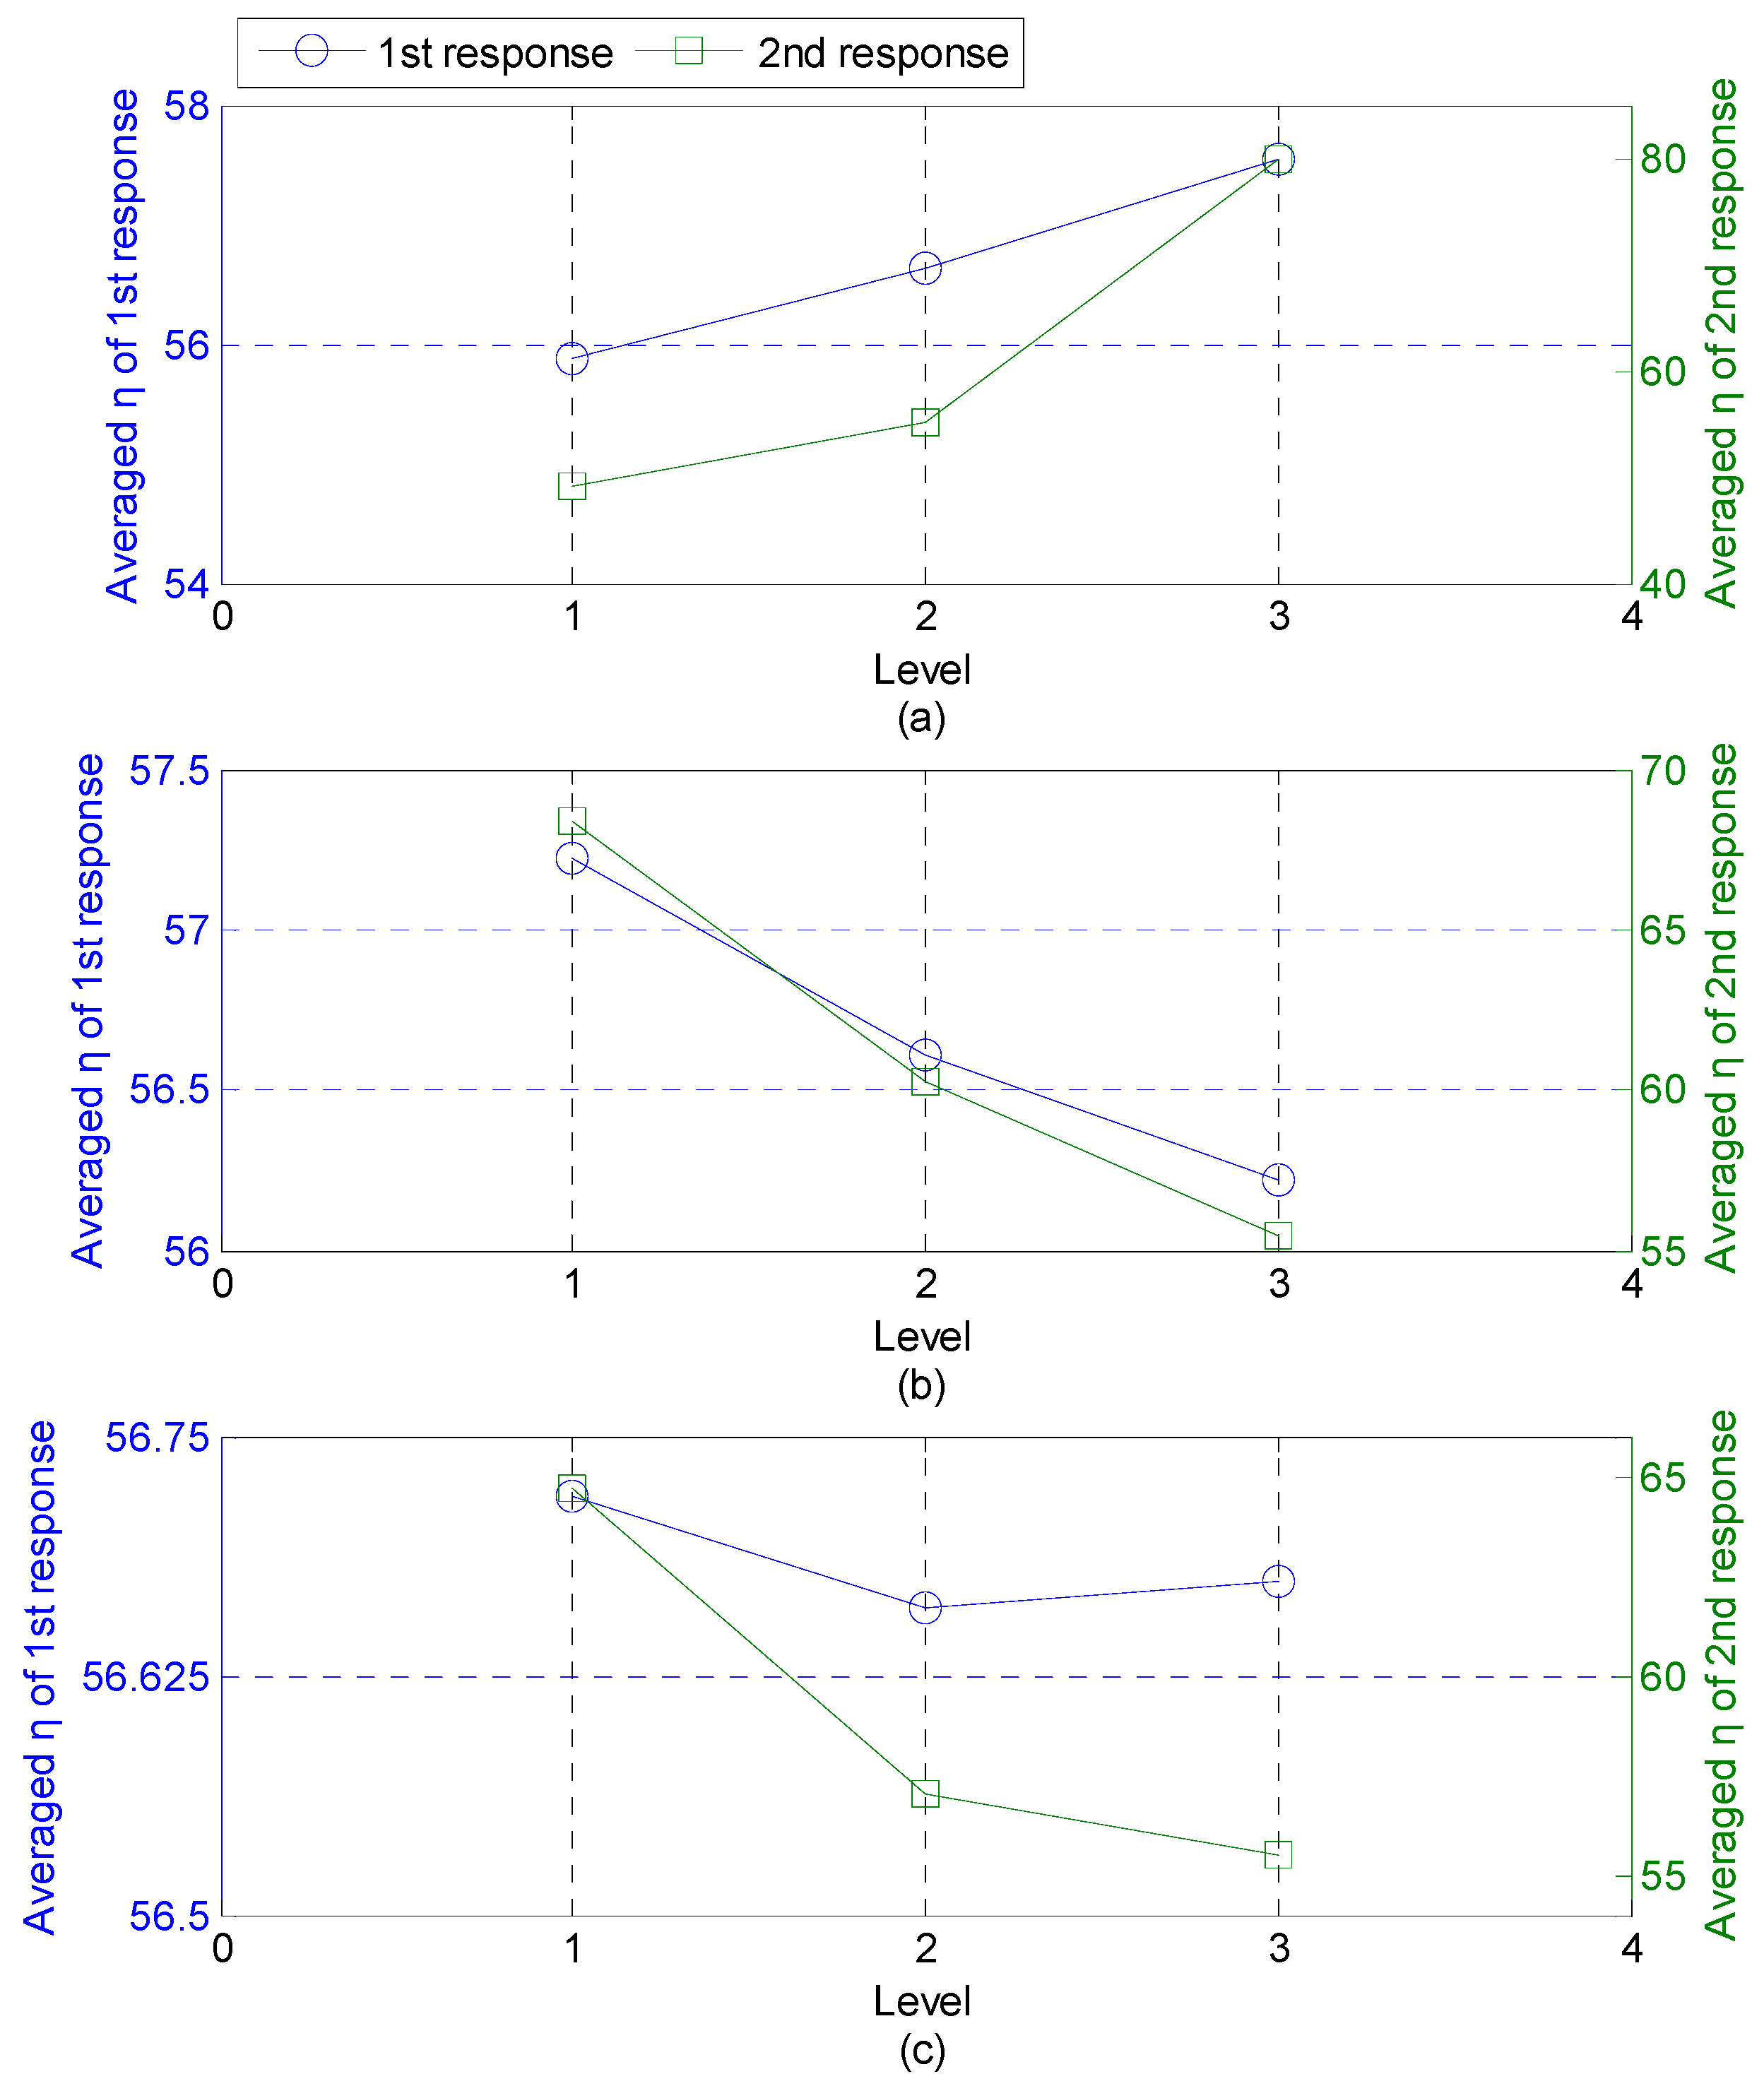
First, draw a cross-correlation chart from Table 6 and Table 7 as shown in Figure 5. From this chart, find the optimal value for each parameter according to the above principium. For parameter A, the result satisfies principium 1, therefore, the optimization result of the minimum diameter is A3. For parameter B, the result also satisfies principium 1, thus, the optimization result of body height is B1. For parameter C, the result does not satisfy principium 1 or 2, thus, principium 3 is used to select the optimal notch radius, in this study the choosing was C3. The optimal design parameters are listed in Table 8.
Step 8. Checking correctness of the results.
The optimal results of each parameter are A3, B1, and C3, which agrees exactly with trial 7 of the OA table. From Table 3, we can see that the natural frequency is highest and coupling angular displacement is the smallest of all the values in the OA table. Thus, the stage clearly complies with the required specifications and the output responses list in Table 9.

3. Kinematic Analysis

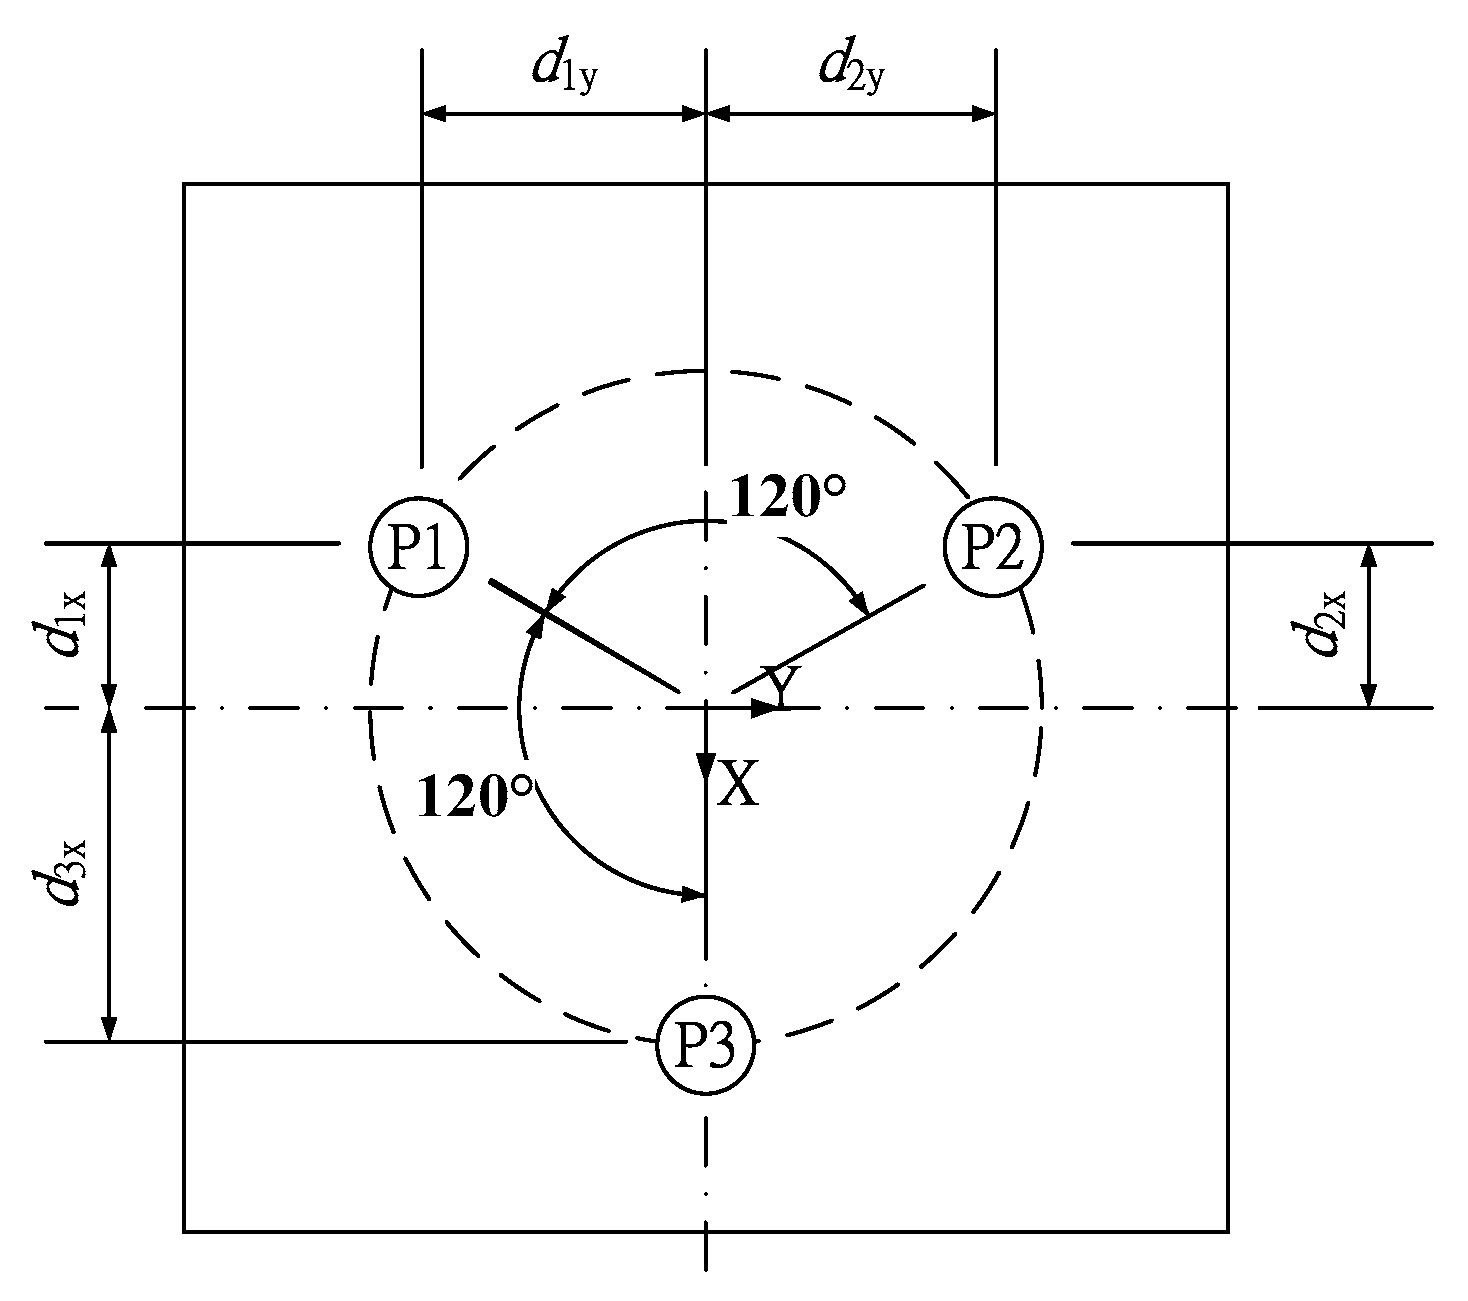
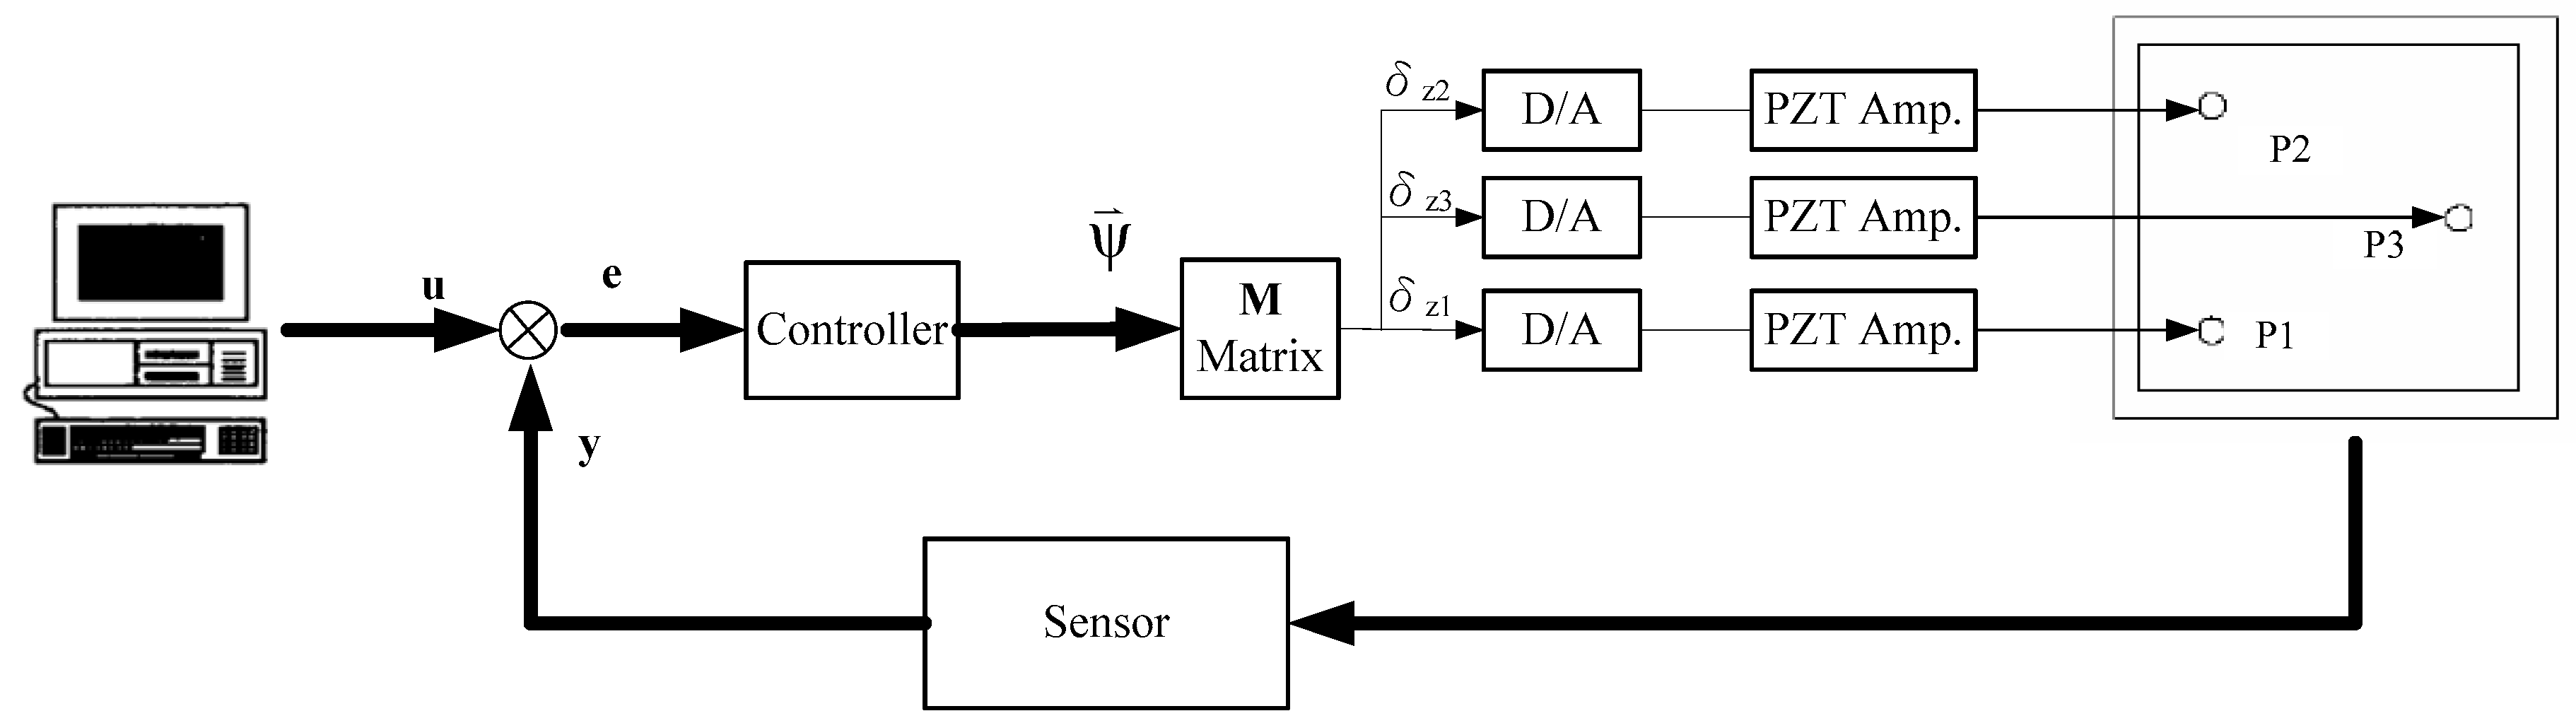
The positions of the PFMs are shown in Figure 6. The mathematical model of the stage movement shows in Figure 7. The coordinate systems as seen in Figure 7 include: {R} the reference coordinate system of the stage (the origin, or reference point), located at the center of the work platform; {Hi} represents the center position of the flexure hinge of the PFM, where i = 1, 2 and 3; and {R'} represents the position of the reference point after the stage has moved. Let s = [ s x s y s z ] T be the displacement vector of the z-tilt stage along the x-, y- and z-axes, as well as θx and θy to be the angular displacement of the z-tilt stage. After the stage has moved, the center of the flexure hinge is moved to a new position and the coordinate system is denoted as {H
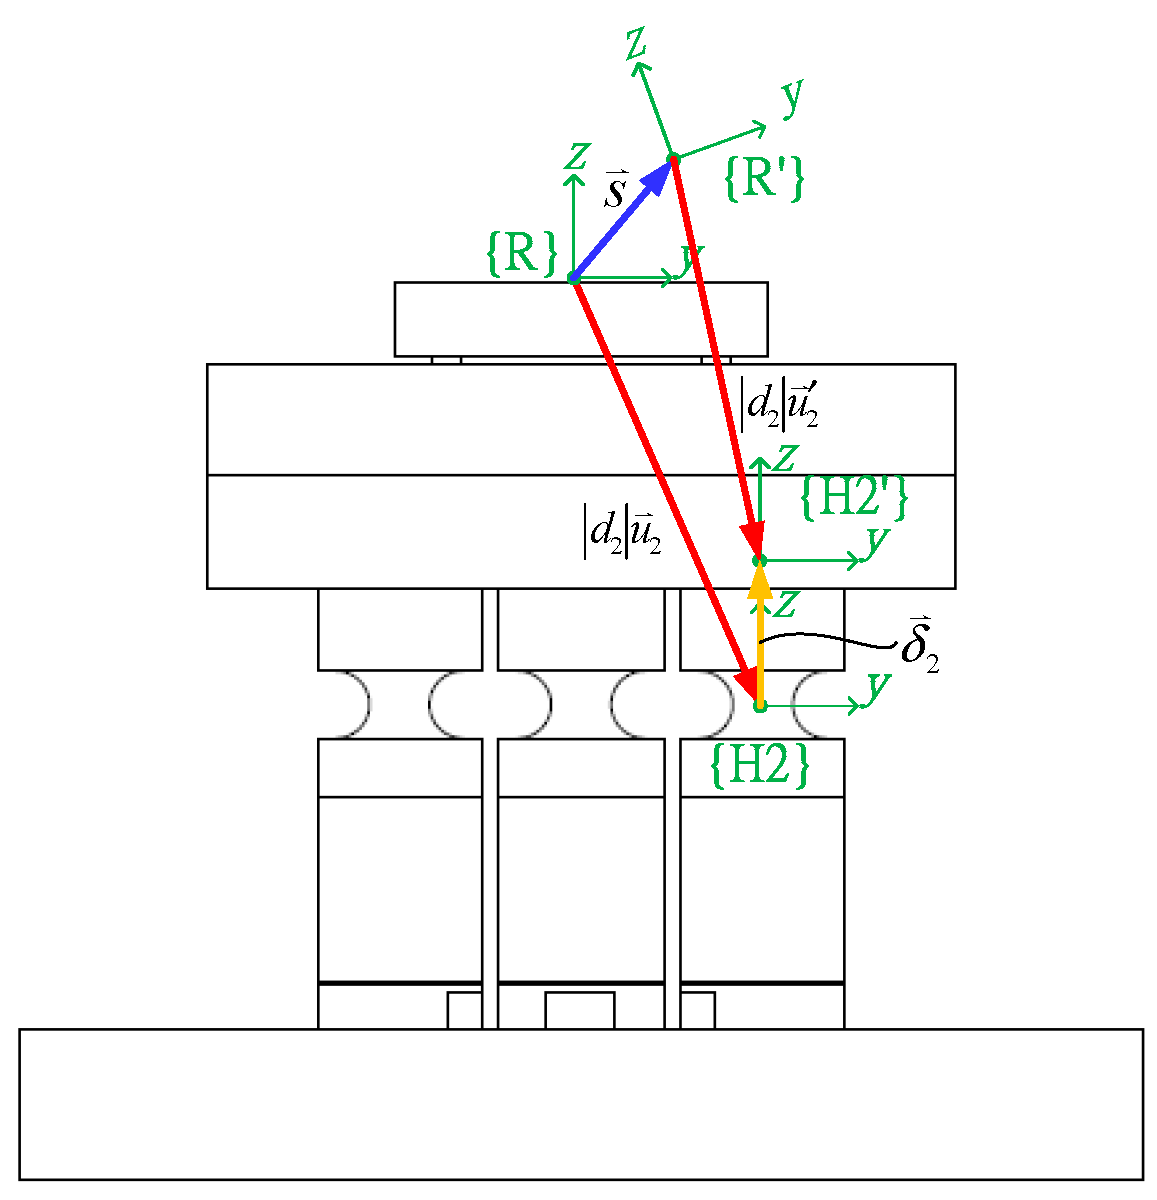
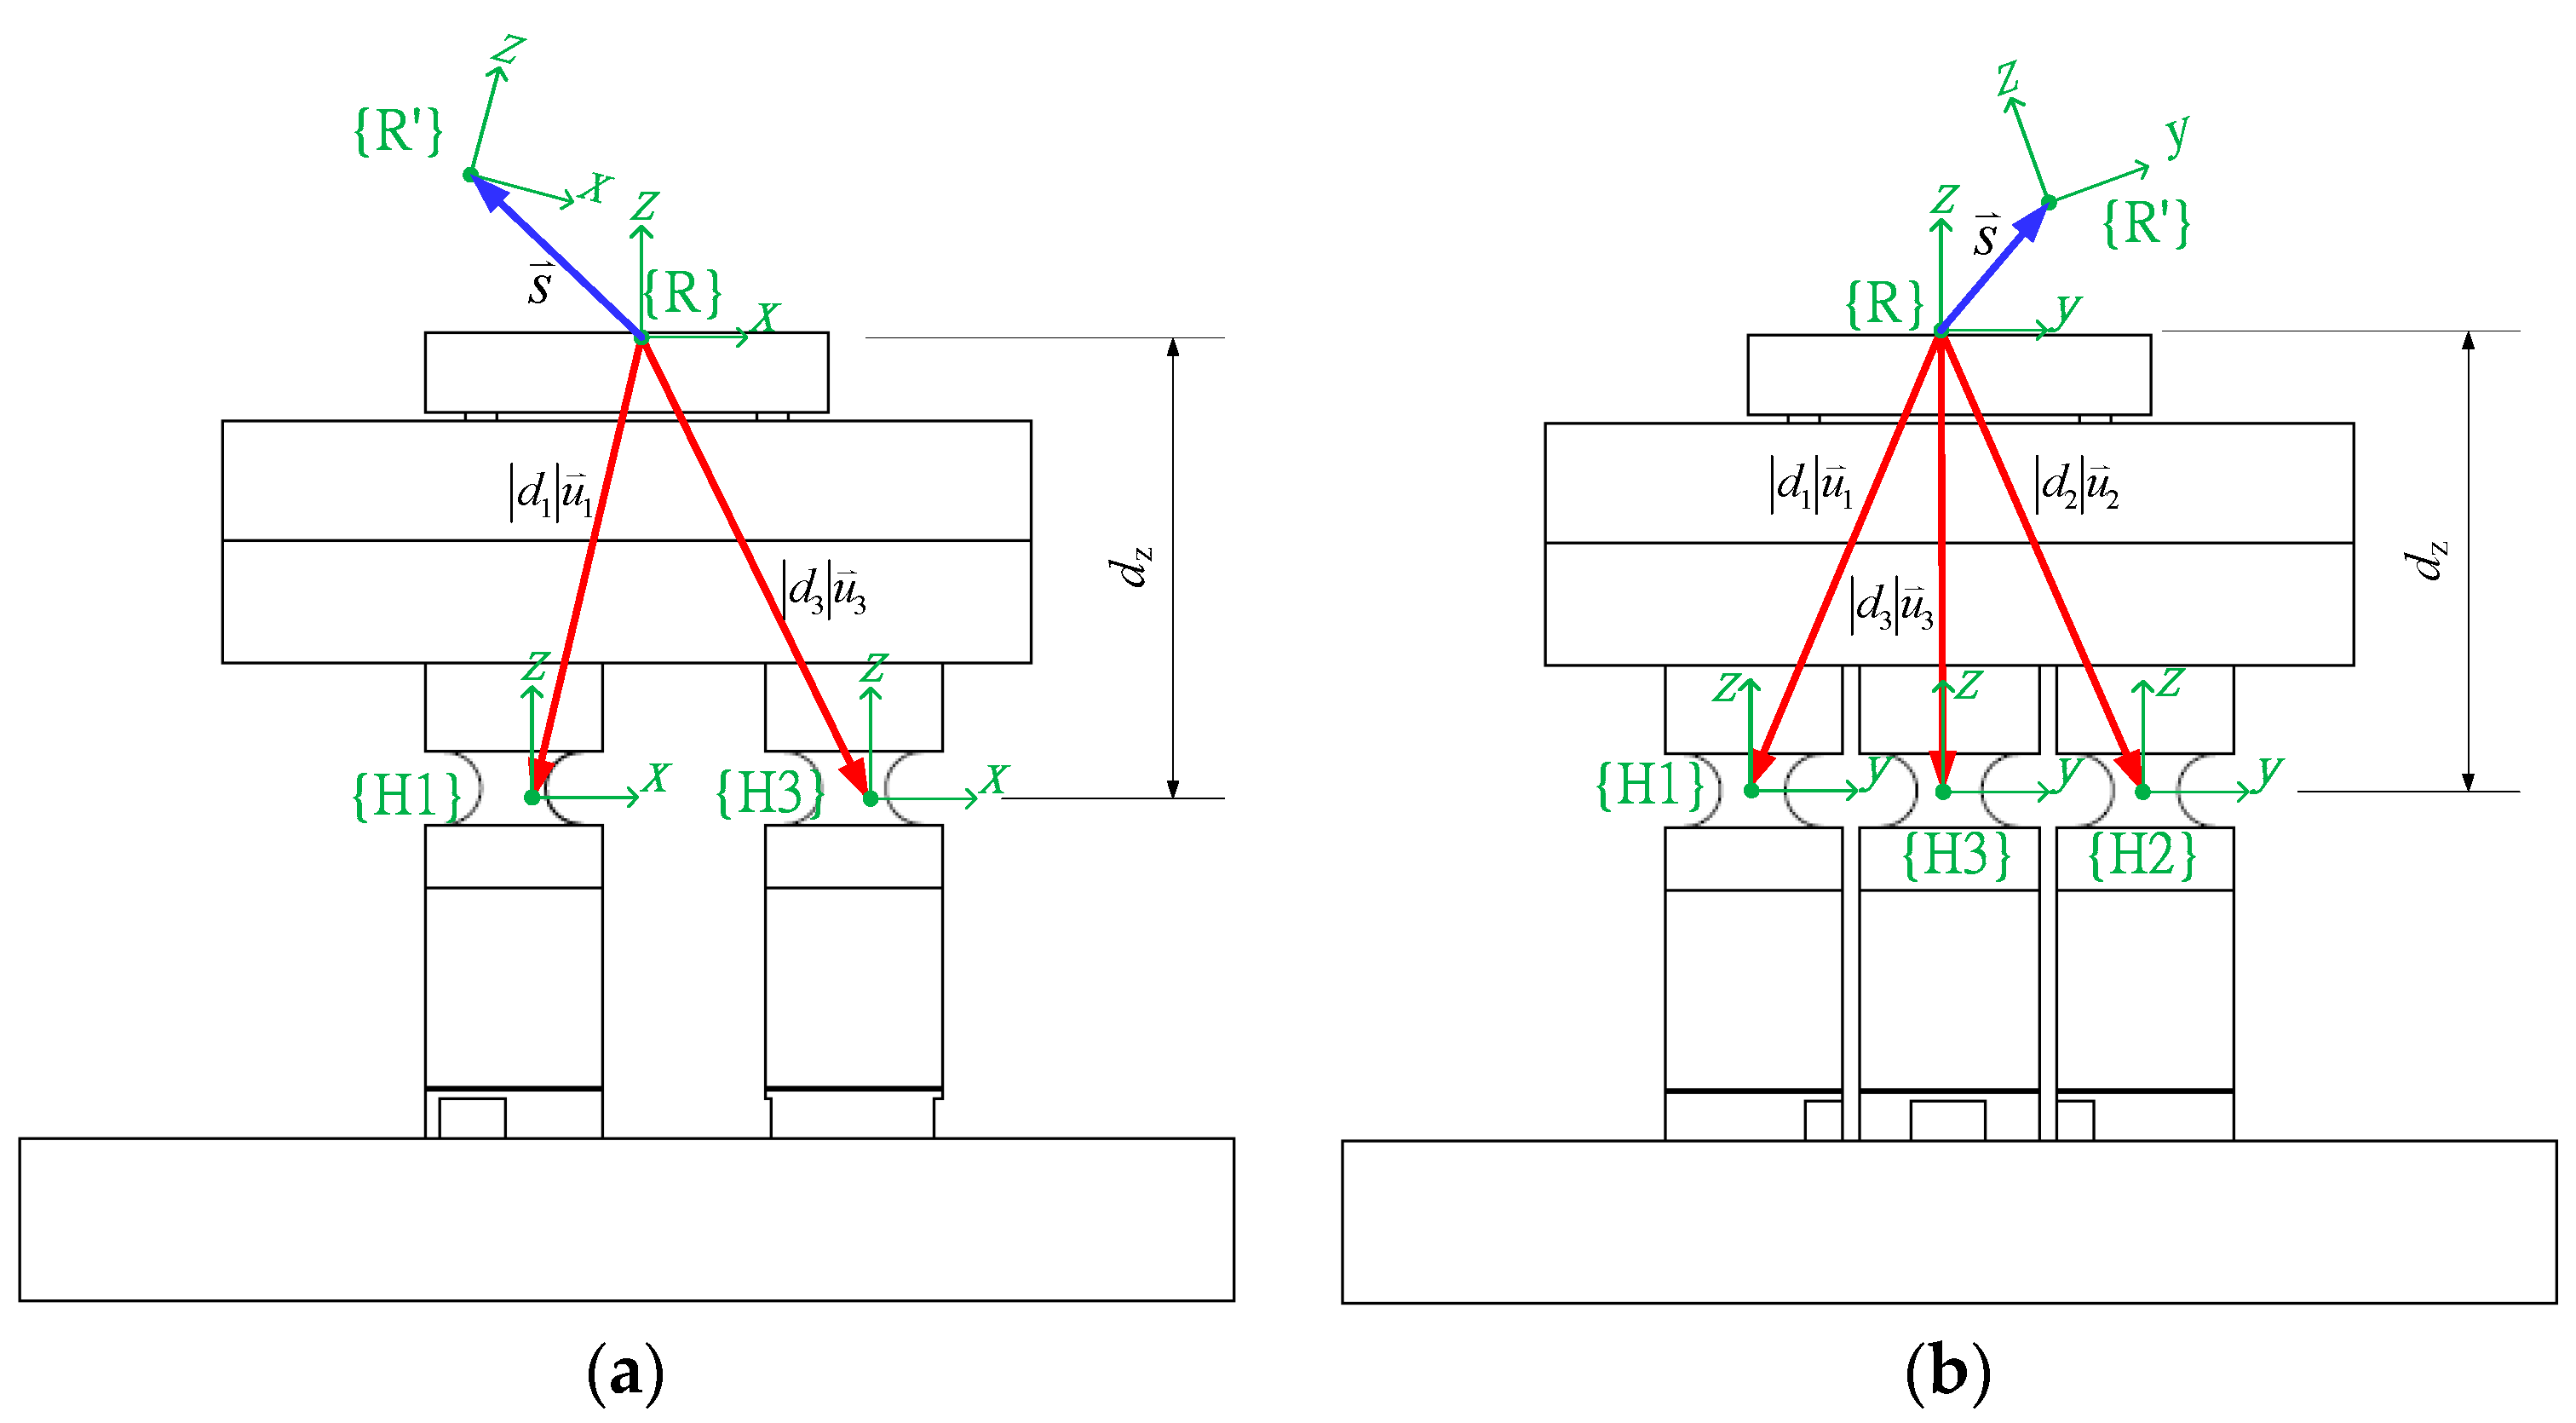
i'}. For example, (see Figure 8) when the reference point is moved from {R} to {R’}, the center position of the second flexure hinge is moved from {H2} to {H2’}, in which δ i = [ 0 0 δ z i ] represents the displacement vector of i-th piezoelectric actuator. Note that since the PFMs can only move along their z-axes, the vector components of the x- and y-axes are both zero. Assuming the distance and unity vector di from {Hi} to {R} is known, and u i = [ u i x u i y u i z ] T , vector from {Hi} to {R} is | d i | u i , when the stage is rotated along the x- and y-axes, the new unity vector denoted u i can be computed by the following equation:
u i = [ 1 0 0 0 cos θ x sin θ x 0 sin θ x cos θ x ] [ cos θ y 0 sin θ y 0 1 0 sin θ y 0 cos θ y ] u i .
From Figure 8, the movement equation of the z-tilt stage can be derived as:
s = | d i | u i + δ i | d i | u i ,
where the unity vectors are:
u i = [ u i x u i y u i z ] T = [ d i x d i x 2 + d i y 2 + d i z 2 d i y d i x 2 + d i y 2 + d i z 2 d i z d i x 2 + d i y 2 + d i z 2 ] .
After expanding, Equation (6) can be written as:
{ s x = | d i | ( u i x u i x cos θ y u i z sin θ y ) s y = | d i | ( u i y u i y cos θ y u i x sin θ y sin θ y + u i z sin θ y cos θ y ) s z = δ z i + | d i | ( u i z u i y sin θ x + u i x cos θ y sin θ y u i z cos θ y cos θ y ) .
For a nano-scale z-tilt compensation stage, the angular displacement is much smaller than one degree, thus Equation (8) can be linearized and simplified as below:
{ s x = | d i | u i z θ y s y = | d i | u i z θ x s z = δ z i + | d i | ( u i x θ y u i y θ x ) .
From Equation (9), it can be seen that when the stage is rotated along x- and y-axes, coupling displacement will occur in the z-axis. In this study, | d i | is much smaller than 1 meter (57.306 mm), the angular displacements of θx and θy are much smaller than 1 degree as well as u i z being smaller than 1. In other words, the coupling displacements of sx and sy are very small and can be ignored. This means the relationship between the actuators and the stage displacements can be written as:
[ δ z 1 δ z 2 δ z 3 ] = [ 1 | d 1 | u 1 y | d 1 | u 1 x 1 | d 2 | u 2 y | d 2 | u 2 x 1 | d 3 | u 3 y | d 3 | u 3 x ] [ s z θ x θ y ] .
Because of d i z = d z , Equation (10) can be rewritten as:
[ δ z 1 δ z 2 δ z 3 ] = [ 1 d 1 y d 1 x 1 d 2 y d 2 x 1 d 3 y d 3 x ] [ s z θ x θ y ] = M ψ .

4. Experimental Result

4.1. Subsection

The center positions of each PFM are listed in Table 10 and the distance from each reference point to the center of each flexure hinge is | d 1 | = | d 2 | = | d 3 | = 57.306 mm. The unity vectors from {R} to {H1}, {H2}, and {H3} are u 1 = [ 0.244 0.423 0.873 ] T , u 2 = [ 0.244 0.423 0.873 ] T , and u 3 = [ 0.488 0 0.873 ] T respectively. Since the rotating center of the z-tilt stage is not on the reference point, x- and y-axis coupling displacement exists only when the stage is rotated. Figure 9 shows the simulation result derived from Equation (8).

4.2. Control of Stage Positioning

In this study, displacement of the z-tilt stage was measured using a Renishaw RLE10 laser interferometer and a Hamamatsu S4349 quadrant Si PIN photodiode (QPD). The QPD was used to measure the tilt angle using the principle of auto-collimation. The measurement principle can refer to the previous studies [2,20]. Angle measurement resolution was about 0.1 arcsec, the measurement error being smaller than 0.25 arcsec after calibration. The piezoelectric actuator and signal amplifier used was an HPSt 150/14-10/12 VS22 and a PST 150/10/60 VS18. The stroke of the piezoelectric actuators used was 16 μm. The angular displacement of tilt motion of the stage is about ±30 arcsec. The signal was acquired using dSpace CP1103. The stage control following diagram (Figure 10) shows the inclusion of a PI controller and a feed-forward compensator [22]. The experimental setup is shown in Figure 11. In this study, minimum stepwise tests were performed to figure out the stage positioning resolution. Figure 12 shows the results of test positioning of the z-tilt stage at 20 nm and 0.1 arcsec. Signal noise can also be determined in the stepwise tests.
Because the evaluation index of the optimal design of the flexure hinge relies on coupling displacement and natural frequency, the following experiment was used as a check. Figure 13 shows coupling displacement experiment result. The tracking signal is a sine wave with 1 Hz frequency and ±5 arcsec amplitude. The stage is controlled in closed loop with sampling rate of 800 Hz. When giving the stage a sine wave command for θy only, the time response is shown in Figure 13b,c. The result shows the coupling displacement of the z-axis and θx are about 300 nm and 1 arcsec. This is better than the result obtained by simulation. The natural frequency of the stage was determined by an impulse response experiment [14] and the Results are shown in Figure 14. The Natural frequency is about 510 Hz. This value is lower than that obtained by simulation.

5. Conclusions

In this study, an eight step Taguchi procedure was used to design a circularity flexure hinge for a nano-scale z-tilt piezoelectric actuator based stage. The most important design parameters that effect stage performance, natural frequency, and coupling displacement, are minimum diameter, body height, and notch radius. The results show that the minimum diameter of the circularity flexure hinge is the most important design parameter. The simulation results also show that the flexure hinge influences stage coupling displacement more than natural frequency, and a smaller minimum diameter will give less coupling displacement, but will decrease stage bandwidth and stiffness. Simulation and experimental comparison table shows in Table 11. The stage natural frequency can be determined by its impulse response and found a natural frequency of 510 Hz and coupling displacement of 300 nm for z-axis, 1 arcsec for θx the stage tracked a sine wave of 1 Hz and an amplitude of 5 arcsec on θy. The natural frequency of the experimental result is a little lower than in the simulation. This might be because the stiffness of the piezoelectric actuator structure is not an object like that in the CATIA simulation. The actuators are made of solid piezoelectric modules, a steel housing, a rubber o-ring, and a cover. The actual physical structure of the piezoelectric actuators is looser and not so stiff as it is in the simulation.

Acknowledgments

This work was supported by the Ministry of Science and Technology, Taiwan.

Conflicts of Interest

The author declare no conflicts of interest.

References

  1. Lee, C.-W.; Kim, S.-W. An ultraprecision stage for alignment of wafers in advanced microlithography. Precis. Eng. 1997, 21, 113–122. [Google Scholar] [CrossRef]
  2. Liu, C.-H.; Chen, C.-L.; Lee, H.-W.; Jywe, W.-Y. Improvement of the nonlinear dynamic response of a z-tilts lead zirconate titanate-based compensation stage using the capacitor insertion method. Rev. Sci. Instrum. 2009, 80, 1151–1065. [Google Scholar] [CrossRef] [PubMed]
  3. Polit, S.; Jingyan, D. Development of a high-bandwidth XY nanopositioning stage for high-rate micro-/nanomanufacturing. IEEE/ASME Trans. Mechatron. 2011, 16, 724–733. [Google Scholar] [CrossRef]
  4. Chen, C.-M.; Hsu, Y.-C.; Fung, R.-F. System identification of a scott–russell amplifying mechanism with offset driven by a piezoelectric actuator. Appl. Math. Model. 2012, 36, 2788–2802. [Google Scholar] [CrossRef]
  5. Ahuett-Garza, H.; Chaides, O.; Garcia, P.N.; Urbina, P. Studies about the use of semicircular beams as hinges in large deflection planar compliant mechanisms. Precis. Eng. 2014, 38, 711–727. [Google Scholar] [CrossRef]
  6. Tian, Y.; Shirinzadeh, B.; Zhang, D.; Zhong, Y. Three flexure hinges for compliant mechanism designs based on dimensionless graph analysis. Precis. Eng. 2010, 34, 92–100. [Google Scholar] [CrossRef]
  7. Tian, Y.; Shirinzadeh, B.; Zhang, D. Closed-form compliance equations of filleted V-shaped flexure hinges for compliant mechanism design. Precis. Eng. 2010, 34, 408–418. [Google Scholar] [CrossRef]
  8. Ha, J.-L.; Kung, Y.-S.; Hu, S.-C.; Fung, R.-F. Optimal design of a micro-positioning scott-russell mechanism by taguchi method. Sens. Actuator A Phys. 2006, 125, 565–572. [Google Scholar] [CrossRef]
  9. Dao, T.-P.; Huang, S.-C. Robust design for a flexible bearing with 1-DOF translation using the taguchi method and the utility concept. J. Mech. Sci. Technol. 2015, 29, 3309–3320. [Google Scholar] [CrossRef]
  10. Ouyang, P.R. A spatial hybrid motion compliant mechanism: Design and optimization. Mechatronics 2011, 21, 479–489. [Google Scholar] [CrossRef]
  11. Pahk, H.J.; Lee, D.S.; Park, J.H. Ultra precision positioning system for servo motor-piezo actuator using the dual servo loop and digital filter implementation. Int. J. Mach. Tools Manuf. 2001, 41, 51–63. [Google Scholar] [CrossRef]
  12. Jywe, W.-Y.; Jeng, Y.-R.; Liu, C.-H.; Teng, Y.-F.; Wu, C.-H.; Wang, H.-S.; Chen, Y.-J. A novel 5DOF thin coplanar nanometer-scale stage. Precis. Eng. 2008, 32, 239–250. [Google Scholar] [CrossRef]
  13. Woronko, A.; Huang, J.; Altintas, Y. Piezoelectric tool actuator for precision machining on conventional CNC turning centers. Precis. Eng. 2003, 27, 335–345. [Google Scholar] [CrossRef]
  14. Lin, C.-J.; Yang, S.-R. Precise positioning of piezo-actuated stages using hysteresis-observer based control. Mechatronics 2006, 16, 417–426. [Google Scholar] [CrossRef]
  15. Banning, R.; de Koning, W.L.; Adriaens, H.J.M.T.A.; Koops, R.K. State-space analysis and identification for a class of hysteretic systems. Autom 2001, 37, 1883–1892. [Google Scholar] [CrossRef]
  16. Ping, G.; Musa, J. Tracking control of a piezoceramic actuator. IEEE Trans. Control Syst. Technol. 1996, 4, 209–216. [Google Scholar] [CrossRef]
  17. Song, G.; Jinqiang, Z.; Xiaoqin, Z.; Abreu-Garcia, J.A.D. Tracking control of a piezoceramic actuator with hysteresis compensation using inverse preisach model. IEEE/ASME Trans. Mechatron. 2005, 10, 198–209. [Google Scholar] [CrossRef]
  18. Hurtado, J.E.; Barbat, A.H. Equivalent linearization of the bouc–wen hysteretic model. Eng. Struct. 2000, 22, 1121–1132. [Google Scholar] [CrossRef]
  19. Ru, C.; Sun, L. Improving positioning accuracy of piezoelectric actuators by feedforward hysteresis compensation based on a new mathematical model. Rev. Sci. Instrum. 2005, 76. [Google Scholar] [CrossRef]
  20. Liu, V.-T.; Liu, C.-H.; Chen, T.-Y.; Lin, C.-L.; Lin, Y.-C. Tracking control of the z-tilts error compensation stage of the nano-measuring machine using capacitor insertion method. Adv. Intell. Comput. Theor. Appl. 2007, 4681, 616–625. [Google Scholar]
  21. Friedrich, R.; Lammering, R.; Heurich, T. Nonlinear modeling of compliant mechanisms incorporating circular flexure hinges with finite beam elements. Precis. Eng. 2015, 42, 73–79. [Google Scholar] [CrossRef]
  22. Zhuang, G.-Y.; Lee, H.-W.; Liu, C.-H. Determination of the position and orientation of a flat piezoelectric micro-stage by moving the optical axis. Rev. Sci. Instrum. 2014, 85. [Google Scholar] [CrossRef] [PubMed]
Figure 1. The simplest structure of a z-tilt stage.
Inventions 01 00015 g001
Figure 2. Simulation results of a z-tilt stage without (upper) and with (lower) flexure hinges.
Inventions 01 00015 g002
Figure 3. The important parameters for optimal circular flexure hinge design, the parameters including minimum diameter (b), body height (h) and notch radius (r).
Inventions 01 00015 g003
Figure 4. Simulation result for applied force of ±20 N, and the based stage is fix by the fix clamps as well as the flexure hinge constrained using the surface sliders (as an example).
Inventions 01 00015 g004
Figure 5. Parameters and levels cross-correlation charts: (a) Parameter A; (b) Parameter B; (c) Parameter C. 1st response is the natural frequency output, 2nd response is the coupling angular displacement.
Inventions 01 00015 g005
Figure 6. Install position of each PFM, in which Pi represents i-th PFM, dix and diy represented the distance from the stage center line to the center of i-th PFM at x- and y-axes.
Inventions 01 00015 g006
Figure 7. z-tilt stage movement vector analyze model. (a) xz plane (b) yz plane. In the figure, vector s is the displacement vector of the working platform from {R} moving to {R’}; dz is the height between the surface of the working platform to the rotation center of the flexure hinges; the vectors | d i | u i is the distance vector from {R} to {Hi} for i-th PFM and i = 1, 2, 3.
Inventions 01 00015 g007
Figure 8. When the stage undergoes z-tilt motion, the center position of the flexure hinge is changed from {H2} to {H2’}. In the figure, vector s is the displacement vector of the working platform from {R} moving to {R’}; vector δ 2 is displacement vector of PFM2 at z-direction; the vectors | d 2 | u 2 is the distance vector from {R} to {H2}; | d 2 | u 2 ' is the distance vector from {R’} the {H2’} after the working platform moved.
Inventions 01 00015 g008
Figure 9. Coupling displacement simulation result. During simulation, the angular displacement of the z-tilts was set to ±30 arcsec, and the coupling displacement was calculated using Equation (8).
Inventions 01 00015 g009
Figure 10. Stage control following diagram. In the figure, ‘u’ represents the control command; ‘y’ represents the measured displacement; ‘e’ represents position error which equals u−y; vector ψ and matrix M are the stage displacement vector and stage-PFM displacement converting matrix, respectively as seen Equation (11); dzi is the displacement value of i-th PFM; PZT-Amp. is signal amplifier of the piezo-electric actuator; Pi represents i-th PFM.
Inventions 01 00015 g010
Figure 11. The experimental setup.
Inventions 01 00015 g011
Figure 12. Stage resolution experiment results: (a) z-axis movement; (b) θx movement; (c) θy movement.
Inventions 01 00015 g012aInventions 01 00015 g012b
Figure 13. Coupling displacement experiment results: (a) θy movement command, a sine wave of 1 Hz and amplitude 5 arcsec; (b) time response of z-axis movement; (c) time response of θx movement.
Inventions 01 00015 g013
Figure 14. Stage impulse response experiment results: (a) frequency response of the stage before the impulse test (signal noise); (b) frequency response of the stage when an impulse was input to the stage.
Inventions 01 00015 g014
Table 1. The level values of each parameter (mm).
ParameterMinimal DiameterHeightNotch Rad.
Symbolbhr
Level codeABC
Level 14253
Level 26303.75
Level 38354.5
Table 2. The OA9(33) orthogonal array.
Trial\ParameterABC
1111
2122
3133
4212
5223
6231
7313
8321
9332
Table 3. Simulation results.
TrialNatural Frequency (Hz)Coupling Angular Displacement (%)
No load5 kg loadPercentage
11143.25510.241.02
21080.58482.504.89
31018.74455.838.57
41246.49555.451.79
51154.19515.471.71
61126.61506.31.77
71408.27626.490.03
81294.4579.640.11
91218.48546.850.32
Table 4. Simulated Displacements of each trial.
Trialz-Axis (μm)x-Axis (μm)θy (arcsec)θx (arcsec)θxy (%)
12.91.912.070.121.02
22.92.011.880.584.89
32.62.010.750.928.57
43.02.012.480.221.79
52.92.112.110.211.71
62.72.011.210.201.77
73.02.012.320.000.03
82.82.011.550.010.11
93.02.312.320.040.32
Table 5. S/N ratio calculation results (including orthogonal array).
TrialABCNatural Frequency (dB)Coupling Angular Displacement (dB)
111156.37759.828
212255.89146.214
313355.39441.340
421257.11754.943
522356.46555.340
623156.30055.041
731358.16490.458
832157.48079.172
933256.97169.897
Table 6. S/N Ratio of natural frequency simulation results.
Parameterbhr
SymbolABC
Level 155.887 dB57.219 dB56.719 dB
Level 256.627 dB56.612 dB56.660 dB
Level 357.538 dB56.222 dB56.674 dB
δ1.651 dB0.997 dB0.059 dB
Ranking123
Table 7. S/N Ratio of coupling angular displacement simulation results.
Parameterbhr
SymbolABC
Level 149.127 dB68.410 dB64.680 dB
Level 255.108 dB60.242 dB57.018 dB
Level 379.842 dB55.426 dB55.526 dB
δ30.715 dB12.984 dB9.154 dB
Ranking123
Table 8. Optimal circular flexure hinge design parameters.
ParameterMinimal DiameterBody HeightNotch Radius
Parameterbhr
Level valueA3B1C1
Optimal value8 mm25 mm4.5 mm
Table 9. Specifications of the z-tilt stage design (simulation result).
Output ResponseResult
Natural frequencyNo-load1408.27 Hz
5 kg load626.49 Hz
θy rotatingCoupling angular displacement of θx0.03%
Table 10. List of the position of each PFM (unit: mm).
PFMs Center Positionxyz
PFM1−14.000−24.24950.000
PFM2−14.00024.24950.000
PFM328.0000.00050.000
Table 11. Comparison between the simulation and experimental results.
Output ResponseResult
Natural frequencyNo-load1408.27 Hz*
5 kg load626.49 Hz510 Hz
θy rotatingCoupling angular displacement of θx0.032%20%
Note: * The natural frequency could not be measured due to the mirror used to reflect the laser ray was installed on the 5 kg mount.

