Abstract
Steamed ginseng water (SGW) is a by-product of the repeated thermal processing of red ginseng, which is characterized by a high bioactive content, better skin care activity, and a large output. However, its value has been ignored, resulting in environmental pollution and resource waste. In this study, UHPLC-Q-Exactive-MS/MS liquid chromatography–mass spectrometry and multivariate statistical analysis were conducted to characterize the compositional features of the repeated thermal-treated SGW. The antioxidant activity (DPPH, ABTS, FRAP, and OH) and chemical composition (total sugars, total saponins, and reducing and non-reducing sugars) were comprehensively evaluated based on the entropy weighting method. Four comparison groups (groups 1 and 3, groups 1 and 5, groups 1 and 7, and groups 1 and 9) were screened for 37 important common difference markers using OPLS-DA analysis. The entropy weight method was used to analyze the weights of the indicators; the seventh SGW sample was reported to have a significant weight. The results of this study suggest that heat treatment time and frequency can be an important indicator value for the quality control of SGW cycling operations, which have great potential in antioxidant products.
1. Introduction
Panax ginseng C. A. Mey., which belongs to the Araliaceous family, is a perennial herbaceous plant and is one of the most well-known Chinese folk medicines [1]. According to the different processing methods, ginseng products can be classified into different categories, including sundew ginseng, Dali ginseng, red ginseng, and black ginseng [2,3]. In recent years, it has been reported that nearly 13,000 tons of fresh ginseng is processed into red ginseng in Jilin Province, China, which is the most well-known ginseng producing district, producing 1/3 of its global output [4,5,6]. SGW is the main liquid by-product that occurs during the red ginseng thermal manufacturing process; it has a light-yellow color and a strong ginseng flavor, and is accumulated during the evaporating process [7,8]. In Chinese folklore, people usually gather the SGW as a natural anti-aging, whitening, and anti-wrinkling skincare material; however, it is often discarded as a waste material during industrial processing, causing environment pollution and resource waste.
An excessive exposure to solar UV irradiation and oxidizing free radicals could lead to the aging of human skin. For a long time, people have been looking for natural and effective skincare materials. Ginseng, as the most popular botanical cosmetic material, was found to have better skincare activities after the appropriate heat treatment [9,10]. During the evaporating process, hydrolysis, isomerization, and decarboxylation degradation reactions could occur either simultaneously or separately; for instance, the major ginsenosides, which are the most functional ingredients in ginseng, could be converted into rare ginsenosides. As such, the characteristic activities of ginseng are thus improving [11]. In addition, many sesquiterpenes, including sesquiterpene polyacetylene and the products of the Maillard reaction, are found in steamed ginseng water extracts; other types of glycosides, like phenolics, lignans, amino acids, polysaccharides, and aliphatic and aromatic compounds, were also found in the water extract [12]. The origin of the effective utilization of SGW resources is still unclear, and few documents have reported on the impact of repeated thermal processes on the variation in the composition and antioxidant activities of SGW.
Although red ginseng has a high medicinal value, it is necessary to determine an alternative that is has a high yield and a low cost. As the heat treatment time was extended, the chemical composition and activity of SGW changed dynamically. In the current study, we investigated the variation in the content of SGW when it was subjected to a repeated thermal process from 1 to 9 times; this was carried out through the observation on the total sugar, total saponins, and reducing sugar contents. By using UHPLC-Q-Exactive-MS/MS liquid mass spectrometry, the chemical constituents of SGW were identified when combined with the principal component analysis (PCA) and orthogonal partial least squares discriminant analysis (OPLS-DA) methodologies. A total of eight ginsenosides that shared Q-markers were identified by comparing the four model groups of SGW (group 1 and 3, groups 1 and 5, groups 1 and 7, and groups 1 and 9). Thermal processing not only has effects on SGW’s chemical composition, but also on its antioxidant activities. To evaluate the trends in the antioxidant activities SGW that has been subjected to between 1 and 9 times repeated thermal processes, the DPPH, ABTS, FRAP reducing capacity, and hydroxyl radicals were monitored. Our findings showed a scientific method for effectively using the by-products of red ginseng’s repeated thermal processing, as well as a promising way to provide a theoretical basis for its potential on antioxidant products.
2. Results
2.1. Plotting of Standard Curves
For calculating the FRAP reduction ability, the following regression equation was used: Y = 3.762 x + 0.1627 (r = 0.9994). The antioxidant capacity of the samples was assayed using Fe2+ to generate a blue-violet complex with TPTZ under acidic conditions.
For calculating the total sugar content, the following regression equation was used: Y = 3.456 x + 0.128 (r = 0.9958). The absorbance values were substituted into the standard curve as y-values, and the x-values were calculated to obtain the total sugar content.
For calculating the reducing sugar content, the following regression equation was used: Y = 1.1634 x − 0.0404 (r = 0.9936). The Y value is the absorbance value of SGW, while the X value is calculated using the formula to obtain the reducing sugar content.
For calculating the total saponins content, the following regression equation was used: Y = 0.5801 x + 0.0196 (r = 0.9995). The Y value gives the absorbance value of SGW, and the X value is calculated using the formula to obtain the total saponins content.
2.2. Quantitative Determination of SGW
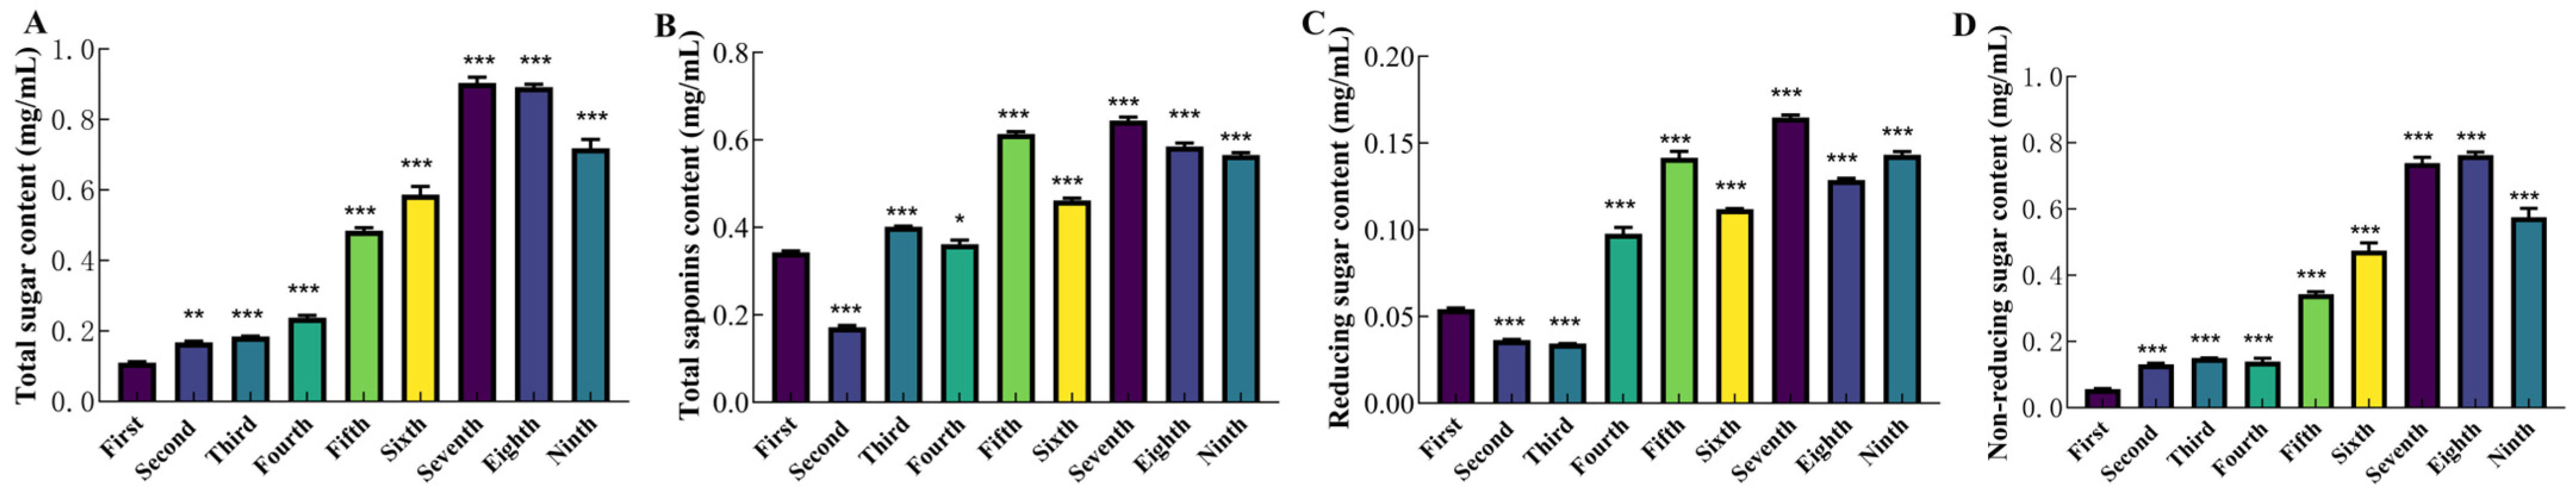
The time and frequency of the repeated thermal processing affected the total sugar content. As shown in Figure 1, the highest total sugar content of the seventh SGW was 0.90 mg/mL. The total saponin content of ginseng showed a fluctuating trend during repeated heat treatment, and the highest total saponin content of the seventh SGW was 0.64 mg/mL. The highest content of reducing sugars was 0.16 mg/mL in the seventh SGW, while in the eighth SGW, this value was 0.76 mg/mL.
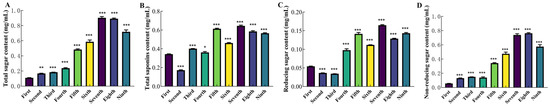
Figure 1.
Four different types of content of steamed ginseng water (SGW) subjected to between 1 and 9 times of repeated thermal treatments. (A) Total sugar content of SGW. (B) Total saponins content of SGW. (C) Total reducing sugar content of SGW. (D) Total non-reducing sugar content of SGW. (* p < 0.05; ** p < 0.01; *** p < 0.001 vs. SGW1).
2.3. Results of Chemical Composition
2.3.1. Multivariate Statistical Analysis of Chemical Composition following Repeated Thermal Processes on SGW
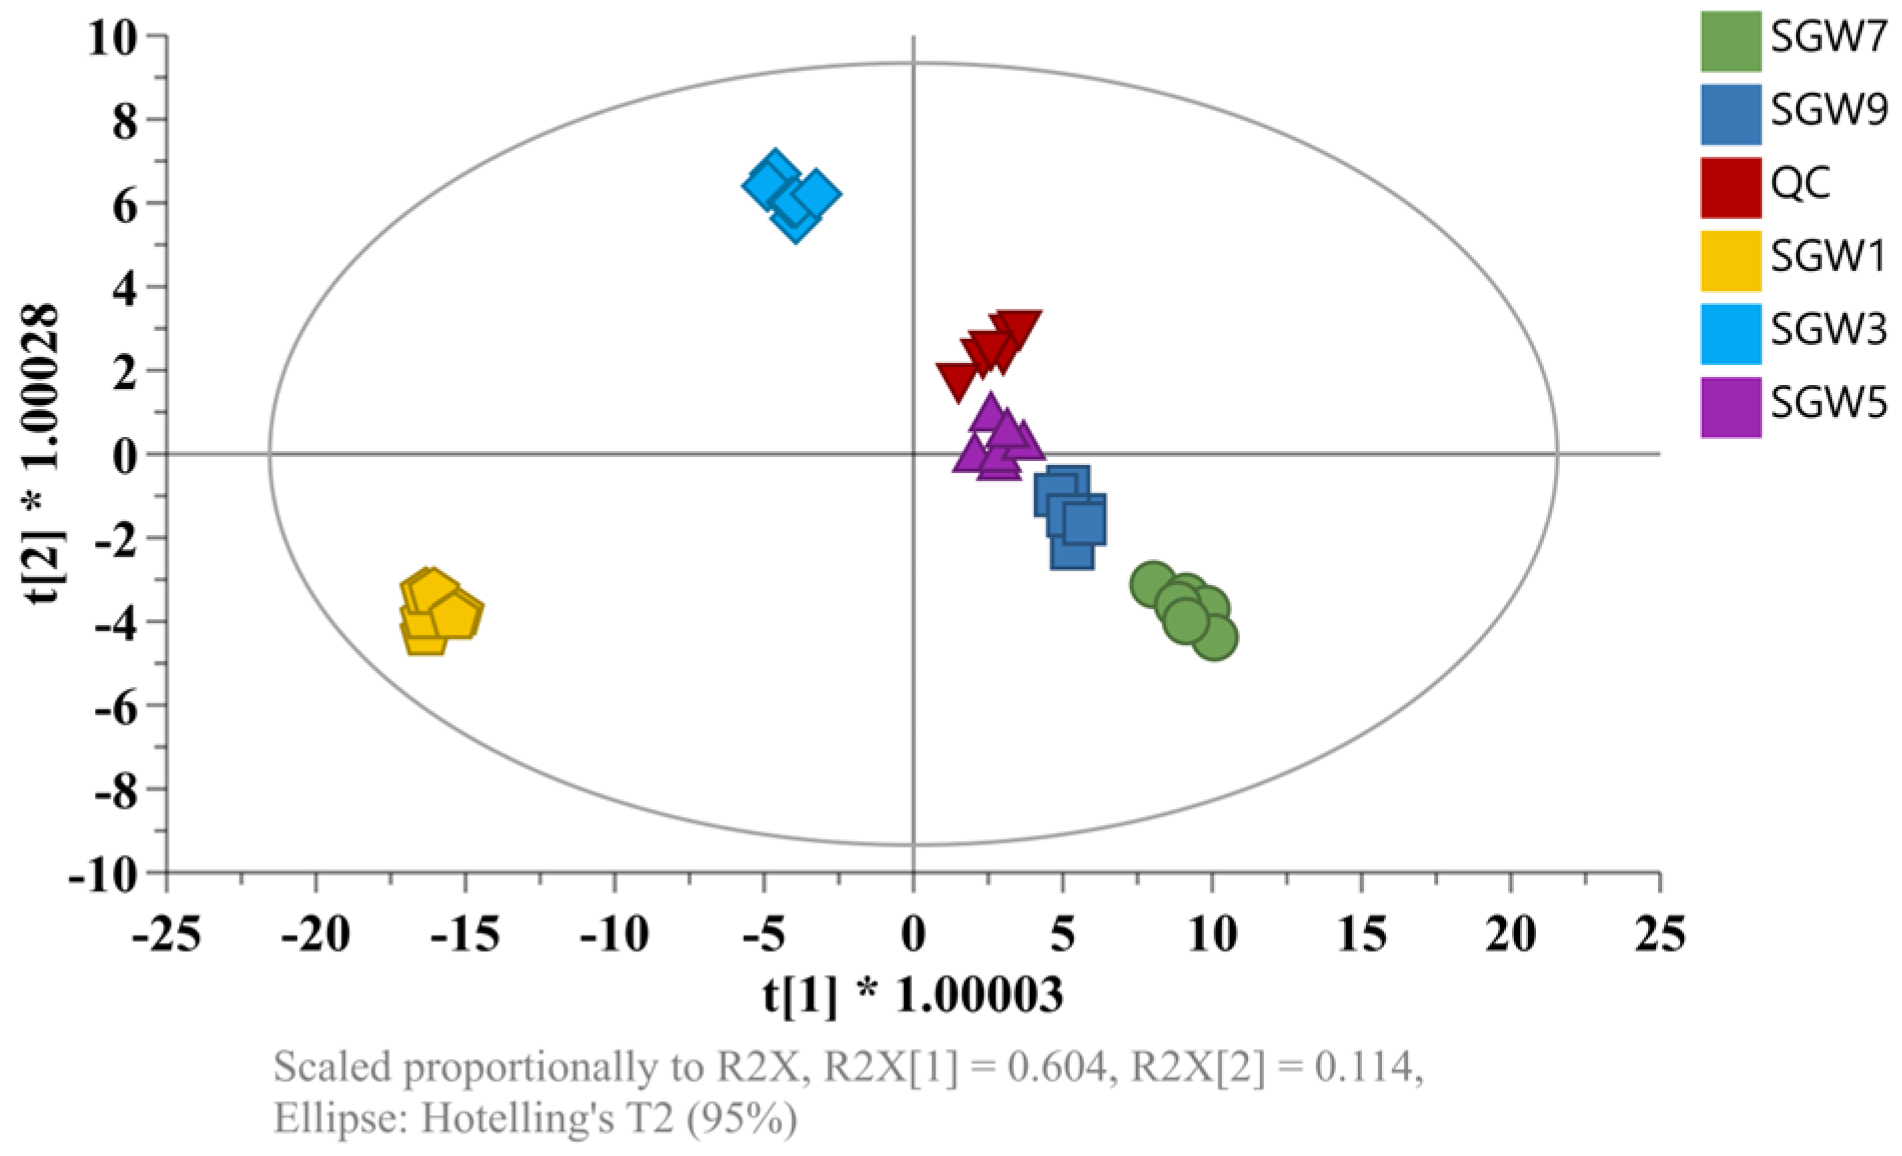
PCA is a different model, which is based on projection, to provide a path for the data observation from an informatic point of view [13]. The different SGWs were analyzed using UHPLC-Q-Exactive-MS/MS. The extraction and optimization of peaks and the alignment of retention times were performed on LC-MS data using XCMS. PCA analysis was performed in unsupervised mode to clearly differentiate the SGW samples to provide a more intuitive and fine-grained view of the group differences. As shown in Figure 2, SGW was clearly separated into six groups. The quality control (QC) samples were tightly clustered, which indicated that the established PCA model had a good fit and predictability.

Figure 2.
Principal component analysis (PCA) scores of the SGW and QC samples in the (−) negative ion mode.
2.3.2. Discovery and Identification of Biomarkers for Chemical Composition of Repeated Thermal Processes on SGW
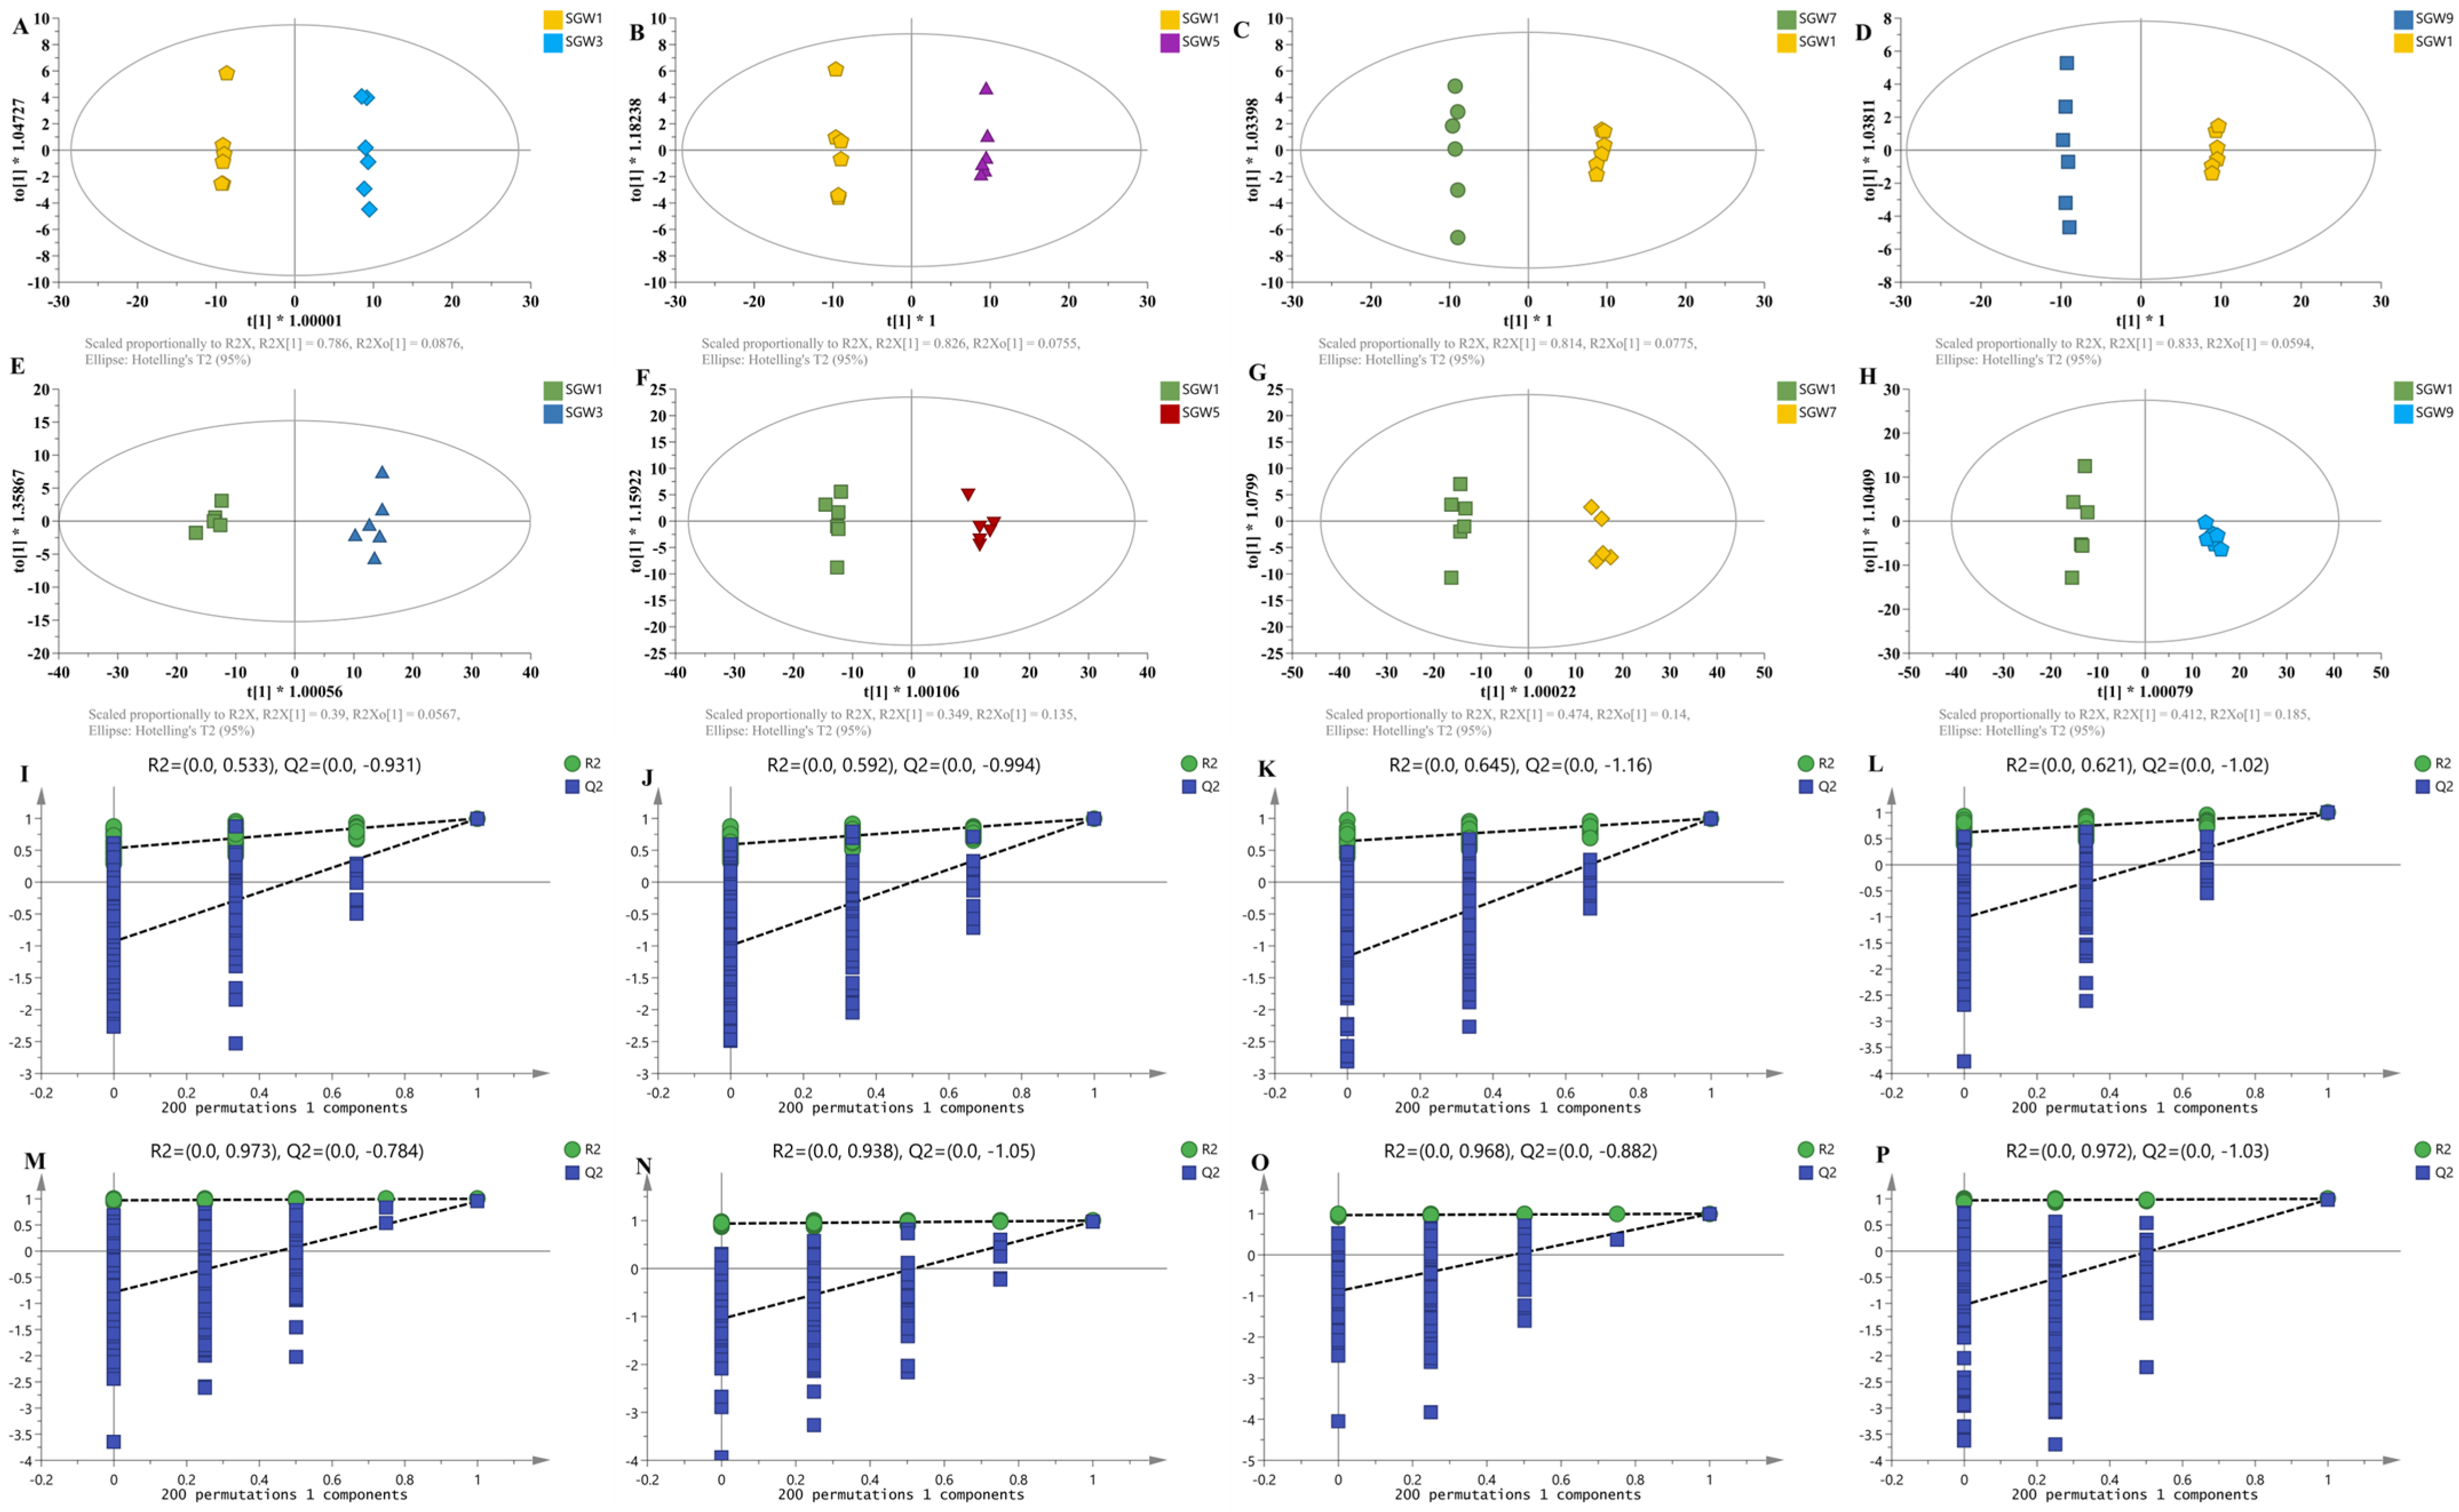
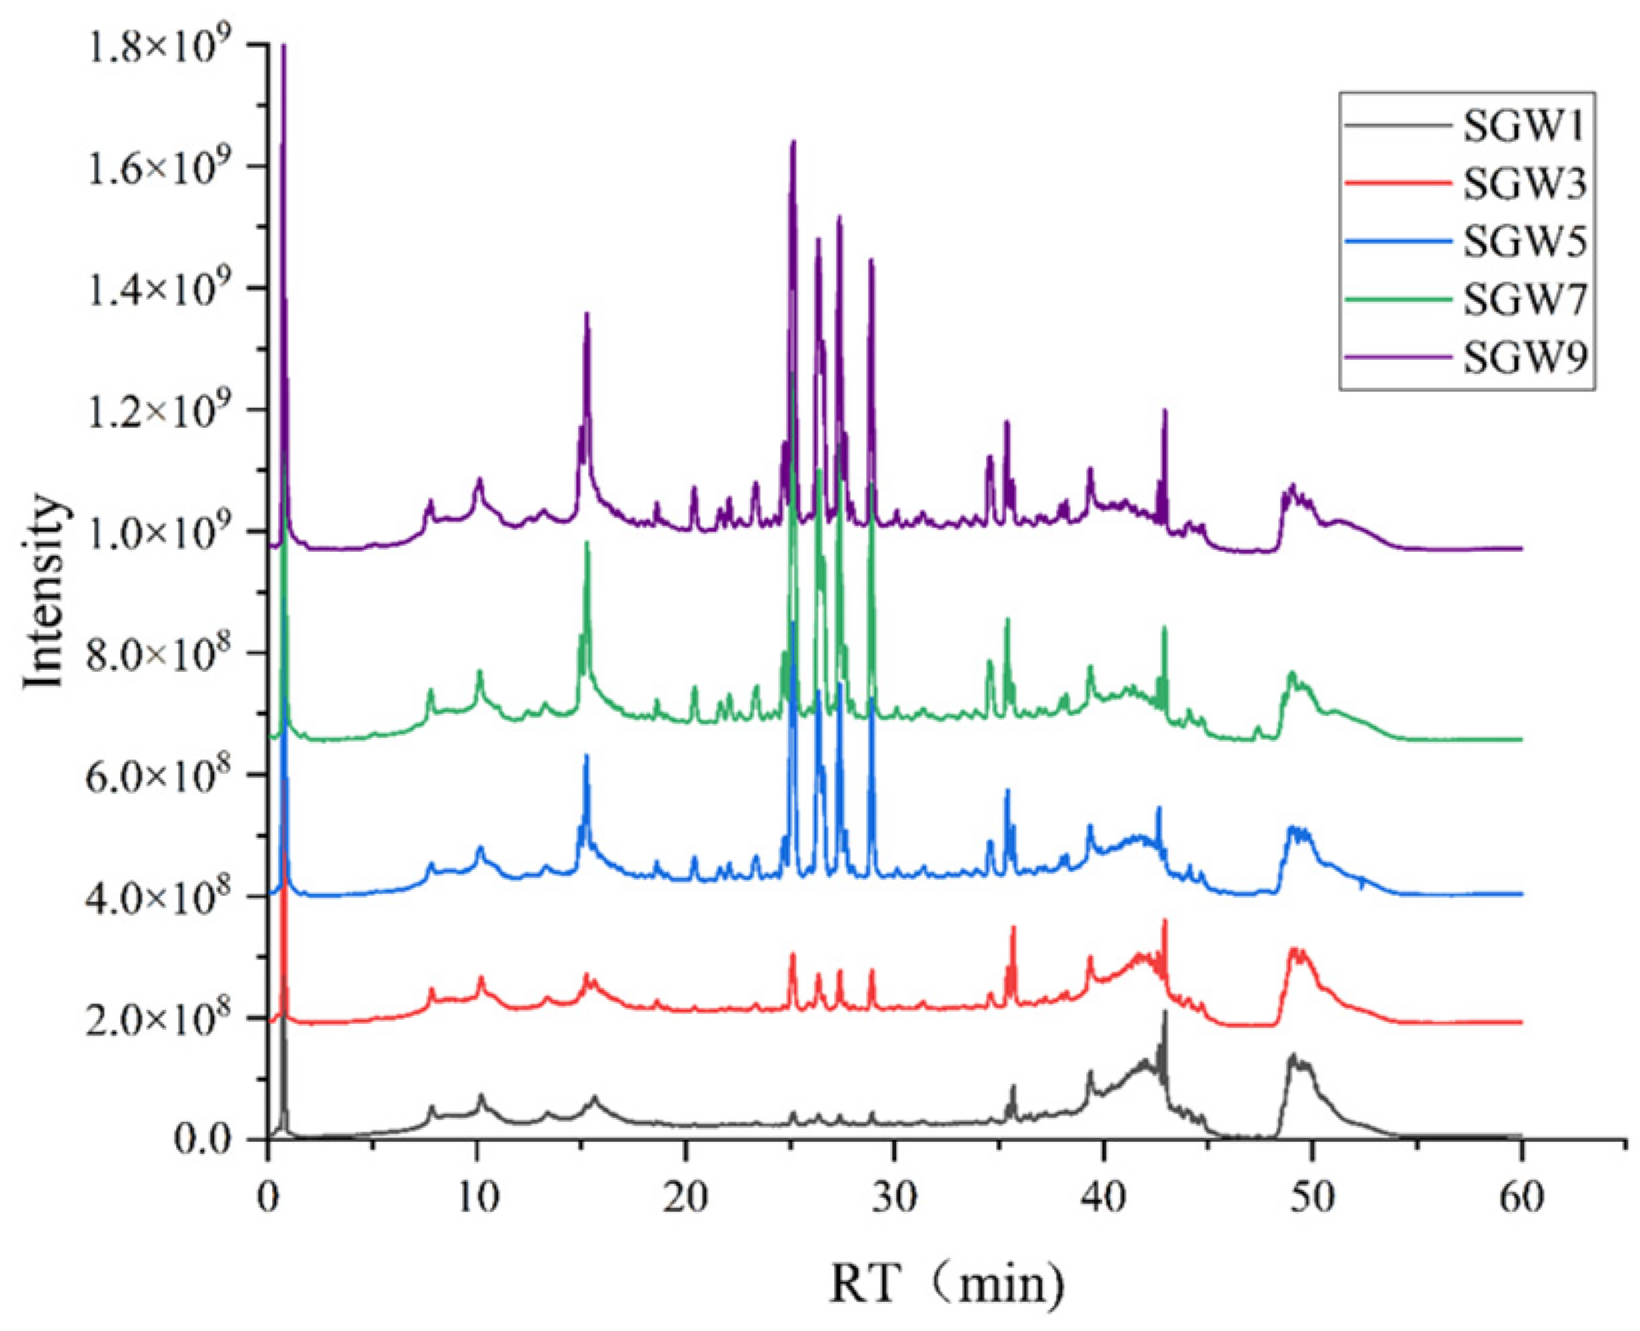
The OPLS-DA model was utilized to generate the score plots, from which it can be seen that the model has a good predictive ability (Figure 3). Additional validation was then performed using a permutation test (200 times) to assess the validity of the OPLS-DA model. All R2 (cum) and Q2 (cum) values calculated from the data for each mutation were lower than the original values of the developed model, and the inner cross section of the regression line for Q2 on the y-axis was negative; this indicates that the developed model was not overfitted and had a good fitting and predictive ability. Based on the importance values of the projected variables (VIP) in the OPLS-DA model, combined with the t-test results, potential candidate biomarkers in the first, third, fifth, seventh, and ninth evaporated ginseng water samples were screened out, according to a VIP > 1 and a p < 0.05. The results showed that 330 differential compounds were screened in the first vs. third ratio; a total of 250 differential compounds were screened in the first vs. fifth ratio; in total, 289 differential compounds were screened in the first vs. seventh ratio; a total of 250 differential compounds were screened in the first vs. ninth ratio. Based on the above screened compounds, 37 differential compounds were screened with FC > 2 and p < 0.01. The total ion chromatograms (TICs) of the SGW samples after different repeated thermal processes using UHPLC-Q-Exactive-MS/MS are shown in Figure 4. The results of the identification of the differential components are shown in Table 1.
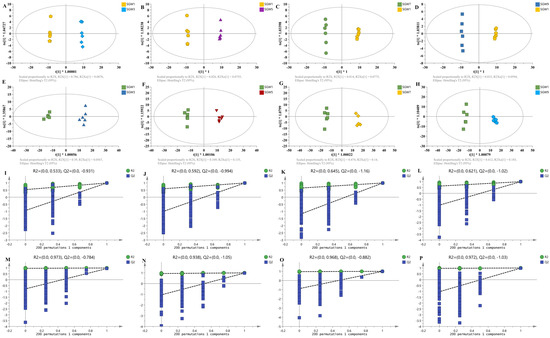
Figure 3.
Multivariate statistical analysis base on components from steaming ginseng water with 1-,3-,5-,7-,9-SGW. (A–D) OPLS-DA score plots in the (−) negative ion mode. (E–H) OPLS-DA score plots in the (+) positive ion mode. (I–L) Permutation test in the (−) negative ion mode. (M–P) Permutation test in the (+) positive ion mode.
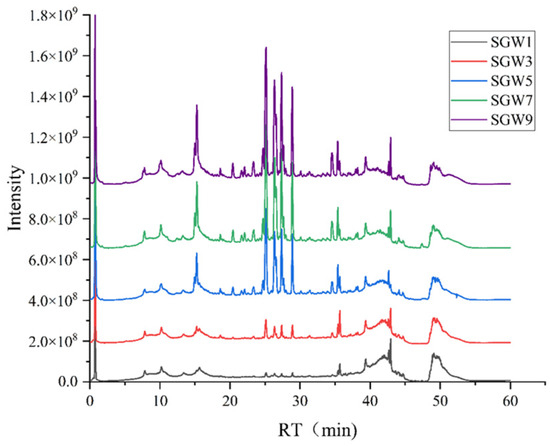
Figure 4.
The total ion chromatograms (TICs) of SGW samples after different repeated thermal processes using UHPLC-Q-Exactive-MS/MS in the negative ion mode.

Table 1.
Identification of shared differential ginsenoside compounds using UHPLC-Q-Exactive-MS/MS analysis.
2.4. Radical Scavenging Activity
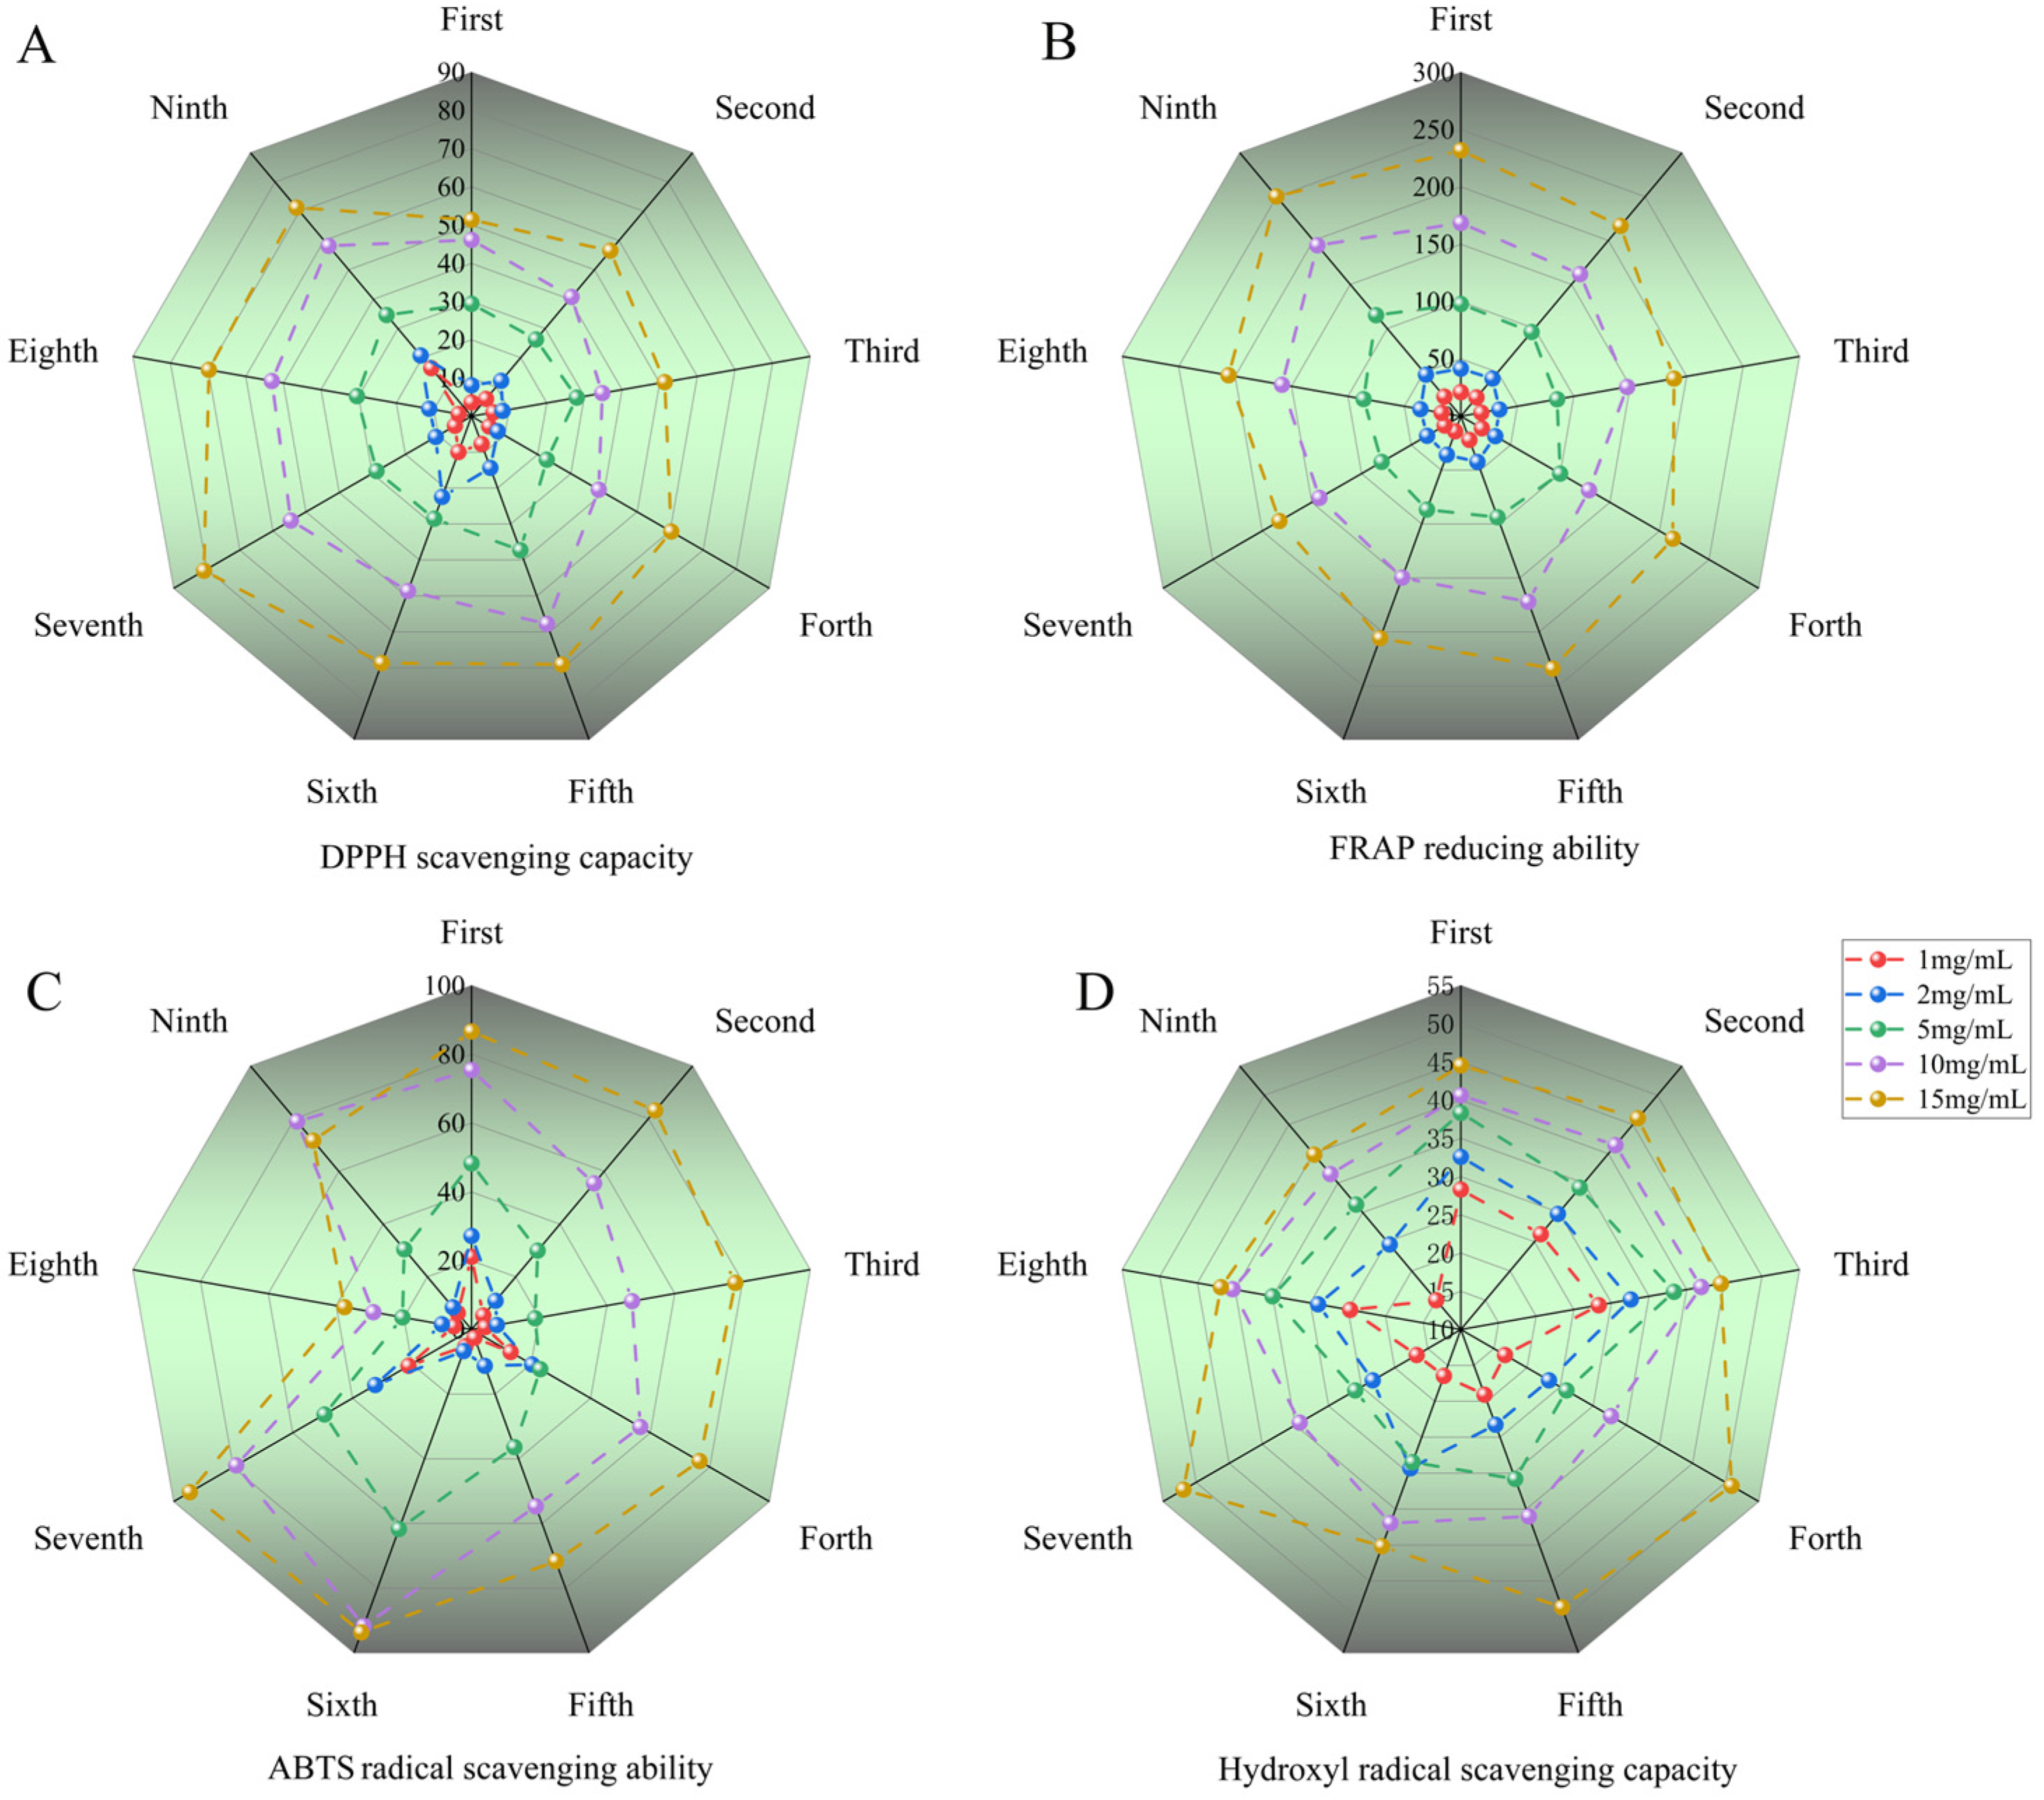
The free radical scavenging capacity was evaluated according to the IC50 value and the scavenging percentage (the IC50 value is defined as the concentration of the antioxidant that is needed to scavenge 50% of the free radicals present in the test solution). Various methods were used to evaluate the antioxidant activity of repeatedly heat-processed SGW. The results of the DPPH/ABTS/FRAP/OH antioxidant indices showed that the antioxidant capacity of each group of SGW samples increased in a concentration-dependent manner in the range of 1–15 mg/mL, as shown in Figure 5. The smaller the IC50 value, the higher the antioxidant capacity [14]. The ABTS and hydroxyl radical scavenging capacity (IC50) of seventh SGW sample were 3.74 mg/mL and 21.48 mg/mL, respectively. In the DPPH antioxidant assay, the seventh SGW sample reported a value of 7.78 mg/mL, which was second only to the fifth and ninth samples. The results of the IC50 values of the antioxidant capacity of all the SGW samples are shown in Table 2.

Figure 5.
Comparison of antioxidant activities of all SGW samples, which were subjected to different heating times. (A) DPPH radical scavenging ability. (B) FRAP reducing ability. (C) ABTS radical scavenging ability. (D) OH scavenging ability.
Table 2.
Statistical analysis of SGW samples (IC50).
2.5. Entropy Weight Method to Analyze SGW Weights
The principle of the entropy weighting method is to analyze the size of the information reflected by different indicators and to assign corresponding weights to these indicators, to make the evaluation results closer to the actual situation. The entropy weight method effectively eliminates the interference of subjective factors, making the decision-making process more objective and accurate. Entropy is an indicator that measures the degree of disorder or chaos in a system. The smaller the entropy value of the indicator, the greater the amount of information it contains, the greater its role in the comprehensive evaluation, and the larger its weight should be. Total sugar, total saponin, reducing sugar, non-reducing sugar, OH, ABTS, FRAP, and DPPH were assigned weights using the entropy weighting method. As shown in Table 3 and Table 4, the weights of the different SGW samples that were subjected to different repeated thermal processing treatments were compared by composite values. The following was found: seventh SGW > ninth SGW > fifth SGW > eighth SGW > sixth SGW > fourth SGW > second SGW > first SGW > third SGW. The specific steps are as follows:
Table 3.
The entropy weighting method analyzes the weights of the indicators.
Table 4.
Entropy weighting method to analyze the synthesize value of different SGW samples.
Step 1: Standardize the raw data. Due to the different attributes of the evaluation indicators, it is necessary to properly standardize the raw data in order to eliminate the effect of dimensional differences and to ensure the comparability of data and the feasibility of the decision-making results [15]. As such, the following is obtained:
Step 2: Normalization of standardized data.
Step 3: Information entropy of each indicator.
Step 4: Confirmation of the weights of the indicators.
Step 5: Synthesize value.
3. Discussion
In this study, the quantitative determination, chemical composition, and antioxidant activity of different SGW samples after repeated heat treatments were investigated. The results showed that SGW with an optimal selection of heating time and number of process repeats can be used for antioxidant product development and industrial raw material preparation. After repeated heat treatments, the chemical composition content was found to be closely related to the heat treatment method, the temperature, and the time [16,17,18]. The contents of total sugars, total saponins, and reducing sugars were highest at the seventh heat treatment. Thermal instability degraded ginsenosides; this was responsible for the decrease in ginsenoside content in the second heat treatment. Polar ginsenosides were not completely degraded and some ginsenosides were degraded to produce secondary ginsenosides following the second heat treatment, which was the reason for the increase in ginsenoside content in the third heat treatment [19]. The content of ginsenosides was highest at the seventh treatment and gradually decreased at the eighth and ninth treatments, as a results of over-processing. At the initial stage of ginseng heating, malonyl ginsenoside side chain molecules are unstable and hydrolyzed under the action of acid, alkali, or high temperatures, subsequently converting to neutral saponins [20]. In addition, polar ginsenosides Rg1/Re, Rc, Rb2, and Rd were gradually reduced and rare ginsenosides Rg2, Rg3, F4, Rg5, Rk1, Rh2, Rh1, and Rh4 were gradually generated, which enhanced the antioxidant activity during heat treatment [21,22,23,24].
Reducing sugars mainly include glucose, fructose, galactose, and maltose. After repeated heat treatment, ginsenosides are hydrolyzed to glycosides and sugars [25]. Non-reducing sugars mainly include starch, sucrose, and arabinogalactan. SGW was continuously reduced and concentrated by repeated rounds of heating [26]. Thermal processing leads to a decrease in the amount of water-soluble polysaccharides and an increase in the amount of acidic polysaccharides [27]. Starch was the main component of ginseng polysaccharides that were extracted from ginseng roots. During repeated heating and steaming processes, ginseng starch was pasted to form monosaccharides or oligosaccharides. The viscosity of ginseng starch gradually increased after the seventh and eighth steaming cycle [28].
According to related studies, the C-20 sugar in the side chain of ginsenoside was hydrolyzed first, followed by the C-6 or C-3 sugars. In addition, C-20 stereoisomerization was also an important structural change [29,30]. Using UHPLC-Q-Exactive-MS/MS liquid mass spectrometry analysis, 37 chemical components of SGW were identified, including ginsenosides Re, Rb1, Rb2, Rc, Rd, and Ro. Multivariate statistical analysis revealed that the first SGW and the third, fifth, seventh, and ninth SGW were well separated. The quality control samples were clustered with a large contribution of SGW1, and the method was stable and predictive. The entropy weight method is an objective assignment method, which is objective and credible; it was applied to determine the weights of content and antioxidant indexes, and the combined values were analyzed in the seventh SGW, which had the largest weight. The heat treatment of ginseng produces maltol, salicylic acid, vanillic acid, and p-coumaric acid, which scavenge free radicals and enhance antioxidant activity [31,32,33]. In addition, our research group compared the seventh SGW with steamed red ginseng and found that the total saponins content could be up to 63.4% that of red ginseng. In the future, the comprehensive utilization of SGW could provide a potential raw material for the development of antioxidant products, which, on the one hand, can reduce the waste of ginseng resources and improve the economic benefits, and, on the other hand, can protect the environment and help towards sustainable development.
4. Materials and Methods
4.1. Materials
Fresh roots of 5-year-old ginseng were purchased from Wanliang Town, Fusong County, Jilin Province, and were identified by Professor Weng Lili from Changchun University of Traditional Chinese Medicine. UPLC-grade acetonitrile and methanol were obtained from Tedia Company Incorporated (Fairfield, OH, USA). Purified water was made using a water purifier (Global Water Solution Ltd., Randolph, MA, USA). Ginsenoside Re was purchased from Shanghai yuanye Bio-Technology Co., Ltd. (Shanghai, China).
4.2. Extraction and Preparation of Steamed Ginseng Extract
Fresh ginseng was washed and neatly arranged with the reeds facing down. The ginseng was steamed with 2000 mL of distilled water at 100 °C for 2 h. At the end of steaming, the water was replenished to 2000 mL. Meanwhile, the process was repeated 9 times by replacing fresh ginseng of the same size and quality. The 9 groups of SGW treated by repeated steaming were concentrated to 200 mL under a vacuum pressure of minus 0.08 Mpa at 55 °C. Then, the samples were centrifuged at 1000× g for 5 min and the supernatant was freeze-dried and kept as a spare.
4.3. Sample Preparation for Mass Spectrometry
A total of 5 mg SGW lyophilized powder was accurately weighed and dissolved in 50 mL methanol to make a concentration of 0.1 mg/mL; a 10 µL sample solution was added into 0.99 mL methanol in a 2.5 mL Eppendorf tube, vibrated for 30 s, and then filtered using a 0.22 μM PTFE membrane; this was then refrigerated at 4 °C and kept as a spare.
4.4. The Quantitative Analysis of SGW
4.4.1. Total Sugar Content Assay
Glucose was accurately weighed and dried in a constant-weight oven at 105 °C. A glucose solution of 0.1 mg/mL was prepared. Then, 2 mL glucose diluent of different concentrations, 1 mL 5% phenol solution, and 5 mL sulfuric acid concentrated solution were added [34]. A water bath was heated at 40 °C for 30 min and was then cooled to room temperature. The absorbance was measured at 490 nm, and a standard curve was drawn. The glucose content of the SGW samples of different times was calculated using regression equations.
4.4.2. Total Saponins Content Assay
The activated D101 macroporous adsorption resin column was prepared and activated again with ethanol and distilled water. First, different repeated heat treatment SGW samples (1 mL) and 25 mL distilled water for the washing column were precisely added twice, and the eluent was discarded. Then, the ginsenosides were slowly washed off with 25 mL 70% ethanol, and the eluent was collected in the evaporating dish. Finally, the water bath evaporated and dried at 60 °C.
A ginsenoside Re standard diluted to 1 mg/mL was prepared. First, it was placed into a solution of 0 mg/mL, 0.02 mg/mL, 0.04 mg/mL, 0.06 mg/mL, 0.08 mg/mL, and 1 mg/mL in a tube with plugs. Then, 0.2 mL of vanillin and 0.8 mL of perchloric acid were added to the solution. Finally, the water bath was heated at 60 °C for 10min. After cooling, glacial acetic acid was added at a constant volume to 5.0 mL. The ginsenoside content of SGW samples was calculated by substituting the absorbance value into the standard curve.
4.4.3. Total Reducing Sugar Content Assay
The reducing sugar content in SGW samples was determined using a reducing sugar kit and spectrophotometry. SGW samples subjected to different numbers of repeats pf thermal processing (100 μL) and 100 μL reagent 1 (colorimetric solution) were thoroughly mixed in a centrifuge tube. Next, a water bath was heated at 95 °C for 10 min, before being cooled. The control group was replaced with distilled water, and the absorbance was measured at 500 nm.
4.5. UHPLC-Q-Exactive-MS/MS Conditions
Chromatographic conditions: Separation was performed using an Ascentis® Express C18 (3.0 mm × 500 mm, 2.7 μm; Supelco, Bellefonte, PA, USA). The mobile phase consisted of 0.1% formic acid (solvent A) and acetonitrile (solvent B). The gradient elution program was as follows: 0–3 min 25% B, 3–20 min 25–32% B, 20–55 min 32–40% B, 55–56 min 40–95% B, and 56–60 min 95–25% B; the flow rate was set at 0.3 mL/min. The column and sampler temperatures were set at 35 °C and 4 °C, respectively. The injection volume was 5 μL.
Mass spectrometry conditions: An UHPLC-Q-Exactive-MS/MS (Thermo Fisher Scientific, Waltham, MA, USA) equipped with an Xcalibur data acquisition system and electrospray ionization source were used in both the positive and negative ion modes. Electrospray ion source (ESI), positive and negative ion mode detection, scanning type: Full scan-ddMS2. Mass scanning range: 150.0–2000.0 m/z. The flow rate of the sheath gas was 40 arb, the aux gas was 10 arb, the spray voltage was (±) 3.5 KV, the capillary temperature was 350 °C, the fragmentation voltage was 30 ev, and the mass axis was calibrated before detection.
4.6. Antioxidant Activity Assays
4.6.1. DPPH Scavenging Activity Assay
The DPPH scavenging activity was assayed according to a previous study, with a few minor adjustments [35]. The method involves the repeated thermal processing of SGW with 0.2 mM of DPPH alcohol solution. Briefly, 80 µL of diluted DPPH solution and 50 µL of sample solutions were mixed in a microplate and were incubated for 30 min in the dark. The absorbance of the sample was recorded at 520 nm.
4.6.2. FRAP Scavenging Activity Assay
The FRAP solution was obtained by mixing sodium acetate buffer (pH 3.6, 0.3 mol/L), TPTZ solution (10 mmol/L), and FeCl3 solution (20 mmol/L) at a ratio of 10:1:1 [36,37]. Briefly, 200 µL of diluted FRAP solution and 50 µL of sample solutions were mixed in a microplate and incubated for 10 min at 37 °C. The absorbance of the sample was recorded at 592 nm. The antioxidant capacity is expressed as the mass concentration of ferrous sulfate (mg/L), using ferrous sulfate solution as the standard curve.
4.6.3. ABTS+ Scavenging Activity Assay
A solution of 7.0 mM ABTS+ and 2.45 mM potassium persulfate was mixed evenly in equal proportions and stored in the dark for 12–16 h [38,39]. The absorbance of the diluent at 734 nm was 0.70 ± 0.02. The sample solution of 50 μL was added into the diluted ABTS+ solution of 80 μL and was reacted in the dark for 6 min, before being measured at 734 nm.
4.6.4. Hydroxyl Radical Assay
The hydroxyl radical assay was performed according to a previous study, with minor optimization [40,41]. A solution of 5.0 mM FeSO4, 5.0 mM ethanolic salicylic acid, and 3 mM H2O2 was mixed and was reacted for 30 min at 37 °C. The absorbance of the sample was recorded at 510 nm.
4.7. Data Processing and Multivariate Analysis
SPSS 23.0 (SPSS Inc., Chicago, IL, USA) was used for one-way ANOVA, and Bonferroni was used for significance testing to analyze the significant differences (p < 0.05) in the peak areas of the chemical composition in four groups of SGW. Statistical analysis was performed from triplicate results and the mean and standard deviation (mean ± SD) were listed.
All the original MS spectrometry data were preprocessed and exported. Then, retention time calibration, peak alignment, baseline calibration, normalization, and logarithmic conversion were conducted. Multivariate analyses were performed using SIMCA-P software 17.0 (Umetrics, Umea, Sweden). The datasets of peak areas were scaled (UV or Pareto) prior to multivariate analysis using PCA or OPLS-DA. The variable importance in the projection (VIP) values indicate the major compounds contributing to the separation of each sample in the OPLS-DA score plots. The VIP value is a weighted sum of squares of the OPLS-DA weights that takes the explained Y variance in each dimension into account. The OPLS-DA models were validated with permutation tests. The biomarkers were analyzed using MS/MS analysis and the metabolite database HMDB (http://www.hmdb.ca/).
5. Conclusions
SGW, as a valuable resource that is produced during the red ginseng manufacturing processing, is widely used for skin care and health enhancement in folklore of the Changbai mountain region in the northeast of Jilin province, China. Since its composition and activity are unclear, the scientific basis for being recycled is insufficient. In the present study, we investigated the correlation between the frequency of sample reheating and skincare properties, including anti-aging effects and composition content levels. The results showed that the number of heating cycles significantly impacts the content of saponins and sugars (including polysaccharides, reducing sugars, and non-reducing sugars). The results of the frequency of thermal heating and compositional analyses proved that the process of generating SGW, if the maintenance of its antioxidant activity is desired, is minimized following its repeated heating process; it is recommended not to exceed seven cycles. In summary, this study may provide a solid scientific proof as to the high-quality recycling of red ginseng-processed by-products, and may deepen the application value of SGW in the antioxidant industry.
Author Contributions
All authors contributed to this study’s conception and design. Original draft preparation, Y.-D.W.; Extraction and compositional characterization of SGW samples provided by H.-E.Z.; data analysis and visualization, L.-S.H. and Y.-B.L.; G.-Y.L. and J.-Q.W. were involved in the determination of the saponins content and polysaccharide content of SGW.; K.-L.Y. and Y.Z. participated in the analysis and determination of the antioxidant capacity of SGW.; review and editing, project administration, and funding acquisition, C.-B.C. and E.-P.W. All authors have read and agreed to the published version of the manuscript.
Funding
This work was sponsored by the Jilin Province Science and Technology Development Plan Project (No. 20210401108YY, No. YDZJ202201ZYTS207), the Key Technology Research Project of Chang-chun Science and Technology Bureau (No. 21ZGY10), the Jiayi Biochemical Research and Development Center (Suzhou Industrial Park) Co., Ltd., and the National Natural Science Foundation of China (No. 82073969).
Institutional Review Board Statement
Not applicable.
Informed Consent Statement
Not applicable.
Data Availability Statement
The datasets used and/or analyzed in the present study are available from the corresponding author upon reasonable request.
Acknowledgments
We are grateful to Changbao Chen and Enpeng Wang for funding of this study. In addition, we are particularly grateful to Jianfeng Hou for his help and support in this paper.
Conflicts of Interest
The authors declare no conflicts of interest.
References
- Yu, W.; Cai, S.; Zhao, J.; Hu, S.; Zang, C.; Xu, J.; Hu, L. Beyond genome: Advanced omics progress of Panax ginseng. Plant Sci. 2024, 341, 112022. [Google Scholar] [CrossRef] [PubMed]
- Lee, J.W.; Ji, S.H.; Choi, B.R.; Choi, D.J.; Lee, Y.G.; Kim, H.G.; Kim, G.S.; Kim, K.; Lee, Y.H.; Baek, N.I.; et al. UPLC-QTOF/MS-Based Metabolomics Applied for the Quality Evaluation of Four Processed Panax ginseng Products. Molecules 2018, 23, 2062. [Google Scholar] [CrossRef] [PubMed]
- Huang, L.; Ren, C.; Li, H.J.; Wu, Y.C. Recent Progress on Processing Technologies, Chemical Components, and Bioactivities of Chinese Red Ginseng, American Red Ginseng, and Korean Red Ginseng. Food Bioprocess Technol. 2022, 15, 47–71. [Google Scholar] [CrossRef]
- Peng, X.; Hao, M.; Zhao, Y.; Cai, Y.; Chen, X.; Chen, H.; Zhang, Y.; Dong, L.; Liu, X.; Ding, C.; et al. Red ginseng has stronger anti-aging effects compared to ginseng possibly due to its regulation of oxidative stress and the gut microbiota. Phytomedicine 2021, 93, 153772. [Google Scholar] [CrossRef] [PubMed]
- Min, S.J.; Kim, H.; Yambe, N.; Shin, M.S. Ameliorative Effects of Korean-Red-Ginseng-Derived Polysaccharide on Antibiotic-Associated Diarrhea. Polymers 2024, 16, 231. [Google Scholar] [CrossRef] [PubMed]
- Cho, D.Y.; Zhang, S.; Skinner, D.; Koch, C.G.; Smith, M.J.; Lim, D.J.; Grayson, J.W.; Tearney, G.J.; Rowe, S.M.; Woodworth, B.A. Red ginseng aqueous extract improves mucociliary transport dysfunction and histopathology in CF rat airways. J. Cyst. Fibros. 2023, 22, 1113–1119. [Google Scholar] [CrossRef] [PubMed]
- Jeddy, N.; Saravanan, R.; Natrajan, R.; Sai Lakshmi, L.J.; Ashwath, V.; Singhal, I. Comparison of the effectiveness of red ginseng herbal mouth rinse with chlorhexidine and saline in oral cancer patients: A pilot double-blinded randomized control trial. J. Oral Maxillofac. Pathol. 2023, 27, 778. [Google Scholar] [CrossRef] [PubMed]
- Zhang, H.E.; Chu, M.Y.; Jiang, T.; Song, X.H.; Hou, J.F.; Cheng, L.Y.; Feng, Y.; Chen, C.B.; Wang, E.P. By-Product of the Red Ginseng Manufacturing Process as Potential Material for Use as Cosmetics: Chemical Profiling and In Vitro Antioxidant and Whitening Activities. Molecules 2022, 27, 8202. [Google Scholar] [CrossRef] [PubMed]
- Kang, K.A.; Piao, M.J.; Fernando, P.; Herath, H.; Yi, J.M.; Hyun, J.W. Korean Red Ginseng Attenuates Particulate Matter-Induced Senescence of Skin Keratinocytes. Antioxidants 2023, 12, 1516. [Google Scholar] [CrossRef]
- Lee, D.Y.; Arndt, J.; O’Connell, J.F.; Egan, J.M.; Kim, Y. Red Ginseng Attenuates the Hepatic Cellular Senescence in Aged Mice. Biology 2024, 13, 36. [Google Scholar] [CrossRef]
- Yang, Y.; Zhang, Y.; Zhang, X.; Yang, L.; Wang, Z. Ginsenoside Contents in Ginseng: Quality by Design-Coupled Two-Dimensional Liquid Chromatography Technique. J. Chromatogr. Sci. 2022, 60, 164–172. [Google Scholar] [CrossRef] [PubMed]
- Wang, C.Z.; Zhang, C.F.; Zhang, Q.H.; Yuan, C.S. Phytochemistry of Red Ginseng, A Steam-Processed Panax ginseng. Am. J. Chin. Med. 2024, 52, 35–55. [Google Scholar] [CrossRef] [PubMed]
- Huang, B.M.; Chen, T.B.; Xiao, S.Y.; Zha, Q.L.; Luo, P.; Wang, Y.P.; Cui, X.M.; Liu, L.; Zhou, H. A new approach for authentication of four ginseng herbs and their related products based on the simultaneous quantification of 19 ginseng saponins by UHPLC-TOF/MS coupled with OPLS-DA. Rsc Adv. 2017, 7, 46839–46851. [Google Scholar] [CrossRef]
- Li, X.; Lin, J.; Gao, Y.; Han, W.; Chen, D. Antioxidant activity and mechanism of Rhizoma Cimicifugae. Chem. Cent. J. 2012, 6, 140. [Google Scholar] [CrossRef] [PubMed]
- Li, Y.G.; Sun, M.H.; Yuan, G.H.; Zhou, Q.; Liu, J.Y. Study on Development Sustainability of Atmospheric Environment in Northeast China by Rough Set and Entropy Weight Method. Sustainability 2019, 11, 3793. [Google Scholar] [CrossRef]
- Kim, C.J.; Kim, B.M.; Kim, C.S.; Baek, J.Y.; Jung, I.C. Variations in Ginsenosides of Raw Ginseng According to Heating Temperature and Time. J. Pharmacopunct. 2020, 23, 79–87. [Google Scholar] [CrossRef] [PubMed]
- Xu, X.F.; Gao, Y.; Xu, S.Y.; Liu, H.; Xue, X.; Zhang, Y.; Zhang, H.; Liu, M.N.; Xiong, H.; Lin, R.C.; et al. Remarkable impact of steam temperature on ginsenosides transformation from fresh ginseng to red ginseng. J. Ginseng Res. 2018, 42, 277–287. [Google Scholar] [CrossRef]
- Hwang, C.R.; Lee, S.H.; Jang, G.Y.; Hwang, I.G.; Kim, H.Y.; Woo, K.S.; Lee, J.; Jeong, H.S. Changes in ginsenoside compositions and antioxidant activities of hydroponic-cultured ginseng roots and leaves with heating temperature. J. Ginseng Res. 2014, 38, 180–186. [Google Scholar] [CrossRef] [PubMed]
- Zhang, Y.; Huang, Y.; Dou, D. Anti-prostate cancer mechanism of black ginseng during the “nine steaming and nine sun-drying” process based on HPLC analysis combined with vector space network pharmacology. Discov. Oncol. 2024, 15, 12. [Google Scholar] [CrossRef]
- Liu, Z.; Xia, J.; Wang, C.Z.; Zhang, J.Q.; Ruan, C.C.; Sun, G.Z.; Yuan, C.S. Remarkable Impact of Acidic Ginsenosides and Organic Acids on Ginsenoside Transformation from Fresh Ginseng to Red Ginseng. J. Agric. Food Chem. 2016, 64, 5389–5399. [Google Scholar] [CrossRef]
- Gao, D.; Kim, J.H.; Vinh, L.B.; Seo, E.Y.; Yang, S.Y.; Cho, C.W.; Kim, Y.H.; Kim, K.T.; Sim, J.; Kang, J.S. Effect of citric acid and heat treatment on the content of less-polar ginsenosides in flower buds of Panax ginseng. Prep. Biochem. Biotechnol. 2022, 52, 144–153. [Google Scholar] [CrossRef] [PubMed]
- Chen, W.; Balan, P.; Popovich, D.G. Changes of Ginsenoside Composition in the Creation of Black Ginseng Leaf. Molecules 2020, 25, 2809. [Google Scholar] [CrossRef] [PubMed]
- Oh, H.B.; Jeong, D.E.; Lee, D.E.; Yoo, J.H.; Kim, Y.S.; Kim, T.Y. Structural Identification of Ginsenoside Based on UPLC-QTOF-MS of Black Ginseng (Panax Ginseng C.A. Mayer). Metabolites 2024, 14, 62. [Google Scholar] [CrossRef] [PubMed]
- Lee, S.A.; Jo, H.K.; Im, B.O.; Kim, S.; Whang, W.K.; Ko, S.K. Changes in the Contents of Prosapogenin in the Red Ginseng (Panax ginseng) Depending on Steaming Batches. J. Ginseng Res. 2012, 36, 102–106. [Google Scholar] [CrossRef] [PubMed]
- Zhang, M.; Qin, K.M.; Li, W.D.; Yin, F.Z.; Cai, H.; Cai, B.C. Research on chemical reactions during ginseng processing. Zhongguo Zhong Yao Za Zhi 2014, 39, 3701–3706. [Google Scholar] [PubMed]
- Du, Q.Q.; Liu, S.Y.; Xu, R.F.; Li, M.; Song, F.R.; Liu, Z.Q. Studies on structures and activities of initial Maillard reaction products by electrospray ionisation mass spectrometry combined with liquid chromatography in processing of red ginseng. Food Chem. 2012, 135, 832–838. [Google Scholar] [CrossRef] [PubMed]
- Fan, J.; Liu, F.; Ji, W.; Wang, X.; Li, L. Comprehensive Investigation of Ginsenosides in the Steamed Panax quinquefolius with Different Processing Conditions Using LC-MS. Molecules 2024, 29, 623. [Google Scholar] [CrossRef] [PubMed]
- Wang, H.R.; Cheng, Y.; Zhang, X.; Wang, Y.P.; Zhao, H. Comparative analysis of physicochemical properties, ginsenosides content and α-amylase inhibitory effects in white ginseng and red ginsen. Food Sci. Hum. Wellness 2023, 12, 14–27. [Google Scholar] [CrossRef]
- Xie, Y.Y.; Luo, D.; Cheng, Y.J.; Ma, J.F.; Wang, Y.M.; Liang, Q.L.; Luo, G.A. Steaming-induced chemical transformations and holistic quality assessment of red ginseng derived from Panax ginseng by means of HPLC-ESI-MS/MS(n)-based multicomponent quantification fingerprint. J. Agric. Food Chem. 2012, 60, 8213–8224. [Google Scholar] [CrossRef]
- Jin, Y.; Kim, Y.J.; Jeon, J.N.; Wang, C.; Min, J.W.; Noh, H.Y.; Yang, D.C. Effect of white, red and black ginseng on physicochemical properties and ginsenosides. Plant Foods Hum. Nutr. 2015, 70, 141–145. [Google Scholar] [CrossRef]
- Huang, L.; Xu, D.-Q.; Yue, S.-J.; Chen, Y.-Y.; Fu, R.-J.; Lu, Z.; Tang, Y.-P. Research on Q-markers of Eupatorium lindleyanum based on analytic hierarchy process-entropy weight method and network pharmacology. China J. Chin. Mater. Medica 2021, 46, 5545–5554. [Google Scholar]
- Oh, C.H.; Kim, G.N.; Lee, S.H.; Lee, J.S.; Jang, H.D. Effects of Heat Processing Time on Total Phenolic Content and Antioxidant Capacity of Ginseng Jung Kwa. J. Ginseng Res. 2010, 34, 198–204. [Google Scholar] [CrossRef]
- Park, C.H.; Choi, J.S.; Yokozawa, T. Increase in the hydroxyl radical-scavenging activity of Panax ginseng and ginsenosides by heat-processing. Drug Discov. Ther. 2018, 12, 114–121. [Google Scholar] [CrossRef]
- Yue, F.F.; Zhang, J.R.; Xu, J.X.; Niu, T.F.; Lu, X.; Liu, M.S. Effects of monosaccharide composition on quantitative analysis of total sugar content by phenol-sulfuric acid method. Front. Nutr. 2022, 9, 10. [Google Scholar] [CrossRef]
- Chen, F.; Huang, G. Antioxidant activity of polysaccharides from different sources of ginseng. Int. J. Biol. Macromol. 2019, 125, 906–908. [Google Scholar] [CrossRef] [PubMed]
- Benzie, I.F.; Strain, J.J. The ferric reducing ability of plasma (FRAP) as a measure of “antioxidant power”: The FRAP assay. Anal. Biochem. 1996, 239, 70–76. [Google Scholar] [CrossRef] [PubMed]
- Rumpf, J.; Burger, R.; Schulze, M. Statistical evaluation of DPPH, ABTS, FRAP, and Folin-Ciocalteu assays to assess the antioxidant capacity of lignins. Int. J. Biol. Macromol. 2023, 233, 123470. [Google Scholar] [CrossRef] [PubMed]
- Sridhar, K.; Charles, A.L. In vitro antioxidant activity of Kyoho grape extracts in DPPH and ABTS assays: Estimation methods for EC(50) using advanced statistical programs. Food Chem. 2019, 275, 41–49. [Google Scholar] [CrossRef]
- Re, R.; Pellegrini, N.; Proteggente, A.; Pannala, A.; Yang, M.; Rice-Evans, C. Antioxidant activity applying an improved ABTS radical cation decolorization assay. Free Radic. Biol. Med. 1999, 26, 1231–1237. [Google Scholar] [CrossRef]
- Tang, J.; Xiong, L.; Shu, X.; Chen, W.; Li, W.; Li, J.; Ma, L.; Xiao, Y.; Li, L. Antioxidant effects of bioactive compounds isolated from cordyceps and their protective effects against UVB-irradiated HaCaT cells. J. Cosmet. Dermatol. 2019, 18, 1899–1906. [Google Scholar] [CrossRef]
- Kang, K.S.; Kim, H.Y.; Pyo, J.S.; Yokozawa, T. Increase in the free radical scavenging activity of ginseng by heat-processing. Biol. Pharm. Bull. 2006, 29, 750–754. [Google Scholar] [CrossRef] [PubMed]
Disclaimer/Publisher’s Note: The statements, opinions and data contained in all publications are solely those of the individual author(s) and contributor(s) and not of MDPI and/or the editor(s). MDPI and/or the editor(s) disclaim responsibility for any injury to people or property resulting from any ideas, methods, instructions or products referred to in the content. |
© 2024 by the authors. Licensee MDPI, Basel, Switzerland. This article is an open access article distributed under the terms and conditions of the Creative Commons Attribution (CC BY) license (https://creativecommons.org/licenses/by/4.0/).