Article

Generation of Porcine and Rainbow Trout 3D Intestinal Models and Their Use to Investigate Astaxanthin Effects In Vitro

by
Sharon Arcuri
1,†,
Georgia Pennarossa
1,†,
Rolando Pasquariello
2,
Madhusha Prasadani
3,
Fulvio Gandolfi
2 and
Tiziana A. L. Brevini
1,*
1
Laboratory of Biomedical Embryology, Department of Veterinary Medicine and Animal Science and Center for Stem Cell Research, Università degli Studi di Milano, 26900 Lodi, Italy
2
Department of Agricultural and Environmental Sciences—Production, Landscape, Agroenergy, Università degli Studi di Milano, 20133 Milan, Italy
3
Institute of Veterinary Medicine and Animal Sciences, Estonian University of Life Sciences, 51014 Tartu, Estonia
*
Author to whom correspondence should be addressed.
These authors contributed equally to this work.
Int. J. Mol. Sci. 2024, 25(11), 5966; https://doi.org/10.3390/ijms25115966
Submission received: 7 May 2024 / Revised: 24 May 2024 / Accepted: 27 May 2024 / Published: 29 May 2024
(This article belongs to the Special Issue New Insights in Natural Bioactive Compounds: 3rd Edition)

Abstract

:
Astaxanthin (AST) is a natural compound derived from shellfish, microorganisms, and algae, with several healthy properties. For this reason, it is widely used in the diet of humans and animals, such as pigs, broilers, and fish, where its addition is related to its pigmenting properties. Moreover, AST’s ability to reduce free radicals and protect cells from oxidative damage finds application during the weaning period, when piglets are exposed to several stressors. To better elucidate the mechanisms involved, here we generate ad hoc pig and rainbow trout in vitro platforms able to mimic the intestinal mucosa. The morphology is validated through histological and molecular analysis, while functional properties of the newly generated intestinal barriers, both in porcine and rainbow trout models, are demonstrated by measuring trans-epithelial electrical resistance and analyzing permeability with fluorescein isothiocyanate–dextran. Exposure to AST induced a significant upregulation of antioxidative stress markers and a reduction in the transcription of inflammation-related interleukins. Altogether, the present findings demonstrate AST’s ability to interact with the molecular pathways controlling oxidative stress and inflammation both in the porcine and rainbow trout species and suggest AST’s positive role in prevention and health.

1. Introduction

Astaxanthin (AST) is a natural lipid-soluble and red–orange xanthophyll carotenoid widely found in marine seafood, such as shrimp, lobster, and crab, especially in their shell portions, and in several microorganisms, such as Phaffia rhodozyma and certain algae [1,2,3]. AST’s capacity to regulate inflammatory responses by preventing free radical formation and modulating redox balance has been described by a number of studies carried out in different species, mostly in vivo [4,5,6,7,8,9,10,11]. Thanks to these properties, AST finds applications in pharmaceutical, nutraceutical, and cosmetic industries, with various health benefits in humans [6,12,13,14,15,16,17,18,19]. In fish, pigs, and broilers, this compound is used as a pigmenting additive, to confer on animals their distinctive and commercially valued skin and fillet color appearance, directly associated with the final product quality [4,20,21,22,23,24,25,26,27,28]. In addition, this carotenoid is a useful supplement in piglet diets, due to its ability to reduce intestinal inflammation and to boost the immune system during the weaning period, when young animals are exposed to a number of stressors [29]. In particular, Szczepanik et al. recently demonstrated that AST addition is able to reduce free radicals and protect porcine cells from oxidative damage [30]. The molecular mechanisms involved in these beneficial effects are under elucidation and, for this purpose, commercially available human (Caco-2 and HT-29) as well as pig (IPEC-J2) cell lines have been used to develop in vitro models [31,32,33,34,35,36]. In addition, all these studies have been performed using in vitro 2D culture systems that only partially reflect the complexity of the intestinal barrier. In fish, where AST is extensively used for its pigmenting properties, the information available is even more limited, due to the small number of cell lines available for in vitro studies. Based on this, we selected the pig and the rainbow trout as representative experimental models and proposed a 3D strategy that tries to mimic the complexity of the intestinal mucosae. Moreover, we co-cultured intestinal fibroblasts and epithelial cells isolated from both species onto Alvetex® scaffold inserts to create functional 3D in vitro platforms. We then exposed the newly generated artificial intestinal mucosae to AST and investigated the molecular responses to the carotenoid.

2. Results

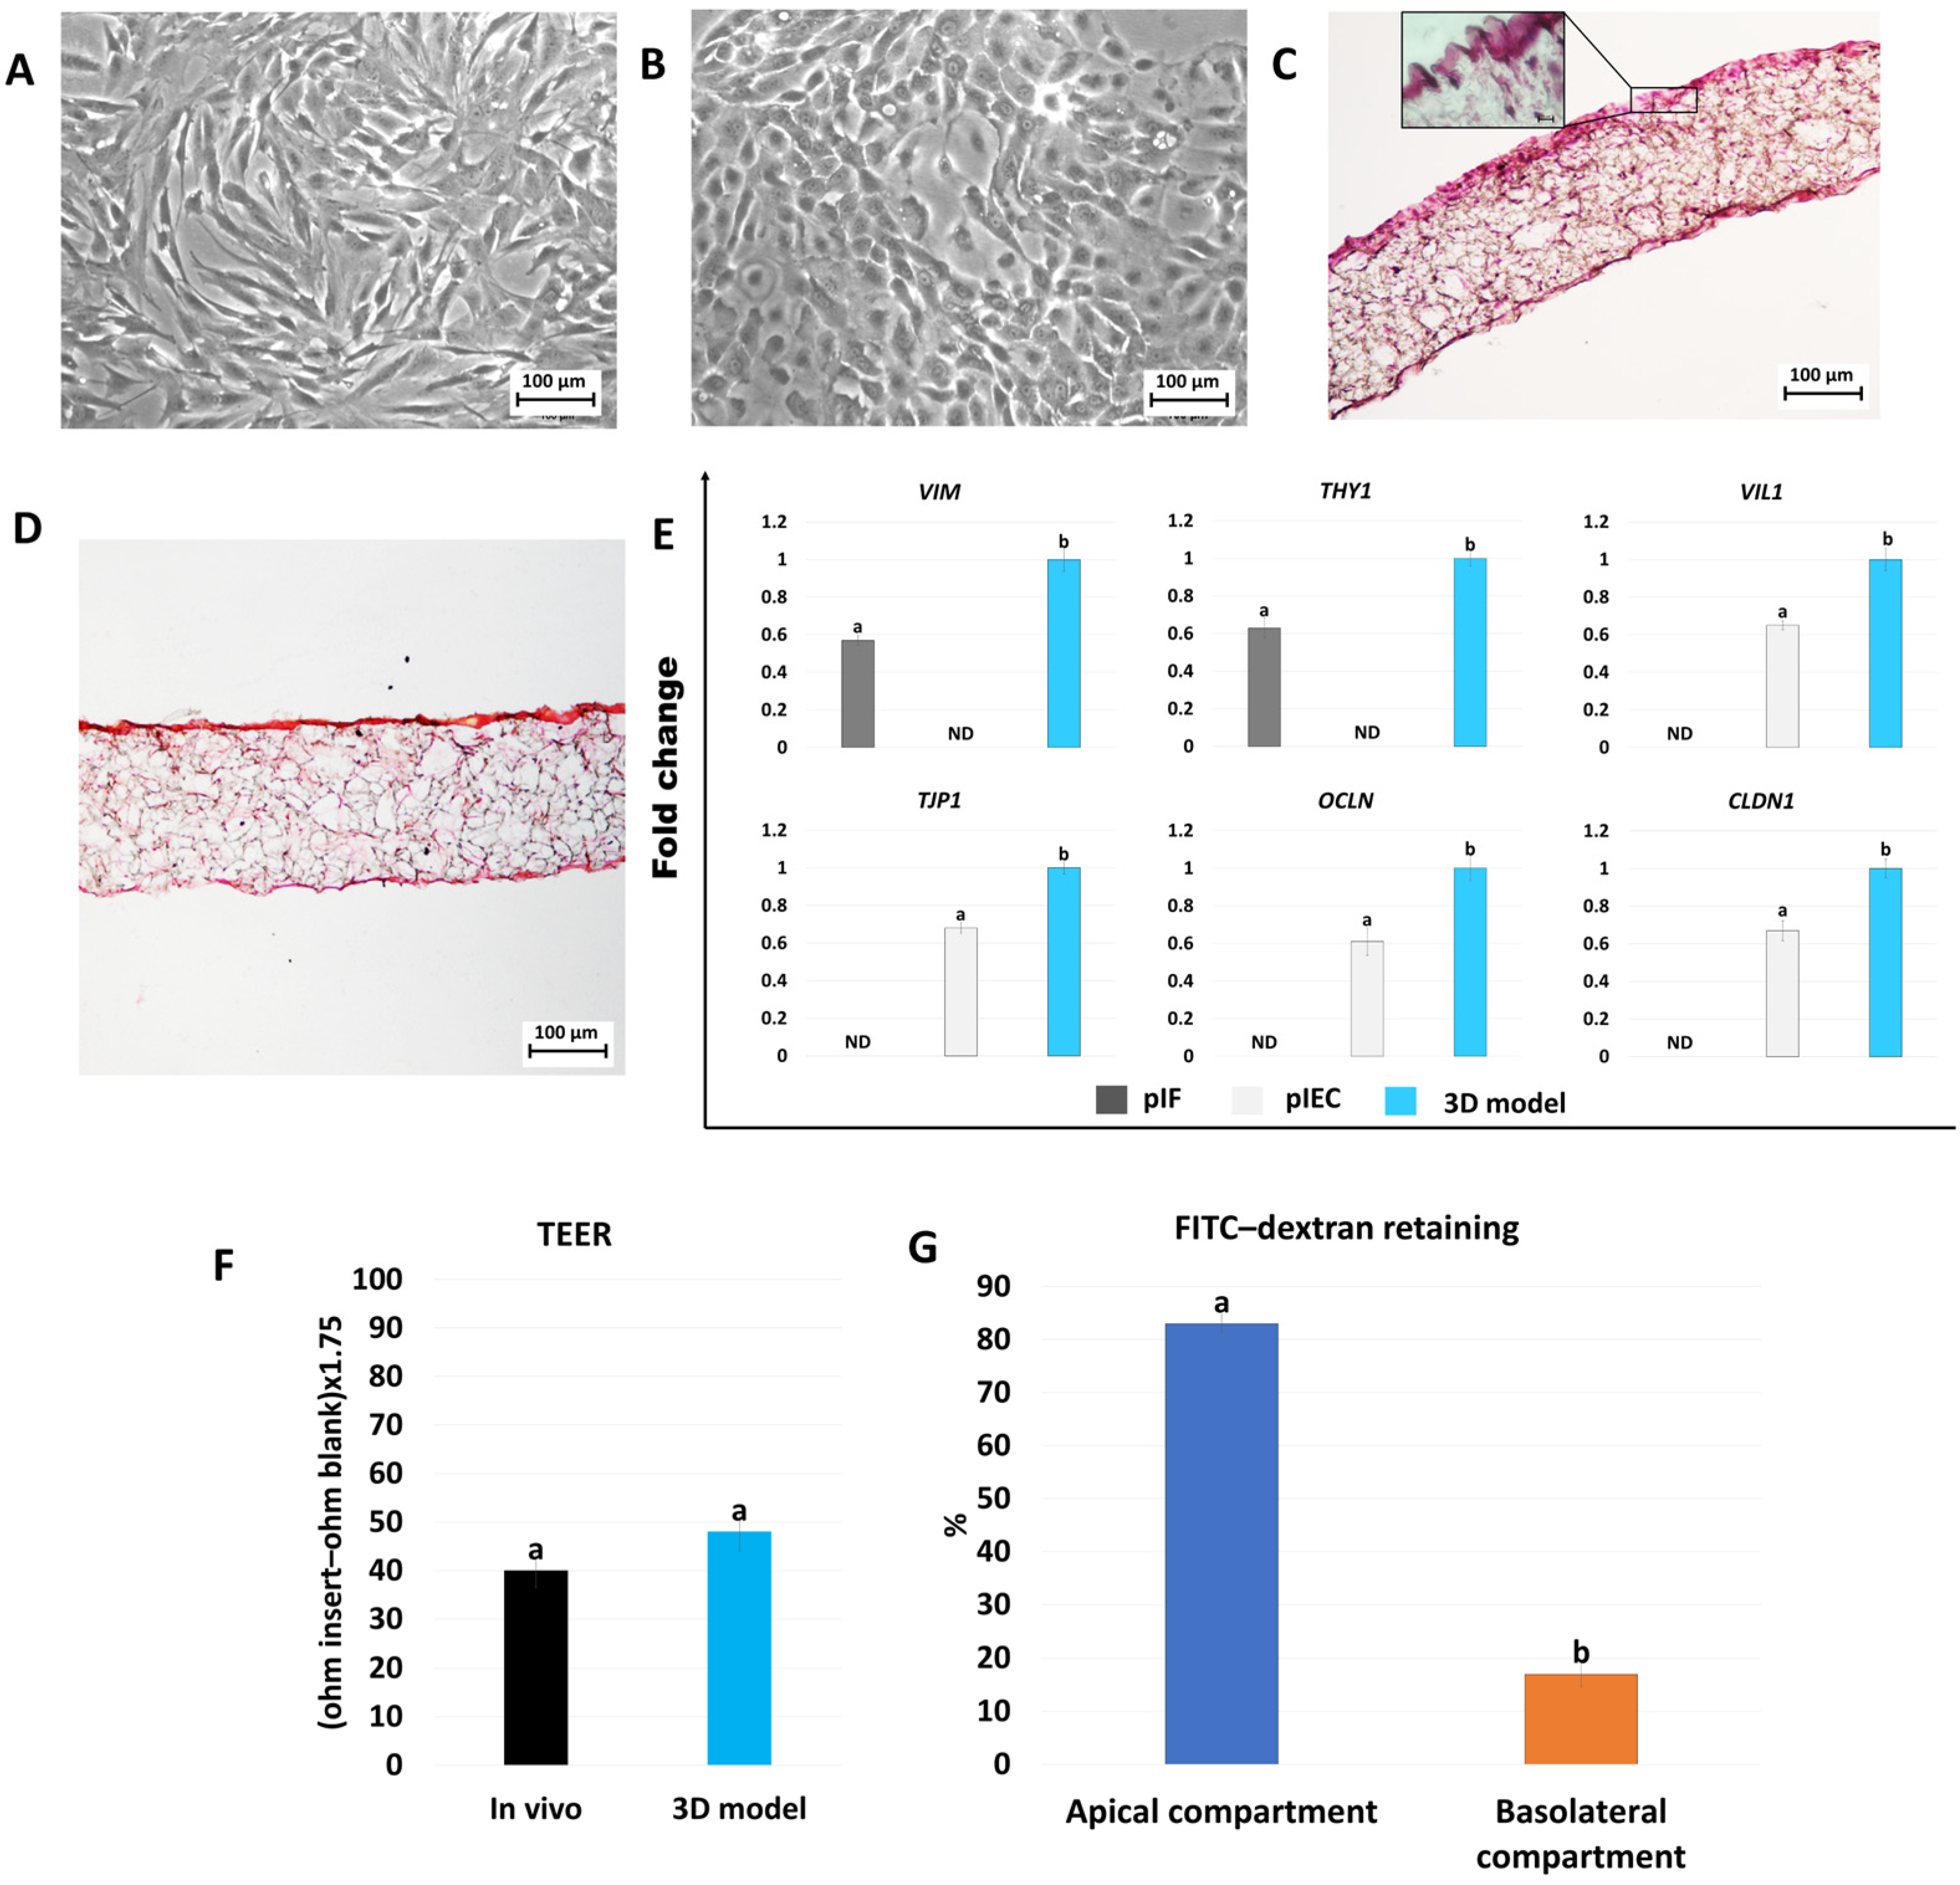
2.1. Development and Characterization of Porcine 3D Intestinal Models

Porcine intestinal fibroblasts (pIFs) and epithelial cells (pIECs) grew out of the tissue explants within 6 days of culture. They formed monolayers with cells displaying elongated morphology with small central nuclei (Figure 1A) and rounded shapes with small nuclei (Figure 1B), respectively. When fibroblasts were plated onto Alvetex® scaffold inserts, they infiltrated the membrane and generated a densely populated stromal compartment (Figure 1C). In addition, picrosirius red staining demonstrated that fibroblasts released and deposited collagen (Figure 1D). Epithelial cells co-cultured on the top of the generated stromal compartment acquired a distinct polarized morphology with an elongated columnar shape (Figure 1C).
Data obtained from the molecular analysis showed a significant upregulation of transcription levels for the main stromal and epithelial-related markers, namely VIM, THY1, VIL1, TJP1, OCLN, and CLDN1, in cells grown on Alvetex® scaffolds compared to those cultured in 2D monolayers (Figure 1E). Furthermore, measurements of intestinal epithelial barrier integrity by trans-epithelial electrical resistance (TEER) displayed an average of 53.8 ± 6.6 Ω·cm2 (Figure 1F). In parallel, permeability analysis demonstrated a reduction in dextran flux from apical to basolateral compartments of the scaffolds (Figure 1G).

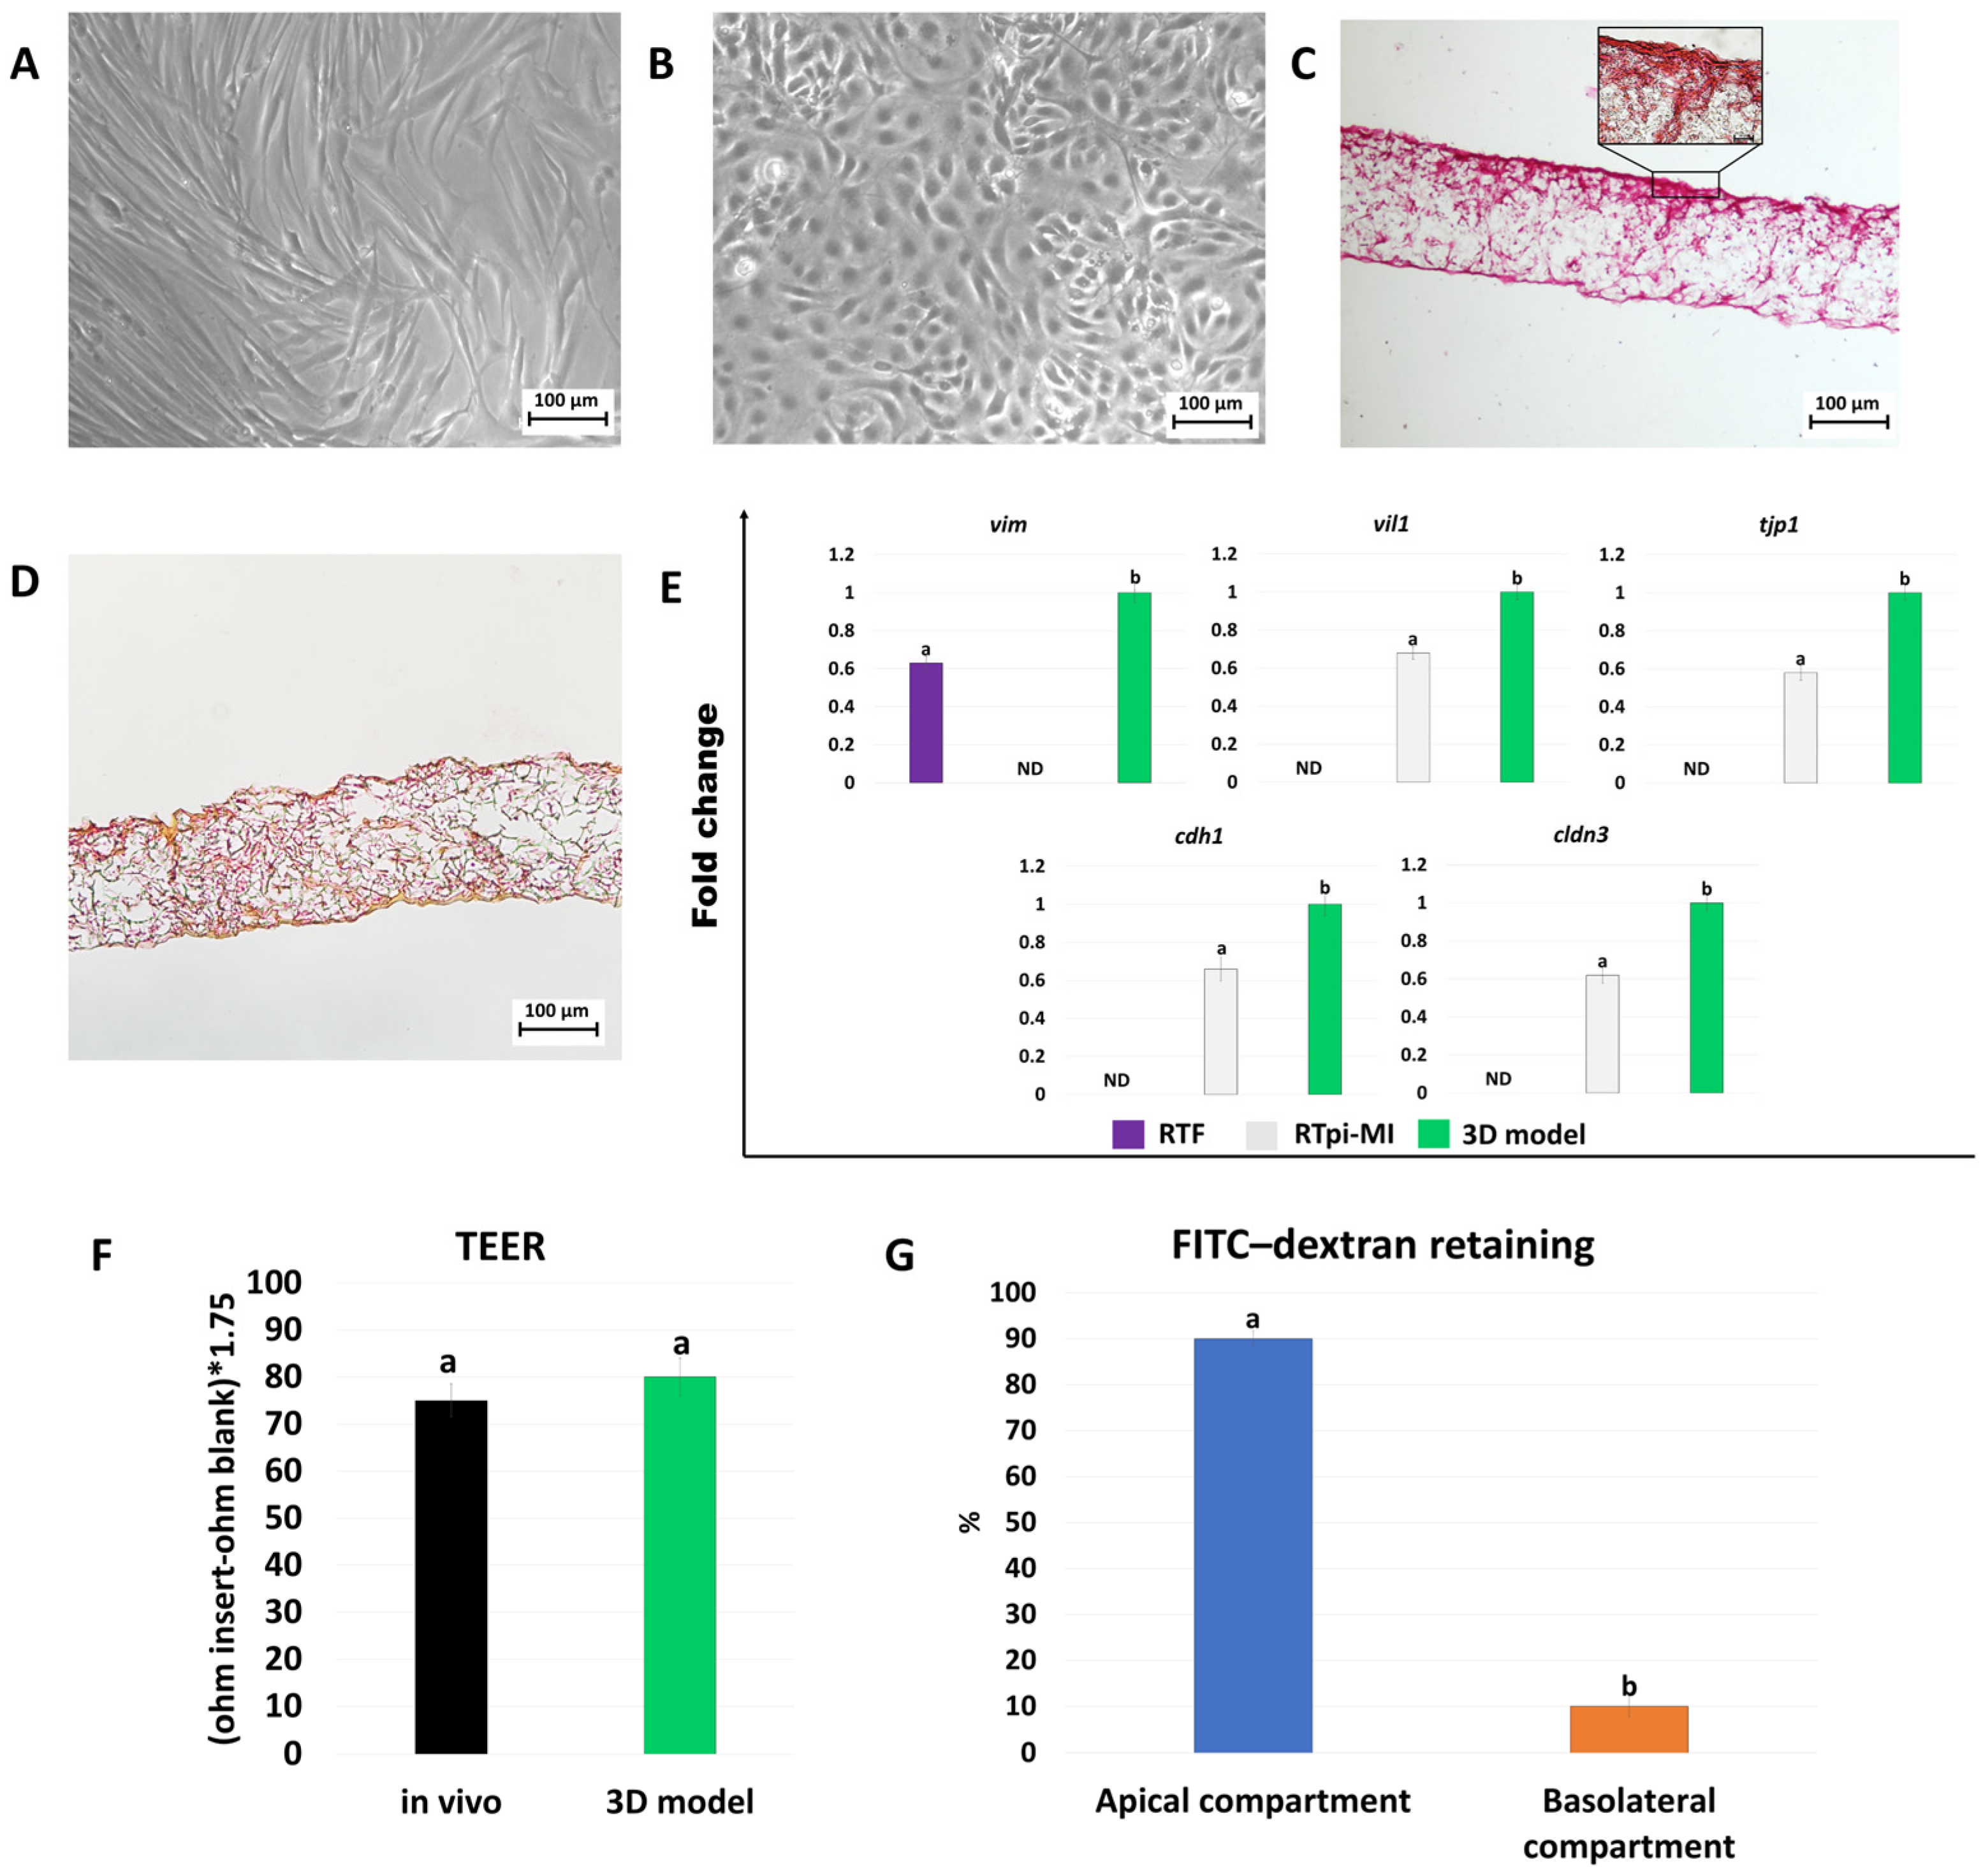
2.2. Development and Characterization of Rainbow Trout 3D Intestinal Models

Rainbow trout fibroblasts (RTFs) cultured in 2D supports showed the typical fusiform, elongated morphology (Figure 2A), whereas proximal intestine epithelial (RTpi-MI) cells were small and rounded in shape with small nuclei (Figure 2B). When cultured on Alvetex® scaffolds, RTFs created a robust stromal compartment, deposited collagen (Figure 2D), and were able to support the epithelial layer (Figure 2C). In addition, RTpi-MI cells plated on top of the RTFs displayed an elongated columnar shape and polarized morphology (Figure 2C). Expression levels of both stromal and epithelial-specific genes, namely vim, vil1, tjp1, cdh1, and cldn3, were increased in cells cultured in 3D systems compared to those grown on 2D culture dishes (Figure 2E). TEER values showed an average of 75.8 ± 6.6 Ω·cm2 (Figure 2F). Low permeability was demonstrated by a reduced dextran flux from the apical to the basolateral compartment (Figure 2G).

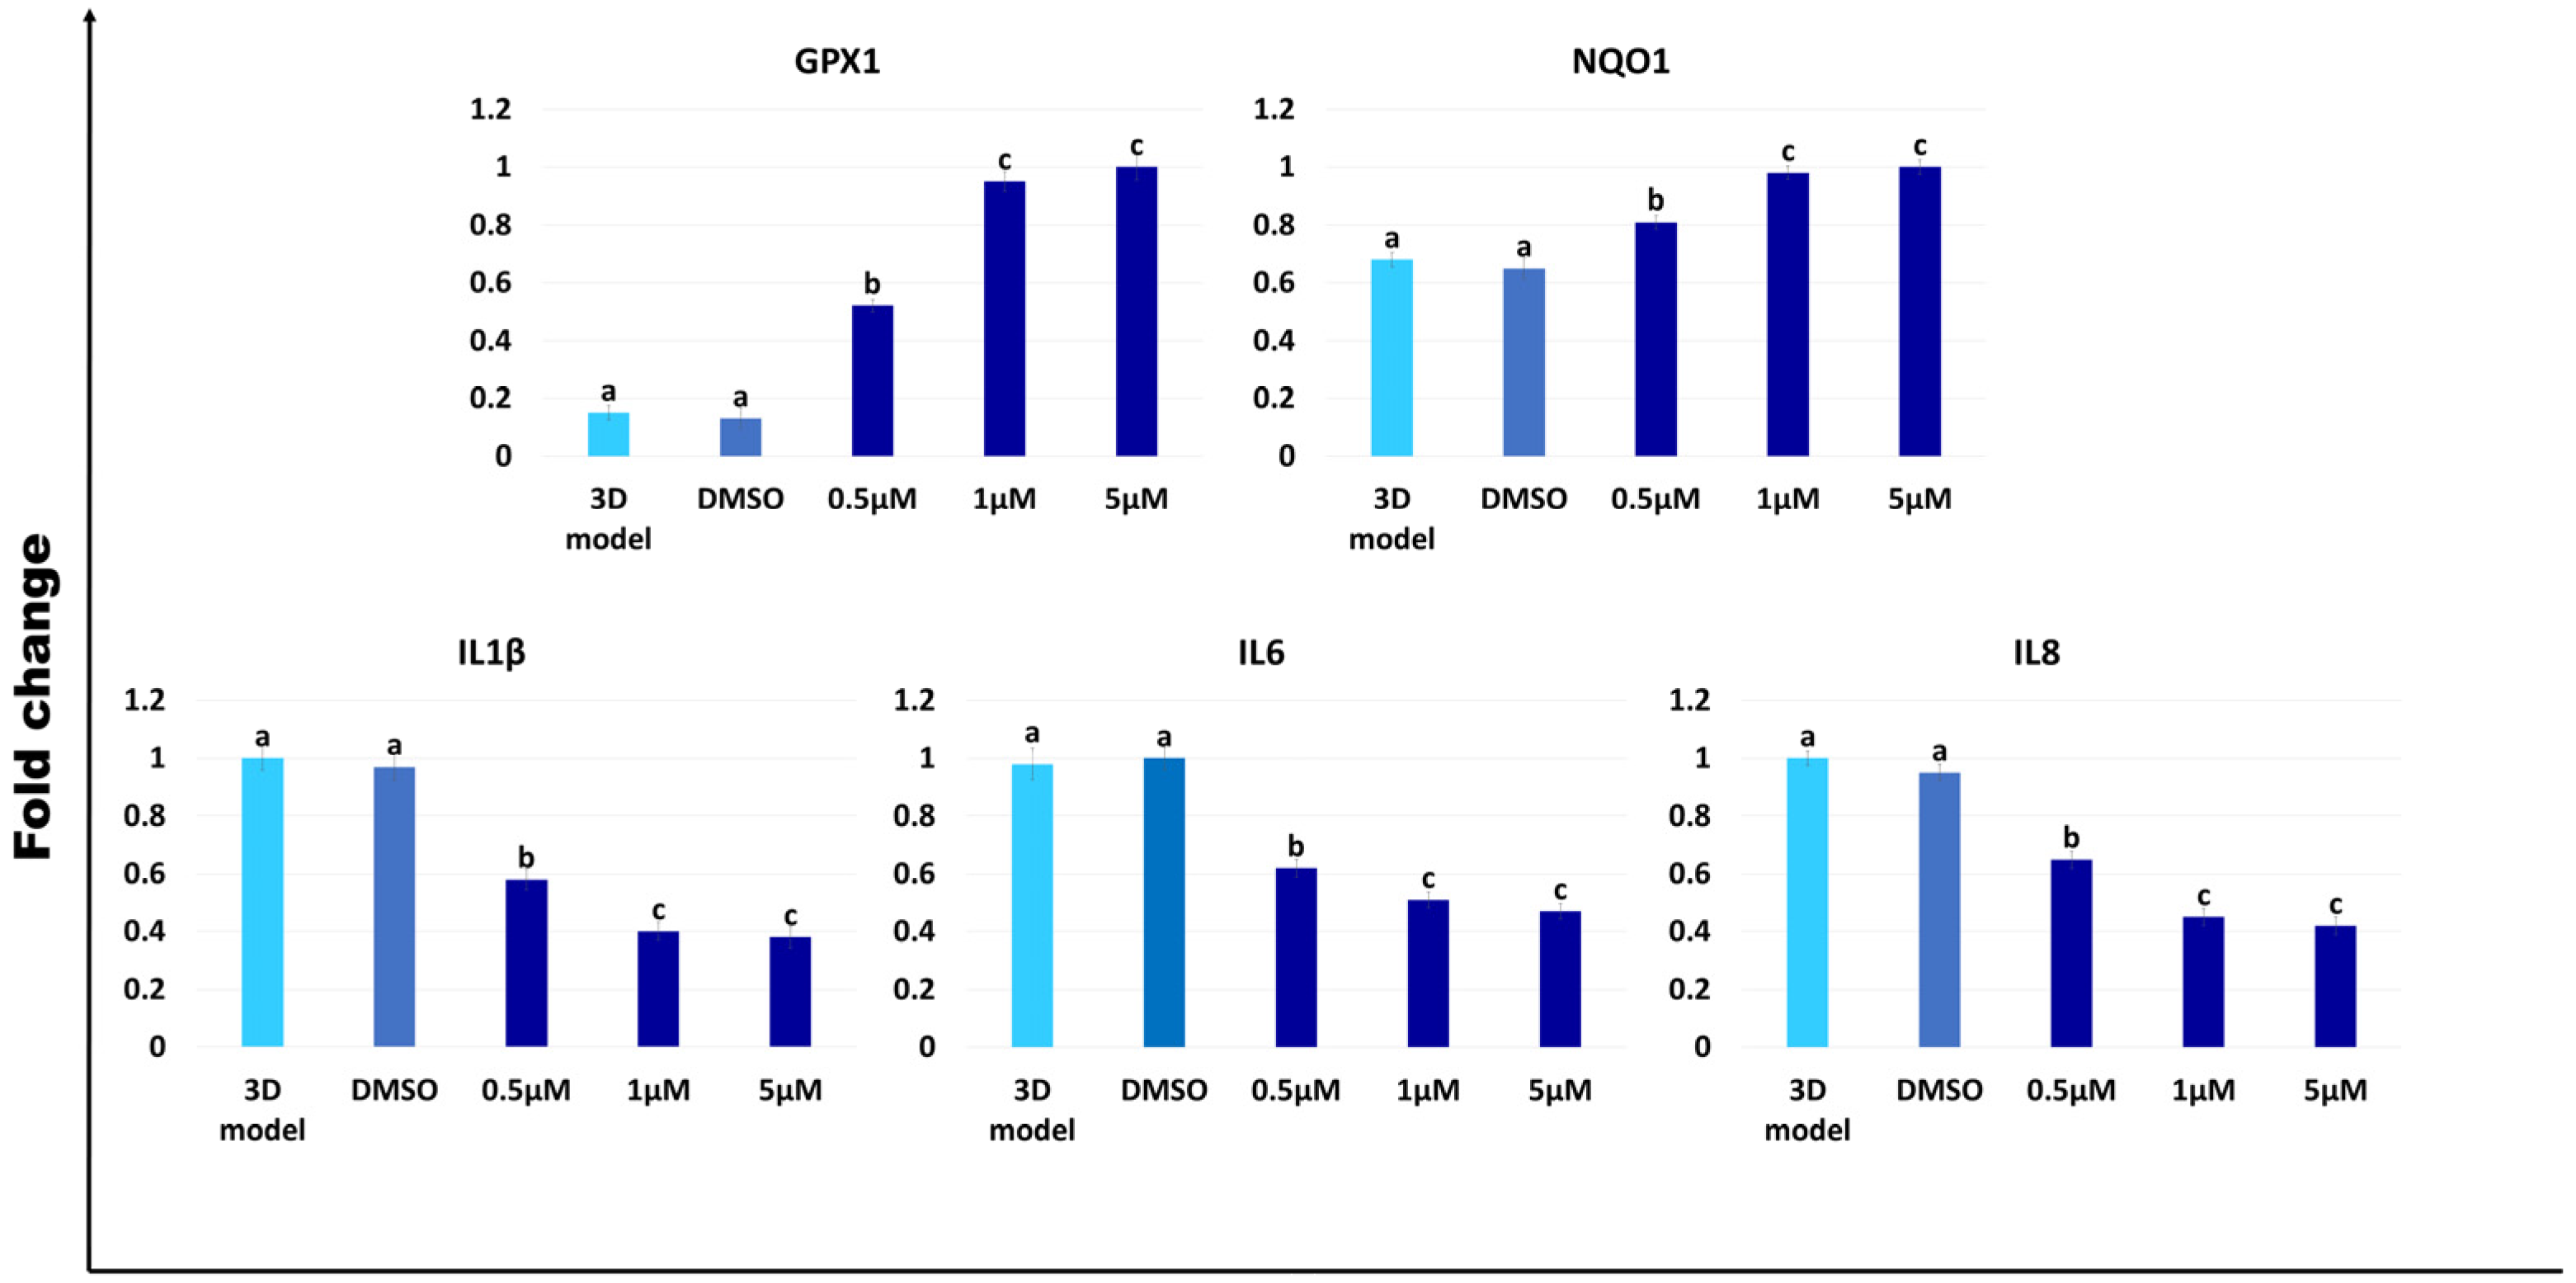
2.3. Antioxidant and Anti-Inflammatory Effects of AST on the Porcine 3D Intestinal Models

After 24 h of exposure to AST, the generated porcine 3D intestinal models significantly upregulated the expression of the main antioxidant genes analyzed, namely GPX1 and NADPH1 (NQO1), regardless of AST concentration (Figure 3). In addition, the transcription levels detected after 1 and 5 µM concentration treatments were significantly higher than the untreated (3D model) and control (DMSO) groups but statistically comparable with each other (Figure 3).
In parallel, all the tested AST concentrations induced significant downregulation of the interleukins IL1β, IL6, and IL8 (Figure 3). In particular, 1 and 5 µM exposure resulted in a significant decrement of the gene expressions when compared to the untreated (3D model) and control (DMSO) groups but displayed statistically comparable values when analyzed with each other (Figure 3).

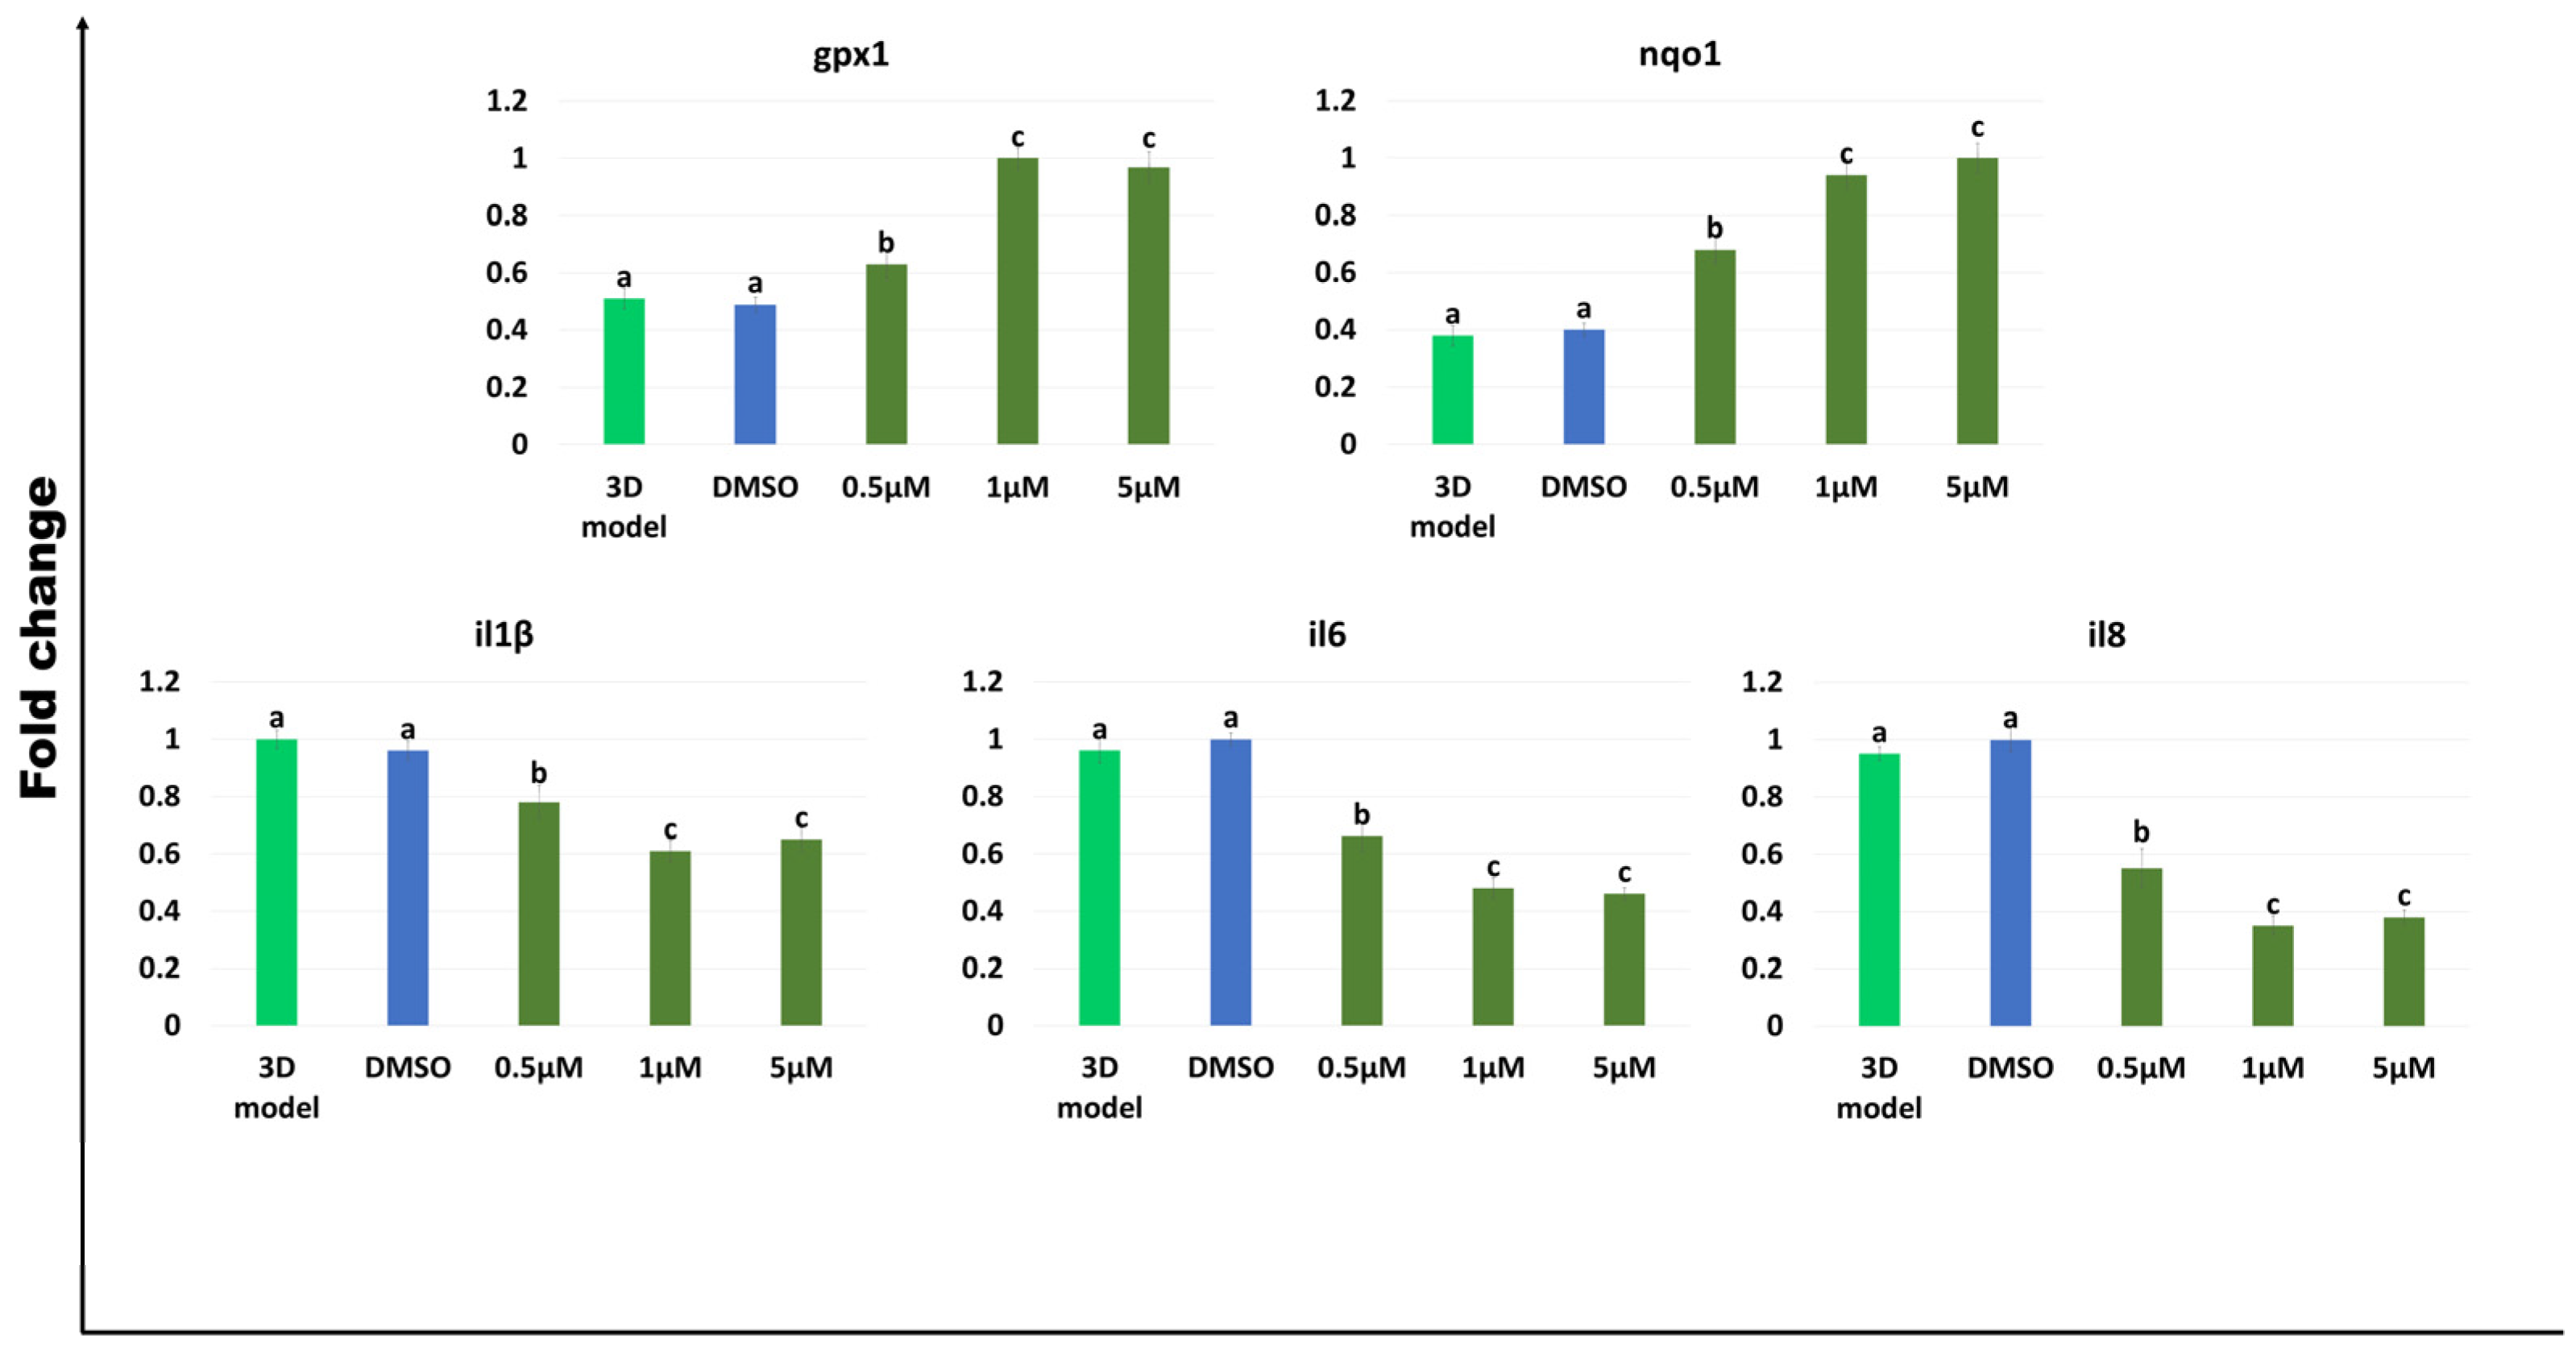
2.4. Antioxidant and Anti-Inflammatory Effects of AST on the Rainbow Trout 3D Intestinal Models

Similar to what was observed in the porcine models, after 24 h of exposure to AST, the generated rainbow trout 3D intestinal models significantly increased the expression levels of the antioxidant genes gpx1 and nqo1, and downregulated the interleukins il1β, il6, and il8, displaying expression level trends similar to those detected in the porcine models (Figure 4).

3. Discussion

Three-dimensional models are currently widely used in research because of their ability to allow cells to maintain the organization of the native tissue of origin, as well as organize in a three-dimensional manner, similar to their behavior in vivo [37,38,39,40]. In this study, we generate ad hoc 3D in vitro platforms that mimic the intestinal mucosa of pigs and rainbow trout. We then take advantage of the newly created functional 3D models to investigate whether AST may interact with the molecular mechanisms possibly involved in inflammation and oxidative stress. In particular, in the present experiments, 3D cell aggregation is achieved with the use of a highly porous polystyrene scaffold, commercially available and registered under the name Alvetex®, which is able to maintain the cells’ original shape and encourage cell interactions [41,42,43,44,45]. This is confirmed by the results in Figure 1C and Figure 2C, which show that the formation of the stromal and the epithelial compartments in both the porcine and rainbow trout species can be appreciated. The results are also consistent with previous observations that describe an Alvetex® thickness of 200 µm [42] as an ideal feature to replicate in vitro the distance of cells from blood capillaries, thus replicating the behavior of nutrients in vivo [41], and is in line with the choice of several authors that previously adopted this approach to generate body barriers in vitro, such as the intestinal mucosa [43,45], the dermis [41,42,46], and the endometrium [47,48]. Notably, all of these studies demonstrated the development of the two main barrier compartments, namely the stroma and the epithelium, similar to what is described in the present manuscript and suggested the ability of Alvetex® scaffold to encourage epithelial–ECM interactions, which typically occur in vivo [49,50]. In agreement with this, the use of a 3D approach allows cells to display a more physiological phenotype than the morphology acquired by the cells in traditional monolayer culture systems, which is likely to cause unphysiological behaviors [51]. Consistent with this, the morphological analysis presented here demonstrates the ability of both fibroblasts (Figure 1A and Figure 2A) and epithelial cells (Figure 1B and Figure 2B) to rearrange on the scaffold in a robust stroma and epithelial layer, respectively, with the production of the ECM components to support the upper intestinal layer (Figure 1D and Figure 2D). Interestingly, engrafting on the scaffold results in cell functional enhancement, with an increased expression of the genes distinctive of the two cell populations. As shown in Figure 1E, VIM and THY1 expression levels are significantly upregulated in porcine fibroblasts cultured on Alvetex® scaffolds, compared to those grown in monolayer (Figure 1E). Similarly, Figure 2D displays a higher transcription of VIM in rainbow trout fibroblasts cultured in 3D. All these aspects lead us to speculate that when a robust stromal compartment is created, epithelial cells are able to better mimic in vitro the functions distinctive of their original tissue. This is consistent with the results presented in this manuscript where epithelial cells, co-cultured on top of the stromal compartment, acquire a polarized elongated columnar phenotype (Figure 1C and Figure 2C) and is in agreement with Darling et al. who demonstrated a polarized shape in 3D co-cultured epithelial cells [43]. The morphological results are, once again, confirmed by the molecular data that demonstrate a statistically significant increase in the expression of the porcine epithelial markers VIL, ZO1, OCL1, and CLND in the 3D model compared to pIECs (Figure 1E). A similar result is evident in the rainbow trout 3D intestinal model that displays a significantly higher transcription of vil1, tjp1, cdh1, and cldn3 compared to RTpi-MI cells (Figure 2E). In agreement with this, Darling et al. previously demonstrated that when human epithelial cells were co-cultured with stromal cells, they exhibited a polarized phenotype [43]. Similar results were previously obtained in the porcine species [32,52,53]. However, it is interesting to note that all these authors used immortalized cell lines such as Caco-2 (human) and IPEC-J2 (pig) to generate the intestinal epithelial compartment in vitro. In our opinion, this could represent a limit since these cell lines are prone to overcrowding [54] and instability [55]. In addition, they have been previously reported to exhibit atypically high TEER and only low active transport rates, so the effect of nutritional factors cannot be reliably investigated [32]. Based on all these observations, in the present work, we used primary cells, freshly isolated from intestinal biopsies to maintain the cell’s original phenotype and, more in general, to preserve the anatomical and physiological features distinctive of the intestinal epithelial cells in vivo. As described above, in the 3D models created, the presence of the epithelial compartment is demonstrated by the active transcription of the typical tight junction markers, as well as the expression of adherens junction-related genes, suggesting the activation of a molecular expression pattern that supports barrier integrity [45]. This is in agreement with previous studies that used this strategy and showed that the formation of intercellular junctions contributed to the mechanical properties of individual epithelial cells, cell adhesion, and intercellular communication [56]. However, it is interesting to note that the barrier functionality of the newly generated 3D intestinal models is further demonstrated by the TEER values obtained in the present experiments, which are similar to those reported in vivo and indicate a resistance property close to physiological transport rates. In addition, these data well correlate and are further strengthened by the experiments assessing paracellular permeability of the newly generated barrier, which, when subjected to a 2 h exposure of 4 kDa FITC–dextran, demonstrated significantly higher retention of dextran in the apical compartment, indicating the ability of epithelial cells to prevent the paracellular flux of large molecules (Figure 1G and Figure 2G).
Exposure of the generated 3D models to AST significantly upregulates the antioxidant genes GPX1 and NQO1, as well as gpx1 and nqo1, in the porcine and rainbow trout species, respectively (Figure 3 and Figure 4). These results are in line with Kochi et al. who previously showed an increased expression of Gpx1 in mouse colonic mucosa [57]. Similarly, Tian et al. reported AST’s ability to decrease aflatoxin B1-induced oxidative stress, increasing NQO1 expression in IPEC-J2 cells [31]. The results are also consistent with Davinelli et al., who demonstrated AST’s ability to regulate, in humans, the redox-sensitive transcription factor, nuclear factor erythroid 2-related factor 2 (Nrf2), which coordinates the expression of a battery of defensive genes encoding antioxidant proteins and detoxifying enzymes [19]. Altogether, these observations indicate AST properties to counteract oxidative stress in different animals, including mice and humans, as well as the porcine and rainbow trout species. Based on the emerging evidence that oxidative stress plays a crucial role in the development and maintenance of inflammation, we investigated the effect of AST on the expression of inflammation-related transcripts such as IL1β, IL6, and IL8 (Figure 3 and Figure 4) and observed a significant reduction, starting from a 0.5 μM concentration of the carotenoid. This response was evident both in porcine as well as in rainbow trout models and is coherent with Davinelli et al. who showed AST’s ability to modulate the nuclear transcription factor-κB (NF-κB) signaling network, with a general anti-inflammatory and antioxidative effect in mouse and rat experimental models [19].
Altogether, the present findings demonstrate the possibility of starting from primary cultures and generating 3D in vitro platforms with distinctive functional compartments that mimic the intestinal mucosa of pigs and rainbow trout. The models created represent a useful tool to investigate AST’s ability to interact with the molecular pathways controlling oxidative stress and inflammation, both in the porcine and rainbow trout species, and suggest AST’s positive role in prevention and health, partly replacing, or reducing, the use of in vivo animal models.

4. Materials and Methods

All reagents were purchased from Sigma-Aldrich (Milan, Italy) unless otherwise indicated.

4.1. Ethic Statement

Porcine fibroblasts (pIFs) and epithelial cells (pIECs) were isolated from fresh small intestine biopsies collected at the local abattoir from slaughtered adult animals. Rainbow trout fibroblasts (RTFs) and proximal intestine epithelial cells (RTpi-MI) [58] were obtained from fresh dermal and intestinal biopsies, respectively, of adult individuals collected at fish culture ponds. Fish organs were obtained from animals destined for human consumption and, therefore, were not considered animal experimentation under Directive 2010/63/EU of the European Parliament. All experiments were performed in accordance with the approved guidelines.

4.2. pIF Isolation, Growth, and Maintenance on Standard Plastic Dishes

Porcine intestinal explants were cut longitudinally along the connective surface and, subsequently, in small fragments of approximately 2 mm3. Tissues were placed on a 0.1% porcine gelatin pre-coated Petri dish (Sarstedt, Milan, Italy) and cultured in Dulbecco’s Modified Eagle Medium (DMEM, Thermo Fisher Scientific, Milan, Italy), supplemented with 20% Fetal Bovine Serum (FBS, Thermo Fisher Scientific, Milan, Italy), 2 mM of glutamine, and 2% antibiotic/antimycotic solution. After 6 days of culture, cells started to grow out and fragments were carefully removed. The pIFs were maintained in the medium described above supplemented with 10% FBS, grown in 5% CO2 at 37 °C, and passaged twice a week at a 1:3 ratio.

4.3. pIEC Isolation, Growth, and Maintenance on Standard Plastic Dishes

Porcine intestinal fragments of approximately 2 mm3 were cut longitudinally along the epithelial surface, transferred onto a 0.1% porcine gelatin pre-coated Petri dish (Sarstedt, Milan, Italy) and cultured in Dulbecco’s Modified Eagle Medium/Nutrient Mixture F12 (DMEM/F12, Thermo Fisher Scientific, Milan, Italy) supplemented with 5% FBS, 2 mM of glutamine, and 2% antibiotic/antimycotic solution. When cells reached confluence, they were trypsinized (Trypsin-EDTA) and transferred into a T25 flask (Sarstedt, Milan, Italy) and then maintained in 5% CO2 at 37 °C. The pIECs were passaged twice a week at a 1:3 ratio.

4.4. Development of Porcine 3D Intestinal Models

Alvetex® Scaffold inserts with 12 wells (Reprocell Europe, Glasgow, UK) were prepared according to the manufacturer’s instructions. The pIFs of 0.5 × 10⁶ were seeded on inserts at days 0, 7, and 9 of culture and grown in DMEM supplemented with 20% FBS, 2 mM of glutamine, 5 ng/mL of transforming growth factor β1 (TGF β1, Thermo Fisher Scientific, Milan, Italy), 100 μg/mL of ascorbic acid, and 1% antibiotic/antimycotic solution in 5% CO2 at 37 °C for 14 days. The medium was refreshed twice a week. On day 14, 0.4 × 10⁶ pIECs were layered on the stromal compartment and co-cultured in DMEM/F12 supplemented with 5% FBS, 2 mM of glutamine, 1% insulin–transferrin–selenium (ITS, Thermo Fisher Scientific, Milan, Italy), 5 ng/mL of epidermal growth factor (EGF, Thermo Fisher Scientific, Milan, Italy), and 1% antibiotic/antimycotic solution for 21 days. Cultures were maintained in 5% CO2 at 37 °C and medium was refreshed twice a week.

4.5. RTF Isolation, Growth, and Maintenance on Standard Plastic Dishes

Rainbow trout dermal fragments of approximately 1 mm3 were placed on 0.1% gelatin pre-coated T25 flasks (Sarstedt, Milan, Italy) and cultured Leibovit’s 15 Medium (L-15, Thermo Fisher Scientific, Milan, Italy) supplemented with 20% FBS, 2 mM of glutamine, and 2% antibiotic/antimycotic solution. RTFs started to grow out of the fragments after 6 days of culture. Skin biopsies were carefully removed, and fibroblasts were maintained in the medium described above supplemented with 10% FBS. The cells were passaged twice a week at a 1:3 ratio and grown without CO2 at 20 °C.

4.6. RTpi-MI Cell Isolation, Growth, and Maintenance on Standard Plastic Dishes

Fragments of approximately 1 mm3 of rainbow trout intestine were placed on 0.1% gelatin pre-coated T25 flasks (Sarstedt, Milan, Italy) and cultured Leibovit’s 15 Medium (L-15, Thermo Fisher Scientific, Milan, Italy) supplemented with 10% FBS, 2 mM of glutamine, and 2% antibiotic/antimycotic solution. After 10 days of culture, cells started to grow out of the fragments, which were carefully removed. The cells were maintained in the medium described above supplemented with 5% FBS. The cells were passaged twice a week at a 1:3 ratio and grown without CO2 at 20 °C.

4.7. Development of Rainbow Trout 3D Intestinal Models

Alvetex® Scaffold inserts with 12 wells were prepared according to the manufacturer’s instructions. To generate the stromal compartment, 1 × 10⁶ RTFs were seeded onto scaffolds and culture for 28 days in L-15, supplemented with 10% FBS, 2 mM of glutamine, 1% antibiotic/antimycotic solution, 5 ng/mL of TGF β1, and 100 μg/mL of ascorbic acid. After 28 days, 9 × 10⁵ RTpi-MI cells were cultured on the top of the RTFs in L-15, supplemented with 5% FBS, 2 mM of glutamine, and 1% antibiotic/antimycotic solution without CO2 at 20 °C for 21 days. The medium was refreshed twice a week.

4.8. Histological Analysis

At the end of the culture periods, the generated 3D intestinal models were fixed in 4% paraformaldehyde (PFA) for 24 h, dehydrated through a series of ethanol washes, incubated in Histoclear (Bio-optica, Milano, Italy), and embedded in paraffin. Sections 5–7 µm thick were cut, dewaxed, re-hydrated, and stained with hematoxylin and eosin (HE, Sigma-Aldrich) to visualize cell morphology, and with picrosirius red to evaluate collagen deposition. The samples were analyzed using a Leica DMR microscope (Leica Microsystems, Wetzlar, Germany).

4.9. Trans-Epithelial Electrical Resistance (TEER) Measurement in 3D Intestinal Models

An EVOM2 Epithelial Voltmeter with an STX3 electrode (World Precision Instrument, Friedberg Germany) was used to measure TEER of the intestinal barriers. After electrode equilibration, it was inserted into the 3 sides of each insert and the final TEER value was determined as follows:
TEER (Ohm × cm2) = (TEER average sample insert − TEER average blank insert) × Area cm2

4.10. Permeability Evaluation of 3D Intestinal Models

Permeability was evaluated using FITC–dextran 4 kDa. An amount of 100 µg/mL of stock solution was prepared dissolving 0.0010 g of FITC–dextran (dextran, cat. No. FD4-250MG) in 10 mL of complete culture medium. The solution obtained was sterilized with a 0.22 µm syringe filter. For each well, 2 mL of culture medium was added in the basolateral compartment and 0.4 mL in the apical ones. Subsequently, 600 µL of FITC–dextran solution was added in the apical compartment. An amount of 100 µL of culture medium obtained from the basolateral compartment was collected at different time points, transferred into a 96-well plate, and analyzed using a fluorescence plate reader (Bio-Rad Laboratories, Milan, Italy).

4.11. AST Exposure of 3D Intestinal Models

Porcine and rainbow trout 3D intestinal models were exposed to different AST concentrations (0.5 µM, 1 µM, and 5 µM) and incubated for 24 h as previously described by Campisi et al. [59]. To this purpose, 1 mM of AST stock solution was prepared by dissolving 0.0012 g of powder in 2 mL of dimethyl-sulfoxide (DMSO). Subsequently, different working solutions were prepared. DMSO was used as a vehicle. A culture medium was used as a control (CTR).

4.12. Gene Expression Analysis

The TaqManGene Expression Cells-to-CT kit (Thermo Fisher Scientific, Milan, Italy) was used to extract RNA from the samples, following the manufacturer’s instructions. DNase I (1:100) was added to the lysis solution. Predesigned gene-specific primers and probe sets from TaqManGene Expression Assays (Table 1) were used for quantitative Real-Time PCR of the porcine samples. For the rainbow trout samples, primers were designed with IDT web tools (https://eu.idtdna.com/pages, accessed on 23 May 2022) using complementary DNA (cDNA) sequences of rainbow trout available on NCBI (https://www.ncbi.nlm.nih.gov/, accessed on 23 May 2022). PCR products were sequenced by Eurofins Genomics (Ebersberg, Germany, Europe) and validated through alignment with the rainbow trout transcriptome. GAPDH and ACTB were used as internal reference genes for the porcine samples, and actb and ef1 were used for the rainbow trout samples. CFX96 Real-Time PCR was used as a detection system (Bio-Rad Laboratories, Milan, Italy). Target gene analysis was performed using CFX Manager software Version 3.1 (Bio-Rad Laboratories, Milan, Italy), and gene expression levels are here reported with the highest expression set to 1 and the other relative to this.

4.13. Statistical Analysis

Statistical analysis was performed using the Shapiro–Wilk and two-way ANOVA tests (SPSS 19.1; IBM, Armonk, NY, USA). Data were presented as mean ± standard deviation (SEM). Differences of p ≤ 0.05 were considered significant and are indicated with different superscripts.

Author Contributions

Conceptualization, T.A.L.B. and F.G.; investigation, G.P., S.A., M.P. and R.P.; writing—original draft preparation, S.A., G.P. and T.A.L.B.; project administration, T.A.L.B.; funding acquisition, T.A.L.B. All authors have read and agreed to the published version of the manuscript.

Funding

This research was funded by the Carraresi Foundation, PSR2022, PSR2023, and HORIZON-WIDERA-2021 project n#101079349 (OH-Boost).

Institutional Review Board Statement

Fish organs were obtained from animals destined for human consumption and, therefore, were not considered animal experimentation under Directive 2010/63/EU of the European Parliament. All experiments were performed in accordance with the approved guidelines.

Informed Consent Statement

Not applicable.

Data Availability Statement

The data presented in this study are available upon request from the corresponding author.

Conflicts of Interest

The authors declare no conflicts of interest.

References

  1. Yang, C.; Zhang, H.; Liu, R.; Zhu, H.; Zhang, L.; Tsao, R. Bioaccessibility, Cellular Uptake, and Transport of Astaxanthin Isomers and Their Antioxidative Effects in Human Intestinal Epithelial Caco-2 Cells. J. Agric. Food Chem. 2017, 65, 10223–10232. [Google Scholar] [CrossRef]
  2. Higuera-Ciapara, I.; Félix-Valenzuela, L.; Goycoolea, F.M. Astaxanthin: A Review of Its Chemistry and Applications. Crit. Rev. Food Sci. Nutr. 2006, 46, 185–196. [Google Scholar] [CrossRef] [PubMed]
  3. Ambati, R.R.; Moi, P.S.; Ravi, S.; Aswathanarayana, R.G. Astaxanthin: Sources, Extraction, Stability, Biological Activities and Its Commercial Applications—A Review. Mar. Drugs 2014, 12, 128–152. [Google Scholar] [CrossRef] [PubMed]
  4. Augusti, P.R.; Quatrin, A.; Somacal, S.; Conterato, G.M.M.; Sobieski, R.; Ruviaro, A.R.; Maurer, L.H.; Duarte, M.M.F.; Roehrs, M.; Emanuelli, T. Astaxanthin Prevents Changes in the Activities of Thioredoxin Reductase and Paraoxonase in Hypercholesterolemic Rabbits. J. Clin. Biochem. Nutr. 2012, 51, 42–49. [Google Scholar] [CrossRef] [PubMed]
  5. Liu, A.; He, M.; Liu, C.; Ye, Z.; Tan, C.P.; Liu, Y.; Gong, J.; Lei, J.; He, Y.; Zhu, S.; et al. Prevention of Hypercholesterolemia with “Liposomes in Microspheres” Composite Carriers: A Promising Approach for Intestinal-Targeted Oral Delivery of Astaxanthin. J. Agric. Food Chem. 2024, 72, 6118–6132. [Google Scholar] [CrossRef] [PubMed]
  6. Davinelli, S.; Saso, L.; Angeli, F.D.; Calabrese, V.; Intrieri, M.; Scapagnini, G. Astaxanthin Molecular Mechanisms and Possible Clinical Applications. Molecules 2022, 2, 502. [Google Scholar] [CrossRef] [PubMed]
  7. Ma, B.; Lu, J.; Kang, T.; Zhu, M.; Xiong, K.; Wang, J. Astaxanthin Supplementation Mildly Reduced Oxidative Stress and Inflammation Biomarkers: A Systematic Review and Meta-Analysis of Randomized Controlled Trials. Nutr. Res. 2022, 99, 40–50. [Google Scholar] [CrossRef] [PubMed]
  8. Rostami, S.; Alyasin, A.; Saedi, M.; Nekoonam, S.; Khodarahmian, M.; Moeini, A.; Amidi, F. Astaxanthin Ameliorates Inflammation, Oxidative Stress, and Reproductive Outcomes in Endometriosis Patients Undergoing Assisted Reproduction: A Randomized, Triple-Blind Placebo-Controlled Clinical Trial. Front. Endocrinol. 2023, 14, 1144323. [Google Scholar] [CrossRef] [PubMed]
  9. Igielska-Kalwat, J.; Gościańska, J.; Nowak, I. Carotenoids as Natural Antioxidants [Karotenoidy Jako Naturalne Antyoksydanty]. Postepy Hig. Med. Dosw. 2015, 69, 418–428. [Google Scholar] [CrossRef]
  10. Jia, Y.; Wu, C.; Kim, J.; Kim, B.; Lee, S.J. Astaxanthin Reduces Hepatic Lipid Accumulations in High-Fat-Fed C57BL/6J Mice via Activation of Peroxisome Proliferator-Activated Receptor (PPAR) Alpha and Inhibition of PPAR Gamma and Akt. J. Nutr. Biochem. 2016, 28, 9–18. [Google Scholar] [CrossRef]
  11. Zhang, Z.; Guo, C.; Jiang, H.; Han, B.; Wang, X.; Li, S.; Lv, Y.; Lv, Z.; Zhu, Y. Inflammation Response after the Cessation of Chronic Arsenic Exposure and Post-Treatment of Natural Astaxanthin in Liver: Potential Role of Cytokine-Mediated Cell-Cell Interactions. Food Funct. 2020, 11, 9252–9262. [Google Scholar] [CrossRef] [PubMed]
  12. Lima, S.G.M.; Freire, M.C.L.C.; Oliveira, V.d.S.; Solisio, C.; Converti, A.; de Lima, Á.A.N. Astaxanthin Delivery Systems for Skin Application: A Review. Mar. Drugs 2021, 19, 511. [Google Scholar] [CrossRef] [PubMed]
  13. Suganuma, K.; Nakajima, H.; Ohtsuki, M.; Imokawa, G. Astaxanthin Attenuates the UVA-Induced up-Regulation of Matrix-Metalloproteinase-1 and Skin Fibroblast Elastase in Human Dermal Fibroblasts. J. Dermatol. Sci. 2010, 58, 136–142. [Google Scholar] [CrossRef] [PubMed]
  14. Hama, S.; Takahashi, K.; Inai, Y.; Shiota, K.; Sakamoto, R.; Yamada, A.; Tsuchiya, H.; Kanamura, K.; Yamashita, E.; Kogure, K. Protective Effects of Topical Application of a Poorly Soluble Antioxidant Astaxanthin Liposomal Formulation on Ultraviolet-Induced Skin Damage. J. Pharm. Sci. 2012, 101, 2909–2916. [Google Scholar] [CrossRef] [PubMed]
  15. Rao, A.R.; Sindhuja, H.N.; Dharmesh, S.M.; Sankar, K.U.; Sarada, R.; Ravishankar, G.A. Effective Inhibition of Skin Cancer, Tyrosinase, and Antioxidative Properties by Astaxanthin and Astaxanthin Esters from the Green Alga Haematococcus Pluvialis. J. Agric. Food Chem. 2013, 61, 3842–3851. [Google Scholar] [CrossRef] [PubMed]
  16. Imokawa, G. The Xanthophyll Carotenoid Astaxanthin Has Distinct Biological Effects to Prevent the Photoaging of the Skin Even by Its Postirradiation Treatment. Photochem. Photobiol. 2019, 95, 490–500. [Google Scholar] [CrossRef] [PubMed]
  17. Eren, B.; Tuncay Tanrıverdi, S.; Aydın Köse, F.; Özer, Ö. Antioxidant Properties Evaluation of Topical Astaxanthin Formulations as Anti-Aging Products. J. Cosmet. Dermatol. 2019, 18, 242–250. [Google Scholar] [CrossRef] [PubMed]
  18. Yoshihisa, Y.; Andoh, T.; Matsunaga, K.; Ur Rehman, M.; Maoka, T.; Shimizu, T. Efficacy of Astaxanthin for the Treatment of Atopic Dermatitis in a Murine Model. PLoS ONE 2016, 11, e0152288. [Google Scholar] [CrossRef] [PubMed]
  19. Davinelli, S.; Nielsen, M.E.; Scapagnini, G. Astaxanthin in Skin Health, Repair, and Disease: A Comprehensive Review. Nutrients 2018, 10, 522. [Google Scholar] [CrossRef]
  20. Kalinowski, C.T.; Betancor, M.B.; Torrecillas, S.; Sprague, M.; Larroquet, L.; Véron, V.; Panserat, S.; Izquierdo, M.S.; Kaushik, S.J.; Fontagné-Dicharry, S. More Than an Antioxidant: Role of Dietary Astaxanthin on Lipid and Glucose Metabolism in the Liver of Rainbow Trout (Oncorhynchus Mykiss). Antioxidants 2023, 12, 136. [Google Scholar] [CrossRef]
  21. Akiba, Y.; Sato, K.; Takahashi, K.; Matsushita, K.; Komiyama, H.; Tsunekawa, H.; Nagao, H. Meat Color Modification in Broiler Chickens by Feeding Yeast Phaffia Rhodozyma Containing High Concentrations of Astaxanthin. J. Appl. Poult. Res. 2001, 10, 154–161. [Google Scholar] [CrossRef]
  22. Besharat, M.; Islami, H.R.; Soltani, M.; Mousavi, S.A. Effects of Dietary Nanoliposome-Coated Astaxanthin on Haematological Parameters, Immune Responses and the Antioxidant Status of Rainbow Trout (Oncorhynchus Mykiss). Vet. Med. Sci. 2024, 10, e1461. [Google Scholar] [CrossRef] [PubMed]
  23. Shastak, Y.; Pelletier, W. Captivating Colors, Crucial Roles: Astaxanthin’s Antioxidant Impact on Fish Oxidative Stress and Reproductive Performance. Animals 2023, 13, 3357. [Google Scholar] [CrossRef] [PubMed]
  24. Shabanzadeh, S.; Vatandoust, S.; Hosseinifard, S.M.; Sheikhzadeh, N.; Shahbazfar, A.A. Dietary Astaxanthin (Lucantin® Pink) Mitigated Oxidative Stress Induced by Diazinon in Rainbow Trout (Oncorhynchus Mykiss). Vet. Res. Forum 2023, 14, 97–104. [Google Scholar] [CrossRef]
  25. Rahman, M.M.; Khosravi, S.; Chang, K.H.; Lee, S.M. Effects of Dietary Inclusion of Astaxanthin on Growth, Muscle Pigmentation and Antioxidant Capacity of Juvenile Rainbow Trout (Oncorhynchus Mykiss). Prev. Nutr. Food Sci. 2016, 21, 281–288. [Google Scholar] [CrossRef] [PubMed]
  26. Zhao, W.; Guo, Y.C.; Huai, M.Y.; Li, L.; Man, C.; Pelletier, W.; Wei, H.L.; Yao, R.; Niu, J. Comparison of the Retention Rates of Synthetic and Natural Astaxanthin in Feeds and Their Effects on Pigmentation, Growth, and Health in Rainbow Trout (Oncorhynchus Mykiss). Antioxidants 2022, 11, 2473. [Google Scholar] [CrossRef]
  27. Elbahnaswy, S.; Elshopakey, G.E. Recent Progress in Practical Applications of a Potential Carotenoid Astaxanthin in Aquaculture Industry: A Review. Fish. Physiol. Biochem. 2024, 50, 97–126. [Google Scholar] [CrossRef] [PubMed]
  28. Carr, C.C.; Johnson, D.D.; Brendemuhl, J.H.; Gonzalez, J.M. Fresh Pork Quality and Shelf-Life Characteristics of Meat from Pigs Supplemented with Natural Astaxanthin in the Diet. Prof. Anim. Sci. 2010, 26, 18–25. [Google Scholar] [CrossRef]
  29. Bergstrom, J.R.; Nelssen, J.L.; Tokach, M.D.; DeRouchey, J.M.; Goodband, R.D.; Dritz, S.S. An Evaluation of Astaxanthin as a Nutraceutical Growth Promoter in Starter Diets for Weanling Pigs; Kansas Agricultural Experiment Station Research Reports; Center for the Advancement of Digital Scholarship K-State Libraries: Manhattan, KS, USA, 2007. [Google Scholar] [CrossRef]
  30. Szczepanik, K.; Oczkowicz, M.; Dobrowolski, P.; Świątkiewicz, M. The Protective Effects of Astaxanthin (AST) in the Liver of Weaned Piglets. Animals 2023, 13, 3268. [Google Scholar] [CrossRef]
  31. Tian, Y.; Che, H.; Yang, J.; Jin, Y.; Yu, H.; Wang, C.; Fu, Y.; Li, N.; Zhang, J. Astaxanthin Alleviates Aflatoxin B1-Induced Oxidative Stress and Apoptosis in IPEC-J2 Cells via the Nrf2 Signaling Pathway. Toxins 2023, 15, 232. [Google Scholar] [CrossRef]
  32. Zakrzewski, S.S.; Richter, J.F.; Krug, S.M.; Jebautzke, B.; Lee, I.F.M.; Rieger, J.; Sachtleben, M.; Bondzio, A.; Schulzke, J.D.; Fromm, M.; et al. Improved Cell Line IPEC-J2, Characterized as a Model for Porcine Jejunal Epithelium. PLoS ONE 2013, 8, e79643. [Google Scholar] [CrossRef] [PubMed]
  33. Nossol, C.; Barta-Böszörményi, A.; Kahlert, S.; Zuschratter, W.; Faber-Zuschratter, H.; Reinhardt, N.; Ponsuksili, S.; Wimmers, K.; Diesing, A.K.; Rothkötter, H.J. Comparing Two Intestinal Porcine Epithelial Cell Lines (IPECs): Morphological Differentiation, Function and Metabolism. PLoS ONE 2015, 10, e0132323. [Google Scholar] [CrossRef] [PubMed]
  34. Yalcin, G.D.; Yilmaz, K.C.; Dilber, T.; Acar, A. Investigation of Evolutionary Dynamics for Drug Resistance in 3D Spheroid Model System Using Cellular Barcoding Technology. PLoS ONE 2023, 18, e0291942. [Google Scholar] [CrossRef] [PubMed]
  35. Ponce de León-Rodríguez, M.D.C.; Guyot, J.P.; Laurent-Babot, C. Intestinal in Vitro Cell Culture Models and Their Potential to Study the Effect of Food Components on Intestinal Inflammation. Crit. Rev. Food Sci. Nutr. 2019, 59, 3648–3666. [Google Scholar] [CrossRef] [PubMed]
  36. Le, N.P.K.; Altenburger, M.J.; Lamy, E. Development of an Inflammation-Triggered In Vitro “Leaky Gut” Model Using Caco-2/HT29-MTX-E12 Combined with Macrophage-like THP-1 Cells or Primary Human-Derived Macrophages. Int. J. Mol. Sci. 2023, 24, 7427. [Google Scholar] [CrossRef] [PubMed]
  37. Arcuri, S.; Pennarossa, G.; De Iorio, T.; Gandolfi, F.; Brevini, T.A.L. 3D ECM-Based Scaffolds Boost Young Cell Secretome-Derived EV Rejuvenating Effects in Senescent Cells. Int. J. Mol. Sci. 2023, 24, 8285. [Google Scholar] [CrossRef] [PubMed]
  38. Pennarossa, G.; De Iorio, T.; Arcuri, S.; Gandolfi, F.; Brevini, T.A.L. Synergistic Effect of MiR-200 and Young Extracellular Matrix-Based Bio-Scaffolds to Reduce Signs of Aging in Senescent Fibroblasts. Stem Cell Rev. Rep. 2023, 19, 417–429. [Google Scholar] [CrossRef] [PubMed]
  39. Pennarossa, G.; Manzoni, E.F.M.; Ledda, S.; deEguileor, M.; Gandolfi, F.; Brevini, T.A.L. Use of a PTFE Micro-Bioreactor to Promote 3D Cell Rearrangement and Maintain High Plasticity in Epigenetically Erased Fibroblasts. Stem Cell Rev. Rep. 2019, 15, 82–92. [Google Scholar] [CrossRef] [PubMed]
  40. Chaudhari, A.A.; Joshi, S.; Vig, K.; Sahu, R.; Dixit, S.; Baganizi, R.; Dennis, V.A.; Singh, S.R.; Pillai, S. A Three-Dimensional Human Skin Model to Evaluate the Inhibition of Staphylococcus Aureus by Antimicrobial Peptide-Functionalized Silver Carbon Nanotubes. J. Biomater. Appl. 2019, 33, 924–934. [Google Scholar] [CrossRef]
  41. Costello, L.; Darling, N.; Freer, M.; Bradbury, S.; Mobbs, C.; Przyborski, S. Use of Porous Polystyrene Scaffolds to Bioengineer Human Epithelial Tissues In Vitro. In Next Generation Culture Platforms for Reliable In Vitro Models; Springer: Berlin/Heidelberg, Germany, 2021; Volume 2273, ISBN 9781071612453. [Google Scholar]
  42. Roger, M.; Fullard, N.; Costello, L.; Bradbury, S.; Markiewicz, E.; O’Reilly, S.; Darling, N.; Ritchie, P.; Määttä, A.; Karakesisoglou, I.; et al. Bioengineering the Microanatomy of Human Skin. J. Anat. 2019, 234, 438–455. [Google Scholar] [CrossRef]
  43. Darling, N.J.; Mobbs, C.L.; González-Hau, A.L.; Freer, M.; Przyborski, S. Bioengineering Novel in Vitro Co-Culture Models That Represent the Human Intestinal Mucosa With Improved Caco-2 Structure and Barrier Function. Front. Bioeng. Biotechnol. 2020, 8, 992. [Google Scholar] [CrossRef] [PubMed]
  44. Mobbs, C.L.; Darling, N.J.; Przyborski, S. An in Vitro Model to Study Immune Activation, Epithelial Disruption and Stromal Remodelling in Inflammatory Bowel Disease and Fistulising Crohn’s Disease. Front. Immunol. 2024, 15, 1357690. [Google Scholar] [CrossRef] [PubMed]
  45. Pennarossa, G.; Arcuri, S.; Pasquariello, R.; Gandolfi, F.; Maranesi, M.; Brevini, T.A.L. Cruciferous Vegetable-Derived Indole-3-Carbinol Prevents Coronavirus Cell Egression Mechanisms in Tracheal and Intestinal 3D in Vitro Models. Phytochemistry 2023, 212, 113713. [Google Scholar] [CrossRef] [PubMed]
  46. Costello, L.; Fullard, N.; Roger, M.; Bradbury, S.; Dicolandrea, T.; Isfort, R.; Bascom, C.; Przyborski, S. Engineering a Multilayered Skin Equivalent: The Importance of Endogenous Extracellular Matrix Maturation to Provide Robustness and Reproducibility. In Methods in Molecular Biology; Springer: Berlin/Heidelberg, Germany, 2019; Volume 1993. [Google Scholar]
  47. Díez, M.; Przyborski, S.; del Cerro, A.; Alonso-Guervós, M.; Iglesias-Cabo, T.; Carrocera, S.; García, M.; Fernández, M.; Alonso, L.; Muñoz, M. Generation of a Novel Three-Dimensional Scaffold-Based Model of the Bovine Endometrium. Vet. Res. Commun. 2023, 47, 1721–1733. [Google Scholar] [CrossRef] [PubMed]
  48. Francés-Herrero, E.; Lopez, R.; Hellström, M.; De Miguel-Gómez, L.; Herraiz, S.; Brännström, M.; Pellicer, A.; Cervelló, I. Bioengineering Trends in Female Reproduction: A Systematic Review. Hum. Reprod. Update 2022, 28, 798–837. [Google Scholar] [CrossRef] [PubMed]
  49. Bernardo, M.E.; Fibbe, W.E. Mesenchymal Stromal Cells: Sensors and Switchers of Inflammation. Cell Stem Cell 2013, 13, 392–402. [Google Scholar] [CrossRef] [PubMed]
  50. Kedinger, M.; Duluc, I.; Fritsch, C.; Lorentz, O.; Plateroti, M.; Freund, J.N. Intestinal epithelial-mesenchymal cell interactions. Ann. N. Y. Acad. Sci. 1998, 859, 1–17. [Google Scholar] [CrossRef] [PubMed]
  51. Pennarossa, G.; De Iorio, T.; Gandolfi, F.; Brevini, T.A.L. Impact of Aging on the Ovarian Extracellular Matrix and Derived 3D Scaffolds. Nanomaterials 2022, 12, 345. [Google Scholar] [CrossRef] [PubMed]
  52. Brosnahan, A.J.; Brown, D.R. Porcine IPEC-J2 Intestinal Epithelial Cells in Microbiological Investigations. Vet. Microbiol. 2012, 156, 229–237. [Google Scholar] [CrossRef]
  53. Pi, G.; Song, W.; Wu, Z.; Li, Y.; Yang, H. Comparison of Expression Profiles between Undifferentiated and Differentiated Porcine IPEC-J2 Cells. Porcine Health Manag. 2022, 8, 4. [Google Scholar] [CrossRef]
  54. von Köckritz-Blickwede, M.; Zeitouni, N.; Fandrey, J.; Naim, H.Y. Measuring Oxygen Levels in Caco-2 Cultures. Hypoxia 2015, 53, 53–66. [Google Scholar] [CrossRef] [PubMed]
  55. Briske-Anderson, M.J.; Finley, J.W.; Newman, S.M. The Influence of Culture Time and Passage Number on the Morphological and Physiological Development of Caco-2 Cells. Proc. Soc. Exp. Biol. Med. 1997, 214, 248–257. [Google Scholar] [CrossRef] [PubMed]
  56. Brückner, B.R.; Janshoff, A. Importance of Integrity of Cell-Cell Junctions for the Mechanics of Confluent MDCK II Cells. Sci. Rep. 2018, 8, 14117. [Google Scholar] [CrossRef] [PubMed]
  57. Kochi, T.; Shimizu, M.; Sumi, T.; Kubota, M.; Shirakami, Y.; Tanaka, T.; Moriwaki, H. Inhibitory Effects of Astaxanthin on Azoxymethaneinduced Colonic Preneoplastic Lesions in C57/BL/KsJ-Db/Db Mice. BMC Gastroenterol. 2014, 14, 212. [Google Scholar] [CrossRef] [PubMed]
  58. Pasquariello, R.; Verdile, N.; Pavlovic, R.; Panseri, S.; Schirmer, K.; Brevini, T.A.L.; Gandolfi, F. New Stable Cell Lines Derived from the Proximal and Distal Intestine of Rainbow Trout (Oncorhynchus mykiss) Retain Several Properties Observed In Vivo. Cells 2021, 10, 1555. [Google Scholar] [CrossRef]
  59. Campisi, A.; Sposito, G.; Grasso, R.; Bisicchia, J.; Spatuzza, M.; Raciti, G.; Scordino, A.; Pellitteri, R. Effect of Astaxanthin on Tissue Transglutaminase and Cytoskeletal Protein Expression in Amyloid-Beta Stressed Olfactory Ensheathing Cells: Molecular and Delayed Luminescence Studies. Antioxidants 2023, 12, 750. [Google Scholar] [CrossRef]
Figure 1. Generation and characterization of the porcine intestinal 3D models. (A) pIFs cultured in a 2D standard dish (scale bar 100 µm). (B) pIECs cultured in 2D systems (scale bar 100 µm). (C) Hematoxylin and Eosin staining of the 3D porcine intestinal model (scale bars 100 µm and 10 µm). (D) Picrosirius red staining of the 3D porcine intestinal model (scale bar 100 µm). (E) Gene expression levels of VIM, THY1, VIL1, TJP1, OCLN, and CLDN1 genes in pIFs cultured in 2D systems (grey bars), pIECs cultured in plastic dishes (light grey bars), and 3D intestinal models obtained via co-culturing pIFs and pIECs on Alvetex® scaffold inserts (3D model, sky blue bars). Data are expressed as the means ± the standard error of the means (SEM, n = 9). a,b Different superscripts indicate p < 0.05. (F) TEER values detected in native tissue (in vivo, black bar) and in in vitro 3D intestinal model (3D model, sky blue bar). Data are expressed as the means ± the standard error of the means (SEM, n = 9). (G) The paracellular flux of 4 kDa FITC–dextran was analyzed in apical (blue bar) and basolateral compartments (orange bar). Data are expressed as the means ± the standard error of the means (SEM, n = 9). a,b Different superscripts indicate p < 0.05.
Ijms 25 05966 g001
Figure 2. Generation and characterization of the rainbow trout 3D intestinal models. (A) RTFs cultured in 2D standard dishes (scale bar 100 µm). (B) RTpi-MI cells cultured in 2D systems (scale bar 100 µm). (C) Hematoxylin and eosin staining of the 3D rainbow trout intestinal model (scale bars 100 µm and 10 µm). (D) Picrosirius red staining of the 3D rainbow trout intestinal model (scale bar 100 µm). (E) Gene expression levels of vim, vil1, tjp1, cdh1, and cldn3 genes in RTFs cultured in 2D systems (violet bars), RTpi-MI cells cultured in plastic dishes (light grey bars), and 3D intestinal models obtained via co-culturing RTFs and RTpi-MI cells on Alvetex® scaffold inserts (green bars). Data are expressed as the means ± the standard error of the means (SEM, n = 9). a,b Different superscripts indicate p < 0.05. (F) TEER values detected in native tissue (in vivo, black bar) and in in vitro 3D intestinal model (3D model, green bar). Data are expressed as the means ± the standard error of the means (SEM, n = 9). (G) The paracellular flux of 4 kDa dextran was analyzed in the apical (blue bar) and basolateral compartment (orange bar). Data are expressed as the means ± the standard error of the means (SEM, n = 9). a,b Different superscripts indicate p < 0.05.
Ijms 25 05966 g002
Figure 3. Gene expression of antioxidant (GPX1 and NQO1) and inflammatory-related genes (IL1β, IL6, and IL8) in porcine intestinal models after different concentrations of AST exposure for 24 h. Data are expressed as the means ± the standard error of the means (SEM, n = 9). a–c Different superscripts indicate p < 0.05.
Ijms 25 05966 g003
Figure 4. Gene expression of antioxidant (gpx1 and nqo1) and inflammatory-related genes (il1β, il6, and il8) in rainbow trout intestinal models after different concentrations of AST exposure for 24 h. Data are expressed as the means ± the standard error of the means (SEM, n = 9). a–c Different superscripts indicate p < 0.05.
Ijms 25 05966 g004
Table 1. List of primers used for quantitative PCR analysis.
GeneDescriptionCat.N./Accession No.Species
ACTBActin, betaSs06827219_s1Porcine
CLDN1Claudin 1Ss03375708_u1Porcine
GAPDHGlyceraldehyde-3-phosphate dehydrogenaseSs03373052_u1Porcine
GPX1Glutathione peroxidase 1Ss03383336_u1Porcine
IL1βInterleukin 1, betaSs03821899_s1Porcine
IL6Interleukin 6Ss03394904_g1Porcine
IL8Interleukin 8Ss03392437_m1Porcine
NADPH1NAD(P)H quinone dehydrogenase 1Ss04246167_m1Porcine
OCLNOccludinSs06867496_m1Porcine
THY1Thy-1 cell surface antigenSs03376963_u1Porcine
TJP1Zonula Occludens 1Ss03373514_m1Porcine
VIL1Villin 1Ss06886976_m1Porcine
VIMVimentinSs04330801_gHPorcine
actbActinNM_001124235Rainbow Trout
ef1Elongation factor 1NM_001124339.1Rainbow Trout
vil1Villin 1XM_021579239Rainbow Trout
tjp1Zonula Occludens 1XM_021607172.1Rainbow Trout
cldn3Claudin 3XM_021587920Rainbow Trout
cdh1e-CadherinXM_021607117Rainbow Trout
gpx1Glutathione peroxidase 1NM_001124525.1Rainbow Trout
nadph1NAD(P)H quinone dehydrogenase 1XM_021561062.2Rainbow Trout
il1βInterleukin 1, betaXM_036979104.1Rainbow Trout
il6Interleukin 6NM_001124657.1Rainbow Trout
il8Interleukin 8NM_001124362.1Rainbow Trout
Disclaimer/Publisher’s Note: The statements, opinions and data contained in all publications are solely those of the individual author(s) and contributor(s) and not of MDPI and/or the editor(s). MDPI and/or the editor(s) disclaim responsibility for any injury to people or property resulting from any ideas, methods, instructions or products referred to in the content.

