Abstract
Lewy body diseases (LBDs) feature α-synuclein (α-syn)-containing Lewy bodies, with misfolded α-syn potentially propagating as seeds. Using a seeding amplification assay, we previously reported distinct α-syn seeding in LBD cases based on the area under seeding curves. This study revealed that LBD cases showing different α-syn seeding kinetics have distinct proteomics profiles, emphasizing disruptions in mitochondria and lipid metabolism in high-seeder cases. Though the mechanisms underlying LBD development are intricate, the factors influencing α-syn seeding activity remain elusive. To address this and complement our previous findings, we conducted targeted transcriptome analyses in the substantia nigra using the nanoString nCounter assay together with histopathological evaluations in high (n = 4) and low (n = 3) nigral α-syn seeders. Neuropathological findings (particularly the substantia nigra) were consistent between these groups and were characterized by neocortical LBD associated with Alzheimer’s disease neuropathologic change. Among the 1811 genes assessed, we identified the top 20 upregulated and downregulated genes and pathways in α-syn high seeders compared with low seeders. Notably, alterations were observed in genes and pathways related to transmembrane transporters, lipid metabolism, and the ubiquitin–proteasome system in the high α-syn seeders. In conclusion, our findings suggest that the molecular behavior of α-syn is the driving force in the neurodegenerative process affecting the substantia nigra through these identified pathways. These insights highlight their potential as therapeutic targets for attenuating LBD progression.
1. Introduction
Lewy body diseases (LBDs) are characterized by the presence of Lewy bodies (LBs), primarily composed of misfolded α-synuclein (α-syn), distributed extensively in the central and peripheral nervous systems [1,2,3,4]. The distribution of LBs defines various LBD phenotypes, including Parkinson’s disease (PD), PD with dementia (PDD), and dementia with Lewy bodies (DLBs) [1,2,3,4]. Clinical and pathological heterogeneities in LBD are believed to stem from molecular diversities (strains or polymorphs) of α-syn [2,4,5]. α-Syn exists in a natively unfolded monomeric form or a membrane-bound α-helical tetramer, with an amyloidogenic nature [2,4,5]. A conformational change, termed misfolding, induces the formation of aggregation nuclei, termed seeds, which self-propagate and spread between brain regions via cell-to-cell transmission mechanisms [2,4,5,6].
The seeding amplification assay (SAA) is a protein kinetics assay that has been widely employed to study the seeding activity of various amyloidogenic and disease-associated proteins, including α-syn. Elevated seeding activity likely plays a significant role in the propagation of misfolded α-syn [7]. We recently investigated α-syn seeding activity in synucleinopathies [8,9]. We categorized LBD patients as high, intermediate, or low seeders based on their α-syn seeding kinetics, demonstrating the influence of distinctly different α-syn kinetics on LBD clinical subtypes [8]. Proteomic analysis further indicated notable enrichment in membrane structure and significant disruptions in mitochondria and lipid metabolism in α-syn high seeders compared with low seeders [8]. A multifactorial mechanism involving dysfunction with membrane and intracellular trafficking, mitochondria, ubiquitin–proteasome system (UPS), autophagy–lysosomal pathway (ALP), lipid and vitamin metabolism, cytosolic Ca2+, axonal transport, synaptic transmission, neuroinflammation, post-translational protein modification, chromatin remodeling and apoptosis, the Wnt signaling pathway, and the Notch signaling pathway has been proposed for the development of LBD [10,11,12,13,14,15,16,17,18,19,20]. However, the factors influencing, and pathways associated with α-syn seeding activity remain elusive. To comprehensively understand the molecular signatures and mechanisms associated with α-syn seeding activity, we combined neuropathologic assessment and nanoString nCounter technology to investigate transcriptomic expression differences between α-syn high and low seeders in the substantia nigra (SN) in LBD.
2. Results
2.1. Definition of High and Low α-Syn Seeders
As we previously documented [8], neuropathological evaluation is not enough for classifying α-syn molecular behavior. In this study, we classified patients as high and low α-syn seeders by evaluating the area under the curve obtained after testing, using α-syn SAA, a cohort of 32 LBD patients using protein homogenates derived from the SN of these patients [8]. For this study, we selected four of the cases exhibiting the highest AUC values (that were designated as high seeders), while the three cases with the lowest AUC values were categorized as low seeders.
2.2. Demographics of Patients
The age at death, sex, disease duration, post-mortem interval, Braak LBD stage, and DV200 showed no significant differences between α-syn high and low seeders (Table 1).

Table 1.
Demographic data and neuropathological assessments of the cohort.
2.3. Neuropathological Findings
Consistent with our previous findings [8], semiquantitative neuropathologic scores for neuronal loss, α-syn, tau, and Aβ pathologies in the SN did not distinguish between α-syn high and low seeders in unsupervised cluster analysis (Figure 1A). The representative figures are provided in Supplementary Figure S1. Similarly, semiquantitative α-syn scores across the brain, Braak LBD stages, Thal Aβ phases, and Braak NFT stages did not distinguish cases between α-syn high and low seeders (Figure 1B). As we reported previously [9], the 5G4 α-syn antibody revealed more α-syn pathology compared to the phosphorylated-α-syn antibody. However, the clustering pattern remained consistent with both antibodies.
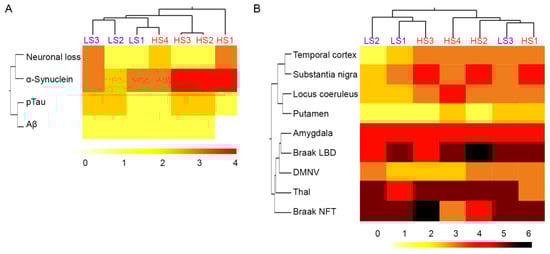
Figure 1.
Cluster analysis of neuropathologic scores between α-synuclein high and low seeders. Neuropathologic scores of neuronal loss, α-synuclein, phosphorylated tau, and Aβ in the substantia nigra (A). α-Synuclein semiquantitative scores across the brain, Braak NFT and LBD stages, and Thal phases (B). The darker color represents the higher semiquantitative scores. Abbreviations: Aβ: amyloid beta; DMNV: dorsal motor nucleus of the vagus; HS: high seeder; LS: low seeder; NFT: neurofibrillary tangle; pTau: phosphorylated tau.
2.4. RNA Quality
The DV200 values, assessing the proportion of fragments exceeding 200 nucleotides and recognized as a crucial indicator of RNA quality, consistently surpassed the 66.1% threshold established by Nagakubo et al. [21] across all our samples (Table 1). Moreover, the nSolver software (version 4, nanoString Technologies Inc., Seattle, WA, USA) did not flag any samples for suboptimal quality. These findings confirm the adequacy of RNA quality in our study samples. Genes with counts below the background level were filtered out using the nCounter Advanced Analysis software (version 2, nanoString Technologies Inc.), leaving 1811 genes for subsequent analysis (Supplementary Table S1).
2.5. Gene Expression Analysis
Unsupervised cluster analysis of the expression level of 1811 genes in the SN did not differentiate between the α-syn high and low seeders (Figure 2A). Although none of the genes exhibited an adjusted p-value < 0.05 for comparison between high and low seeder groups, 223 genes had an unadjusted p-value < 0.05 from the set of 1811 (Figure 2B). Heatmaps depicting the top 20 upregulated and downregulated genes in high seeders versus low seeders are presented in Figure 3A (upregulated genes) and Figure 3B (downregulated genes), with detailed lists in Table 2 (upregulated genes) and Table 3 (downregulated genes). Among the top 20 upregulated genes, 5 are related to membrane functions: SCAMP2, RYR3, UGT8, ADRA2A, and ADAM10. Additionally, two genes, ATM and UGT8, are associated with lipid metabolism. In the top 20 downregulated genes, 6 are linked to membrane activities: CCL2, COL6A1, CLSTN1, PIK3R2, ATP9A, and ATF2. ATF2 is further implicated in lipid metabolism, while another gene, PSMC1, is specifically linked to the UPS. SNCA (synuclein alpha) exhibited downregulation in high seeders compared to low seeders (fold change −1.3, p = 0.0015). Transcripts associated with dopaminergic neurons such as TH (Tyrosine hydrolase, fold change −4.33, p = 0.265), SLC6A3 (sodium-dependent dopamine transporter, fold change −0.849), and NR4A2 (nuclear receptor related 1, fold change −0.375, p = 0.61), showed downregulation in high seeders. On the contrary, transcripts related to glial activation, including S100B (fold change 1.29, p = 0.013), GFAP (fold change 0.252, p = 0.537), and ALDH1L1 (fold change 0.648, p = 0.537), were upregulated in high seeders.

Figure 2.
Heatmap, cluster analysis (A), and volcano plot (B) of the genes studied. Purple represents upregulated and green demonstrates downregulated genes in α-syn high seeders with unadjusted p-value < 0.05. Abbreviations: HS: high seeder; LS: low seeder.
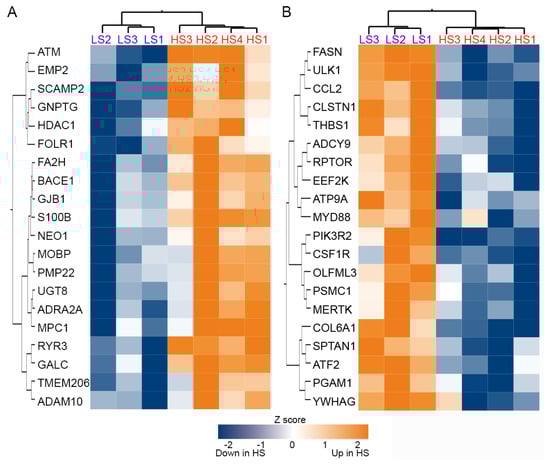
Figure 3.
Heatmap and cluster analysis of the top 20 upregulated (A) and downregulated (B) genes in α-syn high seeders compared with low seeders. Abbreviations: HS: high seeder; LS: low seeder.
Table 2.
Top 20 upregulated genes in α-syn high seeders.
Table 3.
Top 20 downregulated genes in α-syn high seeders.
We then proceeded for gene set enrichment analysis (GSEA) and compared high with low seeders. This analysis highlighted 112 pathways with an adjusted p-value < 0.05 out of 3819 pathways in the C5 gene set. The leading 20 upregulated and downregulated pathways from the GSEA are depicted in Figure 4. Among the altered pathways in α-syn high seeders, four transmembrane transporter activity pathways were upregulated and seven were downregulated (Figure 4). Notably, a pathway related to mitochondrial membrane permeability regulation was significantly enhanced in α-syn high seeders. Additionally, four lipid metabolism pathways were upregulated, while three ubiquitination-related pathways showed downregulation in these seeders. Comprehensive pathway details, including p-values, NES, size, and leading-edge genes, are provided in Supplementary Table S2.

Figure 4.
GSEA of the top 20 upregulated (upper part of the gene list) and downregulated (lower part of the gene list) pathways in α-syn high seeders compared with low seeders. Red represents transmembrane transporter activity, green demonstrates lipid metabolism, orange exhibits ubiquitin proteasome system pathways, and blue indicates other pathways. Abbreviation: BP: biological process; CC: cellular component; GO: gene ontology; HS: high seeder; MF: molecular function.
3. Discussion
This study revealed the association of molecular behavior of α-syn in the SN with membrane transports, lipid metabolism, and ubiquitin–proteasome system in LBD.
Using nanoString nCounter technology, we analyzed 1811 mRNAs, which facilitates direct mRNA expression measurement with a small sample across numerous genes without necessitating cDNA conversion or polymerase chain reaction [22]. While no individual genes demonstrated an adjusted p-value < 0.05, we identified the top 20 upregulated and downregulated genes and pathways when comparing α-syn high seeders versus low seeders in the SN.
Accumulated evidence suggests that misfolded α-syn interferes with vital cellular function and overwhelms the cellular protein degradation system. In our previous studies, we observed a marked enrichment of proteins associated with organelle inner and outer membranes, as well as components of the extrinsic membrane in the SN exhibiting high α-syn seeding activity [8]. Consistent with this observation, the most markedly differentially expressed genes and pathways in the current study were associated with transmembrane transporters. Specifically, among the top 20 upregulated genes and pathways, five genes and four pathways associated with transmembrane transports were upregulated. In contrast, six genes and seven pathways linked to transmembrane transports were downregulated in α-syn high seeders relative to their low-seeding counterparts. Although it remains to be fully determined how α-syn crosses the cellular and organelle membranes, several possibilities have been postulated such as direct penetration [23], annular pore-like structures [24], tunneling-nanotubes [25], and endocytosis [26]. Membranes, acting as barriers, regulate solute concentrations in adjacent aqueous compartments inside and outside [27]. Transmembrane transport is controlled by complex interactions between membrane lipids, proteins, and carbohydrates [27]. The basic types of membrane transport are simple passive diffusion (by channels and carriers) and active transport [27]. Passive diffusion requires no additional energy source while active transport requires additional energy, often in the form of ATP [27]. ATP13A2 (PARK9), a gene associated with a levodopa responsive form of parkinsonism, that is a member of the p-type ATPase transporter, involves α-syn externalization through exosomes [28,29]. Our study revealed three upregulated pathways associated with ATPase-coupled transmembrane transporters, suggesting a potential role in heightened α-syn externalization in α-syn high seeders.
Transmembrane transports also encompass both endocytosis and exocytosis [27]. These membrane trafficking mechanisms have received considerable attention owing to their potential roles as initiators or enhancers of the neurodegenerative processes leading to LBD [30]. α-Syn is a membrane-binding protein with a number of possible normal functions including control of synaptic membrane processes and biogenesis, regulation of neurotransmitter release, and synaptic plasticity [31,32,33,34,35,36]. However, overexpression of wild-type and mutated α-syn [35,37], oligomeric α-syn [34], and small (less than 200 nm) non-fibrillar α-syn [38] can cause loss of membrane integrity, thinning the membrane and/or the formation of pores in the cell membrane, leading to uncontrolled diffusion of molecules in and out of the cell [35]. Additionally, membrane thinning has been observed in other amyloidogenic proteins including Aβ [39]. Based on these observations, we postulate that disturbances in membrane homeostasis facilitate the mobility of α-syn, leading to increased propagation activity. Such mechanisms could potentially enhance the seeding activity of α-syn.
Two genes and four pathways associated with lipid metabolism and a pathway with mitochondrial membrane permeability were significantly upregulated in α-syn high seeders, consistent with our previous proteomics report [8]. Another study also highlighted the overexpression of the fatty acid beta-oxidation in the nigral proteome of PD [40]. Additionally, significant lipid accumulation has been documented in LBs [3,41,42]. The primary and most recognized role of lipids is in forming the basic structure of cell membranes [43]. The interaction of α-syn with lipid membranes is believed to drive its oligomerization and subsequent aggregation [44,45]. Oligomeric forms or small soluble non-fibrillar aggregates of α-syn can compromise lipid membrane integrity, leading to membrane permeabilization [35,38,46]. Collectively, these insights suggest that enhanced lipid metabolism may promote α-syn aggregation, fostering the formation of more toxic α-syn variants and accelerating α-syn seeding activity.
Moreover, one gene and three pathways linked to the UPS were found to be downregulated in α-syn high seeders. The pivotal role of UPS and the ALP in the neurodegeneration of LBD has been firmly established [12,47,48]. Both UPS and ALP serve as primary intracellular degradation mechanisms, particularly when cells are confronted with misfolded protein aggregates [47,48,49]. Dysfunction in UPS is recurrently implicated across various genetic etiologies of familial PD [47,50]. Notably, both the pale body, an early cytoplasmic alteration preceding LB formation [1,2,3,51], and LBs themselves contain ubiquitinated proteins alongside lysosomes [3,47,51,52]. Our prior proteomics analysis [8] also highlighted disruptions in lysosomal organization within α-syn high seeders. The accumulation of aggregated α-syn can impede ALP function, leading to compromised clearance and further synuclein accumulation [48,49]. A recent cellular model of α-syn propagation underscored that lysosomal membrane rupture facilitates the release and spread of accumulated α-syn [53]. Collectively, these insights indicate that compromised cellular degradation mechanisms in α-syn high seeders may hinder the breakdown of misfolded α-syn, thereby exacerbating its propagation.
In this study, we observed a downregulation of SNCA in high seeders compared to low seeders. Our previous findings [8] indicated that the total amount of nigral α-syn protein in the PBS-soluble fraction, as measured by ELISA, did not exhibit a link to α-syn seeding activity. However, a negative correlation was observed between the levels of aggregated synuclein protein and α-syn seeding activity. The impact of the decreased SNCA on the reduction in aggregated α-syn in high seeders has remained unclear. However, our recent study on neuron-specific SNCA expression showed gradual decrease during the development of Lewy bodies [54]. We speculate that the increased demand of SNCA expression to produce physiological α-syn protein for the seeding of the misfolded α-syn exhausts the mRNA production, which is more prominent in high seeders. Nevertheless, to elucidate the association between the expression levels of α-syn transcript, protein, and seeding activity, further investigation and validation are warranted.
In the present study, transcripts linked to dopaminergic phenotype exhibited downregulation, while those associated with glial activation displayed upregulation in high seeders. These observations imply that dopaminergic neuron loss and glial activation are more pronounced in high seeders compared to their low seeder counterparts in the molecular level.
The fundamental principle of molecular biology underscores that proteins are synthesized from mRNA templates [55]. Therefore, mRNA expression levels typically correlate with protein synthesis [55,56,57,58,59]. However, this correlation of expression levels between mRNA and protein varies widely and is imperfect [55,60], in which targeted proteomics across cell lines and tissues have reported r-values between 0.39 and 0.79 [55,61]. The intricate relationship between mRNA and protein expression remains enigmatic. For example, elevated mRNA levels could either signify enhanced protein expression or, result from a negative feedback mechanism due to reduced protein expression. Consequently, interpreting mRNA levels proves challenging, and it may be prudent to infer that both elevated and reduced mRNA expression levels signify a disturbance in homeostasis from the normal state. However, it is important to emphasize that our transcriptomics observations recapitulate our findings using proteomics [9] supporting the relevance of our findings.
As previously highlighted [8], routine neuropathological assessments did not discern or predict α-syn seeding activity. This emphasizes the potential molecular differences between high and low seeders, especially in light of the consistent neurodegeneration and protein deposits observed across all cases. Hence, transcriptomic and proteomic analyses offer valuable insights into α-syn high seeders’ characteristics.
Several study limitations warrant consideration. First, the sample size was small and underpowered, as indicated by the lack of statistical significance in the adjusted p-values, necessitating validation in larger cohorts. Second, we cannot definitively ascertain whether the observed alterations in the targeted transcriptome precede or result from the presence of distinct α-syn species. Third, the variability in post-mortem intervals among our cases could impact mRNA integrity, given the rapid degradation of mRNAs in human autopsy tissues post-mortem [62]. Nevertheless, the quality of our samples, as indicated by the DV200 values, remained adequate. The nanoString nCounter assay employed in this study can effectively analyze minute RNA quantities, directly enumerating individual RNA transcripts without necessitating additional enzymatic steps, amplification, or cDNA conversion [22]. Fourth, our LBD cases exhibited a confluence of pathologies, with intermediate to high levels of ADNC. It is plausible that concurrent Aβ and/or tau pathologies might influence the molecular profiles observed in our LBD cohort. However, since all cases contained some levels of Aβ and tau in the SN, it is highly plausible that the molecular behavior of α-syn is the major driving force of the transcriptomic and proteomic differences between low and high seeders. Fifth, non-diseased control cases were not included in our study. However, the primary objective of this investigation is to clarify the association between the molecular behavior of α-syn and transcriptomic changes in high and low seeders. While a large number of studies have previously explored differences between LBD and normal controls [10,11,12,13,14,15,16,17,18,19,20], the specific distinctions in transcriptomics related to seeding activity have not been reported.
4. Materials and Methods
4.1. Materials
We collected frozen brain tissues and 4 μm thick formalin-fixed paraffin-embedded sections from the University Health Network-Neurodegenerative Brain Collection (Toronto, ON, Canada) with confirmed neuropathological diagnoses. We carefully selected age, sex, seeding activity, and mixed pathology matched 7 LBD cases with our previously reported proteomics analysis [8], with 4 high α-syn seeders (HS 1—4) and 3 low seeders (LS 1—3). One high seeder (HS 1) and 2 low seeders (LS 2, 3) were included in our previous proteomics analysis [8]. Details on age at death, sex, disease duration, post-mortem intervals, and neuropathological examination are outlined in Table 1. This study received approval from the University Health Network Research Ethics Board and the University of Toronto (Nr. 20-5258 and 39459).
4.2. α-Syn SAA
α-Syn SAA was performed to investigate the seeding capacity of the misfolded α-syn present in the SN. This assay was conducted in 32 cases of neuropathologically confirmed LBD cases, as previously reported [8].
4.3. Neuropathologic Analysis
Routine histological examination and immunohistochemistry (IHC) were performed on 4 μm formalin-fixed paraffin-embedded tissue sections, using the following antibodies: Aβ (6F/3D, 1:50, Dako, Glostrup, Denmark), phosphorylated-tau (AT8, 1:1000, Thermo Fischer, Waltham, MA, USA), disease-associated α-syn (5G4, 1:4000, Analytikjena, Jena, Germany), and phosphorylated α-syn (clone #64, 1:10,000, FUJIFILIM Wako Pure Chemical Corporation, Osaka, Japan). Antigen retrieval was carried out using Dako PT Link with a low pH solution, except for the anti-Aβ antibody. For the anti-Aβ antibody, where 80% formic acid was applied for 1 h, and for the 5G4 antibody, it was applied for 5 min. According to the manufacturer’s protocol, immunostaining was performed using Dako Autostainer Link 48 and EnVision FLEX+ Visualization System. Subsequently, all sections were counterstained with hematoxylin. All cases had a standard neuropathological assessment based on the current consensus criteria including Braak LBD stage [63], Lewy pathology consensus criteria [64], and National Institute of Aging-Alzheimer’s Association (NIA-AA) Alzheimer’s disease neuropathological change (ADNC) [65,66,67]. In addition to the staging system described above, we evaluated the severity of neuronal loss, Lewy pathology, tau pathology, and Aβ plaques using a semi-quantitative five-point scoring system: Score 0 indicated no pathology, Score 1 denoted minimal, Score 2 reflected mild, Score 3 implied moderate, and Score 4 signified severe [68,69,70].
4.4. RNA Extraction
Frozen human brain tissue of the SN was micro-dissected as previously described [8,9,71]. The brain tissue was subjected to dissociation using the gentleMACS Octo Dissociator (Miltenyi Biotec, Bergisch Gladbach, Germany), after which RNA extraction was carried out utilizing the Qiagen Lipid Tissue Mini Kit (Qiagen, Venlo, The Netherlands), as directed by the manufacturer’s protocol. Sample concentration, purity, RNA quality, and fragmentation were assessed using the Nanodrop ND-1000 Spectrophotometer (ThermoFisher) and Bioanalyzer (2100 BioA, Agilent, Santa Clara, CA, USA), respectively. For gene expression analysis, 100 ng of RNA was utilized from each sample. Gene expression profiling employed nanoString nCounter panels (nanoString Technologies Inc.) covering neuropathology, neuroinflammation, glial profiling, and metabolic pathways.
4.5. Data Analysis and Statistics
The mRNA count data were normalized by the default settings of nSolver Analysis software. Subsequent analysis for fold changes and p-values, comparing gene expression in α-syn high seeders to low seeders, was conducted using the nCounter Advanced Analysis software. Pathway analysis utilized the RStudio package (version 2023.12.0+369) [72], incorporating the C5 ontology gene sets from the Human Molecular Signatures Database v2023.2.Hs [73,74]. Welch’s t-test, based on gene expression Z-scores, was applied to the high and low seeder groups. Genes were ranked according to the t-statistic. Gene set enrichment analysis employed the fgsea package (version 1.26.0) [75], with results sorted by the normalized enrichment score (NES). Neuropathology and transcriptomic data underwent cluster analysis using JMP 14.3 software (JMP Statistical Discovery LLC, Cary, NC, USA). Visualizations for gene analyses were generated using Graphpad Prism (v.10, Graphpad Software Inc., San Diego, CA, USA), JMP, and ggplot2 package in R (version 3.4.4) [76]. Fisher’s exact test or Mann–Whitney U test was applied to compare the demographic data between α-syn high and low seeders using SPSS software (v25, IBM, Chicago, IL, USA). To address multiple comparisons, the Benjamini–Hochberg method adjusted p-values to estimate false discovery rates in gene expression data. A significance threshold of p < 0.05 was applied using a two-tailed test.
5. Conclusions
In conclusion, our findings elucidate the intricate molecular signatures associated with α-syn high seeders. We emphasize the disruptions in membrane transporters, lipid metabolism, and the UPS as potential contributors to enhanced α-syn seeding activity. This study presents a novel perspective proposing that strategies aimed at modulating these pathways could progress innovative future precision medicine for patients with LBD, a complex and heterogeneous disease, stratified based on the distinct molecular behavior of α-syn.
Supplementary Materials
The following supporting information can be downloaded at: https://www.mdpi.com/article/10.3390/ijms25052676/s1.
Author Contributions
Conceptualization, T.K., S.L., I.M.-V. and G.G.K.; methodology, T.K., S.L., I.M.-V. and G.G.K.; formal analysis, T.K., K.Y. and S.T.; resources, S.L., I.M.-V. and G.G.K.; writing—original draft preparation, T.K.; writing—review and editing, S.L., I.M.-V., T.K., S.T., A.E.L. and G.G.K.; supervision, A.E.L. and G.G.K.; funding acquisition, A.E.L. and G.G.K. All authors have read and agreed to the published version of the manuscript.
Funding
This study was funded by the Rossy Family Foundation, Edmond J. Safra Philanthropic Foundation, Canada Foundation for Innovation John Evans Leaders Fund program (Award Number 40480), and Ontario Research Fund.
Institutional Review Board Statement
The study was conducted in accordance with the Declaration of Helsinki, and approved by the University Health Network (UHN) Research Ethics Board (Nr. 20-5258) and the University of Toronto (Nr. 39459).
Informed Consent Statement
Informed consent was obtained from all subjects participating in the study, either from the patients or from their next of kin.
Data Availability Statement
The datasets used and analyzed during the current study are available from the corresponding author upon reasonable request.
Acknowledgments
The authors particularly acknowledge the patients and their families for their donations.
Conflicts of Interest
G.G.K. holds a shared patent for the 5G4 α-syn antibody. All other authors declare that they have no competing interests regarding this study.
References
- Kon, T.; Tomiyama, M.; Wakabayashi, K. Neuropathology of Lewy body disease: Clinicopathological crosstalk between typical and atypical cases. Neuropathology 2020, 40, 30–39. [Google Scholar] [CrossRef] [PubMed]
- Goedert, M.; Spillantini, M.G.; Del Tredici, K.; Braak, H. 100 years of Lewy pathology. Nat. Rev. Neurol. 2013, 9, 13–24. [Google Scholar] [CrossRef] [PubMed]
- Wakabayashi, K.; Tanji, K.; Mori, F.; Takahashi, H. The Lewy body in Parkinson’s disease: Molecules implicated in the formation and degradation of alpha-synuclein aggregates. Neuropathology 2007, 27, 494–506. [Google Scholar] [CrossRef] [PubMed]
- Holec, S.A.M.; Liu, S.L.; Woerman, A.L. Consequences of variability in alpha-synuclein fibril structure on strain biology. Acta Neuropathol. 2022, 143, 311–330. [Google Scholar] [CrossRef] [PubMed]
- Van der Perren, A.; Gelders, G.; Fenyi, A.; Bousset, L.; Brito, F.; Peelaerts, W.; Van den Haute, C.; Gentleman, S.; Melki, R.; Baekelandt, V. The structural differences between patient-derived alpha-synuclein strains dictate characteristics of Parkinson’s disease, multiple system atrophy and dementia with Lewy bodies. Acta Neuropathol. 2020, 139, 977–1000. [Google Scholar] [CrossRef] [PubMed]
- Luk, K.C.; Kehm, V.; Carroll, J.; Zhang, B.; O’Brien, P.; Trojanowski, J.Q.; Lee, V.M. Pathological alpha-synuclein transmission initiates Parkinson-like neurodegeneration in nontransgenic mice. Science 2012, 338, 949–953. [Google Scholar] [CrossRef] [PubMed]
- Peng, C.; Trojanowski, J.Q.; Lee, V.M. Protein transmission in neurodegenerative disease. Nat. Rev. Neurol. 2020, 16, 199–212. [Google Scholar] [CrossRef] [PubMed]
- Martinez-Valbuena, I.; Swinkin, E.; Santamaria, E.; Fernandez-Irigoyen, J.; Sackmann, V.; Kim, A.; Li, J.; Gonzalez-Latapi, P.; Kuhlman, G.; Bhowmick, S.S.; et al. alpha-Synuclein molecular behavior and nigral proteomic profiling distinguish subtypes of Lewy body disorders. Acta Neuropathol. 2022, 144, 167–185. [Google Scholar] [CrossRef]
- Martinez-Valbuena, I.; Visanji, N.P.; Kim, A.; Lau, H.H.C.; So, R.W.L.; Alshimemeri, S.; Gao, A.; Seidman, M.A.; Luquin, M.R.; Watts, J.C.; et al. Alpha-synuclein seeding shows a wide heterogeneity in multiple system atrophy. Transl. Neurodegener. 2022, 11, 7. [Google Scholar] [CrossRef]
- Borrageiro, G.; Haylett, W.; Seedat, S.; Kuivaniemi, H.; Bardien, S. A review of genome-wide transcriptomics studies in Parkinson’s disease. Eur. J. Neurosci. 2018, 47, 1–16. [Google Scholar] [CrossRef]
- Rocha, E.M.; De Miranda, B.; Sanders, L.H. Alpha-synuclein: Pathology, mitochondrial dysfunction and neuroinflammation in Parkinson’s disease. Neurobiol. Dis. 2018, 109, 249–257. [Google Scholar] [CrossRef]
- Chowdhury, A.; Rajkumar, A.P. Systematic review of gene expression studies in people with Lewy body dementia. Acta Neuropsychiatr. 2020, 32, 281–292. [Google Scholar] [CrossRef] [PubMed]
- Grunblatt, E.; Mandel, S.; Jacob-Hirsch, J.; Zeligson, S.; Amariglo, N.; Rechavi, G.; Li, J.; Ravid, R.; Roggendorf, W.; Riederer, P.; et al. Gene expression profiling of parkinsonian substantia nigra pars compacta; alterations in ubiquitin-proteasome, heat shock protein, iron and oxidative stress regulated proteins, cell adhesion/cellular matrix and vesicle trafficking genes. J. Neural. Transm. 2004, 111, 1543–1573. [Google Scholar] [CrossRef] [PubMed]
- Stamper, C.; Siegel, A.; Liang, W.S.; Pearson, J.V.; Stephan, D.A.; Shill, H.; Connor, D.; Caviness, J.N.; Sabbagh, M.; Beach, T.G.; et al. Neuronal gene expression correlates of Parkinson’s disease with dementia. Mov. Disord. 2008, 23, 1588–1595. [Google Scholar] [CrossRef] [PubMed]
- Garcia-Esparcia, P.; Lopez-Gonzalez, I.; Grau-Rivera, O.; Garcia-Garrido, M.F.; Konetti, A.; Llorens, F.; Zafar, S.; Carmona, M.; Del Rio, J.A.; Zerr, I.; et al. Dementia with Lewy Bodies: Molecular Pathology in the Frontal Cortex in Typical and Rapidly Progressive Forms. Front. Neurol. 2017, 8, 89. [Google Scholar] [CrossRef] [PubMed]
- Santpere, G.; Garcia-Esparcia, P.; Andres-Benito, P.; Lorente-Galdos, B.; Navarro, A.; Ferrer, I. Transcriptional network analysis in frontal cortex in Lewy body diseases with focus on dementia with Lewy bodies. Brain Pathol. 2018, 28, 315–333. [Google Scholar] [CrossRef] [PubMed]
- Rajkumar, A.P.; Bidkhori, G.; Shoaie, S.; Clarke, E.; Morrin, H.; Hye, A.; Williams, G.; Ballard, C.; Francis, P.; Aarsland, D. Postmortem Cortical Transcriptomics of Lewy Body Dementia Reveal Mitochondrial Dysfunction and Lack of Neuroinflammation. Am. J. Geriatr. Psychiatry 2020, 28, 75–86. [Google Scholar] [CrossRef]
- Bandres-Ciga, S.; Saez-Atienzar, S.; Kim, J.J.; Makarious, M.B.; Faghri, F.; Diez-Fairen, M.; Iwaki, H.; Leonard, H.; Botia, J.; Ryten, M.; et al. Large-scale pathway specific polygenic risk and transcriptomic community network analysis identifies novel functional pathways in Parkinson disease. Acta Neuropathol. 2020, 140, 341–358. [Google Scholar] [CrossRef] [PubMed]
- Dong, B.H.; Niu, Z.Q.; Zhang, J.T.; Zhou, Y.J.; Meng, F.M.; Dong, A.Q. Complementary Transcriptomic and Proteomic Analysis in the Substantia Nigra of Parkinson’s Disease. Dis. Markers 2021, 2021, 2148820. [Google Scholar] [CrossRef]
- Wang, J.; Wu, X.; Tu, Y.; Dang, J.; Cai, Z.; Liao, W.; Quan, W.; Wei, Y. An integrated analysis of lncRNA and mRNA expression profiles in the kidneys of mice with lupus nephritis. PeerJ 2021, 9, e10668. [Google Scholar] [CrossRef]
- Nagakubo, Y.; Hirotsu, Y.; Amemiya, K.; Mochizuki, H.; Tsutsui, T.; Kakizaki, Y.; Miyashita, Y.; Higuchi, R.; Nakagomi, T.; Goto, T.; et al. Nucleic Acid Quality Assessment is Critical to the Success of the Oncomine Dx Target Test for Lung Cancer. Mol. Diagn. Ther. 2023, 27, 513–523. [Google Scholar] [CrossRef]
- Geiss, G.K.; Bumgarner, R.E.; Birditt, B.; Dahl, T.; Dowidar, N.; Dunaway, D.L.; Fell, H.P.; Ferree, S.; George, R.D.; Grogan, T.; et al. Direct multiplexed measurement of gene expression with color-coded probe pairs. Nat. Biotechnol. 2008, 26, 317–325. [Google Scholar] [CrossRef]
- Ahn, K.J.; Paik, S.R.; Chung, K.C.; Kim, J. Amino acid sequence motifs and mechanistic features of the membrane translocation of alpha-synuclein. J. Neurochem. 2006, 97, 265–279. [Google Scholar] [CrossRef]
- Volles, M.J.; Lansbury, P.T., Jr. Vesicle permeabilization by protofibrillar alpha-synuclein is sensitive to Parkinson’s disease-linked mutations and occurs by a pore-like mechanism. Biochemistry 2002, 41, 4595–4602. [Google Scholar] [CrossRef]
- Abounit, S.; Bousset, L.; Loria, F.; Zhu, S.; de Chaumont, F.; Pieri, L.; Olivo-Marin, J.C.; Melki, R.; Zurzolo, C. Tunneling nanotubes spread fibrillar alpha-synuclein by intercellular trafficking of lysosomes. EMBO J. 2016, 35, 2120–2138. [Google Scholar] [CrossRef]
- Hivare, P.; Gadhavi, J.; Bhatia, D.; Gupta, S. alpha-Synuclein fibrils explore actin-mediated macropinocytosis for cellular entry into model neuroblastoma neurons. Traffic 2022, 23, 391–410. [Google Scholar] [CrossRef] [PubMed]
- Stillwell, W. Membrane Transport. In An Introduction to Biological Membranes: Composition, Structure and Function, 2nd ed.; Elsevier: Amsterdam, The Netherlands, 2016; pp. 423–451. [Google Scholar]
- Kong, S.M.; Chan, B.K.; Park, J.S.; Hill, K.J.; Aitken, J.B.; Cottle, L.; Farghaian, H.; Cole, A.R.; Lay, P.A.; Sue, C.M.; et al. Parkinson’s disease-linked human PARK9/ATP13A2 maintains zinc homeostasis and promotes alpha-Synuclein externalization via exosomes. Hum. Mol. Genet. 2014, 23, 2816–2833. [Google Scholar] [CrossRef] [PubMed]
- Si, J.; Van den Haute, C.; Lobbestael, E.; Martin, S.; van Veen, S.; Vangheluwe, P.; Baekelandt, V. ATP13A2 Regulates Cellular alpha-Synuclein Multimerization, Membrane Association, and Externalization. Int. J. Mol. Sci. 2021, 22, 2689. [Google Scholar] [CrossRef] [PubMed]
- Hasegawa, T.; Sugeno, N.; Kikuchi, A.; Baba, T.; Aoki, M. Membrane Trafficking Illuminates a Path to Parkinson’s Disease. Tohoku J. Exp. Med. 2017, 242, 63–76. [Google Scholar] [CrossRef] [PubMed][Green Version]
- Iwai, A.; Masliah, E.; Yoshimoto, M.; Ge, N.; Flanagan, L.; de Silva, H.A.; Kittel, A.; Saitoh, T. The precursor protein of non-A beta component of Alzheimer’s disease amyloid is a presynaptic protein of the central nervous system. Neuron 1995, 14, 467–475. [Google Scholar] [CrossRef] [PubMed]
- Bartels, T.; Choi, J.G.; Selkoe, D.J. alpha-Synuclein occurs physiologically as a helically folded tetramer that resists aggregation. Nature 2011, 477, 107–110. [Google Scholar] [CrossRef] [PubMed]
- Kahle, P.J.; Neumann, M.; Ozmen, L.; Muller, V.; Jacobsen, H.; Schindzielorz, A.; Okochi, M.; Leimer, U.; van Der Putten, H.; Probst, A.; et al. Subcellular localization of wild-type and Parkinson’s disease-associated mutant alpha -synuclein in human and transgenic mouse brain. J. Neurosci. 2000, 20, 6365–6373. [Google Scholar] [CrossRef] [PubMed]
- Fusco, G.; Chen, S.W.; Williamson, P.T.F.; Cascella, R.; Perni, M.; Jarvis, J.A.; Cecchi, C.; Vendruscolo, M.; Chiti, F.; Cremades, N.; et al. Structural basis of membrane disruption and cellular toxicity by alpha-synuclein oligomers. Science 2017, 358, 1440–1443. [Google Scholar] [CrossRef] [PubMed]
- Reynolds, N.P.; Soragni, A.; Rabe, M.; Verdes, D.; Liverani, E.; Handschin, S.; Riek, R.; Seeger, S. Mechanism of membrane interaction and disruption by alpha-synuclein. J. Am. Chem. Soc. 2011, 133, 19366–19375. [Google Scholar] [CrossRef] [PubMed]
- Bendor, J.T.; Logan, T.P.; Edwards, R.H. The function of alpha-synuclein. Neuron 2013, 79, 1044–1066. [Google Scholar] [CrossRef]
- Volles, M.J.; Lansbury, P.T., Jr. Relationships between the sequence of alpha-synuclein and its membrane affinity, fibrillization propensity, and yeast toxicity. J. Mol. Biol. 2007, 366, 1510–1522. [Google Scholar] [CrossRef]
- Emin, D.; Zhang, Y.P.; Lobanova, E.; Miller, A.; Li, X.; Xia, Z.; Dakin, H.; Sideris, D.I.; Lam, J.Y.L.; Ranasinghe, R.T.; et al. Small soluble alpha-synuclein aggregates are the toxic species in Parkinson’s disease. Nat. Commun. 2022, 13, 5512. [Google Scholar] [CrossRef]
- Valincius, G.; Heinrich, F.; Budvytyte, R.; Vanderah, D.J.; McGillivray, D.J.; Sokolov, Y.; Hall, J.E.; Losche, M. Soluble amyloid beta-oligomers affect dielectric membrane properties by bilayer insertion and domain formation: Implications for cell toxicity. Biophys. J. 2008, 95, 4845–4861. [Google Scholar] [CrossRef]
- Licker, V.; Turck, N.; Kovari, E.; Burkhardt, K.; Cote, M.; Surini-Demiri, M.; Lobrinus, J.A.; Sanchez, J.C.; Burkhard, P.R. Proteomic analysis of human substantia nigra identifies novel candidates involved in Parkinson’s disease pathogenesis. Proteomics 2014, 14, 784–794. [Google Scholar] [CrossRef]
- Araki, K.; Yagi, N.; Ikemoto, Y.; Yagi, H.; Choong, C.J.; Hayakawa, H.; Beck, G.; Sumi, H.; Fujimura, H.; Moriwaki, T.; et al. Synchrotron FTIR micro-spectroscopy for structural analysis of Lewy bodies in the brain of Parkinson’s disease patients. Sci. Rep. 2015, 5, 17625. [Google Scholar] [CrossRef]
- Shahmoradian, S.H.; Lewis, A.J.; Genoud, C.; Hench, J.; Moors, T.E.; Navarro, P.P.; Castano-Diez, D.; Schweighauser, G.; Graff-Meyer, A.; Goldie, K.N.; et al. Lewy pathology in Parkinson’s disease consists of crowded organelles and lipid membranes. Nat. Neurosci. 2019, 22, 1099–1109. [Google Scholar] [CrossRef]
- Cockcroft, S. Mammalian lipids: Structure, synthesis and function. Essays Biochem. 2021, 65, 813–845. [Google Scholar] [CrossRef]
- Killinger, B.A.; Melki, R.; Brundin, P.; Kordower, J.H. Endogenous alpha-synuclein monomers, oligomers and resulting pathology: Let’s talk about the lipids in the room. NPJ Parkinsons Dis. 2019, 5, 23. [Google Scholar] [CrossRef] [PubMed]
- Musteikyte, G.; Jayaram, A.K.; Xu, C.K.; Vendruscolo, M.; Krainer, G.; Knowles, T.P.J. Interactions of alpha-synuclein oligomers with lipid membranes. Biochim. Biophys. Acta Biomembr. 2021, 1863, 183536. [Google Scholar] [CrossRef] [PubMed]
- Galvagnion, C.; Buell, A.K.; Meisl, G.; Michaels, T.C.; Vendruscolo, M.; Knowles, T.P.; Dobson, C.M. Lipid vesicles trigger alpha-synuclein aggregation by stimulating primary nucleation. Nat. Chem. Biol. 2015, 11, 229–234. [Google Scholar] [CrossRef]
- Sahoo, S.; Padhy, A.A.; Kumari, V.; Mishra, P. Role of Ubiquitin-Proteasome and Autophagy-Lysosome Pathways in alpha-Synuclein Aggregate Clearance. Mol. Neurobiol. 2022, 59, 5379–5407. [Google Scholar] [CrossRef]
- Pan, T.; Kondo, S.; Le, W.; Jankovic, J. The role of autophagy-lysosome pathway in neurodegeneration associated with Parkinson’s disease. Brain 2008, 131, 1969–1978. [Google Scholar] [CrossRef]
- Winslow, A.R.; Chen, C.W.; Corrochano, S.; Acevedo-Arozena, A.; Gordon, D.E.; Peden, A.A.; Lichtenberg, M.; Menzies, F.M.; Ravikumar, B.; Imarisio, S.; et al. alpha-Synuclein impairs macroautophagy: Implications for Parkinson’s disease. J. Cell Biol. 2010, 190, 1023–1037. [Google Scholar] [CrossRef]
- Behl, T.; Kumar, S.; Althafar, Z.M.; Sehgal, A.; Singh, S.; Sharma, N.; Sharma, N.; Badavath, V.N.; Yadav, S.; Bhatia, S.; et al. Exploring the Role of Ubiquitin-Proteasome System in Parkinson’s Disease. Mol. Neurobiol. 2022, 59, 4257–4273. [Google Scholar] [CrossRef] [PubMed]
- Kuusisto, E.; Parkkinen, L.; Alafuzoff, I. Morphogenesis of Lewy bodies: Dissimilar incorporation of alpha-synuclein, ubiquitin, and p62. J. Neuropathol. Exp. Neurol. 2003, 62, 1241–1253. [Google Scholar] [CrossRef]
- Hayashida, K.; Oyanagi, S.; Mizutani, Y.; Yokochi, M. An early cytoplasmic change before Lewy body maturation: An ultrastructural study of the substantia nigra from an autopsy case of juvenile parkinsonism. Acta Neuropathol. 1993, 85, 445–448. [Google Scholar] [CrossRef]
- Kakuda, K.; Ikenaka, K.; Kuma, A.; Doi, J.; Aguirre, C.; Wang, N.; Ajiki, T.; Choong, C.J.; Kimura, Y.; Badawy, S.M.M.; et al. Lysophagy protects against propagation of alpha-synuclein aggregation through ruptured lysosomal vesicles. Proc. Natl. Acad. Sci. USA 2024, 121, e2312306120. [Google Scholar] [CrossRef] [PubMed]
- Kon, T.; Forrest, S.L.; Lee, S.; Martinez-Valbuena, I.; Li, J.; Nassir, N.; Uddin, M.J.; Lang, A.E.; Kovacs, G.G. Neuronal SNCA transcription during Lewy body formation. Acta Neuropathol. Commun. 2023, 11, 185. [Google Scholar] [CrossRef] [PubMed]
- Buccitelli, C.; Selbach, M. mRNAs, proteins and the emerging principles of gene expression control. Nat. Rev. Genet. 2020, 21, 630–644. [Google Scholar] [CrossRef]
- Farrer, M.; Kachergus, J.; Forno, L.; Lincoln, S.; Wang, D.S.; Hulihan, M.; Maraganore, D.; Gwinn-Hardy, K.; Wszolek, Z.; Dickson, D.; et al. Comparison of kindreds with parkinsonism and alpha-synuclein genomic multiplications. Ann. Neurol. 2004, 55, 174–179. [Google Scholar] [CrossRef]
- Trabzuni, D.; Wray, S.; Vandrovcova, J.; Ramasamy, A.; Walker, R.; Smith, C.; Luk, C.; Gibbs, J.R.; Dillman, A.; Hernandez, D.G.; et al. MAPT expression and splicing is differentially regulated by brain region: Relation to genotype and implication for tauopathies. Hum. Mol. Genet. 2012, 21, 4094–4103. [Google Scholar] [CrossRef]
- Riederer, P.; Berg, D.; Casadei, N.; Cheng, F.; Classen, J.; Dresel, C.; Jost, W.; Kruger, R.; Muller, T.; Reichmann, H. alpha-Synuclein in Parkinson’s disease: Causal or bystander? J. Neural. Transm. 2019, 126, 815–840. [Google Scholar] [CrossRef] [PubMed]
- Miller, D.W.; Hague, S.M.; Clarimon, J.; Baptista, M.; Gwinn-Hardy, K.; Cookson, M.R.; Singleton, A.B. Alpha-synuclein in blood and brain from familial Parkinson disease with SNCA locus triplication. Neurology 2004, 62, 1835–1838. [Google Scholar] [CrossRef] [PubMed]
- Gry, M.; Rimini, R.; Stromberg, S.; Asplund, A.; Ponten, F.; Uhlen, M.; Nilsson, P. Correlations between RNA and protein expression profiles in 23 human cell lines. BMC Genom. 2009, 10, 365. [Google Scholar] [CrossRef]
- Edfors, F.; Danielsson, F.; Hallstrom, B.M.; Kall, L.; Lundberg, E.; Ponten, F.; Forsstrom, B.; Uhlen, M. Gene-specific correlation of RNA and protein levels in human cells and tissues. Mol. Syst. Biol. 2016, 12, 883. [Google Scholar] [CrossRef]
- Nagy, C.; Maheu, M.; Lopez, J.P.; Vaillancourt, K.; Cruceanu, C.; Gross, J.A.; Arnovitz, M.; Mechawar, N.; Turecki, G. Effects of postmortem interval on biomolecule integrity in the brain. J. Neuropathol. Exp. Neurol. 2015, 74, 459–469. [Google Scholar] [CrossRef] [PubMed]
- Braak, H.; Del Tredici, K.; Rub, U.; de Vos, R.A.; Jansen Steur, E.N.; Braak, E. Staging of brain pathology related to sporadic Parkinson’s disease. Neurobiol. Aging 2003, 24, 197–211. [Google Scholar] [CrossRef] [PubMed]
- Attems, J.; Toledo, J.B.; Walker, L.; Gelpi, E.; Gentleman, S.; Halliday, G.; Hortobagyi, T.; Jellinger, K.; Kovacs, G.G.; Lee, E.B.; et al. Neuropathological consensus criteria for the evaluation of Lewy pathology in post-mortem brains: A multi-centre study. Acta Neuropathol. 2021, 141, 159–172. [Google Scholar] [CrossRef] [PubMed]
- Montine, T.J.; Phelps, C.H.; Beach, T.G.; Bigio, E.H.; Cairns, N.J.; Dickson, D.W.; Duyckaerts, C.; Frosch, M.P.; Masliah, E.; Mirra, S.S.; et al. National Institute on Aging-Alzheimer’s Association guidelines for the neuropathologic assessment of Alzheimer’s disease: A practical approach. Acta Neuropathol. 2012, 123, 1–11. [Google Scholar] [CrossRef] [PubMed]
- Thal, D.R.; Rub, U.; Orantes, M.; Braak, H. Phases of A beta-deposition in the human brain and its relevance for the development of AD. Neurology 2002, 58, 1791–1800. [Google Scholar] [CrossRef] [PubMed]
- Braak, H.; Braak, E. Neuropathological stageing of Alzheimer-related changes. Acta Neuropathol. 1991, 82, 239–259. [Google Scholar] [CrossRef] [PubMed]
- McKeith, I.G.; Dickson, D.W.; Lowe, J.; Emre, M.; O’Brien, J.T.; Feldman, H.; Aarsland, D.; Galvin, J.; Attems, J.; Ballard, C.G.; et al. Diagnosis and management of dementia with Lewy bodies: Third report of the DLB Consortium. Neurology 2005, 65, 1863–1872. [Google Scholar] [CrossRef]
- Ichimata, S.; Yoshida, K.; Visanji, N.P.; Lang, A.E.; Nishida, N.; Kovacs, G.G. Patterns of Mixed Pathologies in Down Syndrome. J. Alzheimers Dis. 2022, 87, 595–607. [Google Scholar] [CrossRef]
- Tanaka, H.; Hird, M.A.; Tang-Wai, D.F.; Kovacs, G.G. Significant contralaterality of temporal-predominant neuroastroglial tauopathy and FTLD-TDP type C presenting with the right temporal variant FTD. J. Neuropathol. Exp. Neurol. 2023, 82, 187–191. [Google Scholar] [CrossRef]
- Lee, S.; Martinez-Valbuena, I.; de Andrea, C.E.; Villalba-Esparza, M.; Ilaalagan, S.; Couto, B.; Visanji, N.P.; Lang, A.E.; Kovacs, G.G. Cell-Specific Dysregulation of Iron and Oxygen Homeostasis as a Novel Pathophysiology in PSP. Ann. Neurol. 2023, 93, 431–445. [Google Scholar] [CrossRef] [PubMed]
- Available online: https://www.rstudio.com/about/rstudio-open-source-packages/ (accessed on 7 December 2023).
- Subramanian, A.; Tamayo, P.; Mootha, V.K.; Mukherjee, S.; Ebert, B.L.; Gillette, M.A.; Paulovich, A.; Pomeroy, S.L.; Golub, T.R.; Lander, E.S.; et al. Gene set enrichment analysis: A knowledge-based approach for interpreting genome-wide expression profiles. Proc. Natl. Acad. Sci. USA 2005, 102, 15545–15550. [Google Scholar] [CrossRef] [PubMed]
- Liberzon, A.; Birger, C.; Thorvaldsdottir, H.; Ghandi, M.; Mesirov, J.P.; Tamayo, P. The Molecular Signatures Database (MSigDB) hallmark gene set collection. Cell Syst. 2015, 1, 417–425. [Google Scholar] [CrossRef] [PubMed]
- Korotkevich, D.; Sukhov, V.; Budin, N.; Shpak, B.; Artyomov, M.N.; Sergushichev, A. Fast gene set enrichment analysis. bioRxiv 2021, 1–29. [Google Scholar] [CrossRef]
- Wickham, H. ggplot2: Elegant Graphics for Data Analysis, 2nd ed.; Springer: Cham, Switzerland, 2016. [Google Scholar]


Disclaimer/Publisher’s Note: The statements, opinions and data contained in all publications are solely those of the individual author(s) and contributor(s) and not of MDPI and/or the editor(s). MDPI and/or the editor(s) disclaim responsibility for any injury to people or property resulting from any ideas, methods, instructions or products referred to in the content. |
© 2024 by the authors. Licensee MDPI, Basel, Switzerland. This article is an open access article distributed under the terms and conditions of the Creative Commons Attribution (CC BY) license (https://creativecommons.org/licenses/by/4.0/).