

Radiocarbon Flux Measurements Provide Insight into Why a Pyroligneous Acid Product Stimulates Plant Growth


Abstract
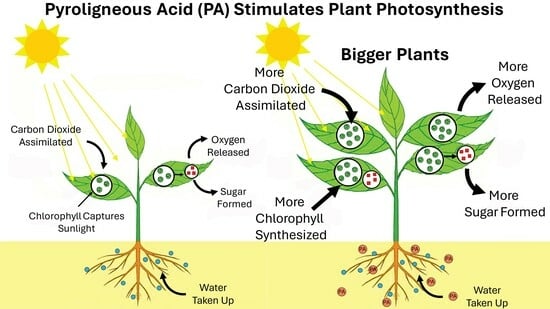
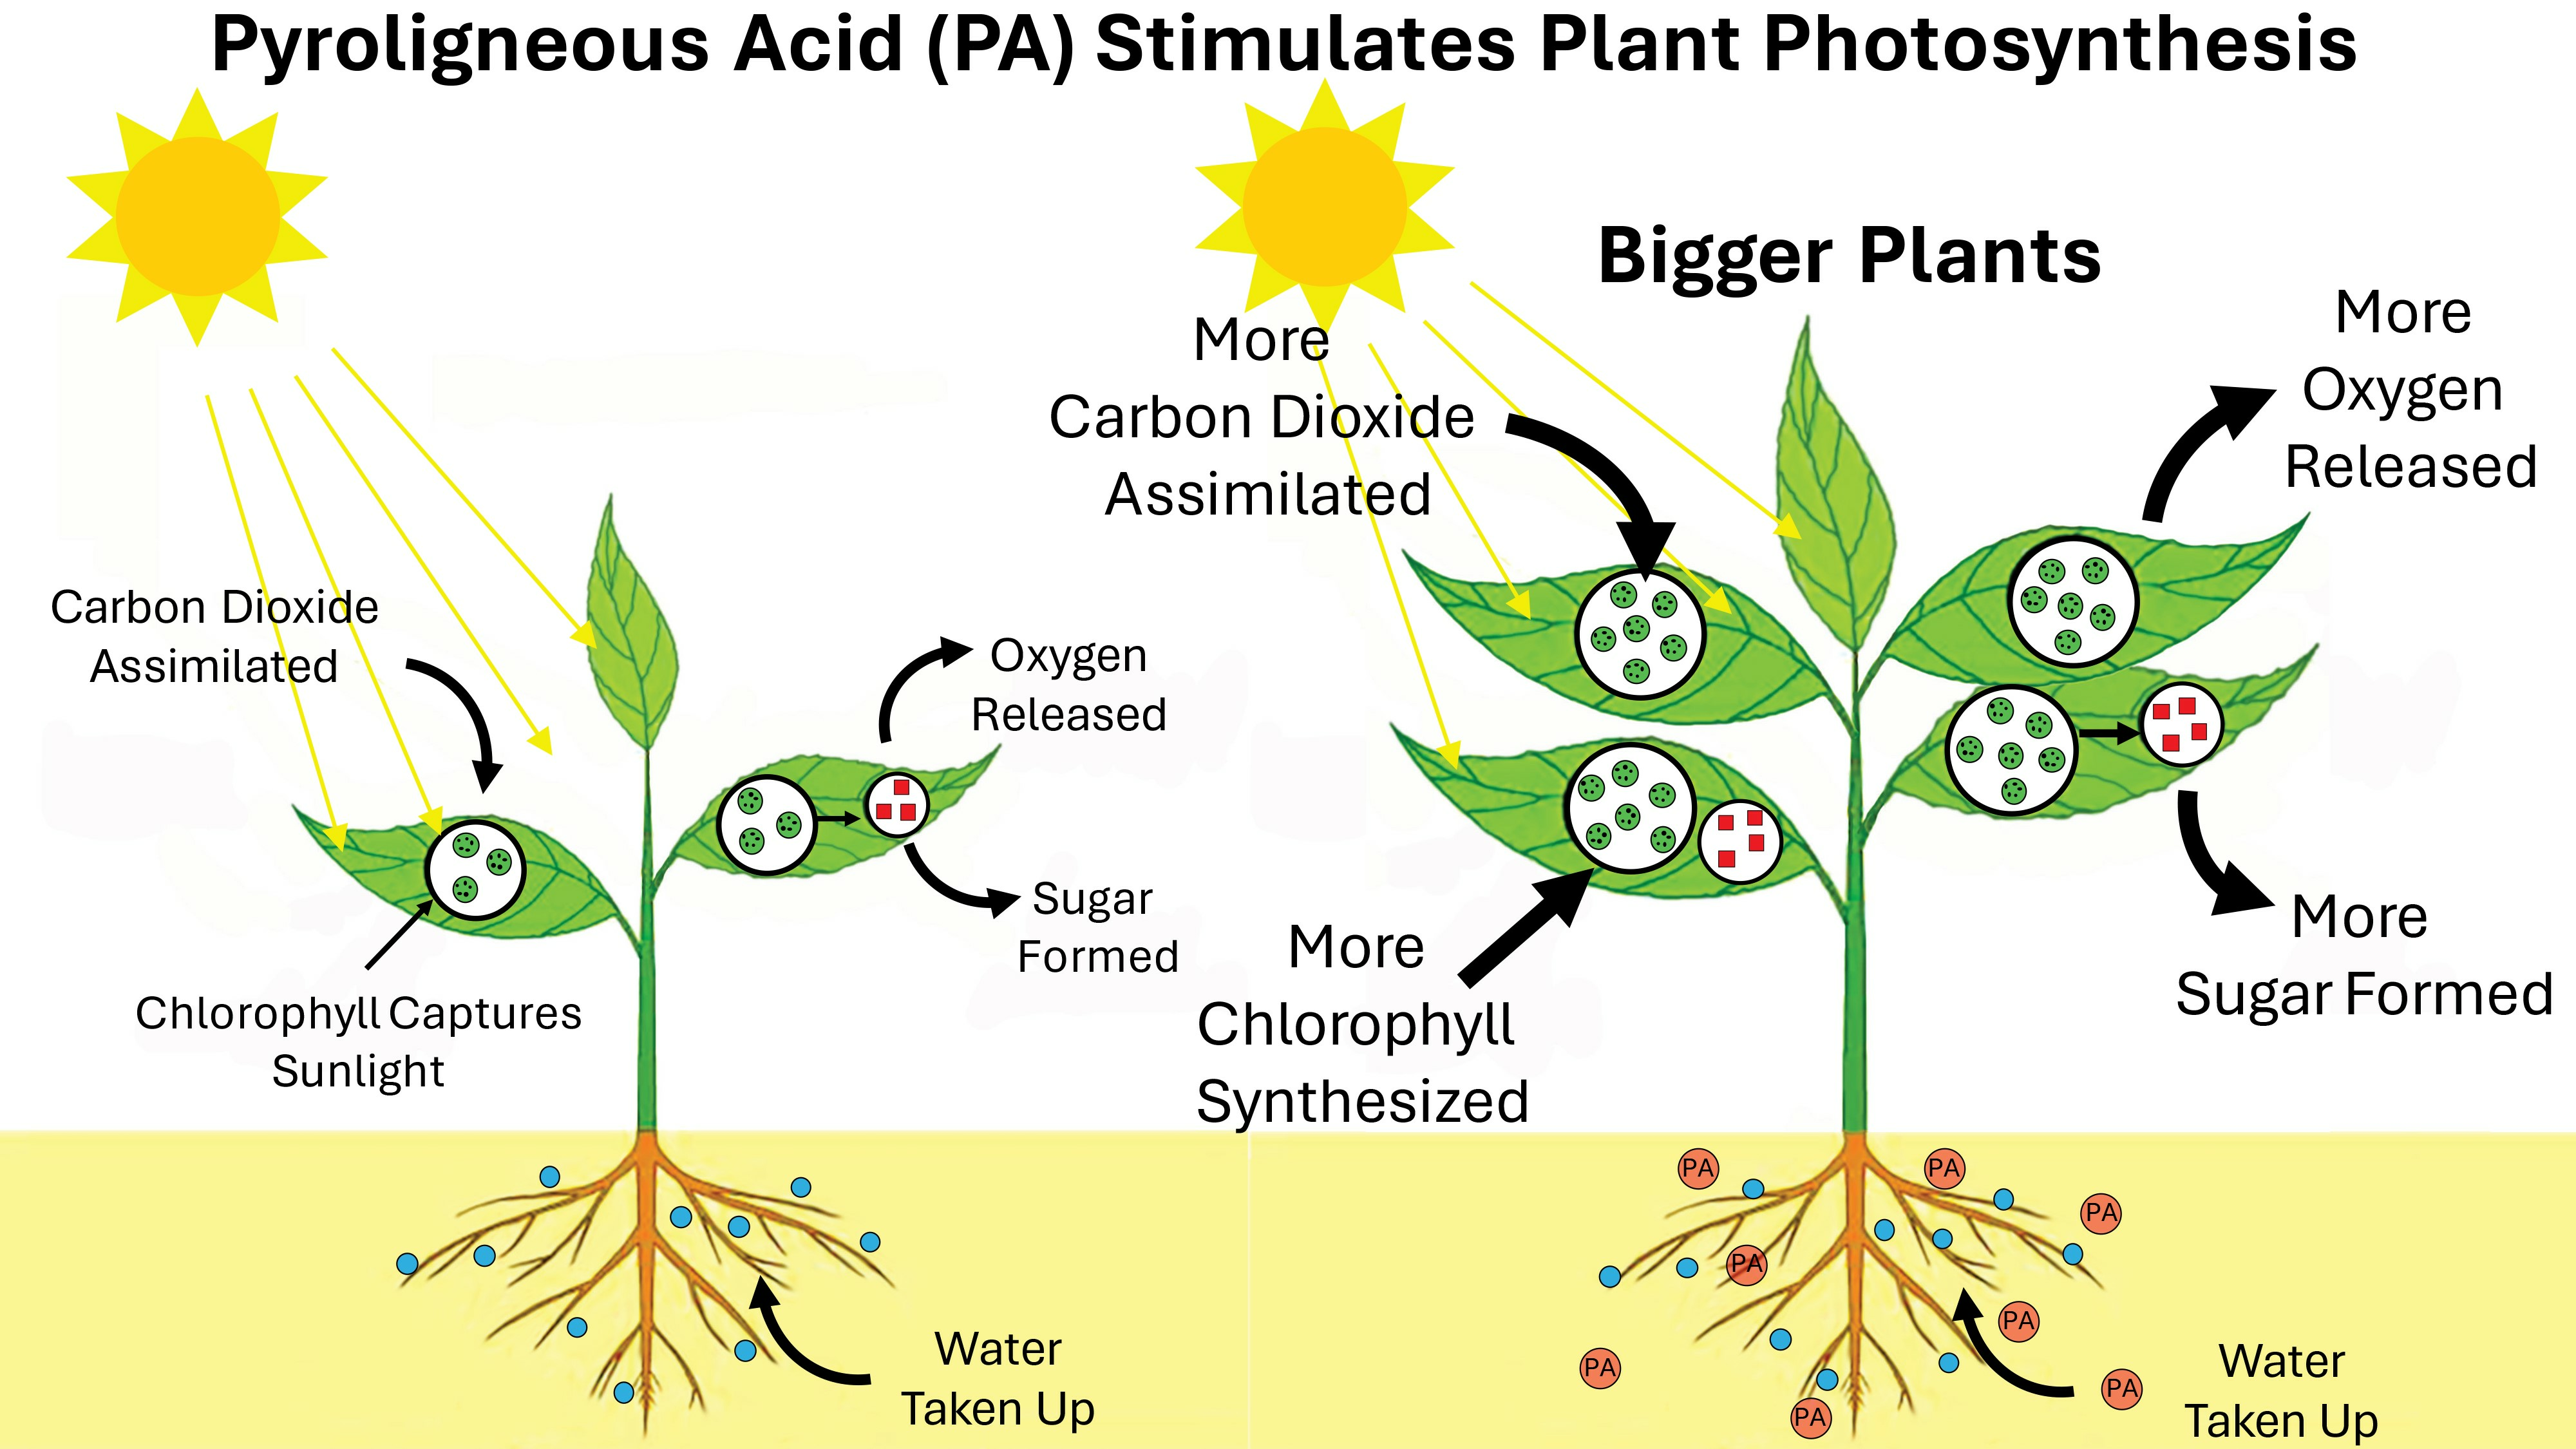
1. Introduction
2. Results
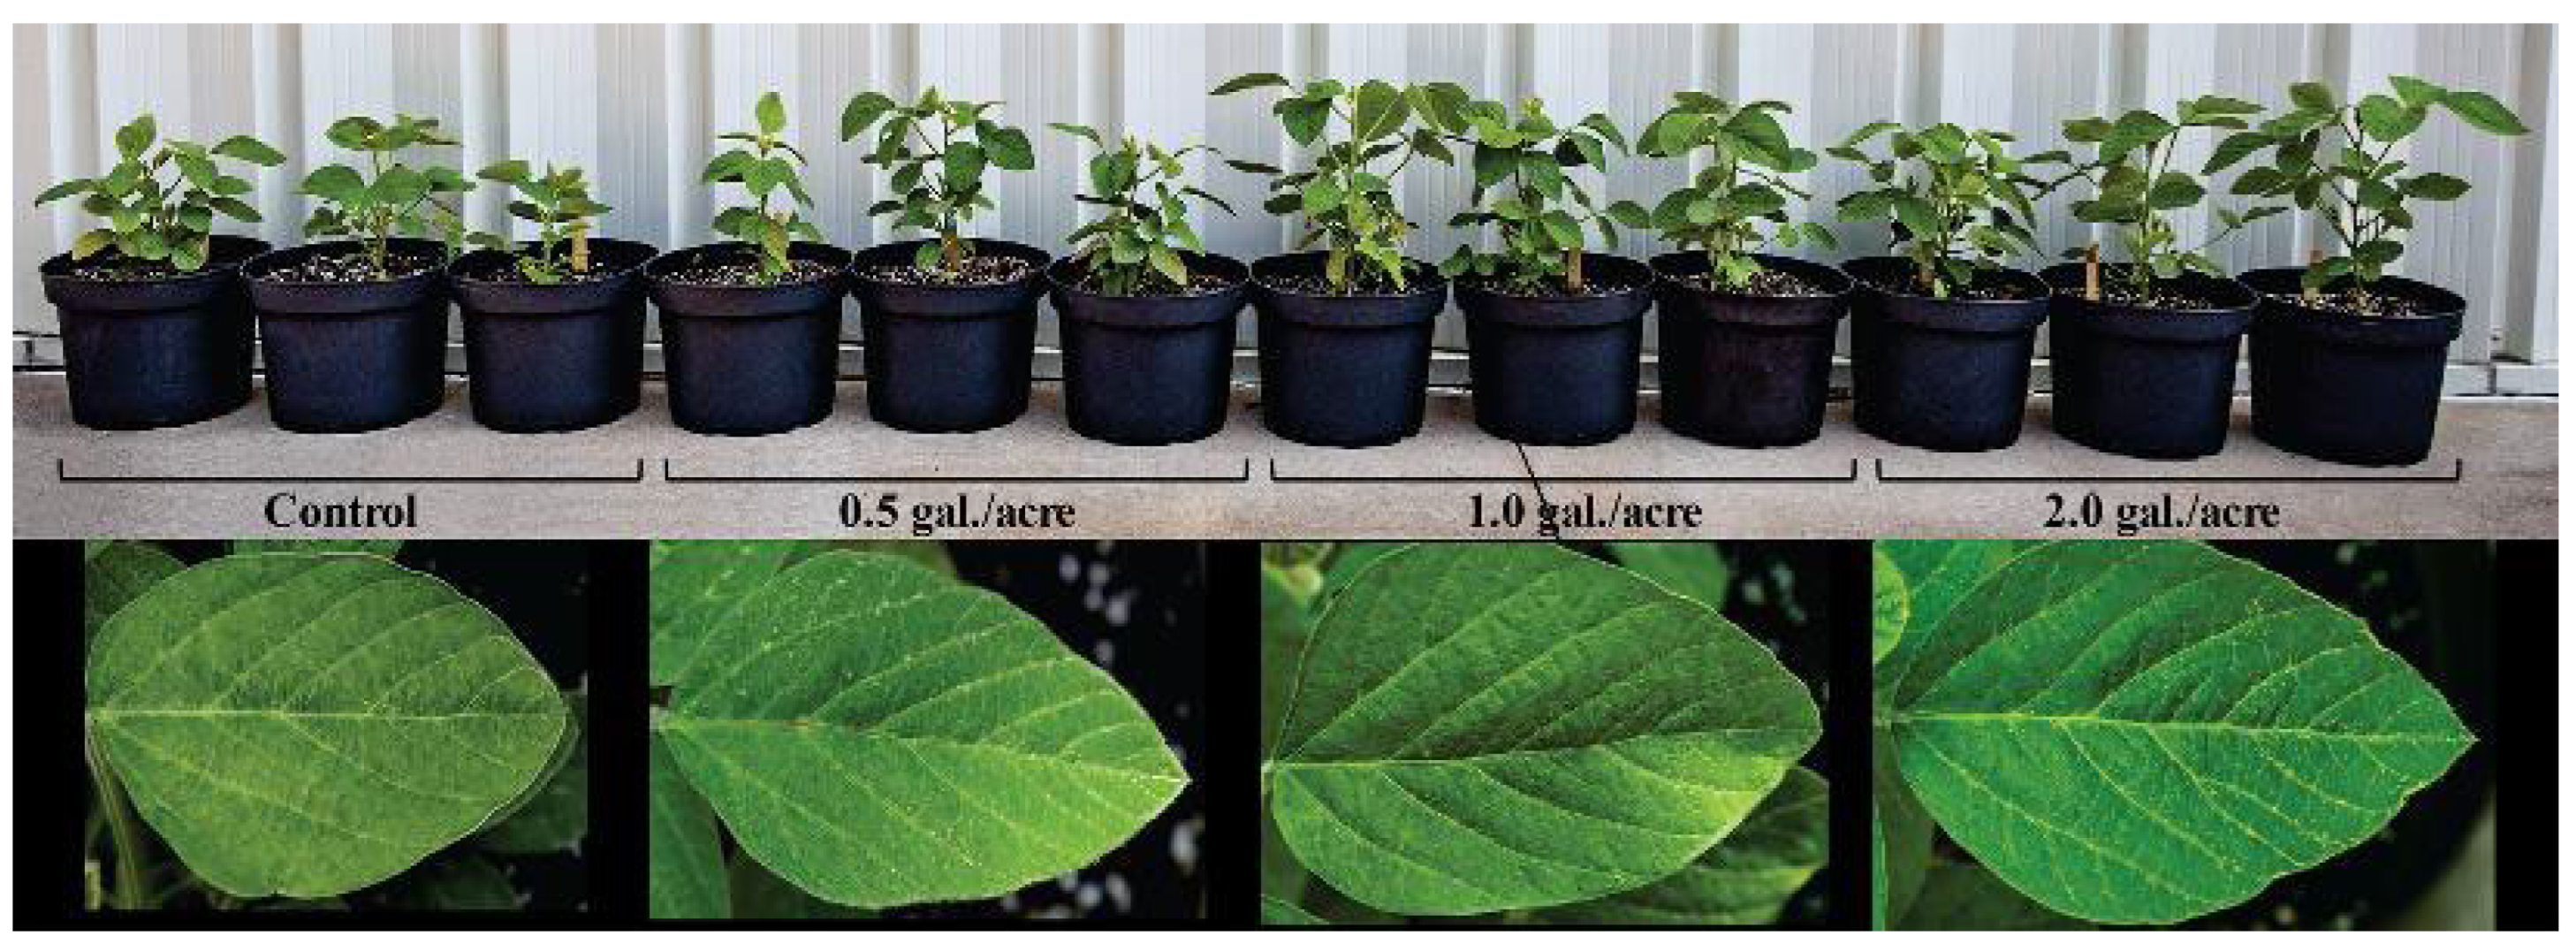
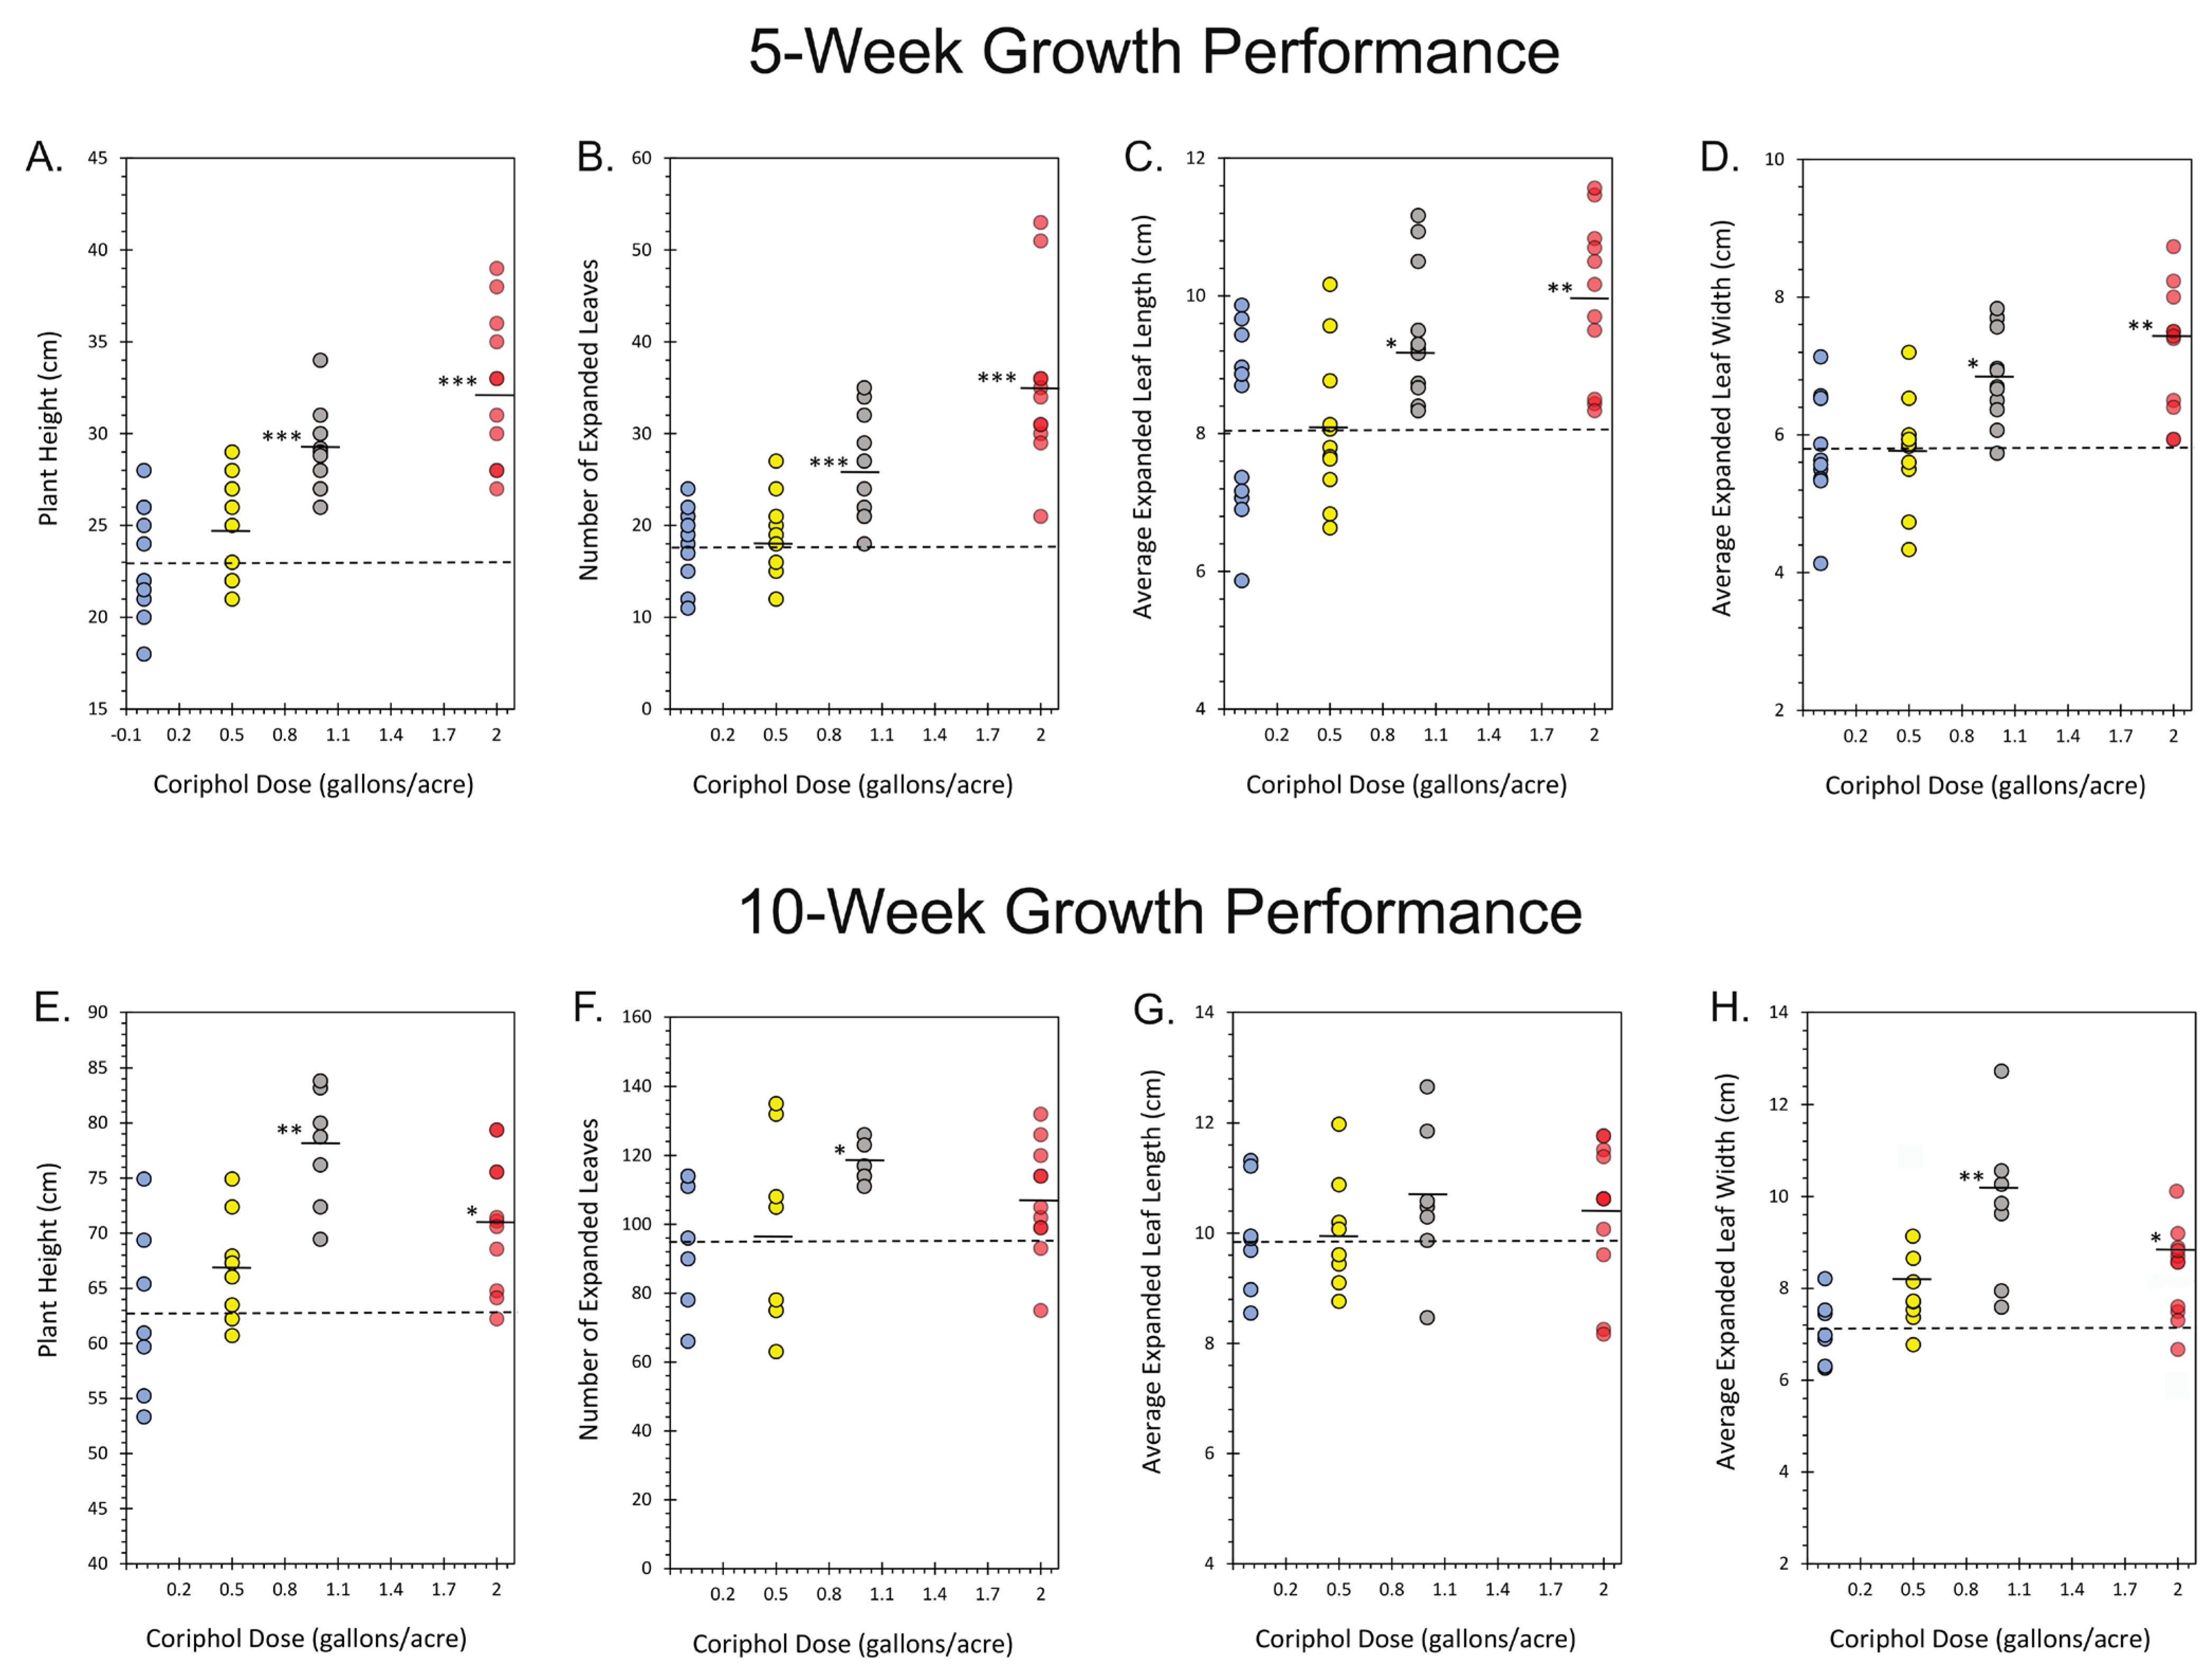
2.1. Outdoor Plant Growth Performance
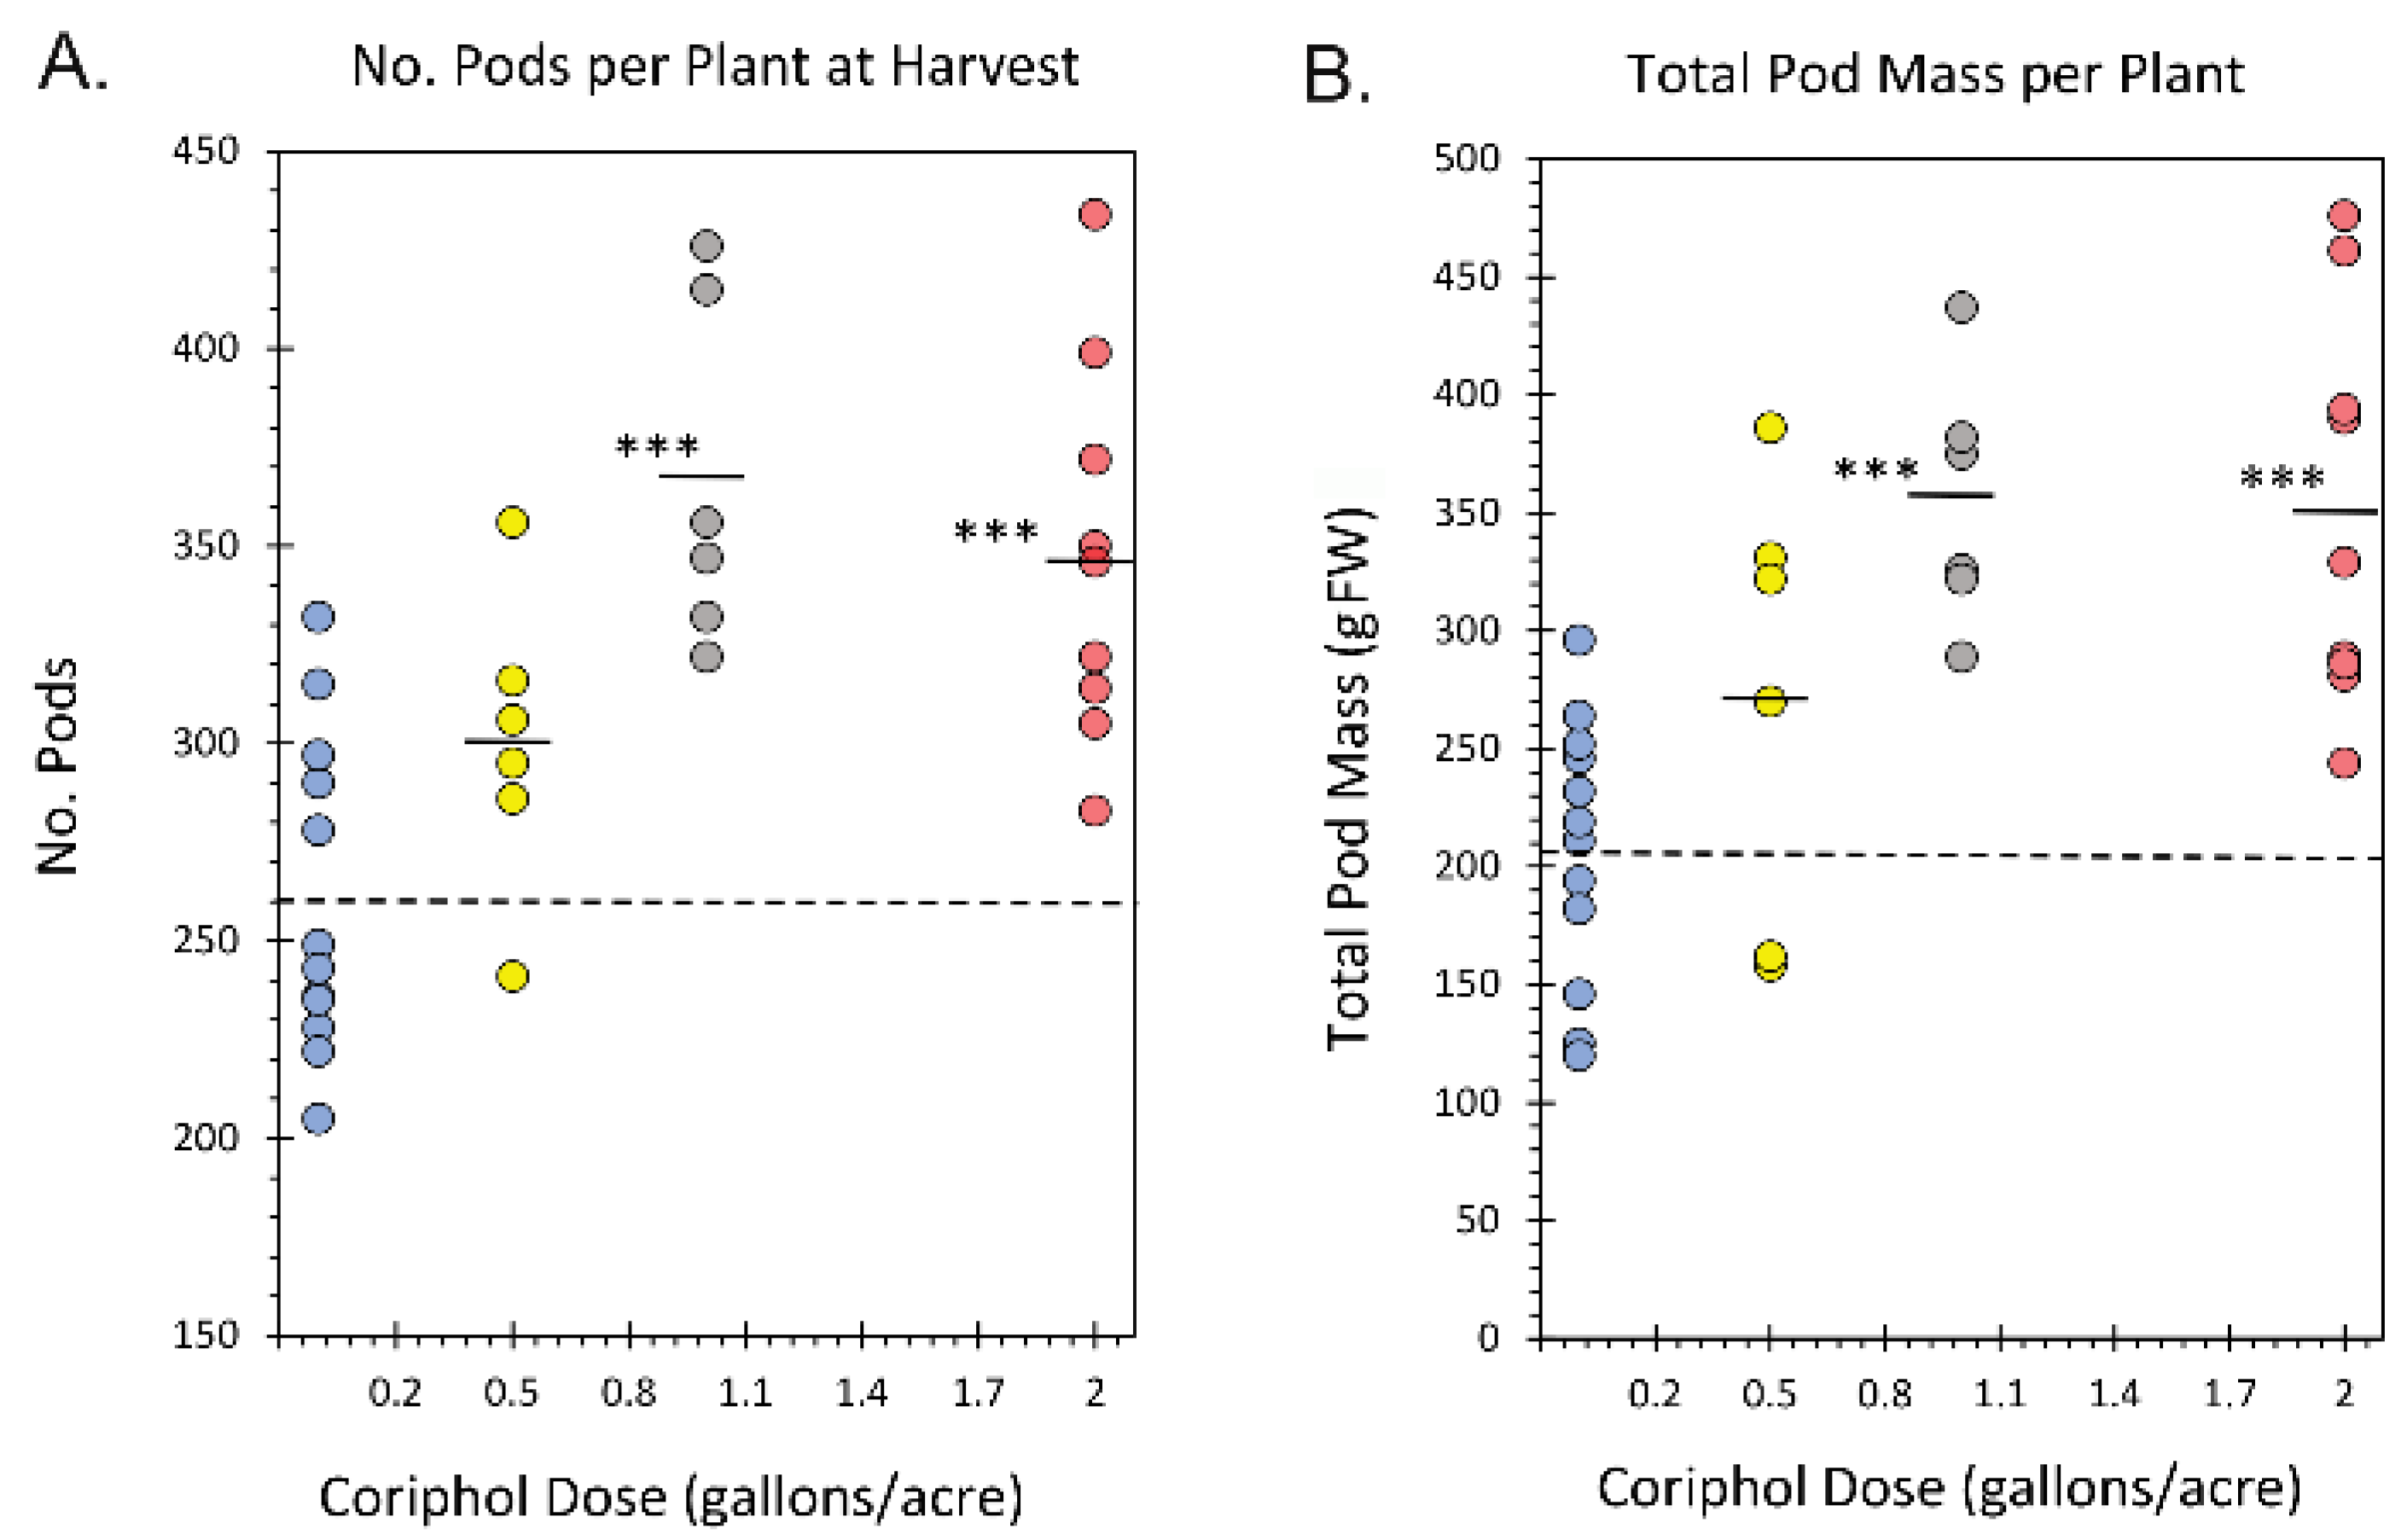
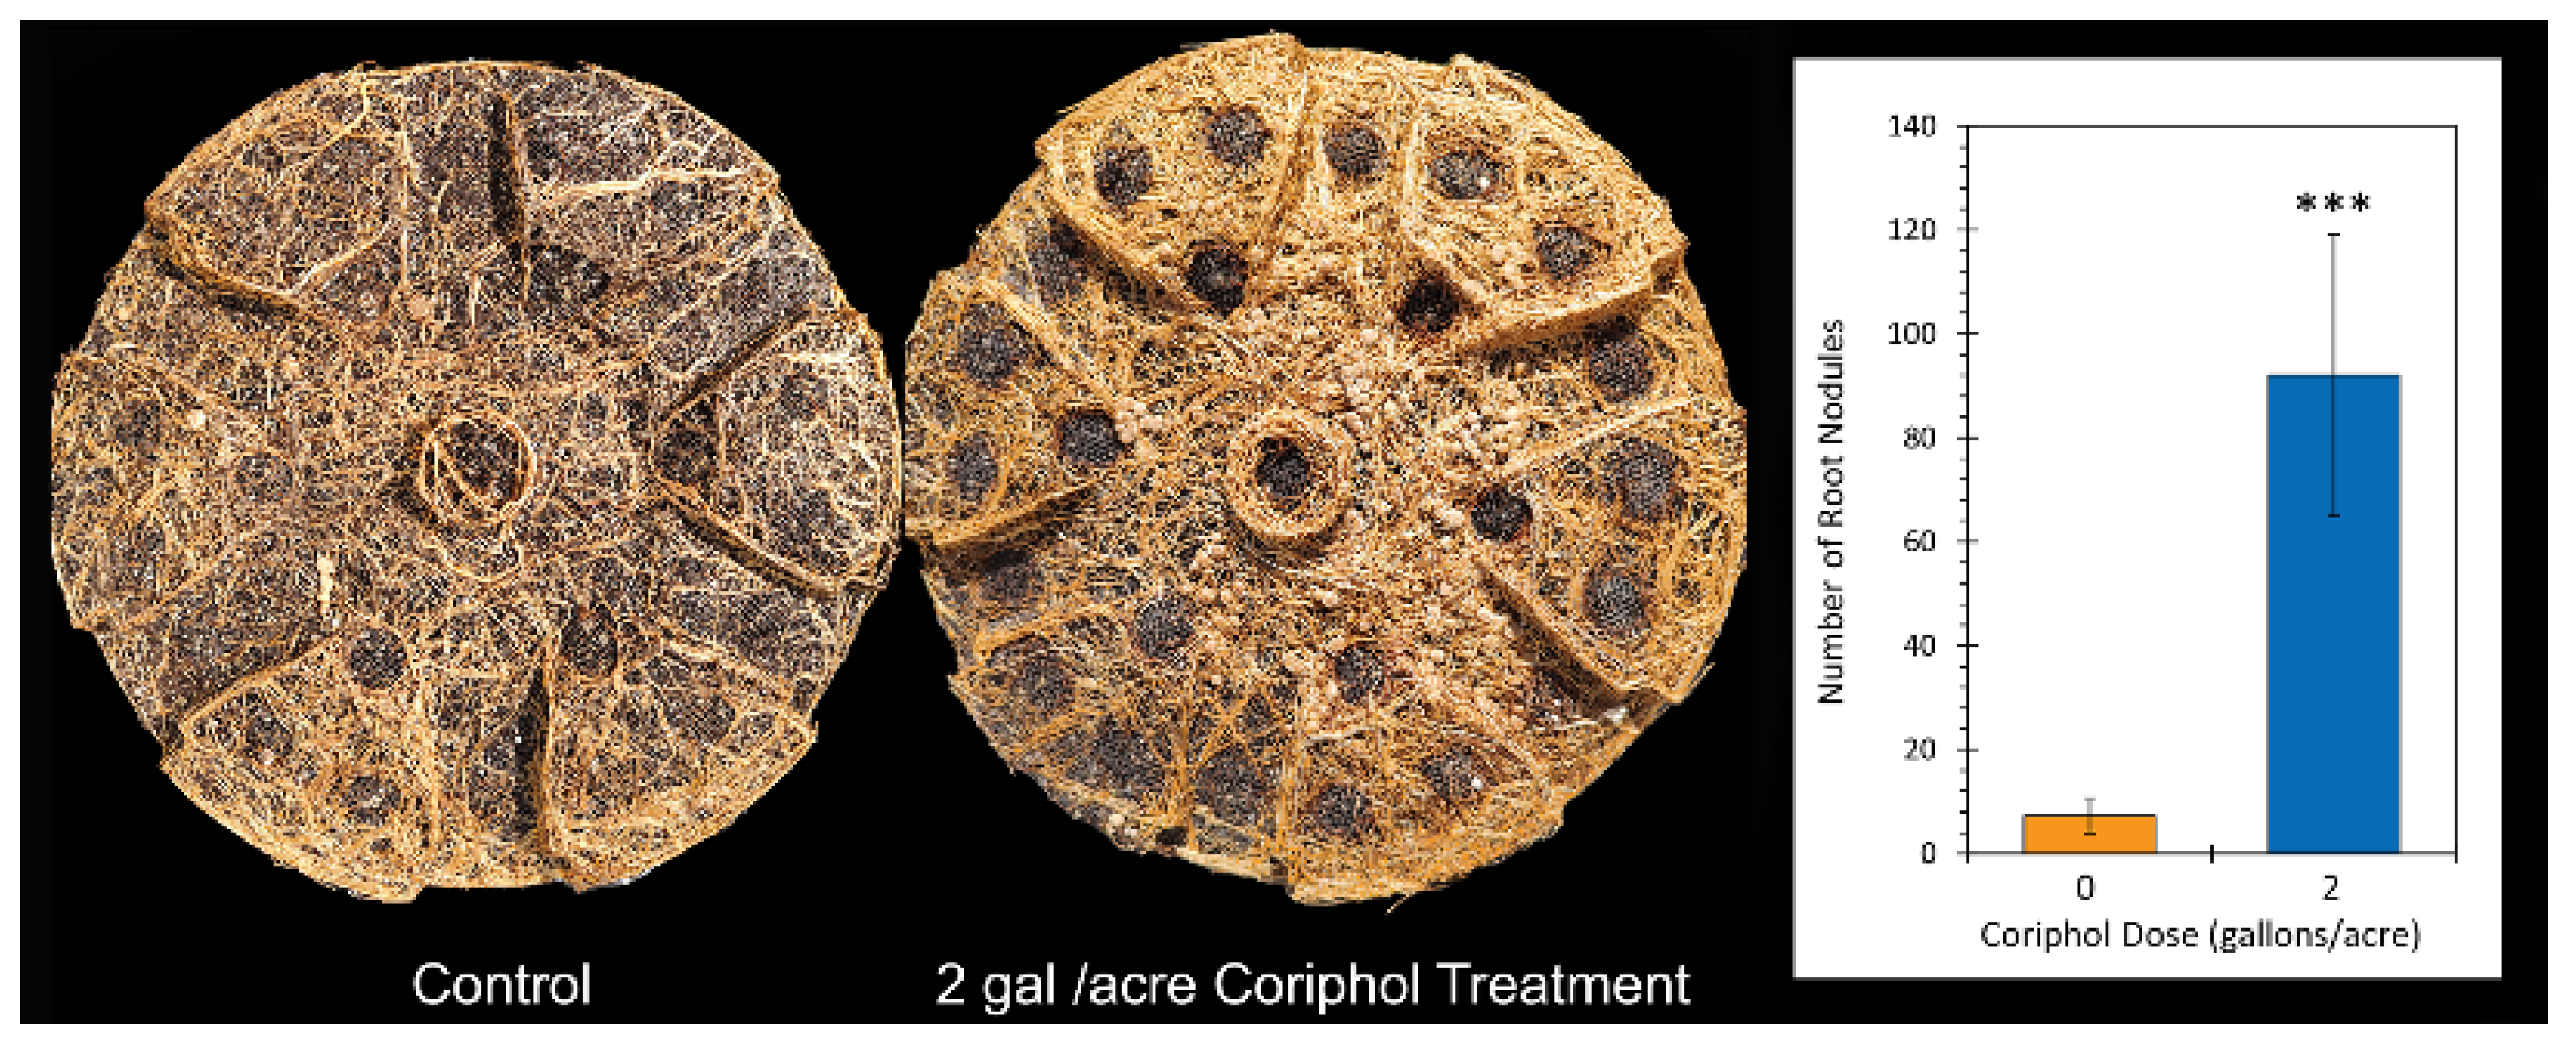
2.2. Outdoor Harvest Data
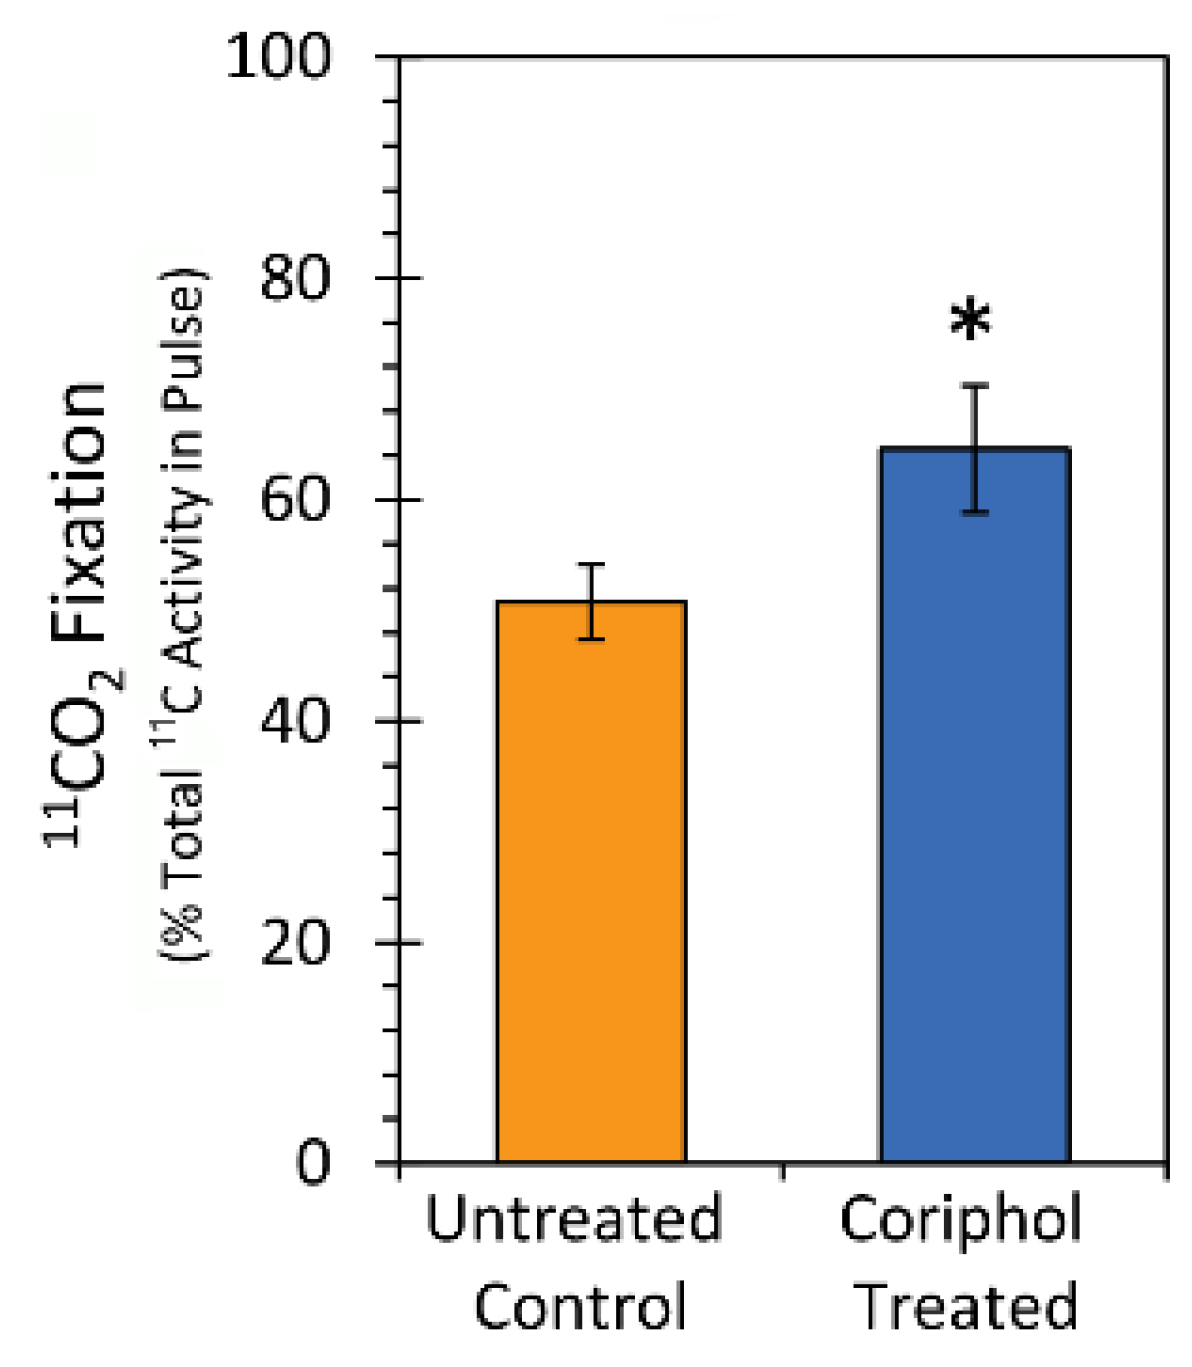
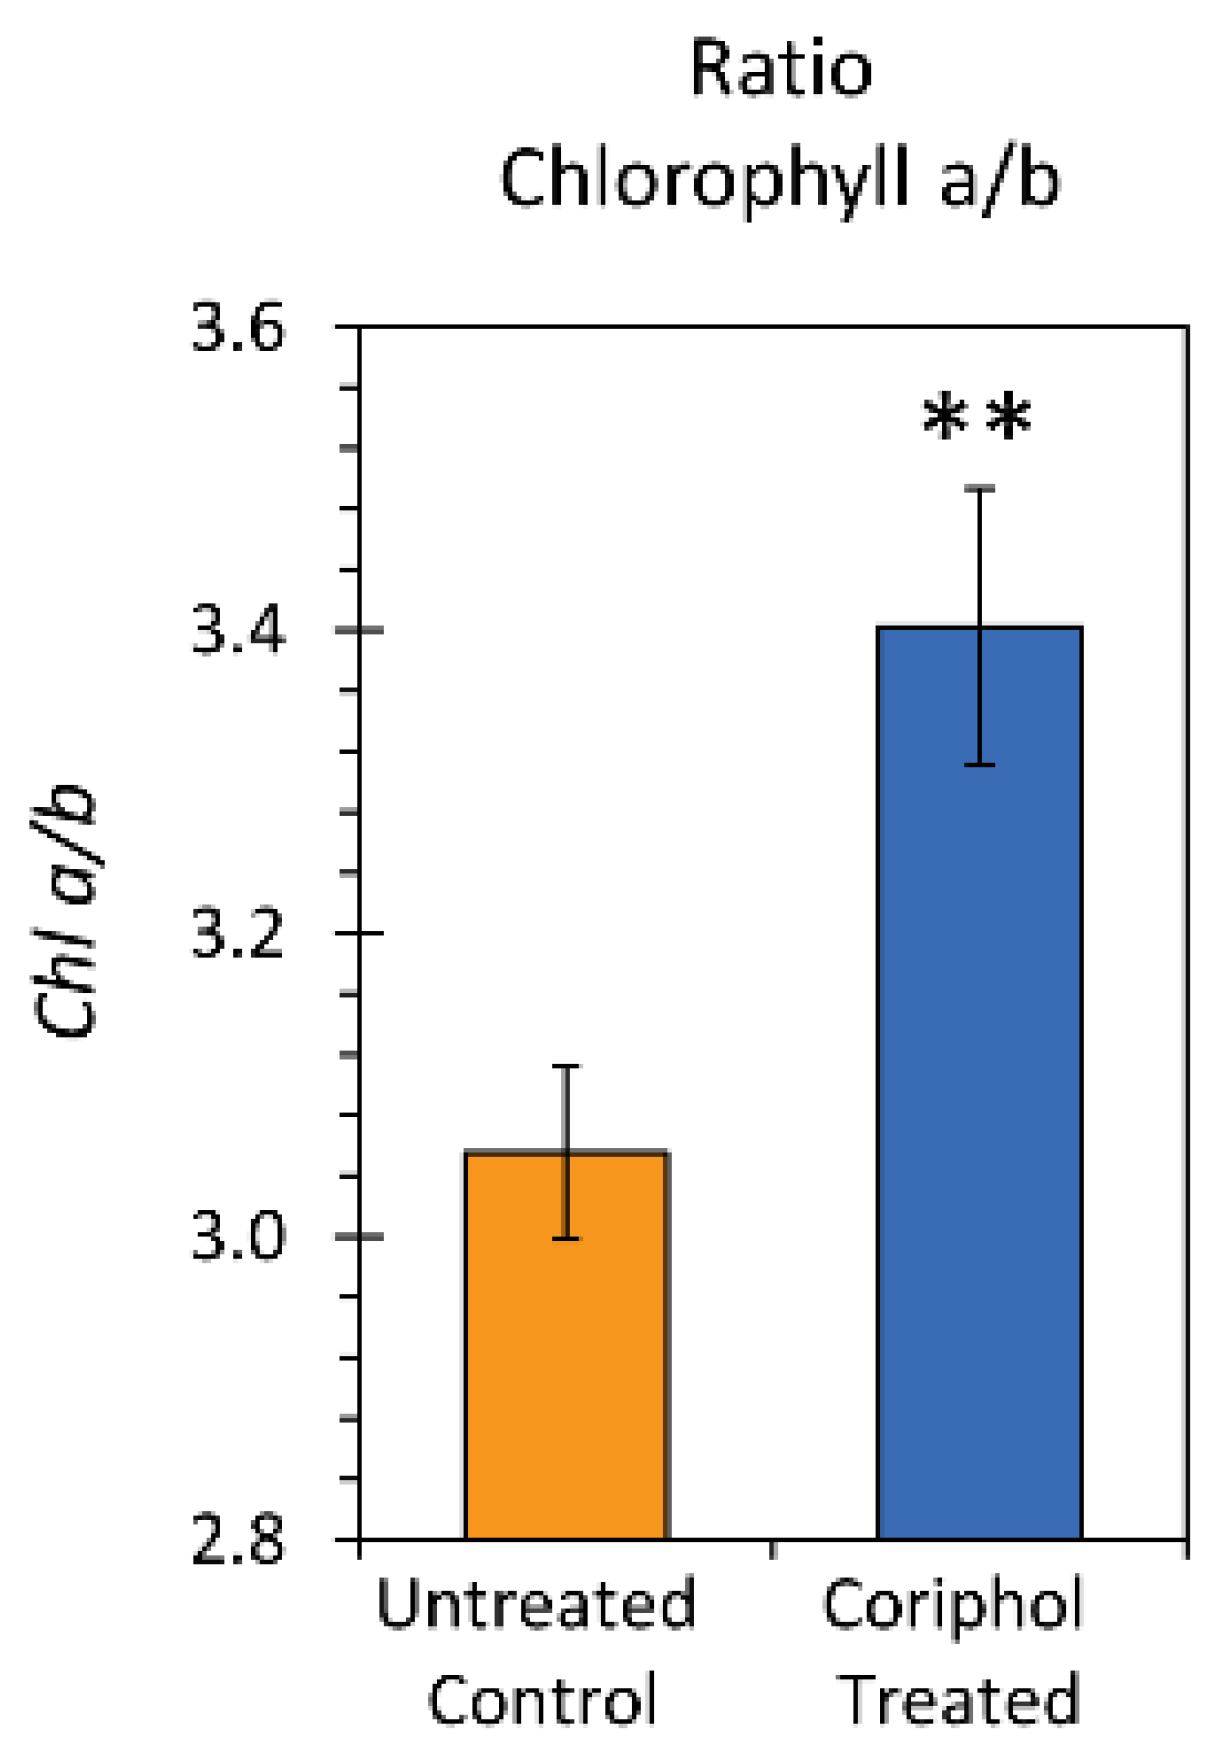
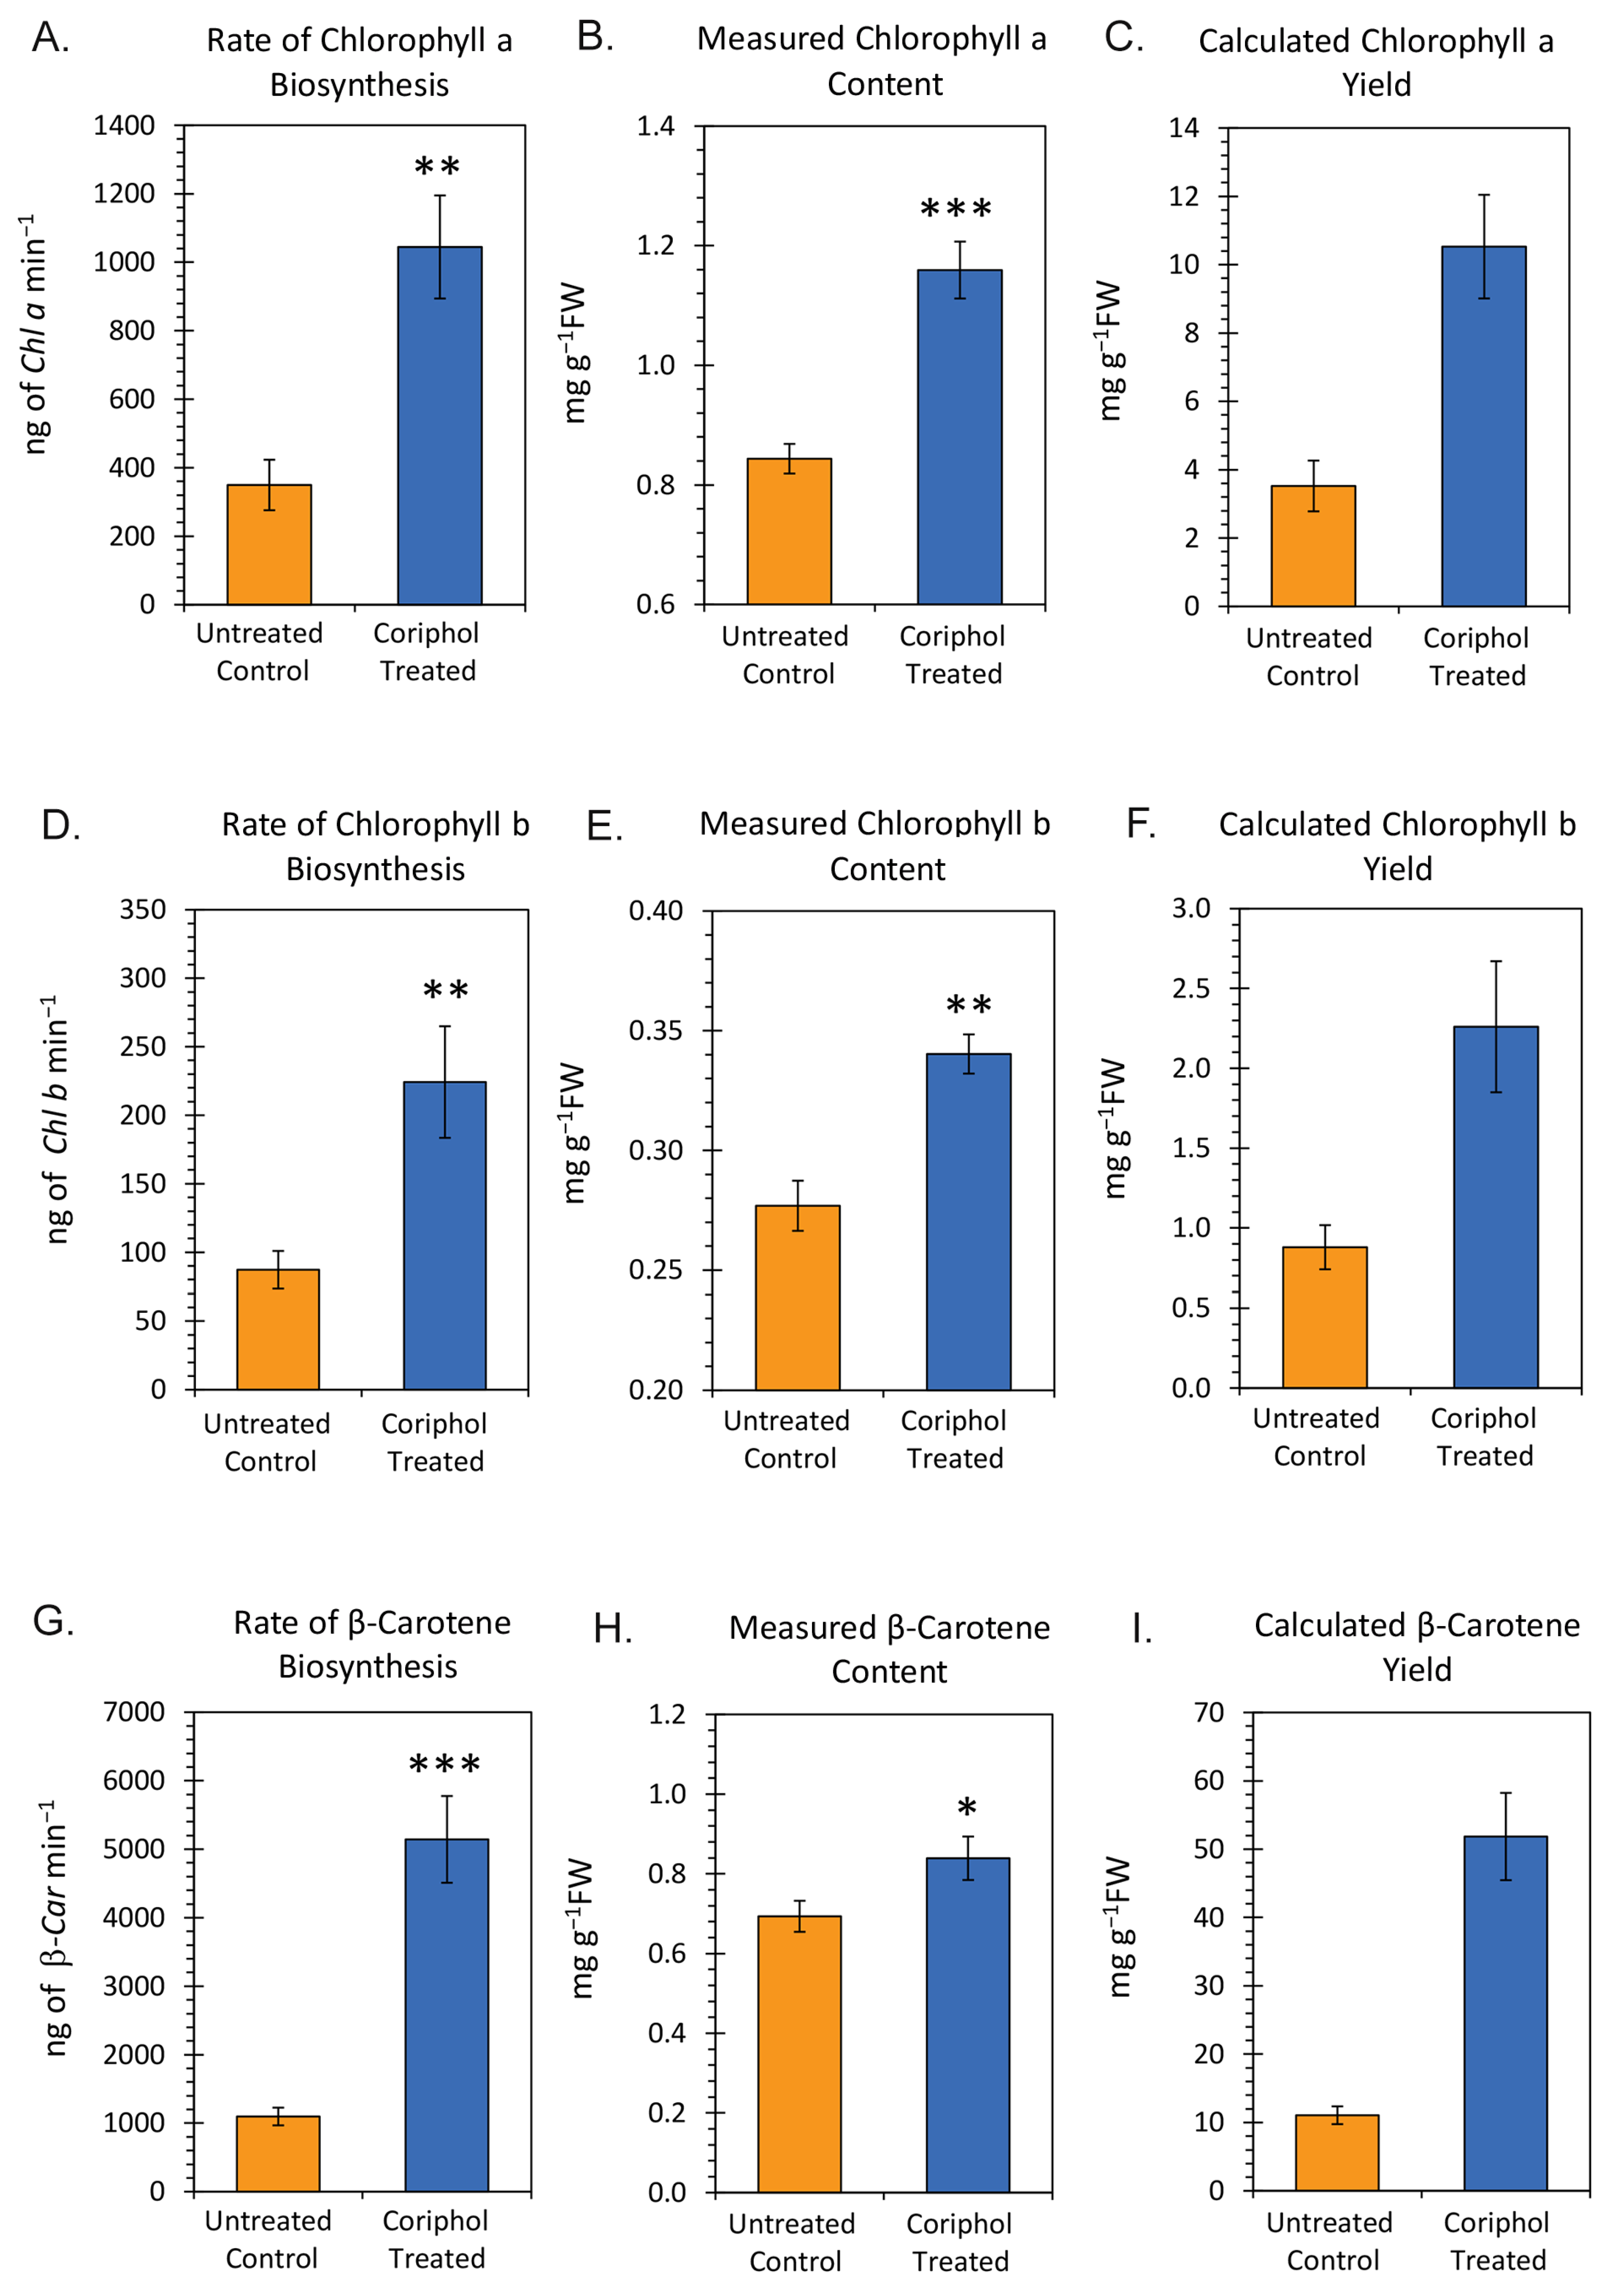
2.3. Laboratory Radiocarbon Flux Measurements
3. Discussion
4. Materials and Methods
4.1. Outdoor Plant Growth
4.2. Plant Growth for Laboratory Radiotracer Studies
4.3. Production and Administration of Radioactive 11CO2
4.4. Leaf Pigment Analysis
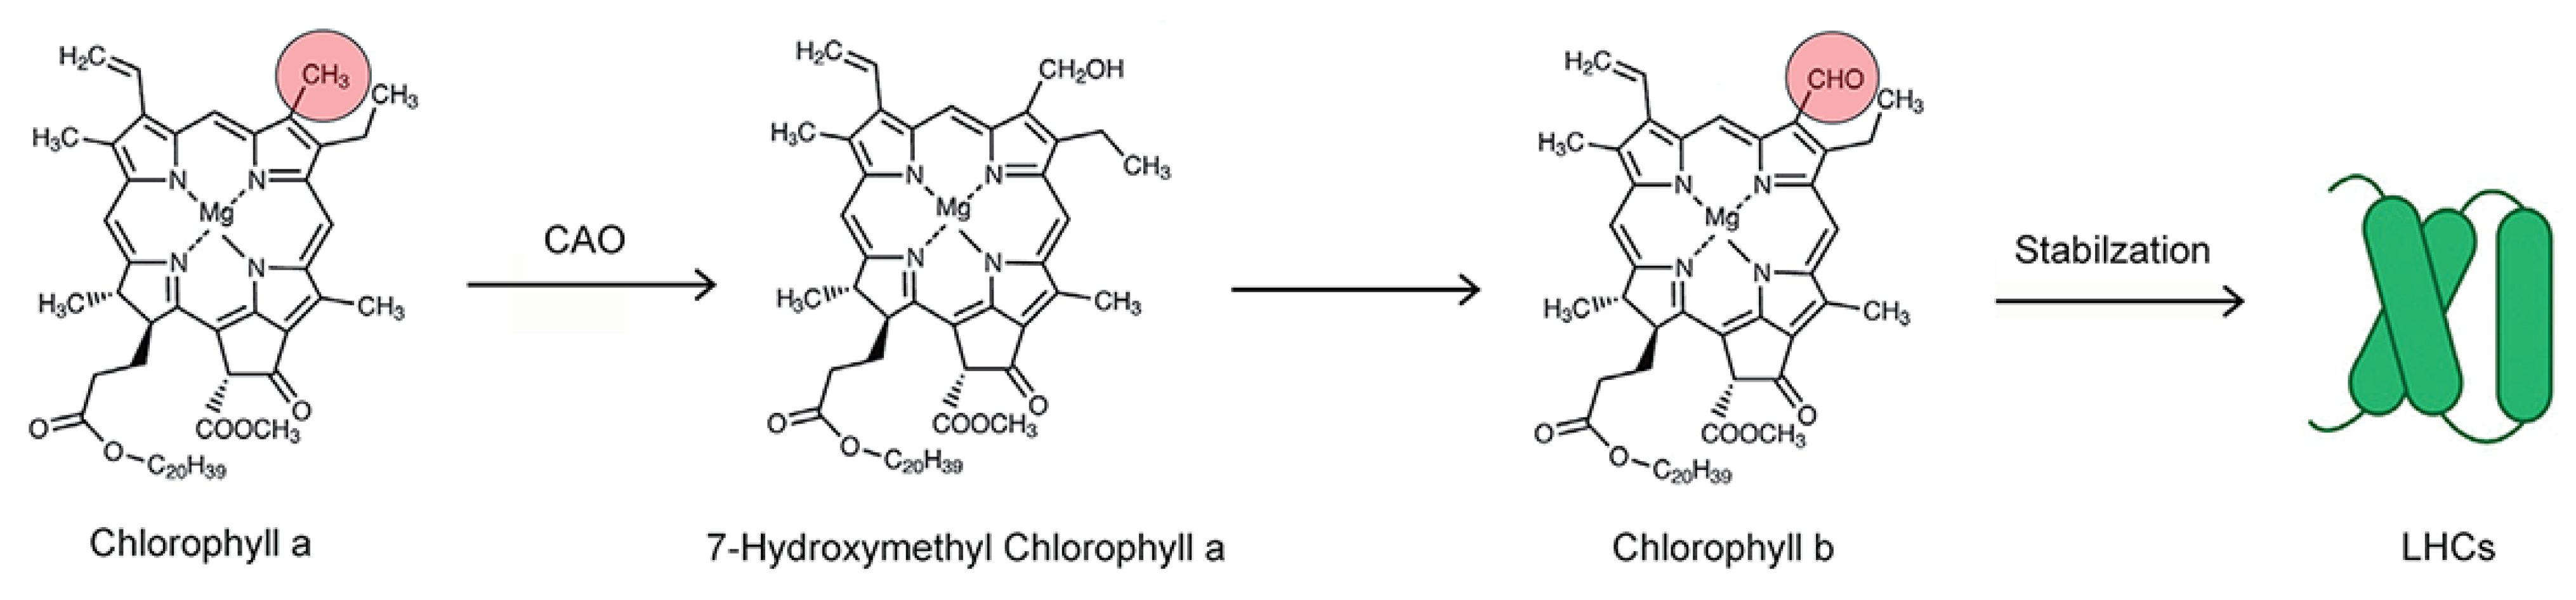
4.5. Calculation of Leaf Pigment Metabolic Turnover
4.6. Statistical Analysis
5. Conclusions
Supplementary Materials
Author Contributions
Funding
Institutional Review Board Statement
Informed Consent Statement
Data Availability Statement
Acknowledgments
Conflicts of Interest
References
- United Nations. DESA Report 2017. World Population Prospects; United Nations: New York, NY, USA, 2017. [Google Scholar]
- Baldwin, I.T.; Benning, C.; Burke, A.; Caicedo, A.; Carpita, N.; Dilworth, M.; Horsch, R.; Kutchan, T.; Last, R.; Mackenzie, S.; et al. Unleashing a Decade of Innovation in Plant Science—A Vision for 2015–2025. Plant Science Research Summit Held 2013 at the Howard Hughe Medical Institute and Sponsored by the American Society of Plant Biology the Howard Hughes Medical Institute, the National Science Foundation, the U.S. Department of Agriculture, and the U.S. Department of Energy. Available online: https://aspb.org/wp-content/uploads/2016/05/plantsciencedecadalvision10-18-13.pdf (accessed on 4 March 2024).
- Grewal, A.; Abbey, L.; Gunupuru, L.R. Production, prospects, and potential application of pyroligneous acid in agriculture. J. Anal. Appl. Pyrolysis 2018, 135, 152–159. [Google Scholar] [CrossRef]
- da Silva Porto, F.G.; Campos, A.D.; Garcia, I.T.S. Distilled pyroligneous liquor obtained from Eucalyptus grandis and chitosan: Physicochemical properties of the solution and films. Environ. Sci. Pollut. Res. 2019, 26, 672–683. [Google Scholar] [CrossRef] [PubMed]
- Luo, X.; Wang, Z.; Meki, K.; Wang, X.; Liu, B.; Zheng, H.; You, X.; Li, F. Effect of co-application of wood vinegar and biochar on seed germination and seedling growth. J. Soils Sediments 2019, 19, 3934–3944. [Google Scholar] [CrossRef]
- Cândido, N.R.; Duarte Pasa, V.M.; de Oliveira Vilela, A.; Campos, A.D.; de Fátima, A.; Modolo, L.V. Understanding the multifunctionality of pyroligneous acid from waste biomass and the potential applications in agriculture. Sci. Total Environ. 2023, 881, 163519. [Google Scholar] [CrossRef] [PubMed]
- Mun, S.P.; Ku, C.S. Pyrolysis GC-MS analysis of tars formed during the aging of wood and bamboo crude vinegars. J. Wood Sci. 2009, 56, 47–52. [Google Scholar] [CrossRef]
- Mungkunkamchao, T.; Kesmala, T.; Pimratch, S.; Toomsan, B.; Jothityangkoon, D. Wood vinegar and fermented bioextracts: Natural products to enhance growth and yield of tomato (Solanum lycopersicum L.). Sci. Hortic. 2013, 154, 66–72. [Google Scholar] [CrossRef]
- Ofoe, R.; Gunupuru, L.R.; Qin, D.; Thomas, R.H.; Abbey, L. Pyroligneous acid increases productivity and nutritional quality of greenhouse tomato. Plants 2022, 11, 1650. [Google Scholar] [CrossRef]
- Ofoe, R.; Mousavi, S.M.N.; Thomas, R.H.; Lord, A. Foliar application of pyroligneous acid acts synergistically with fertilizer to improve the productivity and phytochemical properties of greenhouse-grown tomato. Sci. Rep. 2024, 14, 1934. [Google Scholar] [CrossRef]
- Zhu, K.; Liu, J.; Luo, T.; Zhang, K.; Khan, Z.; Zhou, Y.; Cheng, T.; Yuan, B.; Peng, X.; Hu, L. Wood vinegar impact on the growth and low-temperature tolerance of rapeseed seedlings. Agronomy 2022, 12, 2453. [Google Scholar] [CrossRef]
- Zeng, L.; Sun, X.; Zhou, W.; Li, J.; Guo, Y.; Liu, X.; Cui, D. Combined treatment of a pyroligneous solution and soluble calcium enhances cotton growth through improving soil quality in saline-alkali soils. J. Soil Sci. Plant Nutr. 2022, 22, 25–35. [Google Scholar] [CrossRef]
- Fedeli, R.; Vannini, A.; Guarnieri, M.; Monaci, F.; Loppi, S. Bio-based solutions for agriculture: Foliar application of wood distillate alone and in combination with other plant-derived corroborants results in different effects on lettuce (Lactuca sativa L.). Biology 2022, 11, 404. [Google Scholar] [CrossRef] [PubMed]
- Zhang, L.; García-Pérez, P.; Arikan, B.; Elbasan, F.; Alp, F.N.; Melike Balci, M.; Zengin, G.; Yildiztugay, E.; Lucini, L. The exogenous application of wood vinegar induces a tissue- and dose-dependent elicitation of phenolics and functional traits in onion (Allium cepa L.). Food Chem. 2023, 405, 134926. [Google Scholar] [CrossRef]
- Tomitani, A.; Okada, K.; Miyashita, H.; Matthijs, H.; Ohno, T.; Tanaka, A. Chlorophyll b and phycobilins in the common ancestor of cyanobacteria and chloroplasts. Nature 1999, 400, 159–162. [Google Scholar] [CrossRef] [PubMed]
- Chen, M. Chlorophyll modifications and their spectral extension in oxygenic photosynthesis. Annu. Rev. Biochem. 2014, 83, 317–340. [Google Scholar] [CrossRef]
- Smith, J.H.C.; French, C.S. Major and accessory pigments in photosynthesis. Annu. Rev. Plant Physiol. Plant Mol. Biol. 1963, 14, 181–224. [Google Scholar] [CrossRef]
- Porra, R.J.W.; Schäfer, W.; Cmiel, E.; Katheder, I.; Scheer, H. Derivation of the formyl-group oxygen of chlorophyll b from molecular oxygen in greening leaves of a higher plant (Zea mays). FEBS Lett. 1993, 323, 31–34. [Google Scholar] [CrossRef]
- Green, B.R.; Durnford, D.G. The chlorophyll-carotenoid proteins of oxygenic photosynthesis. Annu. Rev. Plant Physiol. Plant Mol. Biol. 1996, 47, 685–714. [Google Scholar] [CrossRef]
- Neilson, J.A.; Durnford, D.G. Structural and functional diversification of the light-harvesting complexes in photosynthetic eukaryotes. Photosynth. Res. 2010, 106, 57–71. [Google Scholar] [CrossRef] [PubMed]
- Bellemare, G.; Bartlett, S.G.; Chua, N.H. Biosynthesis of chlorophyll a/b-binding polypeptides in wild type and the chlorina f2 mutant of barley. J. Biol. Chem. 1982, 257, 7762–7767. [Google Scholar] [CrossRef]
- Peter, G.F.; Thornber, J.P. Biochemical composition and organization of higher plant photosystem II light-harvesting pigment-proteins. J. Biol. Chem. 1991, 266, 16745–16754. [Google Scholar] [CrossRef]
- Paulsen, H.; Finkenzeller, B.; Kühlein, N. Pigments induce folding of light-harvesting chlorophyll a/b-binding protein. Eur. J. Biochem. 1993, 215, 809–816. [Google Scholar] [CrossRef] [PubMed]
- Lindahl, M.; Yang, D.H.; Andersson, B. Regulatory proteolysis of the major light-harvesting chlorophyll a/b protein of photosystem II by a light-induced membrane-associated enzymic system. Eur. J. Biochem. 1995, 231, 503–509. [Google Scholar] [PubMed]
- Duysens, L.N.M. Transfer of Excitation Energy in Photosynthesis. Ph.D. Thesis, State University, Utrecht, The Netherlands, 1952. [Google Scholar]
- Fritschi, F.B.; Ray, J.D. Soybean leaf nitrogen, chlorophyll content, and chlorophyll a/b ratio. Photosynthetica 2007, 45, 92–98. [Google Scholar] [CrossRef]
- Boardman, N.K. Comparative photosynthesis of sun and shade plants. Annu. Rev. Plant Physiol. 1977, 28, 355–377. [Google Scholar] [CrossRef]
- Lichtenthaler, H.K.; Buschmann, C.; Döll, M.; Fietz, H.-J.; Bach, T.; Kozel, U.; Meier, D.; Rahmsdorf, U. Photosynthetic activity, chloroplast ultrastructure, and leaf characteristics of high-light and low-light plants and of sun and shade leaves. Photosynth. Res. 1981, 2, 115–141. [Google Scholar] [CrossRef]
- Anderson, J.M. Photoregulation of the composition, function, and structure of thylakoid membranes. Annu. Rev. Plant Physiol. 1986, 37, 93–136. [Google Scholar] [CrossRef]
- Björkman, O.; Boardman, N.K.; Anderson, J.M.; Thorne, S.W.; Goodchild, D.J.; Pyliotis, N.A. Effect of light intensity during growth of Atriplex patula on the capacity of photosynthetic reactions, chloroplast components and structure. Carnegie Inst. Year Book 1972, 71, 115–135. [Google Scholar]
- Dale, M.P.; Causton, D.R. Use of the chlorophyll a/b ratio as a bioassay for the light environment of a plant. Funct. Ecol. 1992, 6, 190–196. [Google Scholar] [CrossRef]
- Hák, R.; Rinderle-Zimmer, U.; Lichtenthaler, H.K.; Nátr, L. Chlorophyll a fluorescence signatures of nitrogen deficient barley leaves. Photosynthetica 1993, 28, 151–159. [Google Scholar]
- Boote, K.J.; Gallaher, R.N.; Robertson, W.K.; Hinson, K.; Hammond, L.C. Effect of foliar fertilization on photosynthesis, leaf nutrition, and yield of soybeans. Agron. J. 1978, 70, 787–791. [Google Scholar] [CrossRef]
- Hesketh, J.D.; Ogren, W.L.; Hageman, M.E.; Peters, D.B. Correlations among leaf CO2 exchange rates, areas and enzyme activities among soybean cultivars. Photosynth. Res. 1981, 2, 21–30. [Google Scholar] [CrossRef] [PubMed]
- Lugg, D.G.; Sinclair, T.R. Seasonal changes in photosynthesis of field-grown soybean leaflets. 2. Relation to nitrogen content. Photosynthetica 1981, 15, 138–144. [Google Scholar]
- Boon-Long, P.; Egli, D.B.; Leggett, J.E. Leaf N and photosynthesis during reproductive growth in soybeans. Crop Sci. 1983, 23, 617–620. [Google Scholar] [CrossRef]
- Buttery, B.R.; Buzzell, R.I. Soybean leaf nitrogen in relation to photosynthetic rate and yield. Can. J. Plant Sci. 1988, 68, 793–795. [Google Scholar] [CrossRef]
- Evans, J.R. Photosynthesis and nitrogen relationships in leaves of C3 plants. Oecologia 1989, 78, 9–19. [Google Scholar] [CrossRef]
- Peng, S.; García, F.V.; Laza, R.C.; Cassman, K.G. Adjustment for specific leaf weight improves chlorophyll meter’s estimate of rice leaf nitrogen content. Agron. J. 1993, 85, 987–990. [Google Scholar] [CrossRef]
- Reeves, D.W.; Mask, P.L.; Wood, C.W.; Delaney, D.P. Determination of wheat nitrogen status with a hand-held chlorophyll meter: Influence of management practices. J. Plant Nutr. 1993, 16, 781–796. [Google Scholar] [CrossRef]
- Bullock, D.G.; Anderson, D.S. Evaluation of the Minolta SPAD-502 chlorophyll meter for nitrogen management in corn. J. Plant Nutr. 1998, 21, 741–755. [Google Scholar] [CrossRef]
- Wu, F.; Wu, L.; Xu, F. Chlorophyll meter to predict nitrogen sidedress requirements for short-season cotton (Gossypium hirsutum L.). Field Crops Res. 1998, 56, 309–314. [Google Scholar]
- Ntamatungiro, S.; Norman, R.J.; McNew, R.W.; Wells, B.R. Comparison of plant measurements for estimating nitrogen accumulation and grain yield by flooded rice. Agron. J. 1999, 91, 676–685. [Google Scholar] [CrossRef]
- Nageswara Rao, R.C.; Talwar, H.S.; Wright, G.C. Rapid assessment of specific leaf area and leaf nitrogen in peanut (Arachis hypogaea L.) using a chlorophyll meter. J. Agron. Crop Sci. 2001, 186, 175–182. [Google Scholar] [CrossRef]
- Chang, S.X.; Robison, D.J. Nondestructive and rapid estimation of hardwood foliar nitrogen status using the SPAD-502 chlorophyll meter. For. Ecol. Manag. 2003, 181, 331–338. [Google Scholar] [CrossRef]
- Mauromicale, G.; Ierna, A.; Marchese, M. Chlorophyll fluorescence and chlorophyll content in field-grown potato as affected by nitrogen supply, genotype, and plant age. Photosynthetica 2006, 44, 76–82. [Google Scholar] [CrossRef]
- Terashima, I.; Inoue, Y. Palisade tissue chloroplasts and spongy tissue chloroplasts in spinach: Biochemical and ultrastructural differences. Plant Cell Physiol. 1983, 26, 63–75. [Google Scholar]
- Terashima, I.; Sakaguchi, S.; Hara, N. Intra-leaf and intracellular gradients in chloroplast ultrastructure of dorsiventral leaves illuminated from the adaxial or abaxial side during their development. Plant Cell Physiol. 1986, 27, 1023–1031. [Google Scholar]
- Kitajima, K.; Hogan, K.P. Increases of chlorophyll a/b ratios during acclimation of tropical woody seedlings to nitrogen limitation and high light. Plant Cell Environ. 2003, 26, 857–865. [Google Scholar] [CrossRef] [PubMed]
- Cogdell, R.J.; Frank, H.A. How carotenoids function in photosynthetic bacteria. Biochim. Biophys. Acta 1987, 895, 63–79. [Google Scholar] [CrossRef] [PubMed]
- Frank, H.A.; Cogdell, R.J. The photochemistry and function of carotenoids in photosynthesis. In Carotenoids in Photosynthesis; Young, A.J., Britton, G., Eds.; Chapman & Hall: London, UK, 1993; pp. 252–326. [Google Scholar]
- Frank, H.A.; Young, A.J.; Britton, G.; Cogdell, R.J. The Photochemistry of Carotenoids; Kluwer: Dordrecht, The Netherlands, 1999. [Google Scholar]
- Shigenaga, M.K.; Hagen, T.M.; Ames, B.N. Oxidative damage and mitochondrial decay in aging. Proc. Natl Acad. Sci. USA 1994, 91, 10771–10778. [Google Scholar] [CrossRef] [PubMed]
- Takahashi, Y.; Hansson, O.; Mathis, P.; Satoh, K. Primary radical pair in the photosystem II reaction centre. Biochim. Biophys. Acta 1987, 893, 49–59. [Google Scholar] [CrossRef]
- Durrant, J.R.; Giorgi, L.B.; Barber, J.; Klug, D.R.; Porter, G. Characterization of triple-states in isolated photosystem-II reaction centres—Oxygen quenching as a mechanism for photodamage. Biochim. Biophys. Acta 1990, 1017, 167–175. [Google Scholar] [CrossRef]
- Edge, R.; McGarvey, D.J.; Truscott, T.G. The carotenoids as anti-oxidants. J. Photochem. Photobiol. B Biol. 1997, 41, 189–200. [Google Scholar] [CrossRef] [PubMed]
- Witt, H.T. Coupling of quanta, electrons, fields, ions, and phosphorylation in the functional membrane of photosynthesis. Q. Rev. Biophys. 1971, 4, 365–477. [Google Scholar] [CrossRef] [PubMed]
- Ferrieri, R.A.; Wolf, A.P. The chemistry of positron-emitting nucleogenic (hot) atoms with regard to preparation of labeled compounds of practical utility. Radiochim. Acta 1983, 34, 69–83. [Google Scholar] [CrossRef]
- Ferrieri, R.A. Production and Application of Synthetic Precursors Labeled with Carbon-11 and Fluorine-18. In Handbook of Radiopharmaceuticals: Radiochemistry and Applications; Welch, M.J., Redvanly, C.S., Eds.; John Wiley & Sons, Ltd.: Chichester, UK, 2003. [Google Scholar]
- Ferrieri, R.A.; Gray, D.W.; Babst, B.A.; Schueller, M.J.; Schlyer, D.J.; Thorpe, M.R.; Orians, C.M.; Lerdau, M. Use of carbon-11 in Populus shows that exogenous jasmonic acid increases biosynthesis of isoprene from recently fixed carbon. Plant Cell Environ. 2005, 25, 591–602. [Google Scholar] [CrossRef]
- Burnell, J.N. The biochemistry of manganese in plants. In Manganese in Soils and Plants; Graham, R.D., Hannam, J., Uren, N.C., Eds.; Kluwer Academic Publishers: Dordrecht, The Netherlands, 1988; pp. 125–133. [Google Scholar]
- Alejando, S.; Holler, S.; Meier, B.; Peiter, E. Manganese in plants: Acquisition to subcellular allocation. Front. Plant Sci. 2020, 11, 300. [Google Scholar] [CrossRef] [PubMed]
- Yachandra, V.K.; Sauer, K.; Klein, M.P. Manganese cluster in photosynthesis: Where plants oxidize water to dioxygen. Chem. Rev. 1996, 96, 2927–2950. [Google Scholar] [CrossRef] [PubMed]
- Housh, A.B.; Waller, S.; Sopko, S.; Powell, A.; Benoit, M.; Wilder, S.L.; Guthrie, J.; Schueller, M.J.; Ferrieri, R.A. Azospirillum brasilense bacteria promotes Mn2+ uptake in maize with benefits to leaf photosynthesis. Microorganisms 2022, 10, 1290. [Google Scholar] [CrossRef] [PubMed]
- U.S. Environmental Protection Agency Office of Solid Waste and Emergency Response. Environmental Protection Agency Office of Solid Waste and Emergency Response. Ecological Soil Screening Levels for Manganese (OSWER Directive 9285.7-71); U.S. Environmental Protection Agency Office of Solid Waste and Emergency Response: Washington, DC, USA, 2007.
- Noel, R.; Benoit, M.; Wilder, S.L.; Waller, S.; Schueller, M.; Ferrieri, R.A. Treatments with liquid smoke and certain chemical constituents prevalent in smoke reduce phloem vascular sectoriality in the sunflower with improvement to growth. Int. J. Mol. Sci. 2022, 23, 12468. [Google Scholar] [CrossRef] [PubMed]
- Radalla, A.M. Studies on Complexation of resorcinol with some divalent transition metal ions and aliphatic dicarboxylic acids in aqueous media. J. Solut. Chem. 2010, 39, 1394–1407. [Google Scholar] [CrossRef]
- Zhang, L.; Guan, Q.; Jiang, J.; Khan, M.S. Tannin complexation with metal ions and its implication on human health, environment and industry: An overview. Int. J. Biol. Macromol. 2023, 253, 127485. [Google Scholar] [CrossRef]
- Karipcin, F.; Dede, B.; Percin-Ozkorucuklu, S.; Kabalcilar, E. Mn(II), Co(II) and Ni(II) complexes of 4-(2-thiazolylazo)resorb.;inol: Syntheses, characterization, catalase-like activity, thermal and electrochemical behaviour. Dye. Pigment. 2010, 84, 14–18. [Google Scholar] [CrossRef]
- Fačkovcová, Z.; Vannini, A.; Monaci, F.; Grattacaso, M.; Paoli, L.; Loppi, S. Uptake of trace elements in the water fern Azolla filiculoides after short-term application of chestnut wood distillate (pyroligneous acid). Plants 2020, 9, 1179. [Google Scholar] [CrossRef] [PubMed]


| Mean Actual Amount a | Standard Error | Mean Calculated Amount b | Standard Error | Ratio Calc./Actual | Propagated Error | Fold Change in Metabolic Turnover c | Propagated Error | |
|---|---|---|---|---|---|---|---|---|
| Chl a | ||||||||
| Untreated | 0.84 | 0.02 | 3.52 | 0.74 | 4.19 | 0.89 | 2.17 | 0.57 |
| Treated | 1.16 | 0.05 | 10.53 | 1.52 | 9.08 | 1.37 | ||
| Chl b | ||||||||
| Untreated | 0.28 | 0.01 | 0.88 | 0.14 | 3.14 | 0.51 | 2.11 | 0.52 |
| Treated | 0.34 | 0.01 | 2.26 | 0.41 | 6.65 | 1.22 | ||
| β-Car | ||||||||
| Untreated | 0.69 | 0.04 | 11.06 | 1.33 | 16.03 | 2.14 | 3.85 | 0.74 |
| Treated | 0.84 | 0.05 | 51.84 | 6.39 | 61.71 | 8.45 |
Disclaimer/Publisher’s Note: The statements, opinions and data contained in all publications are solely those of the individual author(s) and contributor(s) and not of MDPI and/or the editor(s). MDPI and/or the editor(s) disclaim responsibility for any injury to people or property resulting from any ideas, methods, instructions or products referred to in the content. |
© 2024 by the authors. Licensee MDPI, Basel, Switzerland. This article is an open access article distributed under the terms and conditions of the Creative Commons Attribution (CC BY) license (https://creativecommons.org/licenses/by/4.0/).
Share and Cite
Noel, R.; Schueller, M.J.; Ferrieri, R.A. Radiocarbon Flux Measurements Provide Insight into Why a Pyroligneous Acid Product Stimulates Plant Growth. Int. J. Mol. Sci. 2024, 25, 4207. https://doi.org/10.3390/ijms25084207
Noel R, Schueller MJ, Ferrieri RA. Radiocarbon Flux Measurements Provide Insight into Why a Pyroligneous Acid Product Stimulates Plant Growth. International Journal of Molecular Sciences. 2024; 25(8):4207. https://doi.org/10.3390/ijms25084207
Chicago/Turabian StyleNoel, Randi, Michael J. Schueller, and Richard A. Ferrieri. 2024. "Radiocarbon Flux Measurements Provide Insight into Why a Pyroligneous Acid Product Stimulates Plant Growth" International Journal of Molecular Sciences 25, no. 8: 4207. https://doi.org/10.3390/ijms25084207
APA StyleNoel, R., Schueller, M. J., & Ferrieri, R. A. (2024). Radiocarbon Flux Measurements Provide Insight into Why a Pyroligneous Acid Product Stimulates Plant Growth. International Journal of Molecular Sciences, 25(8), 4207. https://doi.org/10.3390/ijms25084207