Article

Macrozoobenthic Diversity along an Oxygen Gradient in the Deep Trough of the Gulf of St. Lawrence (Canada)

Leibniz-Institute for Baltic Sea Research, Seestraße 15, 18119 Rostock, Germany
*
Author to whom correspondence should be addressed.
Diversity 2023, 15(7), 854; https://doi.org/10.3390/d15070854
Submission received: 1 June 2023 / Revised: 7 July 2023 / Accepted: 11 July 2023 / Published: 14 July 2023

Abstract

:
In 2015, we studied the macrozoobenthic community composition along a dissolved oxygen gradient in the deep trough of the Gulf of St. Lawrence (Canada). We sampled the seabed at nine stations using box corers (three replicates per station), starting in the outer Gulf and ending in the Lower St. Lawrence River Estuary. We found four different communities dominated by polychaetes, crustaceans, and molluscs, with the emphasis shifting from mollusc to polychaete communities as oxygen saturation decreased. Contrary to our expectations, the stations furthest upstream in the estuary with the lowest oxygen saturation levels had the highest species diversity, and also the highest density and biomass values. Key genera of the hypoxic zone included bivalves (Thyasira), cumaceans (Diastylis), amphipods (Harpinia), and polychaetes such as Ampharete, Ceratocephale, Galathowenia, and Trochochaeta. We attribute this to the stability of the environmental conditions and the absence of stress, where the constant supply of oxygen, even at low concentrations, seems to be more important than the absolute oxygen concentration.

1. Introduction

Climate change and its effects on the stratification of water masses make oxygen deficiency an increasing problem for benthic organisms worldwide, especially in coastal seas. This affects the estuaries of large rivers with their high nutrient loads, as well as upwelling areas on the west coasts of the continents, e.g., [1,2,3,4,5]. Tolerance to low oxygen is greater for smaller taxa than for larger ones, and greater for less-mobile taxa than for mobile ones. Climate change is therefore likely to lead to shifts in the relative abundance of species due to oxygen deficiency [6]. Minimum oxygen requirements for survival vary between species. The duration, periodicity, and severity of low oxygen concentrations have a significant influence on survival and activity. Apart from environmental factors, different survival strategies of organisms have developed, which have occasionally led to the evolutionary adaptation of zoobenthos in oxygen-minimum zones [7,8,9]. This can occur, for example, by means of symbioses or physiological mechanisms. For instance, in the Baltic Sea, a relatively young sea of 8000 years with an estuarine character, hardly any such mechanism can be observed, so that a large part of the benthic community disappears during regularly observed periods of oxygen deficiency with values below 1 mL per litre, e.g., [10]. However, in the geologically old (several million years) upwelling area off Namibia [11], it was observed that, even at the lowest oxygen concentrations of less than 0.02 mL per litre (!), diverse benthic life still prospers, e.g., [12]. Compared with a few days of anoxia in the Baltic, leading to population breakdown, such phases in the upwelling area off Namibia can last several weeks without drastic effects on macrobenthos populations. Results on structural adaptations of macrofauna communities are also reported from other upwelling areas, such as off Chile [13,14]. In order to classify the resilience of estuarine benthic populations in a system that is geologically older than the Baltic Sea, but younger than the upwelling regions on the continental west coasts, this study was carried out in the Laurentian Trough, a 300–500 m deep submarine valley that traverses the Estuary and Gulf of St. Lawrence on the Canadian east coast, and intersects the continental shelf (Figure 1). The deep water in the trough derives from the northwestern Atlantic, and as it flows slowly inland, it loses oxygen by respiration, resulting in a negative gradient of dissolved oxygen from east to west. For decades, there has been a decreasing trend in the average oxygen supply, especially in the deeper reaches of the Lower St. Lawrence River Estuary (LSLE) and the Gulf, e.g., [15,16]. The reasons are both due to physical and biogeochemical processes, but are weighted and discussed quite differently [17,18]. The persistence of hypoxic conditions in the LSLE and Gulf is due to the year-round stratification of the water column and estuarine circulation [16,19,20]. The benthos in the inner part of the estuary (LSLE) is regularly affected by hypoxia (<20% saturation), whereas, in the middle part, rather moderate oxygen values, and in the outer part, good saturation values are sustained; see [21]. As other environmental variables apart from depth and oxygen did not differ very much, this transect provided a suitable proving ground for our study.
Brunel et al. [22] summarised in their catalogue the knowledge on marine invertebrates gained from more than 100 years of research in the St. Lawrence Estuary area. This inventory yielded more than 2200 species, subspecies, and varieties, a large proportion of which can be attributed to the benthic habitat. Over the last 20 years, research has focused increasingly on the changing oxygen conditions of the Estuary and Gulf and the resulting impact on marine life. In general, the effects of oxygen deficiency on the marine environment depend on the oxygen concentration and the sensitivity of the species. But, as the former comparison between different oxygen-minimum areas indicates, additional adaptational factors may impact the response as well. While the influence of the oxygen gradient in the St. Lawrence River Estuary and the Gulf of St. Lawrence on the epibenthic and fish fauna has been relatively well studied, information on the endobenthic communities is almost lacking [21,23,24,25,26,27,28,29].
We therefore investigated the distribution patterns of endo- and epibenthic species in the central Laurentian Channel considering the traditional hypothesis that oxygen concentration is one of the most important environmental variables influencing the density and diversity of benthic macrofauna [5], and that, therefore, the hypoxic region of the Lower St. Lawrence Estuary (LSLE) should have lower species richness and species diversity than the normoxic regions in the Gulf of St. Lawrence (GSL).

2. Materials and Methods

2.1. Study Area

The Estuary and Gulf of St. Lawrence (EGSL) is located on the southeast coast of Canada (Province of Quebec) in the North Atlantic. The EGSL has two major connections with the Atlantic Ocean, through the Cabot and Belle-Isle straits, and receives significant freshwater inflows, mainly from the St. Lawrence River (Figure 1).
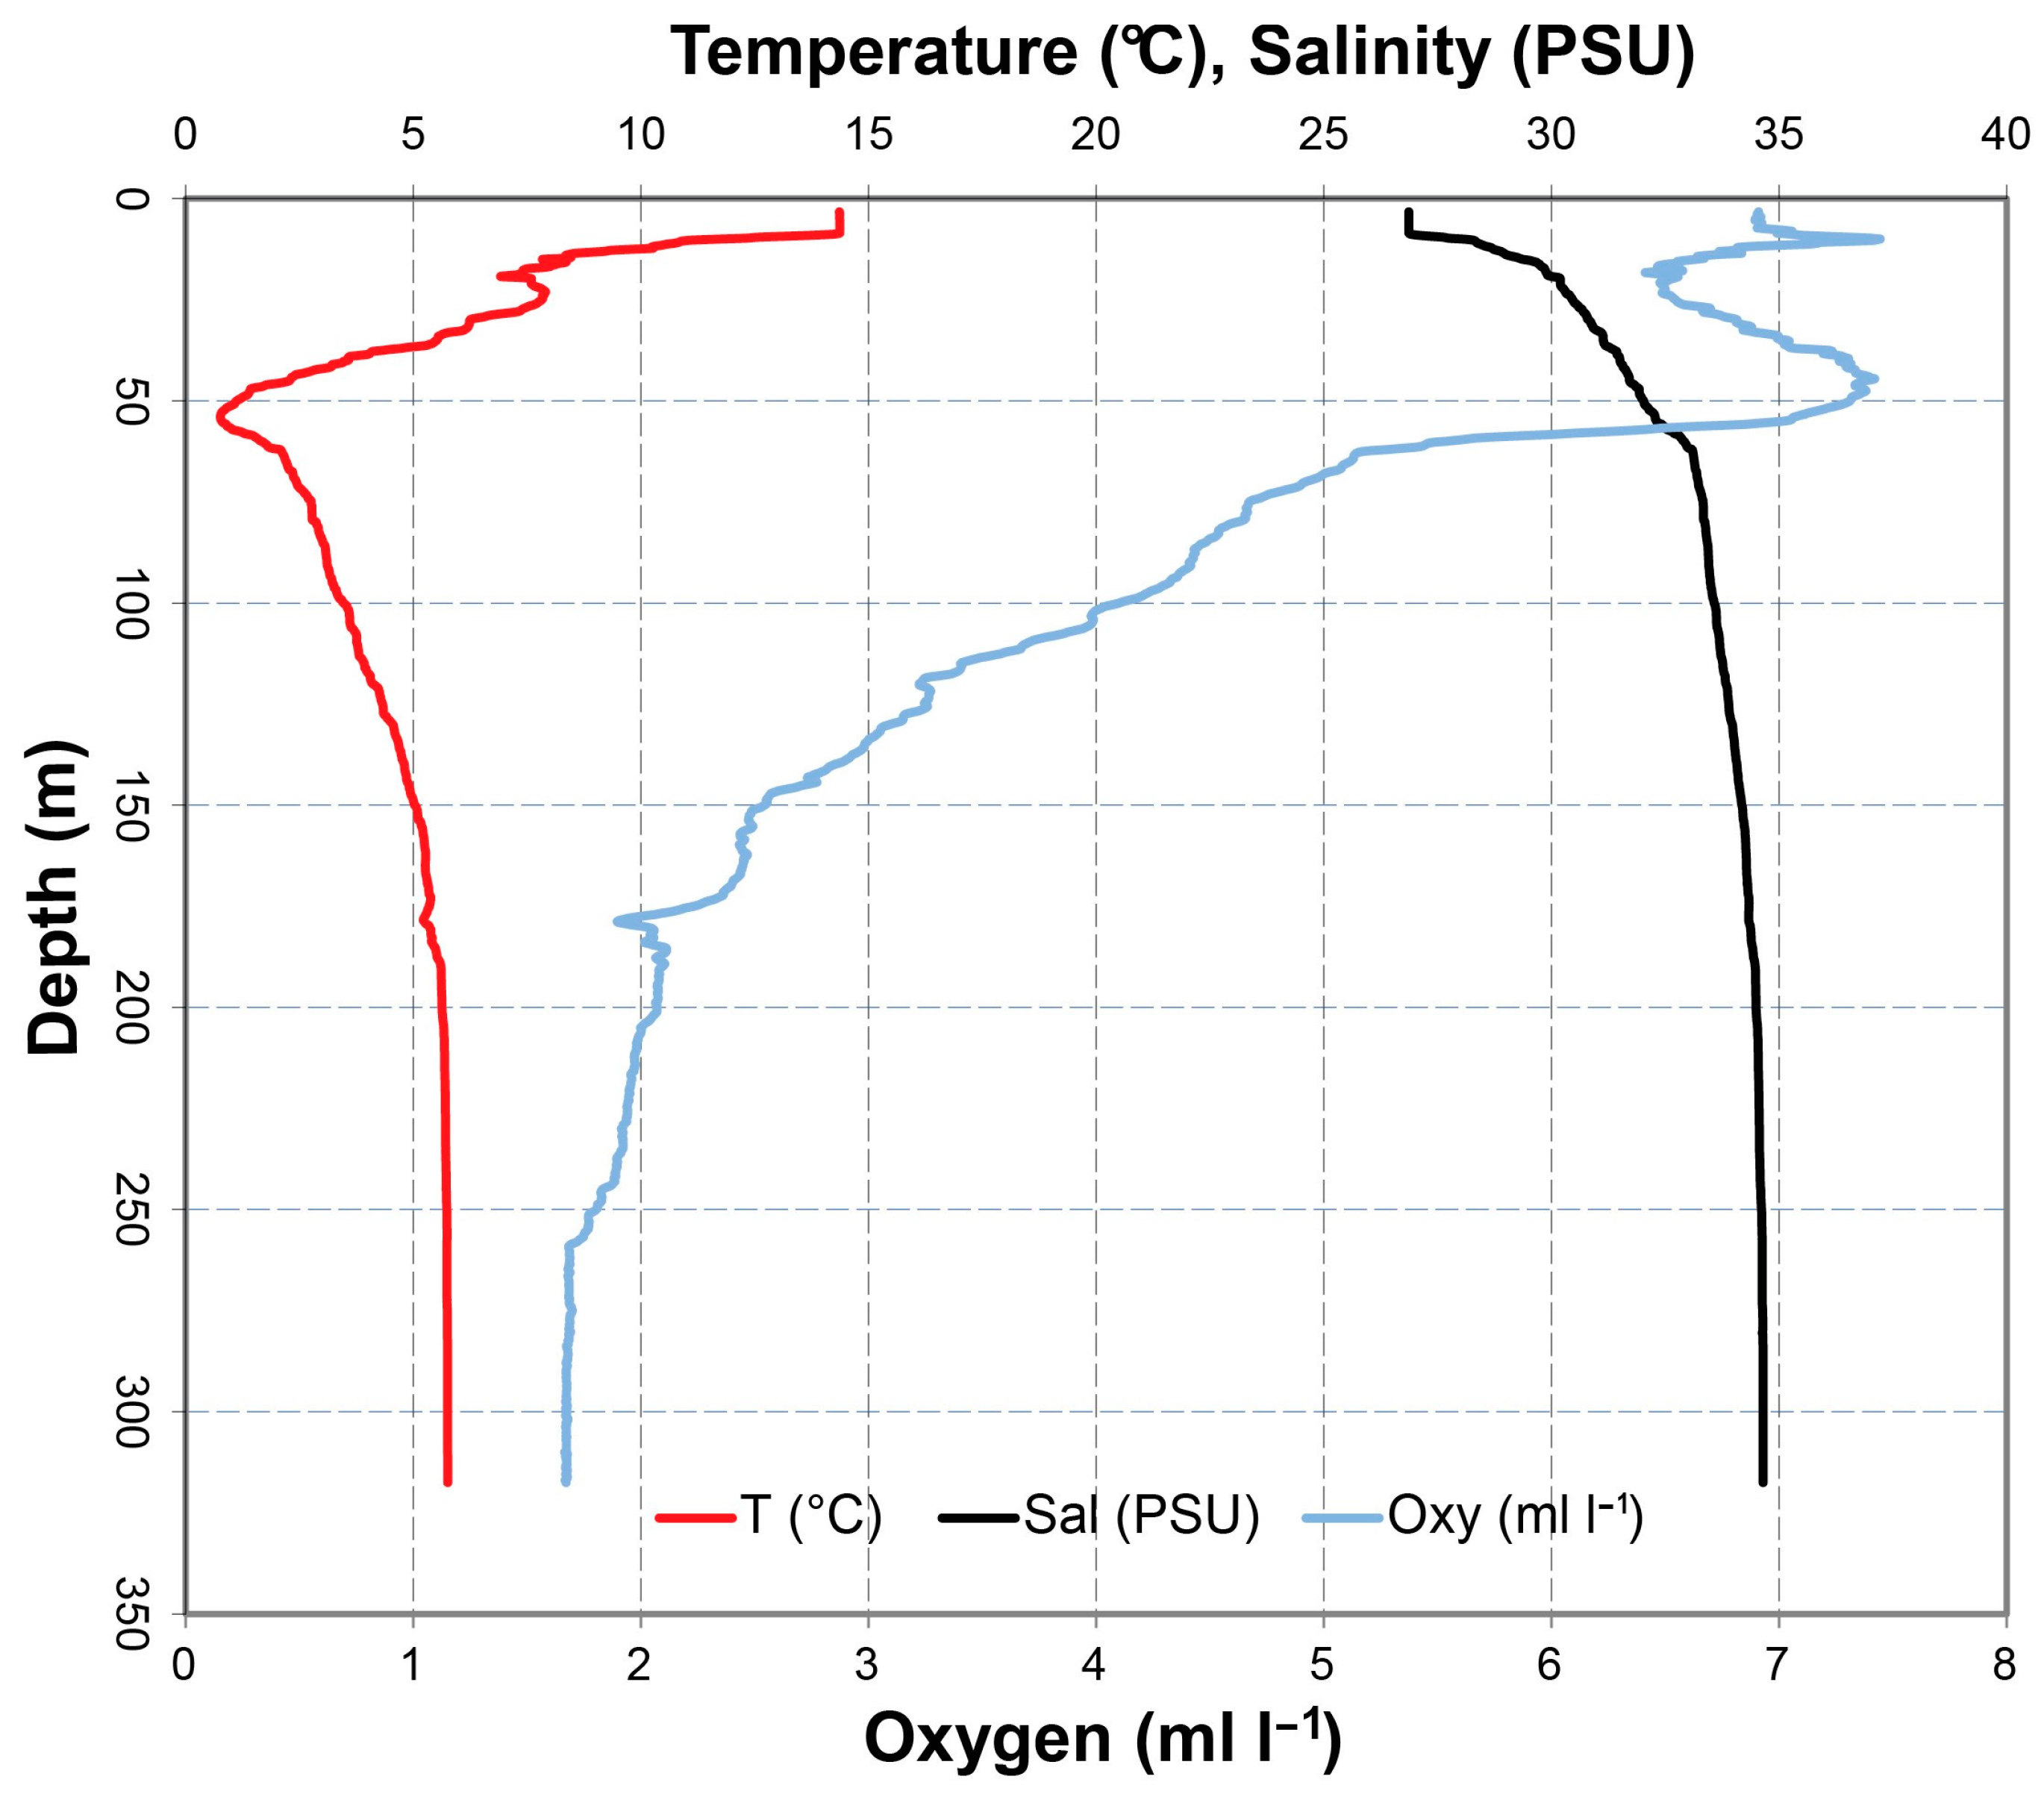
The bathymetry of the Gulf is characterised by the deep Laurentian Channel, with a maximum depth of 535 m. A cold layer (1 to 2 °C) situated between 50 and 60 m separates the warmer mixed surface (14 °C in summer) and deep (6 °C) layers (Figure 2).
Estuarine circulation occurs by water flowing seaward in the surface layer and landward in the deep layers [20]. The seabed of the deep Laurentian Channel is relatively homogeneous and consists of fine mud [30].
The effect of benthic respiration can be observed in the profiles of the apparent oxygen utilisation (AOU) along the stations (Figure 3). This difference between the current oxygen content and the saturation value (the oxygen content at the time of surface water mass formation) shows the oxygen decrease in the bottom water during the landward flow of the water mass from the open ocean by close to 90%.

2.2. Sampling

Macrozoobenthos samples were obtained along a transect (see Figure 1) on board of the RV Maria S. Merian during the CECAS Expedition MSM46 (25 August 2015–26 September 2015). Biological studies included benthic macrofauna along the oxygen gradients from the Gulf of St. Lawrence (GSL) to the Lower St. Lawrence Estuary (LSLE). Triplicate benthic samples were taken with a 0.1 m2 box corer at each station. All samples were sieved through a 1 mm2 sieve and animals were preserved on board in 4% buffered formaldehyde. Sorting procedures were conducted at the laboratory with a Zeiss stereomicroscope Discovery V8 with 10–40× magnification. All macrofauna samples were identified to the lowest taxonomic level whenever possible. The nomenclature was checked following the World Register of Marine Species (WoRMS: http://www.marinespecies.org/index.php, accessed on 5 January 2023). Environmental variables, such as salinity, temperature, and oxygen concentration in the water column down to the sediment boundary, were recorded by means of a profiling CTD system (SBE 911, Seabird, Bellevue, WA, USA) with an attached oxygen probe (Seabird, Bellevue, WA, USA) and a 13-bottle sampling rosette. Oxygen sensors were calibrated by an immediate potentiometric Winkler titration of three samples per water column, including the closest position to the sediment, in the ship’s laboratory. An additional sediment sample was taken from the box corer to extract the upper surface sediment layer (≤20 mm) for analyses of the median grain size (laser particle sizer Cilas 1180L) and organic matter estimation by weight loss upon ignition (afdw).
Permit of the Department of Foreign Affairs, Trade, and Development of Canada: Note-Nr. IDR-1127.

2.3. Statistical Analyses

For each benthic sample, the density and biomass of the species were estimated. Following this, the replicate data were averaged to a total amount per square meter at each station (no pooling).
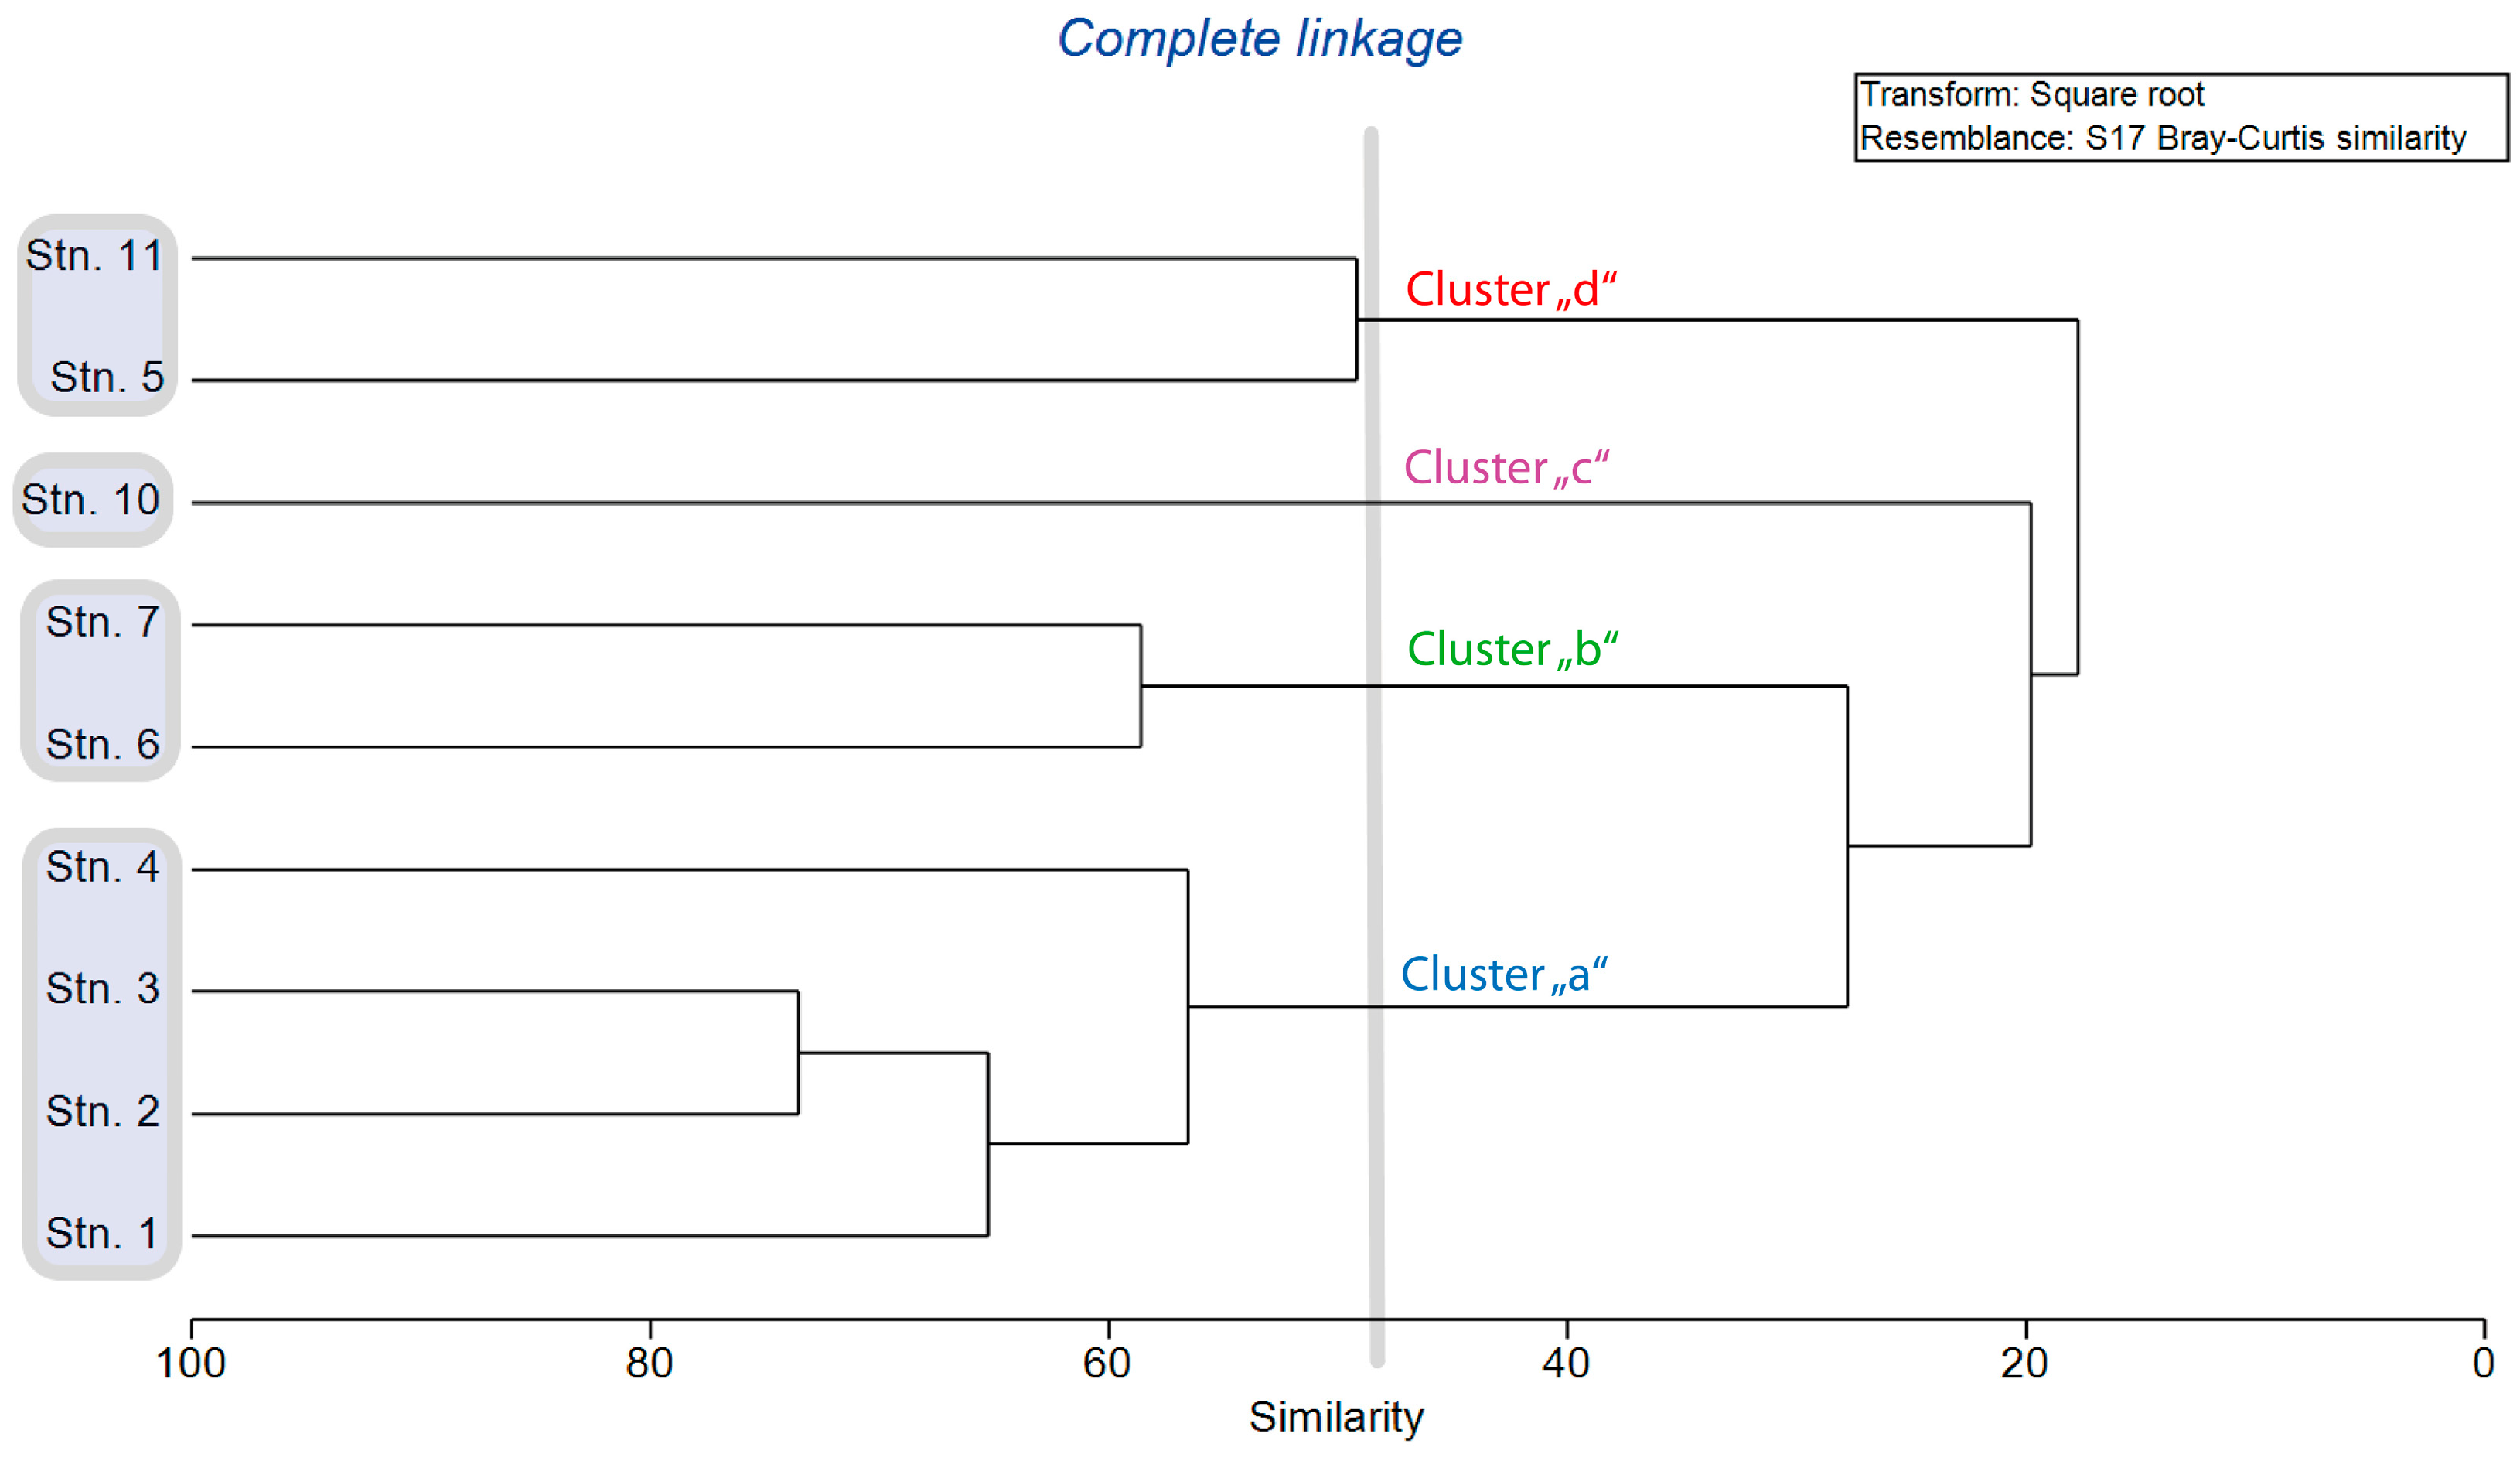
Multivariate analysis was conducted by complete linkage hierarchical clustering based on the Bray–Curtis similarities of the square-root-transformed density data for 9 stations. Superimposing the clustering results on nonmetric multidimensional scaling (nMDS) supported the validity of the classification of stations to 4 distinct benthic assemblages [31]. The significance of the classification results was tested with a one-way PERMANOVA based on the Bray–Curtis similarity matrix using 786 permutations. PERMANOVA is suitable for unbalanced data and heterogeneous dispersions among groups, and helps to avoid the normality assumption [32]. The species responsible for classification were determined by applying SIMPER exploratory analysis and visual re-examination of the modified data matrix, whereupon the benthic assemblages had been determined and described. The distance-based redundancy analysis (dbRDA) was performed to explore the relationship between the background oxygen concentration and other environmental variables with the ecological data from PRIMER; see [33]. We disregarded collinearity between environmental variables. It is important to note that we consider our statistical results as purely exploratory and descriptive, and acknowledge that our sampling size is too small to draw solid statistical relationships.

3. Results

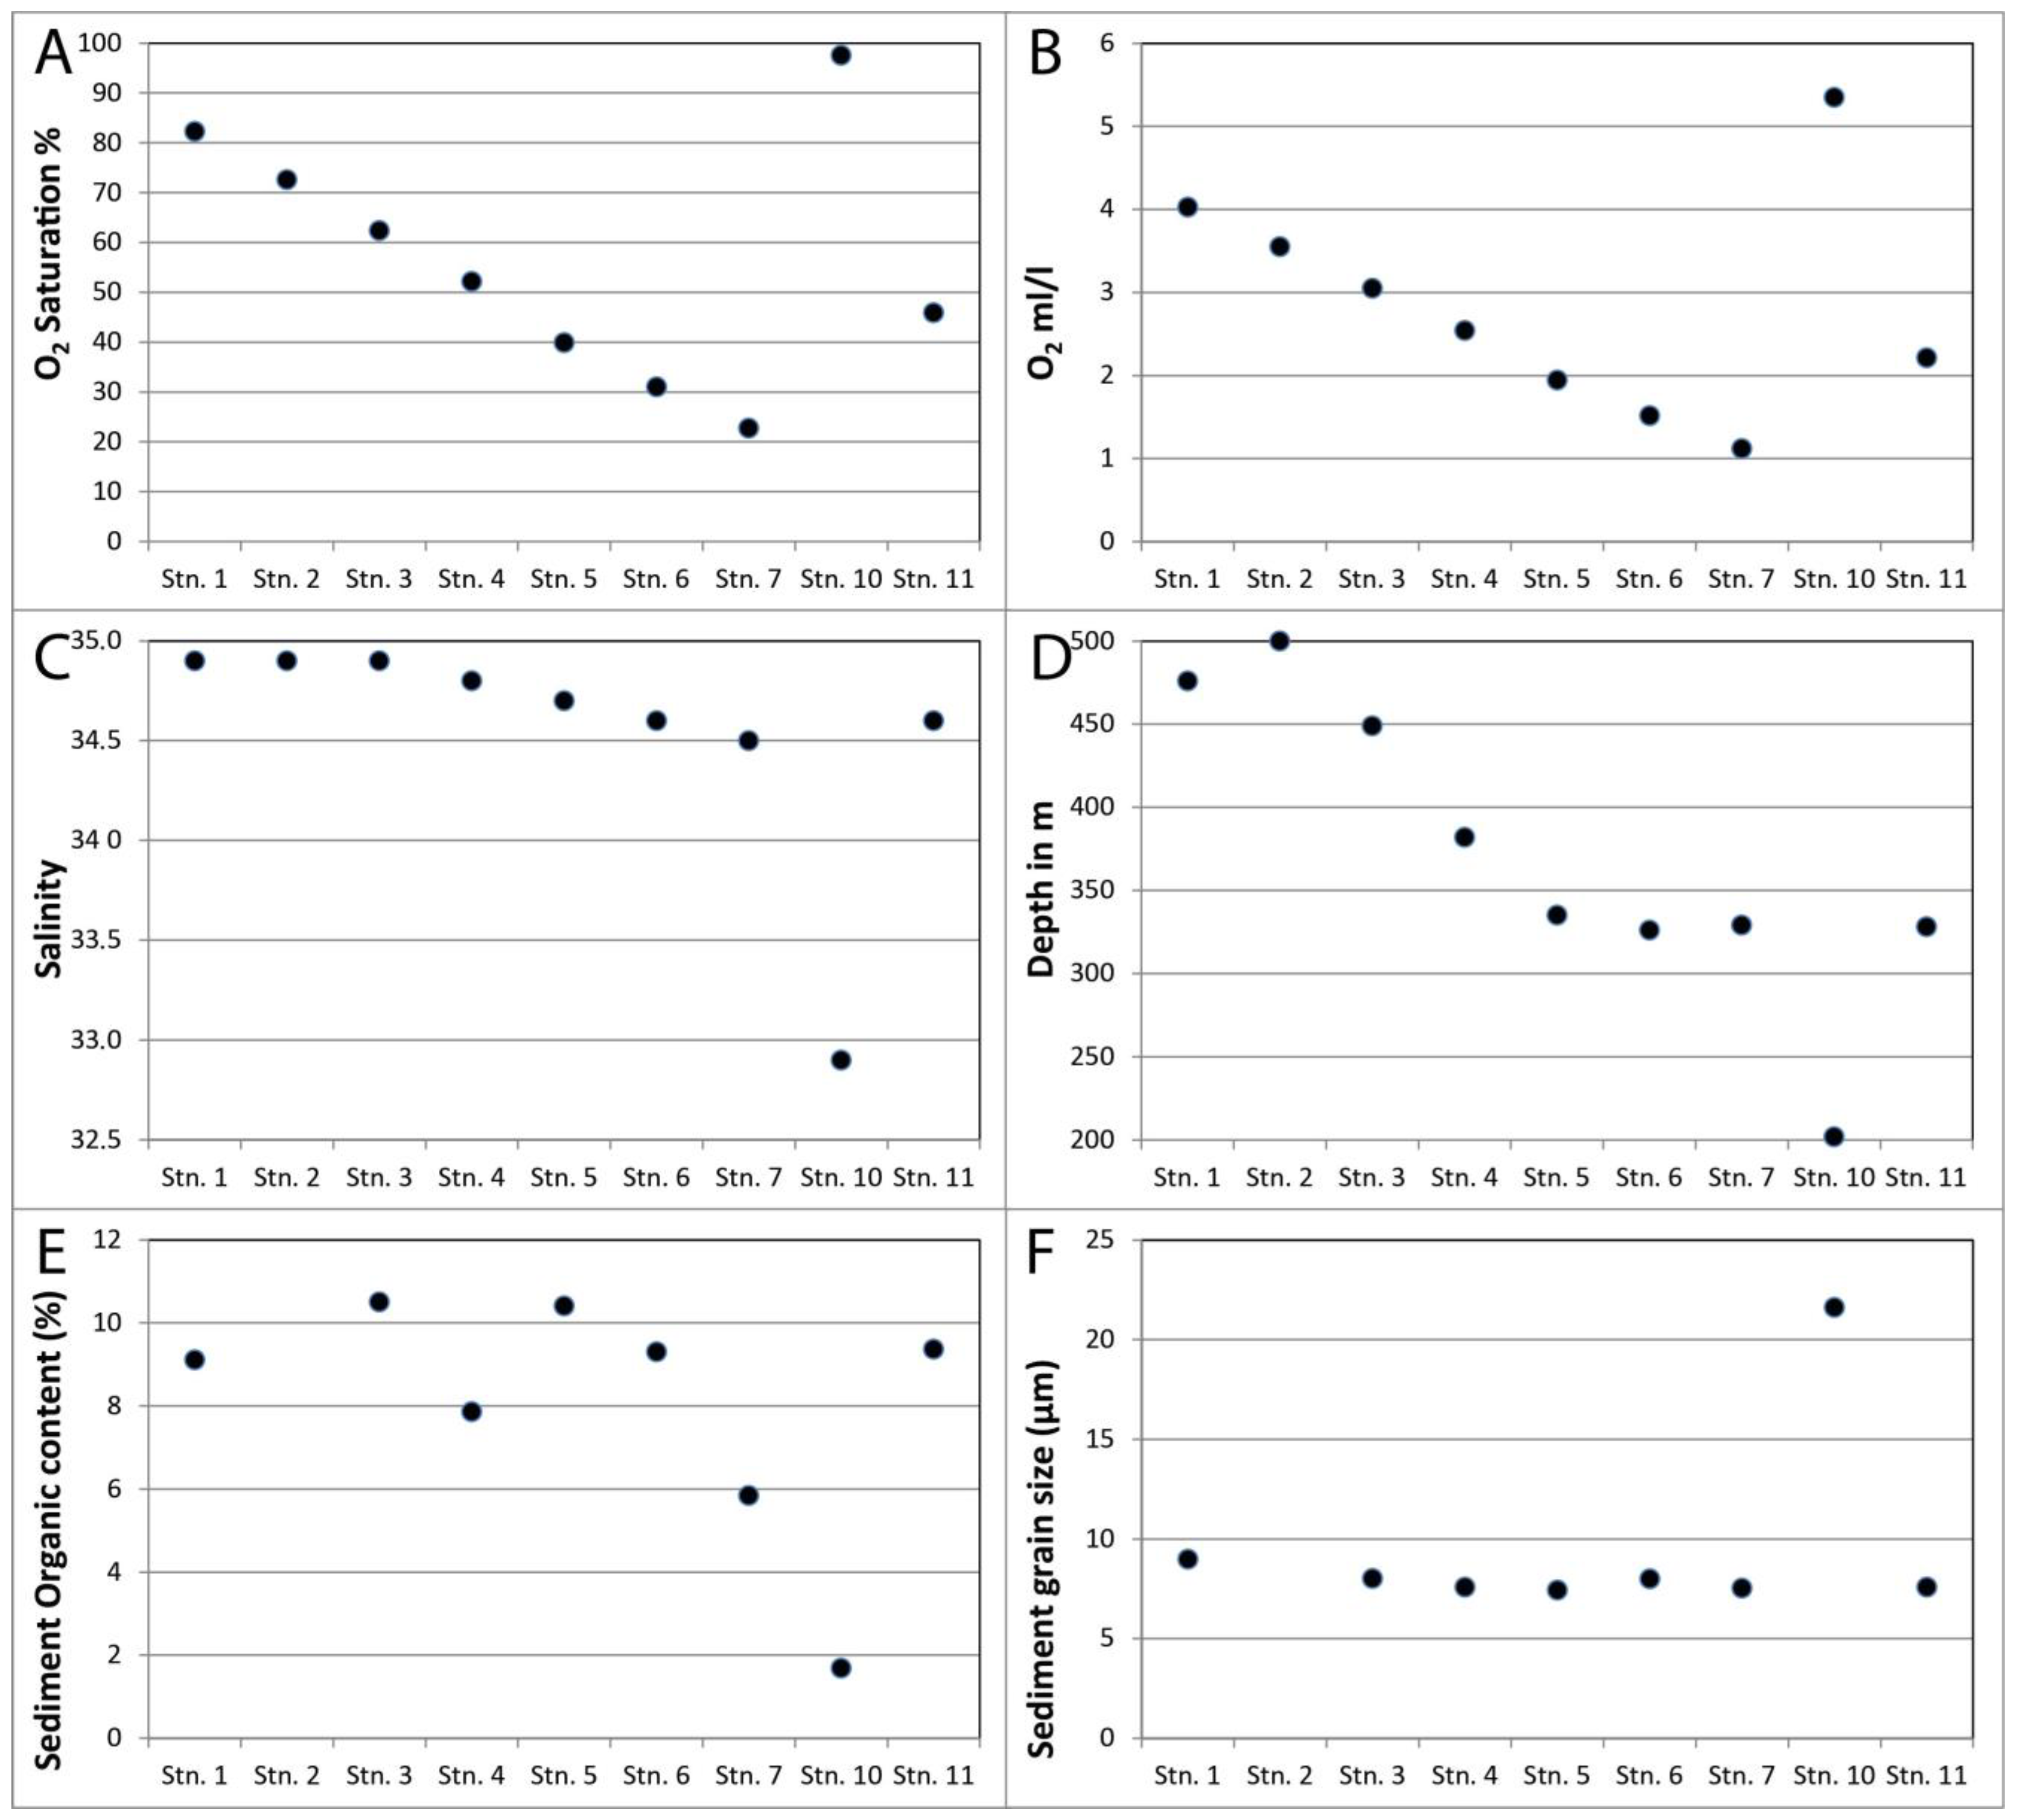
The environmental conditions for macrofauna were variable within the stations over the whole grid. Table 1 and Figure 4 display the characteristic values for the bottom-water and sediment variables of the stations sampled during this study. All stations > 300 m water depth showed a very homogeneous development of sediment characteristics and salinity. Only in the case of oxygen a gradient from west to east could be observed. The oxygen bottom-water concentrations varied between 1.12 and 5.35 mL L−1 over the stations. The onset of bottom-water oxygen deficiency (20 to 30% saturation) was observed only at the innermost stations of the estuary (see Figure 3). The organic content of the surface sediment varied between 1.69 and 10.5%. Except at the shallowest station, station 10 (outside the Laurentian Channel), the grain sizes were very similar, ranging from 7 to 9 µm.
The number of species is relatively high at most stations, ranging from 30 to 40 and with a Hurlbert index (ES50) between 15 and 20 (Figure 5A). The highest diversity was observed at station 6. Stations 5 and 11 were the least species-rich, with 18 and 21 taxa, respectively (Figure 5A). In terms of density, stations 5 and 11 were again conspicuous, with very low values (323 and 287 ind m−2, respectively); at all other stations, more than twice the density of individuals (1000 to 1500 ind m−2) was recorded (Figure 5B). With over 4500 individuals per square metre, station 7 clearly stands out. In terms of biomass, the highest values per square metre were observed at stations 4–10 (Figure 5B) with 48 to 78 g. At the other stations, the biomass varied between 4 and 6 g.
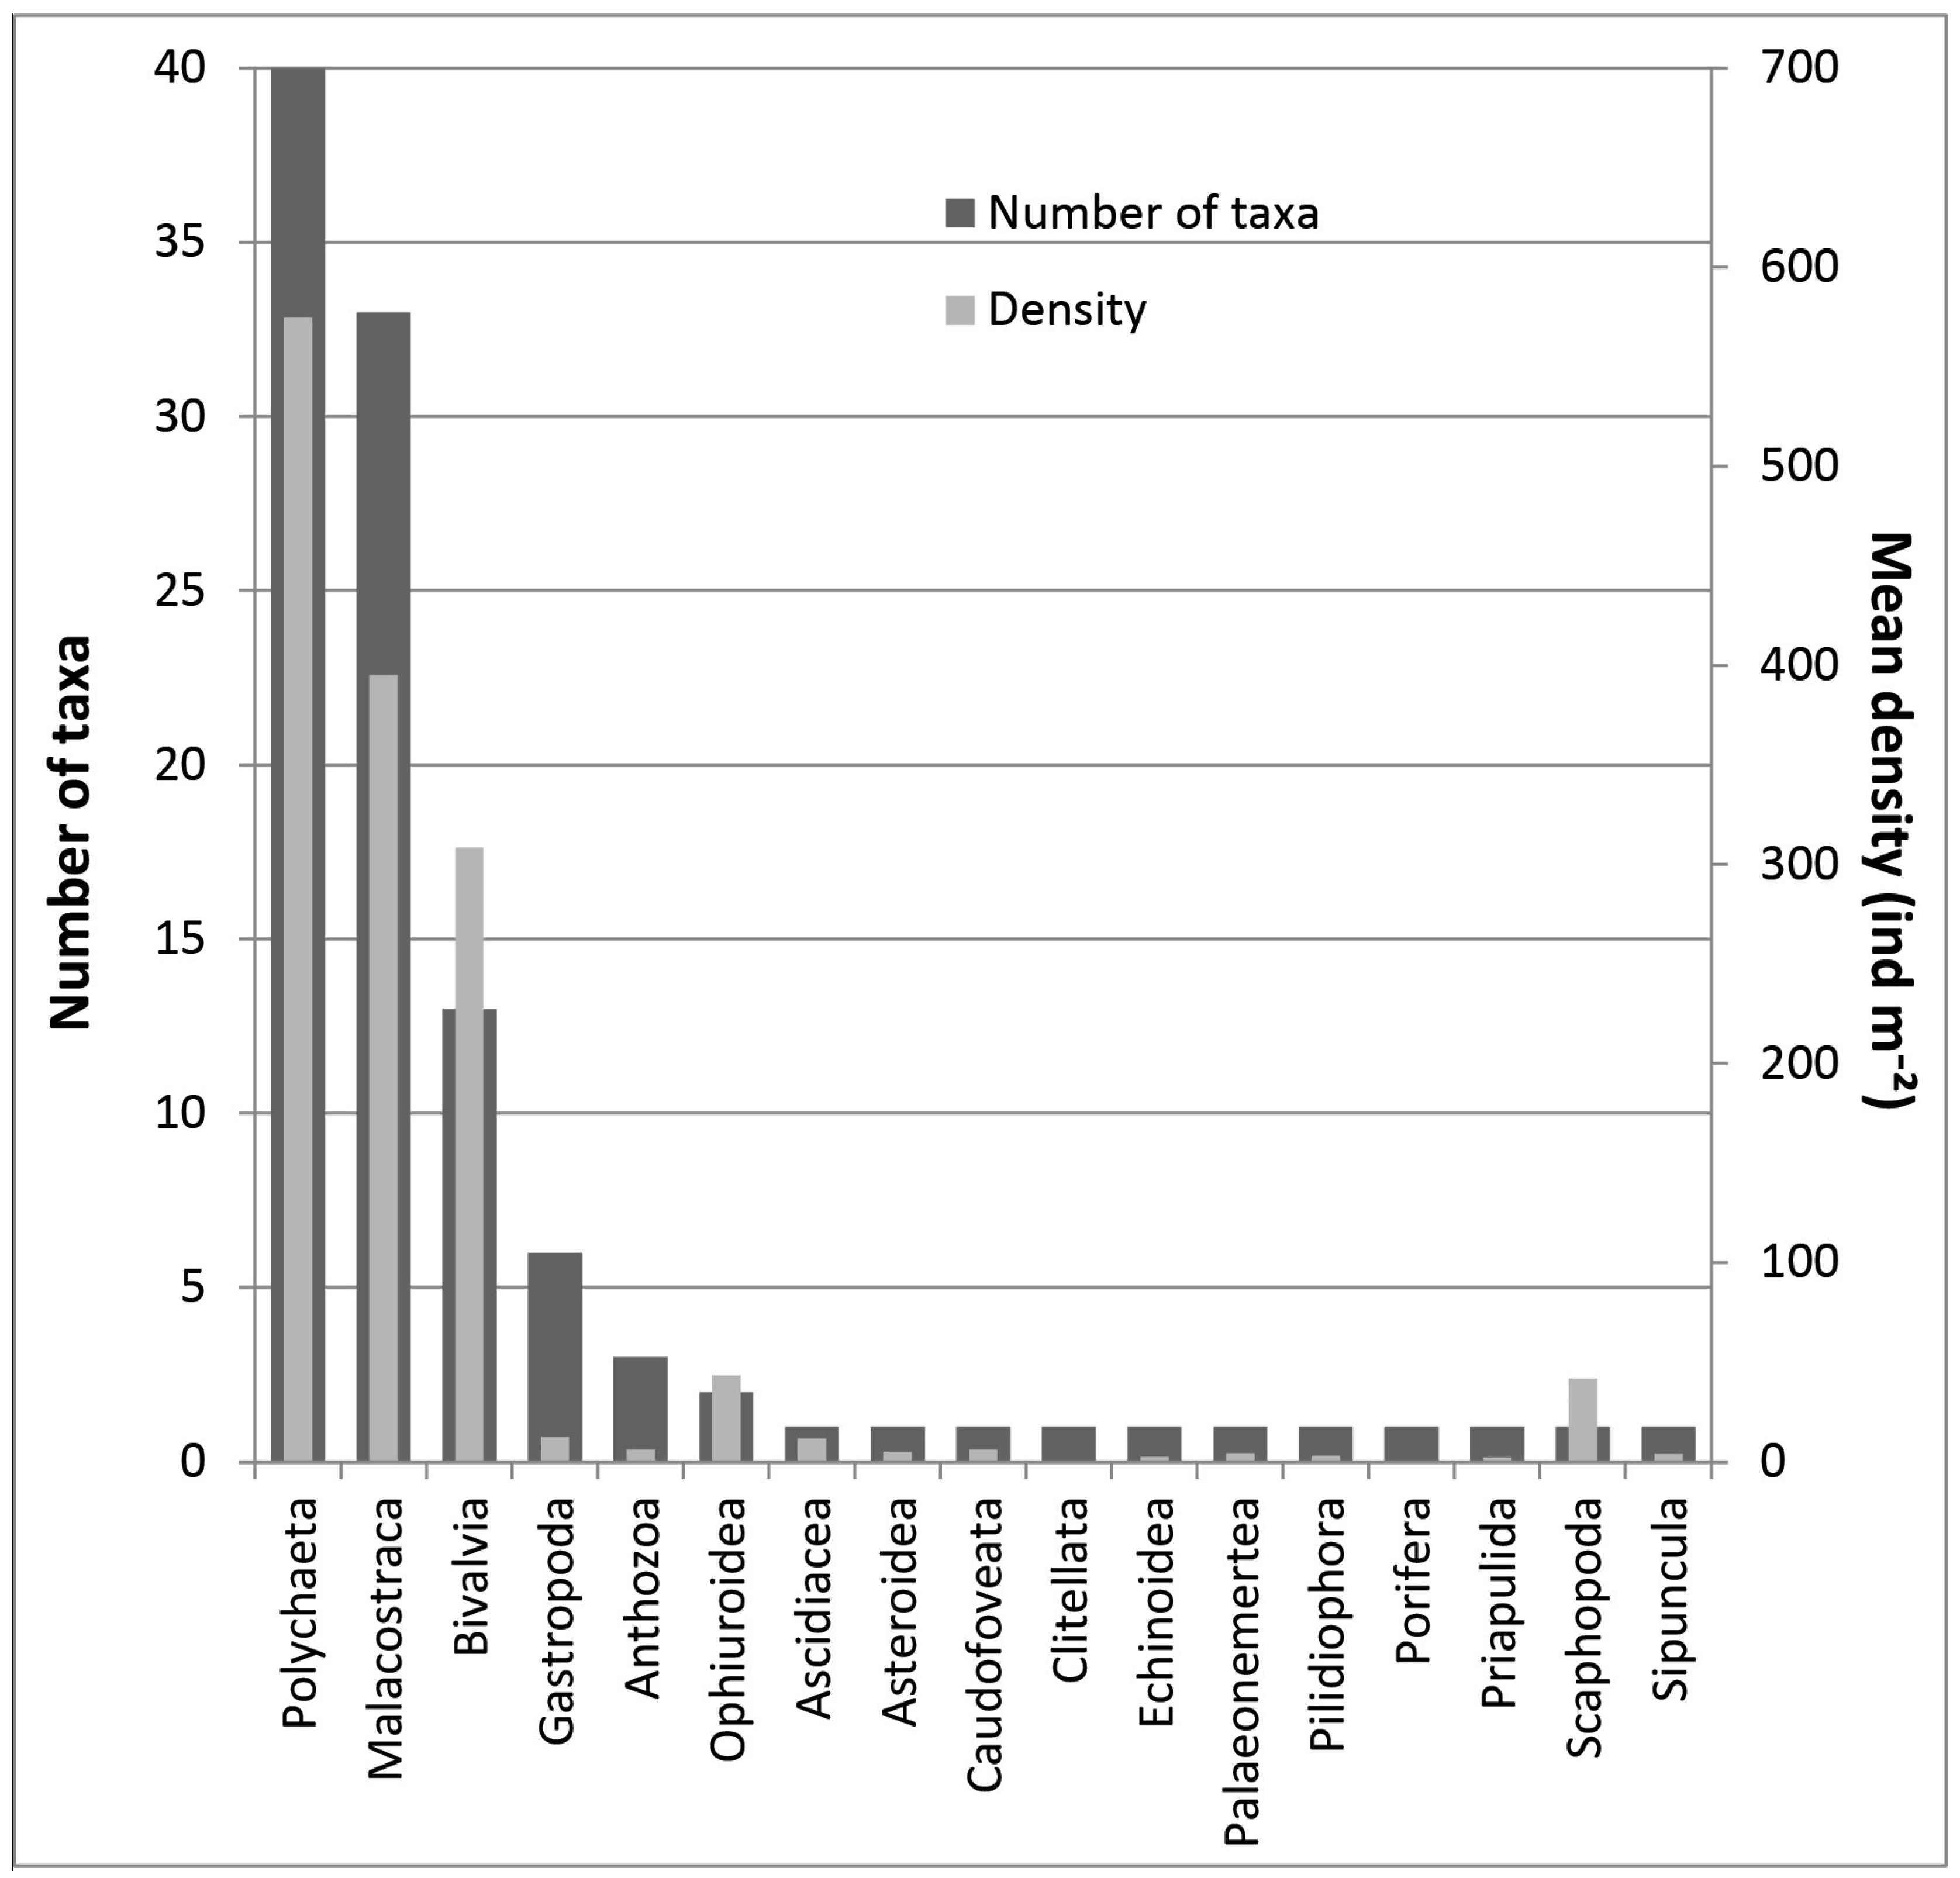
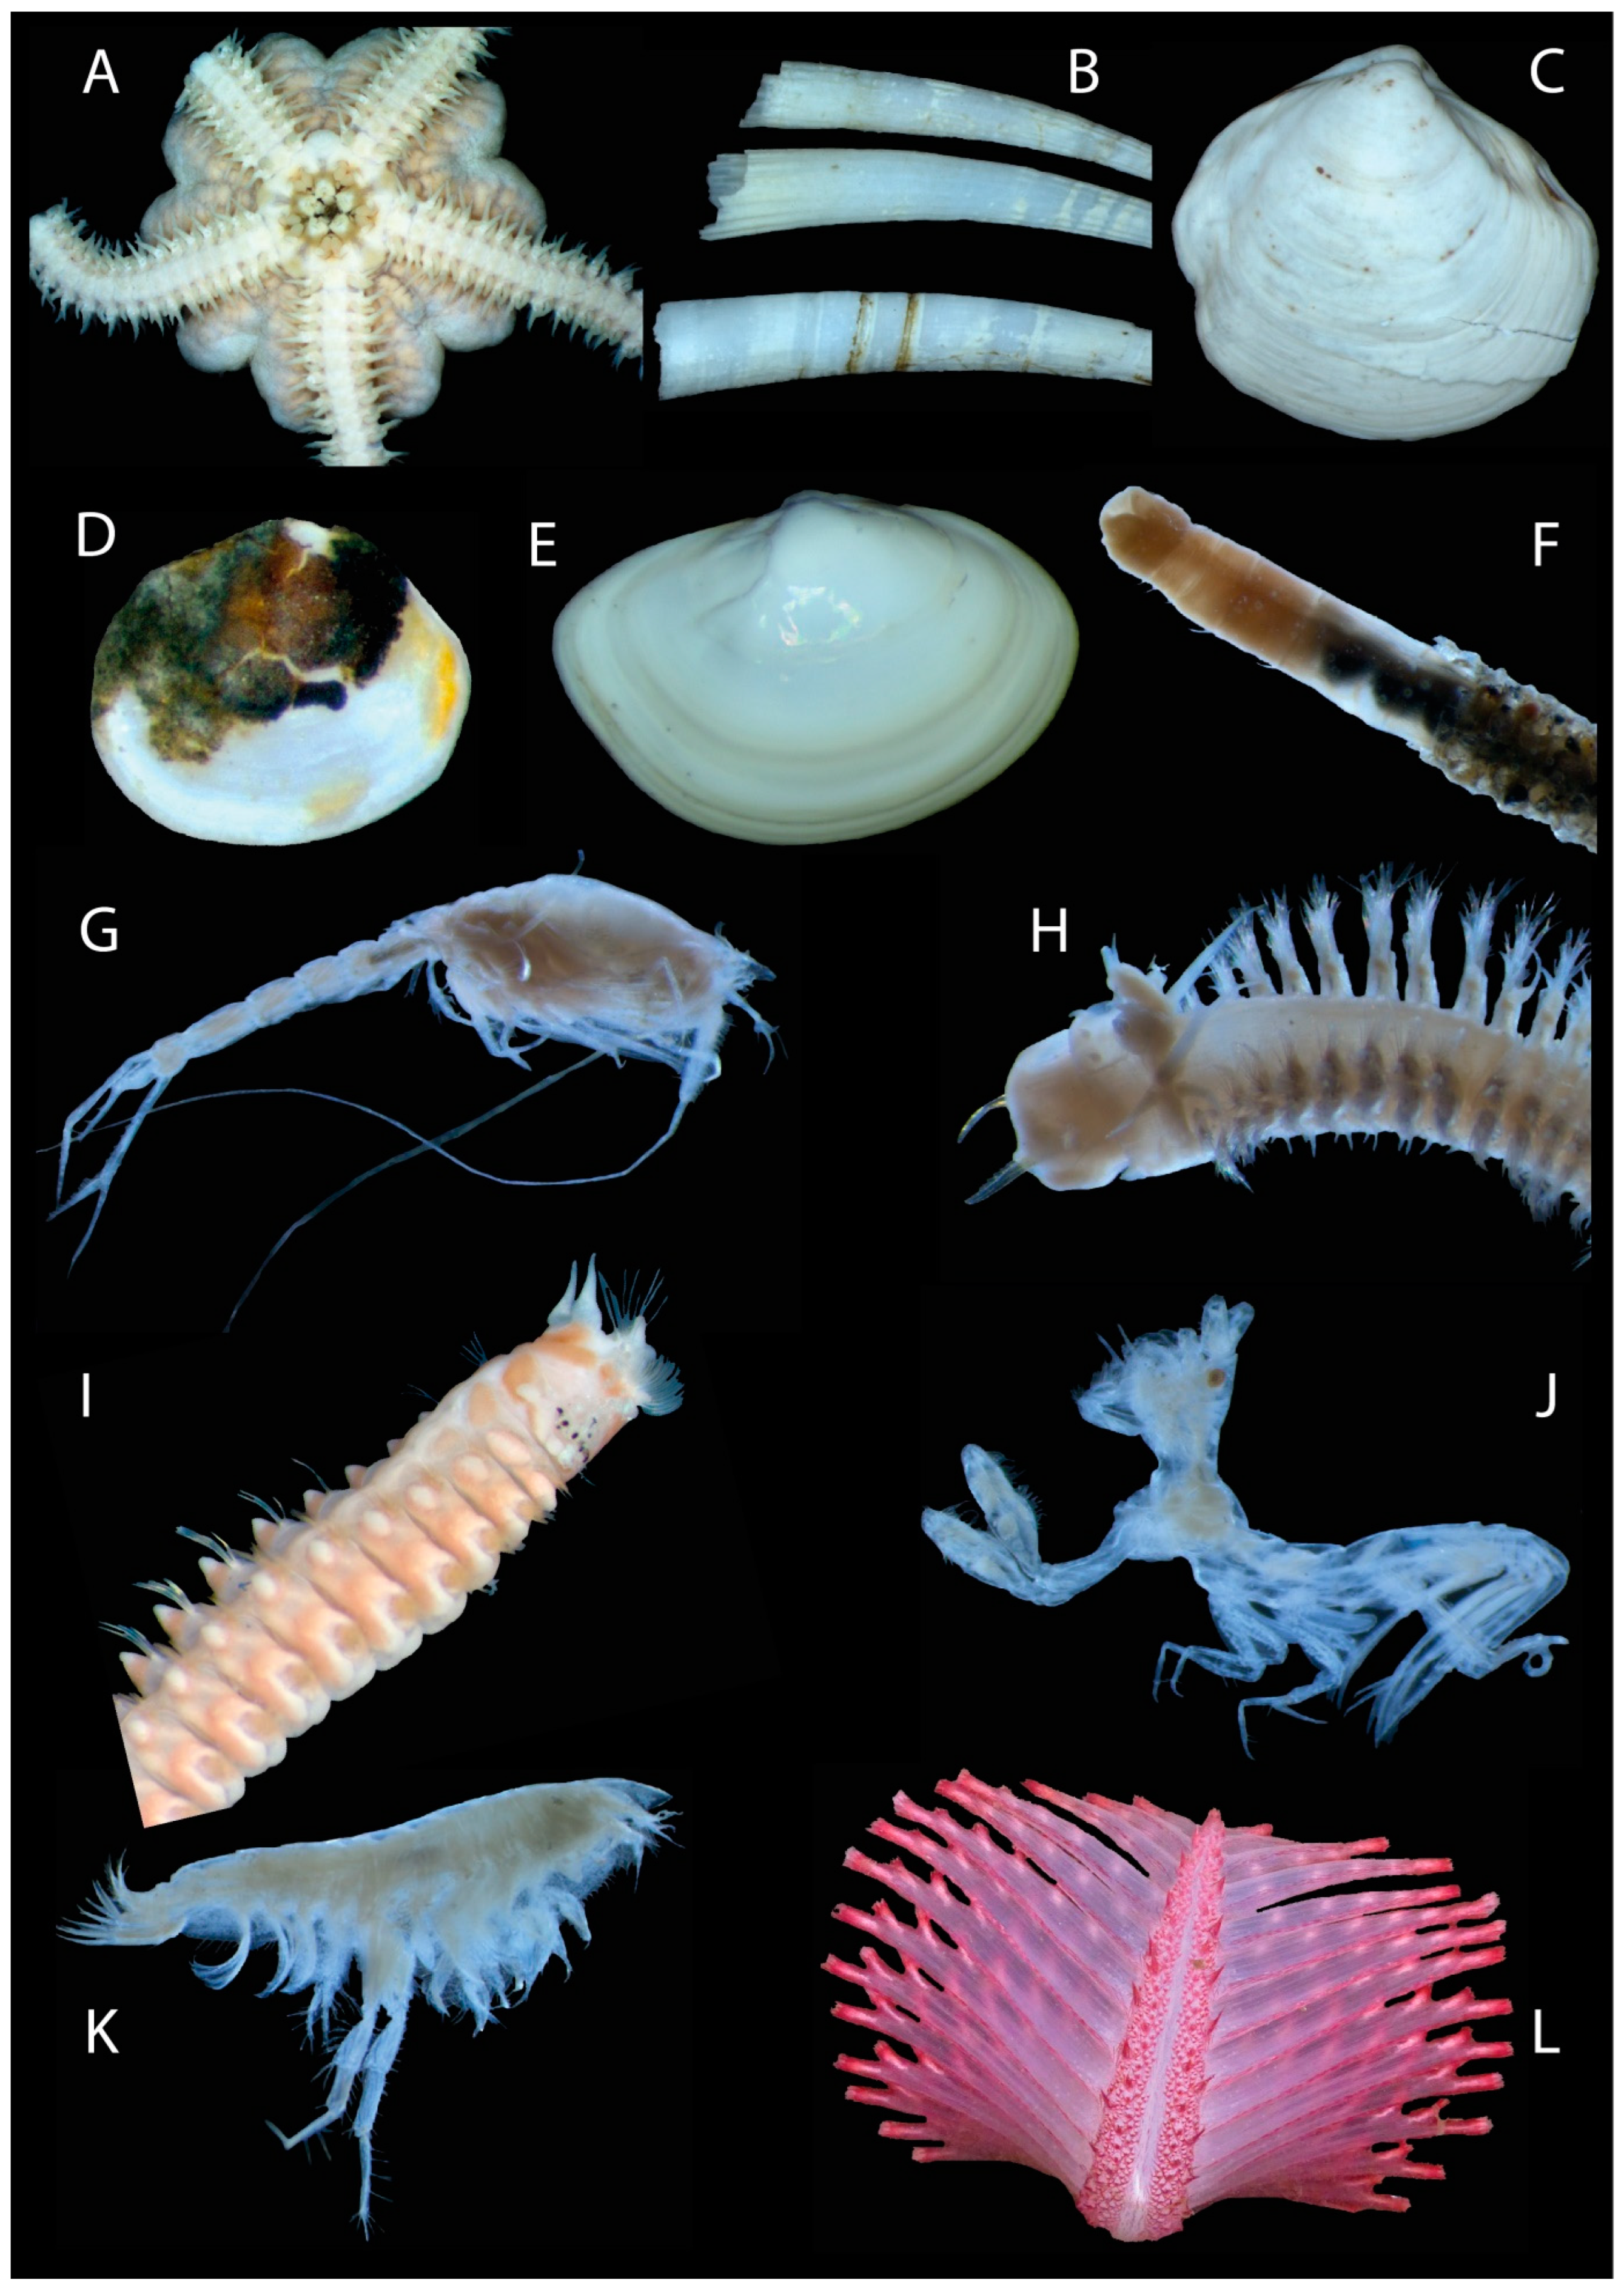
Although taxonomic identification could not be completed for all groups (due to the poor condition of some calcareous materials), we were able to present an extensive list of taxa. A total of 108 taxa were identified at the 9 stations surveyed. With 40 taxa, the Polychaeta were the most diverse class, followed by the Malacostraca (33 taxa) and the Bivalvia (13 taxa) (Figure 6). Except for Gastropoda (six), Anthozoa (three), and Ophiuroidea (two), all classes occurred with only one taxon. Twenty-four of these achieved a relative density of at least 5% in at least one station and are listed in the Table 2. Some of them are shown in Figure 7. Representatives of seven classes belong to the dominant taxa. Depending on the community, different species are characteristic. We found four different communities dominated by polychaetes, crustaceans, and molluscs, with the emphasis shifting from mollusc to polychaete communities as the oxygen saturation decreased. Among the bivalves, Mendicula ferruginosa (Forbes, 1844) and Thyasira sp. are particularly noteworthy. Within the crustaceans, the cumacean Diastylis abbreviata G.O. Sars, 1871 and D. goodsiri (Bell, 1855) play a major role, as do the amphipods Dyopedos monacanthus (Metzger, 1875) and Harpinia sp. The most comprehensive class is that of the polychaetes, from which Capitellidae, Ceratocephale loveni Malmgren, 1867, Galathowenia oculata (Zachs, 1923), and Prionospio steenstrupi Malmgren, 1867, among others, are to be highlighted. Finally, the epibenthic anthozoan Pennatula aculeata Danielssen, 1860 and the brittle star Amphiura sp. should be mentioned.
Four distinct communities could be distinguished during the study based on hierarchal clustering (Figure 8), nMDS (not shown here for brevity), and SIMPER results (Supplementary Data). Community structure differed significantly between the delineated communities (PERMANOVA F1,8 = 4.9, p = 0.001). At the entrance of the GSL (stations 1 to 4) in water depths between 382 and 500 m, and with an oxygen saturation ranging from 52 to 82%, the first community was separated by the similarity analysis (Figure 8). Diagnostic species were the amphipod Harpinia sp., the thyasirid bivalve Mendicula ferruginosa, and the scaphopod Antalis sp. The second cluster was situated in the innermost part of the LSLE (Stations 6 and 7) in water depths between 323 and 329 m and with an oxygen saturation ranging from 23 to 31%. The overall species diversity was highest. Characteristic taxa belonged mainly to polychaetes (Ampharete sp., Ceratocephale loveni, Cirratulidae, Galathowenia oculata, Lumbrineris sp., and Trochochaeta multisetosa (Örsted, 1844)) as well as the thyasirid bivalves M. ferruginosa and Thyasira sp. The third cluster consisted of only one station (stn. 10), which is outside the Laurentian Channel in more shallow waters (202 m) and with a high oxygen saturation (98%), and can be described as an outsider. Four species were characteristic of the station. Chaetopterid (cf. Chaetopterus sp.) and spionid (Prionospio steenstrupi) polychaetes reached high densities. In addition, the mussel species Nucula sp. and Thyasira sp. were prominent. The fourth cluster consisted of two stations that were far away from each other. Station 5 is located in the Laurentian Channel at the entrance to the LSLE. Station 11, on the other hand, is located in the Esquiman Channel, at the northern exit of the GSL. Both showed similar oxygen saturation values (40 vs. 46%) at similar water depths (335 vs. 328 m). Characteristic species were the polychaetes Capitellidae, Ceratocephale loveni and Lumbrineris sp., and the thyasirid bivalve Thyasira sp. The very low density of individuals and the low number of species were striking at both stations (see Table 2 and Figure 5B).
The results of the dbRDA (Figure 9) show the relationship between the environmental predictors that best explain the variation in the macrofauna composition in the four sampled communities. When all stations were included in the analysis, the first two axes explained 55.8% of the total variation. The dbRDA1 was mainly driven by depth and salinity, and the dbRDA2 by sediment organic content and size. When two stations outside the main transect were removed from the species matrix, the dbRDA1 was mainly related to depth and bottom oxygen saturation. We have, however, to state again, that the present statistical results in our study should be treated as purely exploratory and descriptive, as the sampling size is too low to determine solid relationships.

4. Discussion

It is known from the literature that oxygen values in the LSLE can be as low as 63 µmol L−1 (=1.41 mL L−1), e.g., [34]. Long-term studies also showed that, since about the mid-1980s, oxygen levels have varied between 50 and 80 µmol L−1, but have never reached values above 100 µmol L−1, as in the decades before [15,16,35]. In the present study, a bottom oxygen gradient from west (GSL) to east (LSLE) was clearly detected (Figure 3 and Figure 4A). Similar to previous investigations, hypoxic conditions were found in the LSLE. The two hypoxic stations showed values between 50 and 67 µmol L−1 (1.12 and 1.52 mL L−1) and were thus within the range of the long-term studies (see also Table 1 and Figure 4A). We can therefore assume that our 2015 survey year was not exceptional in terms of oxygen conditions.
The hypothesis that the hypoxic region of the Lower St. Lawrence Estuary (LSLE) has a lower benthic diversity than the normoxic region of the Gulf of St. Lawrence (GSL) could not be confirmed in this study. On the contrary, the stations furthest upstream in the estuary with the lowest oxygen saturation levels showed the highest species diversity and also the highest density and biomass values. These results are contrary to our expectations, so it is possible that the oxygen values of 1.12 and 1.52 mL L−1 are not yet sufficient to reach the physiological threshold values of most organisms present.
Species-specific studies showed that hypoxia thresholds vary greatly across marine benthic organisms (several hundred tested) and that the conventional definition of 2 mg O2 L−1 (1.4 mL L−1) to designate waters as hypoxic is probably too high for more than half of the tested organisms [36]. As a rough estimate, the mean threshold value of the sublethal O2 concentration (2.24 mg L−1 = 1.6 mL L−1) determined by the authors for all organism groups is widely adopted. However, the sensitivity of the organisms is definitely very different, and therefore the wide species-specific range of thresholds for oxygen deficiency in benthic marine organisms cannot be adequately described by a single, universal value. The decapod crustacean Calocaris macandreae Bell, 1846, for example, occurring also in the GSL, which switches from an aerobic to anaerobic metabolism below its threshold (0.085 mg L−1 = 0.1 mL L−1), is one of the most tolerant species worldwide [37]. In general, still the most sensitive organism groups are crustaceans, whereas molluscs and cnidarians with highest resilience against low oxygen concentrations are the groups most tolerant to hypoxia [36]. These include, for example, thyasirid bivalves, as recorded in the oxygen-minimum zones and methane springs around the world [38,39,40,41], and our own results from Namibia. Two representatives of this family were also found in high abundance in the present study.
The formation of clusters, especially of the two hypoxic stations 6 and 7, indicates that the community is different from the normoxic ones (with only 30% similarity). Only present at the hypoxic stations, and therefore very characteristic, are the amphipods Cheirocratus sp. and Ischyrocerus sp., the cumacean Diastylis goodsiri, the spionid Spiophanes kroyeri Grube, 1860, as well as the ascidian Molgula sp. They are all not very typical of oxygen-minimum zones. However, we observed that species (or at least the genus) known to be tolerant of low oxygen, such as Thyasira sp., Ampharete sp., Ceratocephale loveni, Galathowenia oculata, and Trochochaeta multisetosa, were very abundant (Table 2).
A very similar observation was made by Belley et al. [21], who investigated the hypoxic effects on bioturbation activities. They found that the negative oxygen gradient from the well-oxygenated Gulf of St. Lawrence to the hypoxic Lower St. Lawrence Estuary does not cause a significant difference in macrobenthic species richness between the hypoxic and normoxic stations. They therefore suspect that the oxygen concentration in the Lower St. Lawrence Estuary bottom water is not low enough to cause a significant difference in macrobenthic species richness along the oxygen gradient. However, they observed that there are major differences in the feeding mode and low-oxygen tolerance between the hypoxic and normoxic communities. Interestingly, they found by image analysis an increased bioturbation (traces on the sediment surface) in the hypoxic region. They explained this by the high densities of the brittle star Ophiura sp. and its active feeding mode. In our study, however, Ophiura was only found at the normoxic stations, but the related species Amphiura sp. reached high densities in the LSLE. Both genera are known for their pronounced low-oxygen tolerance [42].
An explanation for the counterintuitive fact of a more diverse benthic community with a higher biomass at threshold oxygen values could be based on the stability of the environmental conditions. Whereas in other coastal areas or enclosed brackish seas, episodic events in both bottom water renewal and nutrient supply lead to large fluctuations in population dynamics with alternating collapse and rebuilding of benthic populations, e.g., [43], the LSLE benthos simply lacks this stress. A constant lateral supply of oxygen allows species to extend their population growth right towards the border of their specific oxygen-minimum level and allows communities to adapt by gradual changes in their species inventory. Thus, the constant supply of oxygen, even at low concentrations, seems to be more important than the absolute oxygen concentration. Nutrient input from the surface layer is likely dampened by the fact that even our shallowest station is already 350 m deep and has already been preceded by a major processing of organic material from the surface. But sedimented organic particles originating from rivers can also be introduced by the lateral, near-bottom, seaward flow, thereby achieving a similar uniform nutrient supply mode as the provision with oxygen in the reverse direction. Although the supply of food was not measured in our sampling scheme, it could very well be superimposed on the impact of oxygen in the regulation of diversity and biomass in the gradient between the river mouth and open ocean in the LSLE. The fact that the innermost station of the deep-water transect (stn. 7) showed the lowest amount of accumulated carbon in the sediment at the highest macrofauna diversity and biomass values, but the lowest oxygen concentrations, indicates a still very effective turnover of food, and thereby a well-functioning benthic system. In our opinion, the general lack of stress in the benthos of the LSLE promotes diversity and biomass in suboxic stations, which also appears to be an important regulator of population dynamics in other systems.

Supplementary Materials

The following supporting information can be downloaded at: https://www.mdpi.com/article/10.3390/d15070854/s1, The online version contains supplementary material with all abundance data and SIMPER statistics.

Author Contributions

M.L.Z.: taxonomy and lab work on land; F.P.: cruise organization and sampling at sea; M.L.Z. and F.P.: writing of the manuscript. All authors have read and agreed to the published version of the manuscript.

Funding

The MSM46 Cruise was funded by the Senatskommission für Ozeanographie (German Science Foundation).

Institutional Review Board Statement

Ethical approval was not required for the nature of this work.

Data Availability Statement

Underlying data are available as supplementary material.

Acknowledgments

We thank the officers and crew of the RV Maria S. Merian for their help at sea, and Kolja Beisiegel and Uwe Hehl for their help in sampling. Mayya Gogina helped us with statistical analysis. The present study was part of the projects CECAS (Cruise MSM46) funded by the Senatskommission für Ozeanographie of the German Sciences Foundation (DFG).

Conflicts of Interest

The authors declare no conflict of interest.

References

  1. Levin, L.A.; Ekau, W.; Gooday, A.J.; Jorissen, F.; Middelburg, J.J.; Naqvi, S.W.A.; Neira, C.; Rabalais, N.N.; Zhan, J. Effects of natural and human-induced hypoxia on coastal benthos. Biogeosciences 2009, 6, 2063–2098. [Google Scholar] [CrossRef] [Green Version]
  2. Zhang, J.; Gilbert, D.; Gooday, A.J.; Levin, L.; Naqvi, S.W.A.; Middelburg, J.J.; Scranton, M.; Ekau, W.; Peña, A.; Dewitte, B.; et al. Natural and human-induced hypoxia and consequences for coastal areas: Synthesis and future development. Biogeosciences 2010, 7, 1443–1467. [Google Scholar] [CrossRef] [Green Version]
  3. Rabalais, N.N.; Cai, W.-J.; Carstensen, J.; Conley, D.J.; Fry, B.; Hu, X.; Quiñones-Rivera, Z.; Rosenberg, R.; Slomp, C.; Turner, E.; et al. Eutrophication-driven deoxygenation in the coastal ocean. Oceanography 2014, 27, 172–183. [Google Scholar] [CrossRef] [Green Version]
  4. Breitburg, D.; Levin, L.A.; Oschlies, A.; Grégoire, M.; Chavez, F.P.; Conley, D.J.; Garçon, V.; Gilbert, D.; Gutiérrez, D.; Isensee, K.; et al. Declining oxygen in the global ocean and coastal waters. Science 2018, 359, eaam7240. [Google Scholar] [CrossRef] [Green Version]
  5. Borges, F.O.; Sampaio, E.; Santos, C.P.; Rosa, R. Impacts of low oxygen on marine life: Neglected, but a crucial priority for research. Biol. Bull. 2022, 243, 104–119. [Google Scholar] [CrossRef]
  6. Levin, L.A. Oxygen minimum zone benthos: Adaptation and community response to hypoxia. In Oceanography and Marine Biology; CRC Press: Boca Raton, FL, USA, 2003; Volume 41, pp. 1–45. [Google Scholar]
  7. Shi, Z.; Assis, J.; Costello, M.J. Vulnerability of marine species to low oxygen under climate change. Imperiled Encycl. Conserv. 2022, 887–894. [Google Scholar] [CrossRef]
  8. Amorim, K.; Piontkivska, H.; Zettler, M.L.; Sokolov, E.; Hinzke, T.; Nai, A.M.; Sokolova, I.M. Transcriptional response of key metabolic and stress response genes of a nuculanid bivalve, Lembulus bicuspidatus from an oxygen minimum zone exposed to hypoxia-reoxygenation. Comp. Biochem. Physiol. Part B Biochem. Mol. Biol. 2021, 256, 110670. [Google Scholar] [CrossRef] [PubMed]
  9. Amorim, K.; Loick-Wilde, N.; Yuen, B.; Osvatic, J.T.; Wäge-Recchioni, J.; Hausmann, B.; Petersen, J.M.; Fabian, J.; Wodarg, D.; Zettler, M.L. Chemoautotrophy, symbiosis and sedimented diatoms support high biomass of benthic molluscs in the Namibian shelf. Sci. Rep. 2022, 12, 9731. [Google Scholar] [CrossRef] [PubMed]
  10. Gogina, M.; Darr, A.; Zettler, M.L. Approach to assess consequences of hypoxia disturbance events for benthic ecosystem functioning. J. Mar. Syst. 2014, 129, 203–213. [Google Scholar] [CrossRef]
  11. Berger, W.H.; Lange, C.B.; Wefer, G. Upwelling history of the Benguela-Namibia system: A synthesis of Leg 175 results. Proc. Ocean Drill. Progr. Scient. Res. 2002, 175, 1–103. [Google Scholar]
  12. Amorim, K.; Zettler, M.L. Gradients and instability: Macrozoobenthic communities in the Benguela Upwelling System off Namibia. Estuar. Coast. Shelf. Sci. 2023, 291, 108421. [Google Scholar] [CrossRef]
  13. Quiroga, E.; Quiñones, R.; Palma, M.; Sellanes, J.; Gallardo, V.A.; Gerdes, D.; Rowe, G. Biomass size-spectra of macrobenthic communities in the oxygen minimum zone off Chile. Estuar Coast. Shelf Sci. 2005, 62, 217–231. [Google Scholar] [CrossRef]
  14. Palma, M.; Quiroga, E.; Gallardo, V.A.; Arntz, W.; Gerdes, D.; Schneider, W.; Hebbeln, D. Macrobenthic animal assemblages of the continental margin off Chile (22° to 42°S). J. Mar. Biol. Ass. U. K. 2005, 85, 233–245. [Google Scholar] [CrossRef]
  15. Gilbert, D.; Sundby, B.; Gobeil, C.; Mucci, A.; Tremblay, G.H. A seventy-two-year record of diminishing deep-water oxygen in the St. Lawrence estuary: The northwest Atlantic connection. Limnol. Oceanogr. 2005, 50, 1654–1666. [Google Scholar] [CrossRef]
  16. Jutras, M.; Mucci, A.; Chaillou, G.; Nesbitt, W.A.; Wallace, D.W.R. Temporal and spatial evolution of bottom-water hypoxia in the Estuary and Gulf of St. Lawrence. Biogeosciences 2023, 20, 839–849. [Google Scholar] [CrossRef]
  17. Lefort, S.; Gratton, Y.; Mucci, A.; Dadou, I.; Gilbert, D. Hypoxia in the Lower St. Lawrence Estuary: How physics controls spatial patterns. J. Geophys. Res. 2012, 117, C07018. [Google Scholar] [CrossRef] [Green Version]
  18. Bourgault, D.; Cyr, F. Hypoxia in the St. Lawrence Estuary: How a coding error led to the belief that “Physics Controls Spatial Patterns. PLoS ONE 2015, 10, e0138858. [Google Scholar] [CrossRef] [PubMed]
  19. Dickie, L.; Trites, R. The Gulf of St. Lawrence. In Ecosystems of the World: Estuaries and Enclosed Seas; Ketchum, B., Ed.; Elsevier: New York, NY, USA, 1983; pp. 403–425. [Google Scholar]
  20. Saucier, J.-F.; Roy, F.; Gilbert, D.; Pellerin, P.; Ritchie, H. Modelling the formation and circulation processes of water masses and sea ice in the Gulf of St. Lawrence, Canada. J. Geophys. Res. 2003, 108, 3269–3289. [Google Scholar] [CrossRef]
  21. Belley, R.; Archambault, P.; Sundby, B.; Gilbert, F.; Gagnon, J.-M. Effects of hypoxia on benthic macrofauna and bioturbation in the Estuary and Gulf of St. Lawrence, Canada. Cont. Shelf Res. 2010, 30, 1302–1313. [Google Scholar] [CrossRef] [Green Version]
  22. Brunel, P.; Bossé, L.; Lamarche, G. Catalogue of the Marine Invertebrates of the Estuary and Gulf of Saint Lawrence; National Research Council of Canada: Ottawa, ON, Canada, 1998; p. 405. [Google Scholar]
  23. Chabot, D.; Rondeau, A.; Sainte-Marie, B.; Savard, L.; Surette, T.; Archambault, P. Distribution of Benthic Invertebrates in the Estuary and Gulf of St. Lawrence; Research Document; Canadian Science Advisory Secretariat (CSAS): Ottawa, ON, Canada, 2007; Volume 018, pp. 1–108. [Google Scholar]
  24. Moritz, C.; Lévesque, M.; Gravel, D.; Vaz, S.; Archambault, D.; Archambault, P. Modelling spatial distribution of epibenthic communities in the Gulf of St. Lawrence (Canada). J. Sea Res. 2013, 78, 5–84. [Google Scholar] [CrossRef] [Green Version]
  25. Nozères, C.; Bourassa, M.-N.; Gendron, M.-H.; Plourde, S.; Savenkoff, C.; Bourdages, H.; Benoît, H.; Bolduc, F. Using annual ecosystemic multispecies surveys to assess biodiversity in the Gulf of St. Lawrence. Can. Tech. Rep. Fish. Aquat. Sci. 2015, 3149, 126. [Google Scholar]
  26. Stortini, C.H.; Chabot, D.; Shackell, N.L. Marine species in ambient low-oxygen regions subject to double jeopardy impacts of climate change. Glob. Chang. Biol. 2016, 23, 2284–2296. [Google Scholar] [CrossRef]
  27. Bourdages, H.; Brassard, C.; Desgagnés, M.; Galbraith, P.; Gauthier, J.; Nozères, C.; Scallon-Chouinard, P.-M.; Senay, C. Preliminary Results from the Ecosystemic Survey in August 2019 in the Estuary and Northern Gulf of St. Lawrence; Research Document; Canadian Science Advisory Secretariat (CSAS): Ottawa, ON, Canada, 2020; Volume 009, pp. 1–93. [Google Scholar]
  28. Miatta, M.; Snelgrove, P.V.R. Benthic nutrient fluxes in deep-sea sediments within the Laurentian Channel MPA (eastern Canada): The relative roles of macrofauna, environment and sea pen octocorals. Deep-Sea Res. Part I 2021, 178, 103655. [Google Scholar] [CrossRef]
  29. Miatta, M.; Snelgrove, P.V.R. Sea pens as indicators of macrofaunal communities in deep-sea sediments: Evidence from the Laurentian Channel Marine Protected Area. Deep-Sea Res. Part I 2022, 182, 103702. [Google Scholar] [CrossRef]
  30. Loring, D.H.; Nota, D.J.G. Morphology and sediment of the Gulf of St. Lawrence; Bulletin of the Fisheries Research Board of Canada; Fisheries and Marine Service: Ottawa, ON, Canada, 1973; Volume 182, pp. 1–147. [Google Scholar]
  31. Clarke, K.R.; Corley, R.N. PRIMER v6: User Manual/Tutorial; Primer-E Primer: Plymouth, UK, 2006. [Google Scholar]
  32. Anderson, M.J. Permutational Multivariate Analysis of Variance (PERMANOVA). In Wiley StatsRef: Statistics Reference Online; John Wiley & Sons, Inc.: Hoboken, NJ, USA, 2017. [Google Scholar]
  33. Clarke, K.R.; Warwick, R.M. Change in Marine Communities: An Approach to Statistical Analysis and Interpretation; Plymouth Marine Laboratory: Plymouth, UK, 1994. [Google Scholar]
  34. Alkhatib, M.; Lehmann, M.F.; del Giorgio, P.A. The nitrogen isotope effect of benthic remineralization-nitrification-denitrification coupling in an estuarine environment. Biogeosciences 2012, 9, 1633–1646. [Google Scholar] [CrossRef] [Green Version]
  35. Galbraith, P.S.; Chassé, J.; Nicot, P.; Caverhill, C.; Gilbert, D.; Pettigrew, B.; Lefaivre, D.; Brickman, D.; Devine, L.; Lafleur, C. Physical Oceanographic Conditions in the Gulf of St. Lawrence in 2014; Research Document; Canadian Science Advisory Secretariat (CSAS): Ottawa, ON, Canada, 2015; Volume 032, pp. 1–87. [Google Scholar]
  36. Vaquer-Sunyer, R.; Duarte, C.M. Thresholds of hypoxia for marine biodiversity. Proc. Natl. Acad. Sci. USA 2008, 107, 15452–15457. [Google Scholar] [CrossRef]
  37. Anderson, S.J.; Taylor, A.C.; Atkinson, R.J.A. Anaerobic metabolism during anoxia in the burrowing shrimp Calocaris macandreae Bell (Crustacea, Thalassinidea). Comp. Biochem. Physiol. Part A 1994, 108, 515–522. [Google Scholar] [CrossRef]
  38. Dando, P.R.; Southward, A.J. Chemoautotrophy in bivalve molluscs of the genus Thyasira. J. Mar. Biol. Ass. U. K. 1986, 66, 915–929. [Google Scholar] [CrossRef]
  39. Holmes, A.; Graham, P.G.; Sellanes, J. A new species of Lucinoma (Bivalvia: Lucinoidea) from a methane gas seep off the southwest coast of Chile. J. Conch. 2005, 38, 673–682. [Google Scholar]
  40. Oliver, P.G.; Levin, L. A new species of the family Thyasiridae (Mollusca: Bivalvia) from the oxygen minimum zone of the Pakistan margin. J. Mar. Biol. Assoc. U. K. 2006, 86, 411–416. [Google Scholar] [CrossRef] [Green Version]
  41. Åström, E.K.L.; Oliver, P.G.; Carroll, M.L. A new genus and two new species of Thyasiridae associated with methane seeps off Svalbard, Arctic Ocean. Mar. Biol. Res. 2017, 13, 402–416. [Google Scholar] [CrossRef] [Green Version]
  42. Vistisen, B.; Vismann, B. Tolerance to low oxygen and sulfide in Amphiura filiformis and Ophiura albida (Echinodermata: Ophiuroidea). Mar. Biol. 1997, 128, 241–246. [Google Scholar] [CrossRef]
  43. Zettler, M.L.; Friedland, R.; Gogina, M.; Darr, A. Variation in benthic long-term data of transitional waters: Is interpretation more than speculation? PLoS ONE 2017, 12, e0175746. [Google Scholar] [CrossRef] [PubMed] [Green Version]
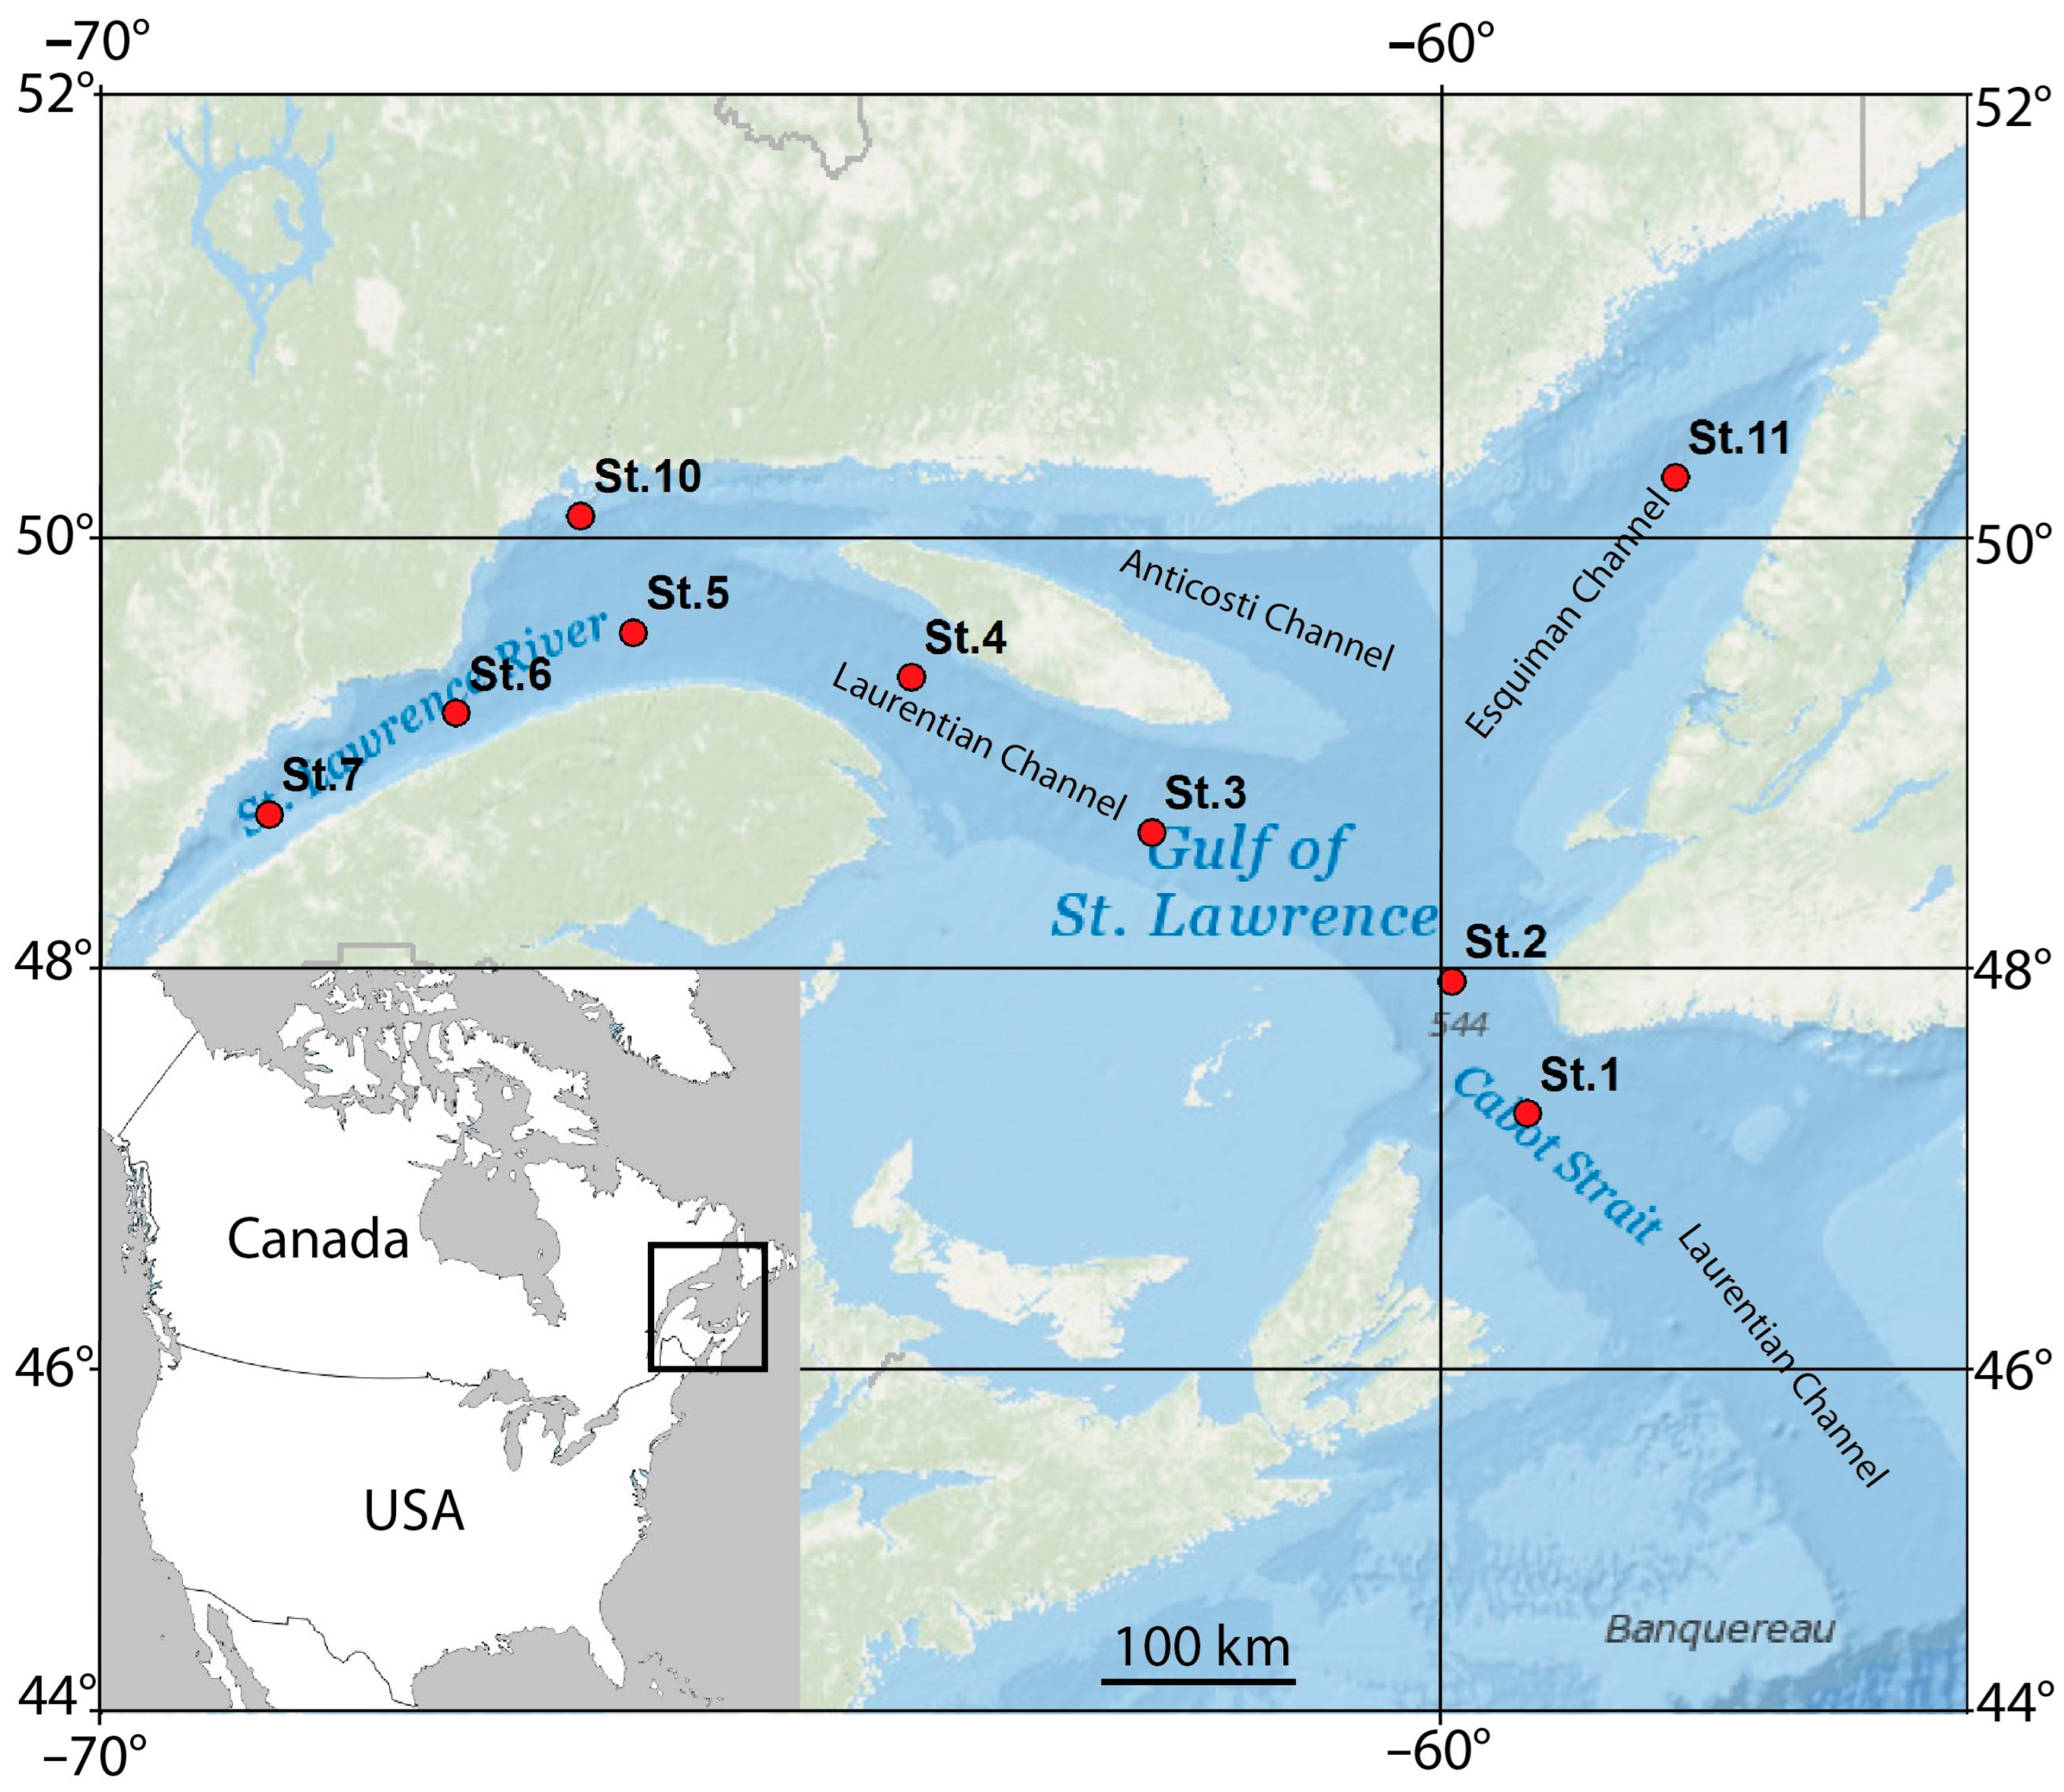
Figure 1. Estuary and Gulf of St. Lawrence, with stations 1 to 11. The black box in the overview map marks the area that has been zoomed out.
Diversity 15 00854 g001
Figure 2. An example of a CTD profile (here, Stn. 6) with temperature, salinity, and oxygen.
Diversity 15 00854 g002
Figure 3. Apparent oxygen utilisation (AOU) along the oxygen gradient in the Gulf and Estuary of St. Lawrence. Stations 10 and 11, which are not on the transect, have been omitted.
Diversity 15 00854 g003
Figure 4. Oxygen saturation (A), oxygen content (B), salinity (C), depth (D), sediment organic content (E), and sediment median grain size (F) along the sampled stations 1 to 11.
Diversity 15 00854 g004
Figure 5. Species number and Hurlbert index (A), density, and biomass (B) along the sampled stations 1 to 11.
Diversity 15 00854 g005
Figure 6. Number of taxa and mean density at all sampled stations together.
Diversity 15 00854 g006
Figure 7. Key species of macrozoobenthic communities of the Estuary and Gulf of St. Lawrence. (A) Amphiura sp. (13 mm); (B) Antalis sp. (25 mm); (C) Thyasira sp. (5 mm); (D) Mendicula ferruginosa (Forbes, 1844) (1.5 mm); (E) Yoldiella sp. (2.6 mm); (F) Galathowenia oculata (Zachs, 1923) (15 mm); (G) Diastylis abbreviata G.O. Sars, 1871 (6 mm); (H) Ceratocephale loveni Malmgren, 1867 (10 mm); (I) Trochochaeta multisetosa (Örsted, 1844) (12 mm); (J) Dyopedos monacanthus (Metzger, 1875) (5 mm); (K) Harpinia sp. (6 mm); (L) Pennatula aculeata Danielssen, 1860 (150 mm).
Diversity 15 00854 g007
Figure 8. Dendrogram showing similarity of 9 sampled stations based on the abundance of 108 taxa recorded. The line of separation to delineate the communities is indicated.
Diversity 15 00854 g008
Figure 9. Distance-based redundancy analysis (dbRDA) ordination plot for the fitted macrofauna data (based on Bray–Curtis after the square-root transformation of abundances) versus environmental variables (A) for all species and stations, and (B) excluding stations 10 and 11 located outside the main transect. Environmental variables are shown by vectors abbreviated, as in Table 1, and vector length related to the effect induced by the environmental variable on species assemblages. Values in boxes below each ordination plot depict the multiple partial correlations between the dbRDA1 and dbRDA2 axes and environmental variables.
Diversity 15 00854 g009
Table 1. Characteristic environmental variables in bottom water and sediment in 2015. B T: bottom-water temperature; B O2: bottom-water oxygen concentration; B O2 Sat: bottom-water oxygen saturation; B S: bottom-water salinity; Sed Org: sediment organic content; Sed GS: sediment grain size.
StationLatitudeLongitudeDepth (m)B T (°C)B O2 (mL/L)B O2 Sat (%)B S (PSU)Sed Org (%)Sed GS (µm)
Stn. 147.1859−59.53804765.64.0382.2334.99.119
Stn. 247.8333−60.08355005.63.5572.5734.9no datano data
Stn. 348.5503−62.24954495.73.0562.4034.910.508
Stn. 449.2903−63.98933825.92.5452.1934.87.868
Stn. 549.5005−65.99823355.81.9439.8934.710.407
Stn. 649.1196−67.27963265.81.5231.0334.69.308
Stn. 748.6390−68.63193295.51.1222.7734.55.848
Stn. 1050.0441−66.37912021.65.3597.5332.91.6922
Stn. 1150.2230−58.46563286.32.2145.9134.69.378
Table 2. Mean macrobenthic faunal density (ind m−2) per taxa and per station for the nine stations sampled in the Estuary and Gulf of St. Lawrence in 2015 (n = 3). Only the 24 most common taxa (>5% dominance in at least one station) are shown (SoD = sum of density; TD = total density; TSN = total species number).
StationsStn. 1Stn. 2Stn. 3Stn. 4Stn. 5Stn. 6Stn. 7Stn. 10Stn. 11
Depth (m)476 m500 m449 m382 m335 m326 m329 m202 m328 m
Oxygen Saturation (%)827362524031239846
Anthozoa
Pennatula aculeata000102031303
Scaphopoda
Antalis sp.1031101135000000
Bivalvia
Mendicula ferruginosa303293220930877700
Thyasira sp.70874347271677008320
Yoldiella sp.173053737003
Malacostraca
Diastylis abbreviata000000160000
Diastylis goodsiri000002010700
Dyopedos monacanthus33000037000
Harpinia sp.2471601532003710397013
Ischyrocerus sp.00000337300
Leptostylis sp.00070110000
Polychaeta
Ampharete sp.03723135322730
Capitellidae3023176027120102327
Ceratocephale loveni00013231431970103
Chaetopteridae73070301303
Cirratulidae03770206770177
Diplocirrus sp.53132743071000
Galathowenia oculata201337177017761700
Lumbrineris sp.271013732087133360
Prionospio steenstrupi102333100338900
Trochochaeta multisetosa0000043170013
Ophiuroidea
Amphiura sp.1330473370702700
Ophiura sp.9003700000
Ascidiacea
Molgula sp.00000109700
SoD (above)993833773930260131741771180253
TD density (all taxa) ind m−211809979801140323158745541757287
TSN (all taxa)373737442151473617
Disclaimer/Publisher’s Note: The statements, opinions and data contained in all publications are solely those of the individual author(s) and contributor(s) and not of MDPI and/or the editor(s). MDPI and/or the editor(s) disclaim responsibility for any injury to people or property resulting from any ideas, methods, instructions or products referred to in the content.