Article

Seagrass Blue Carbon Stock and Air–Sea CO2 Fluxes in the Karimunjawa Islands, Indonesia during Southeast Monsoon Season

by
Nurul Latifah
1,2,
Nining Sari Ningsih
3,*,
Aditya Rakhmat Kartadikaria
3,
Anindya Wirasatriya
4,
Sigit Febrianto
2,
Novi Susetyo Adi
5 and
Faisal Hamzah
6
1
Doctoral Program in Earth Sciences, Faculty of Earth Sciences and Technology, Institut Teknologi Bandung, Bandung 40132, Indonesia
2
Department of Aquatic Sciences, Faculty of Fisheries and Marine Science, Universitas Diponegoro, Semarang 50275, Indonesia
3
Research Group of Oceanography, Faculty of Earth Sciences and Technology, Institut Teknologi Bandung, Bandung 40132, Indonesia
4
Department of Oceanography, Faculty of Fisheries and Marine Science, Universitas Diponegoro, Semarang 50275, Indonesia
5
Center for Marine Research, Ministry of Marine Affairs and Fisheries, Jakarta 14430, Indonesia
6
The National Research and Innovation Agency, Jakarta Pusat 10340, Indonesia
*
Author to whom correspondence should be addressed.
Diversity 2023, 15(9), 978; https://doi.org/10.3390/d15090978
Submission received: 30 June 2023 / Revised: 27 August 2023 / Accepted: 27 August 2023 / Published: 29 August 2023
(This article belongs to the Special Issue Estuaries Ecology and Coastal Marine Waters)

Abstract

:
Research focusing on seagrass ecosystems as carbon storage has been conducted in various Indonesian waters. However, an essential aspect that remains unexplored is the simultaneous analysis of blue carbon storage in seagrass alongside carbon dioxide (CO2) flux values, particularly within Karimunjawa waters. This study aims to assess the organic carbon stock and sea–air CO2 flux in seagrass ecosystems in Karimunjawa. Our hypothesis posits that although seagrass ecosystems release CO2 into the water, their role as blue carbon ecosystems enables them to absorb and accumulate organic carbon within seagrass biomass and sediments. This investigation took place in Karimunjawa waters, encompassing both vegetated (seagrass meadows) and unvegetated (non-seagrass meadows) areas during August 2019, 2020, and 2022. Over this period, the organic carbon stock in seagrass and sediment displayed an increase, rising from 28.90 to 35.70 gCorg m−2 in 2019 and from 37.80 to 45.25 gCorg m−2 in 2022. Notably, the expanse of seagrass meadows in Karimunjawa dwindled by 328.33 ha from 2019 to 2022, resulting in a total carbon stock reduction of the seagrass meadows of 452.39 tC to 218.78 tC. Sediment emerges as a pivotal element in the storage of blue carbon in seagrass, with sedimentary organic carbon outweighing seagrass biomass in storage capacity. The conditions in Karimunjawa, including a high A:B ratio, low dry bulk density, and elevated water content, foster a favorable environment for sediment carbon absorption and storage, facilitated by the waters’ CO2 emission during the southeast monsoon season. Notably, our findings reveal that CO2 release within vegetated areas is lower compared to unvegetated areas. This outcome underscores how seagrass ecosystems can mitigate CO2 release through their adeptness at storing organic carbon within biomass and sediment. However, the presence of inorganic carbon in the form of calcium carbonate introduces a nuanced dynamic. This external source, stemming from allochthonous origins like mangroves, brown algae like Padina pavonica, and calcareous epiphytes, leads to an increase in sedimentary organic carbon stock of 53.2 ± 6.82 gCorg m−2. Moreover, it triggers the release of CO2 into the atmosphere, quantified at 83.4 ± 18.26 mmol CO2 m−2 d−1.

1. Introduction

The global concentration of atmospheric carbon dioxide (CO2atm) has increased from 340.00 ppm in 1980 to 413.25 ppm as of 2020, attributed to human activities lacking environmental friendliness [1,2,3,4,5]. This increase in CO2atm subsequently amplifies the presence of CO2 within aquatic environments. Through the solubility pump mechanism, the ocean absorbs CO2atm, transforming it into Dissolved Inorganic Carbon (DIC), which encompassing aqueous CO2, carbonic acid (H2CO3), bicarbonate (HCO3), and carbonate (CO32−) forms [6,7]. However, the equilibrium of the solubility pump was disrupted following the industrial revolution, leading to an unequal balance between CO2 influx and efflux. Remarkably, even a minor rise of 1 part per million (ppm) in CO2atm triggers the oceans to absorb an additional 0.97 ± 0.40 GtC of CO2 [8,9]. As a carbon reservoir, the oceans have absorbed approximately 30% of CO2atm, thereby inducing alterations in the oceanic carbonate system [2,10,11]. Referring to [12], as per the Global Carbon Project (GCP), 55% of anthropogenic carbon remains in the atmosphere, while 27% becomes absorbed by the oceans.
The open sea functions as a carbon reservoir, playing a pivotal role in reducing anthropogenic CO2 emissions [10]. Beyond the open sea, there exist coastal habitats collectively referred to as blue carbon ecosystems, encompassing mangroves, salt marshes, and seagrass beds, which substantially contribute to carbon absorption and the mitigation of anthropogenic CO2 within the atmosphere [13,14]. Despite their relatively sparse coverage, comprising less than 0.2% of the Earth‘s oceans, these habitats are estimated to sequester around 10% of the annual organic carbon [15]. According to [13], seagrass ecosystems, occupying less than 0.2% of the global oceanic expanse, have the remarkable capacity to store 27.4 TgC year−1, amounting to 10% of the ocean’s annual carbon capture. A portion of the CO2 absorbed by the oceans is integrated into living biomass and sediment deposits, with the majority remaining in an inorganic state [16]. Coastal ecosystems hold a pivotal role as intermediary regions between land and sea, functioning as vital carbon sinks [17]. As highlighted by [14,15], the sediment substrate within seagrass ecosystems hosts a significant organic carbon stock, which could be halved in the absence of seagrass meadows. Further emphasized by [18], the decline and loss of seagrass ecosystems could instigate the release of CO2 into the atmosphere, diminishing carbon absorption and exacerbating global warming. Natural perturbations such as wave energy, eutrophication, and turbidity, coupled with human interventions like the direct release of pond waste into water bodies and the use of trawl nets, can lead to the deterioration of seagrass canopies. This, in turn, directly or indirectly exposes organic carbon sediments to oxygen-rich conditions, fostering the decomposition of organic matter [19,20]. Post-disturbance, the rate of organic carbon conversion in oxic environments is estimated at 0.0005/day, potentially removing 70–80% of sedimentary organic carbon over a span of 40 years [21].
Functioning as a blue carbon ecosystem, a seagrass meadow serves a multifaceted purpose beyond carbon sequestration within its biomass and sediment. Its significance extends to the generation of inorganic carbon through processes like respiration or the calcification of calcium carbonate, which can notably influence air–sea CO2 fluxes. As elucidated by [17], the air–sea CO2 flux constitutes a pivotal mechanism determining whether an ecosystem functions as a CO2 sink or a CO2 source. Due to intensified anthropogenic activities, the degradation of blue carbon ecosystems, including seagrass meadows, has become a concerning reality. Under these circumstances, the ecosystem’s role in regulating carbon within the waters might shift from that of a CO2 sink to a CO2 source. The authors of [22] conducted insightful research on CO2 flux within seagrass ecosystems, discovering that they can act as sources of CO2, emitting between 0.015 and 0.346 mmol CO2 m−2 d−1 in Iromote Island, Japan. Similarly, [23] carried out a comprehensive investigation on CO2 flux along Gilimanuk Bay in Bali, revealing that seagrass ecosystems act as a source of CO2, releasing approximately 2.5 ± 3.4 mmol CO2 m−2 d−1.
Indonesia boasts an extensive expanse of seagrass ecosystems, encompassing approximately 3,000,000 ha, which accounts for 44.48% of the total seagrass area across Southeast Asia [24]. This habitat demonstrates a noteworthy diversity in terms of species, with an estimated range of 12 to 15 seagrass species present [24]. A more detailed study by [25] has identified 13 distinct seagrass species within Indonesian waters, spanning across 22 out of the 38 provinces. Notably, the regions of Gorontalo (16.51 TgC ha−1), West Sumatra (13.66 TgC ha−1), North Sulawesi (11.38 TgC ha−1), and Central Java (4.40 TgC ha−1) exhibit the highest levels of carbon stocks and absorption. In particular, the province of Central Java emerges as a standout, boasting elevated seagrass carbon stocks and absorption rates surpassing the national average carbon uptake of Indonesia (which stands at 3.16 TgC ha−1) [26]. Referring to Indonesia’s seagrass distribution map, the preponderance of seagrass beds in Central Java is notably clustered within the aquatic expanse of Karimunjawa, situated within the Java Sea [24,25,26].
Previous studies [27,28] have primarily focused on assessing the organic carbon stock within seagrass biomass in Karimunjawa waters. Carbon sequestration evaluations conducted at Kartini Harbor and Pancuran Beach in Karimunjawa range from 0.5 to 0.73 TgC ha−1 [27], whereas at the Pokemon Beaches within the same region, this range extends from 0.13 to 0.23 TgC ha−1 [28]. Parallel research investigating CO2 flux within seagrass ecosystems of Karimunjawa waters was undertaken by [29], revealing that these waters function as sources of CO2, with emissions measuring around 8.55–13.27 mmol CO2 m−2 d−1. This aligns with the findings of [30], who showcased the role of Karimunjawa waters as a CO2 source, registering values of 1.79–21.64 mmol CO2 m−2 d−1, and particularly identified two stations in the north of Kemujan Island as CO2 sinks, ranging from −4.41 to −3.69 mmol CO2 m−2 d−1. In the broader context, the Java Sea acts as a CO2 source, contributing to the release of CO2 into the atmosphere [31,32]. In light of the Karimunjawa waters acting as a CO2 source and the seagrass bed’s capacity to store carbon, comprehending the pivotal role of seagrass beds in curtailing CO2 release within the Karimunjawa waters becomes of paramount importance. The present study stands as the inaugural endeavor to concurrently explore the organic carbon stock (OCS) within seagrass meadows and air–sea CO2 flux in both vegetated and unvegetated areas of Karimunjawa waters. Our hypothesis posits that although the CO2 source status of waters within the seagrass ecosystem is unknown, seagrass beds, as integral blue carbon ecosystems, can effectively absorb and retain organic carbon within their biomass and sedimentary layers.

2. Materials and Methods
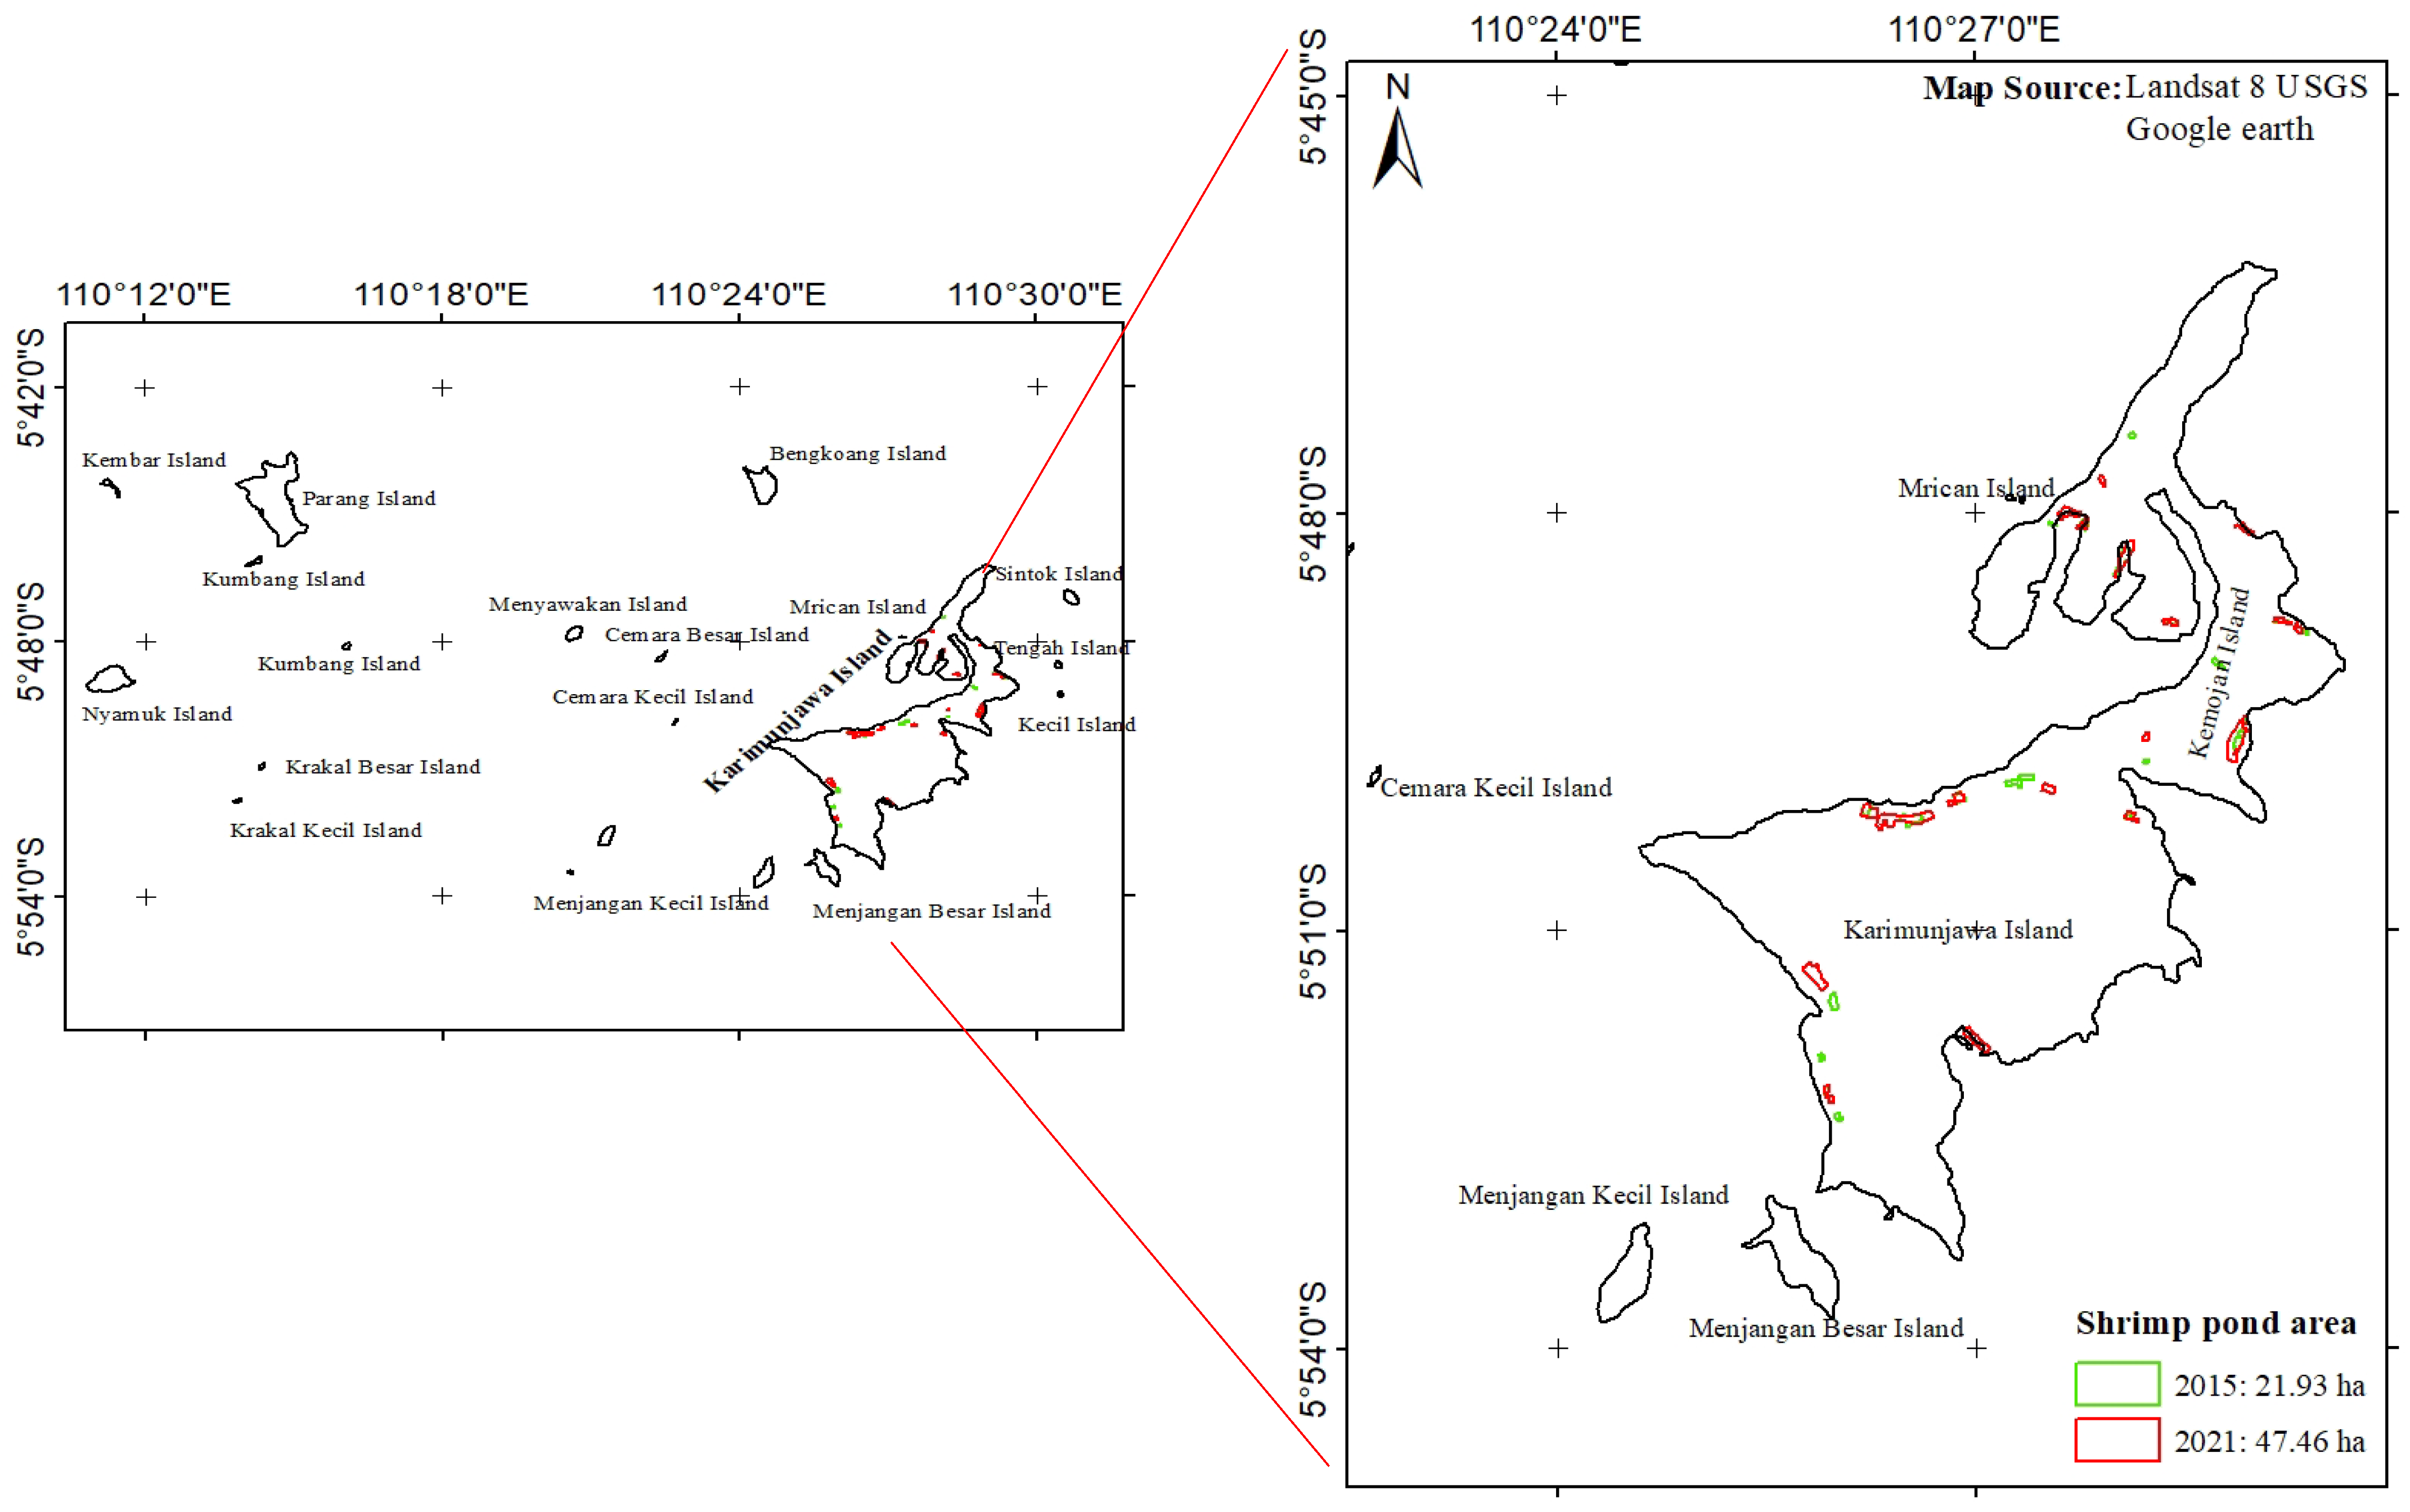
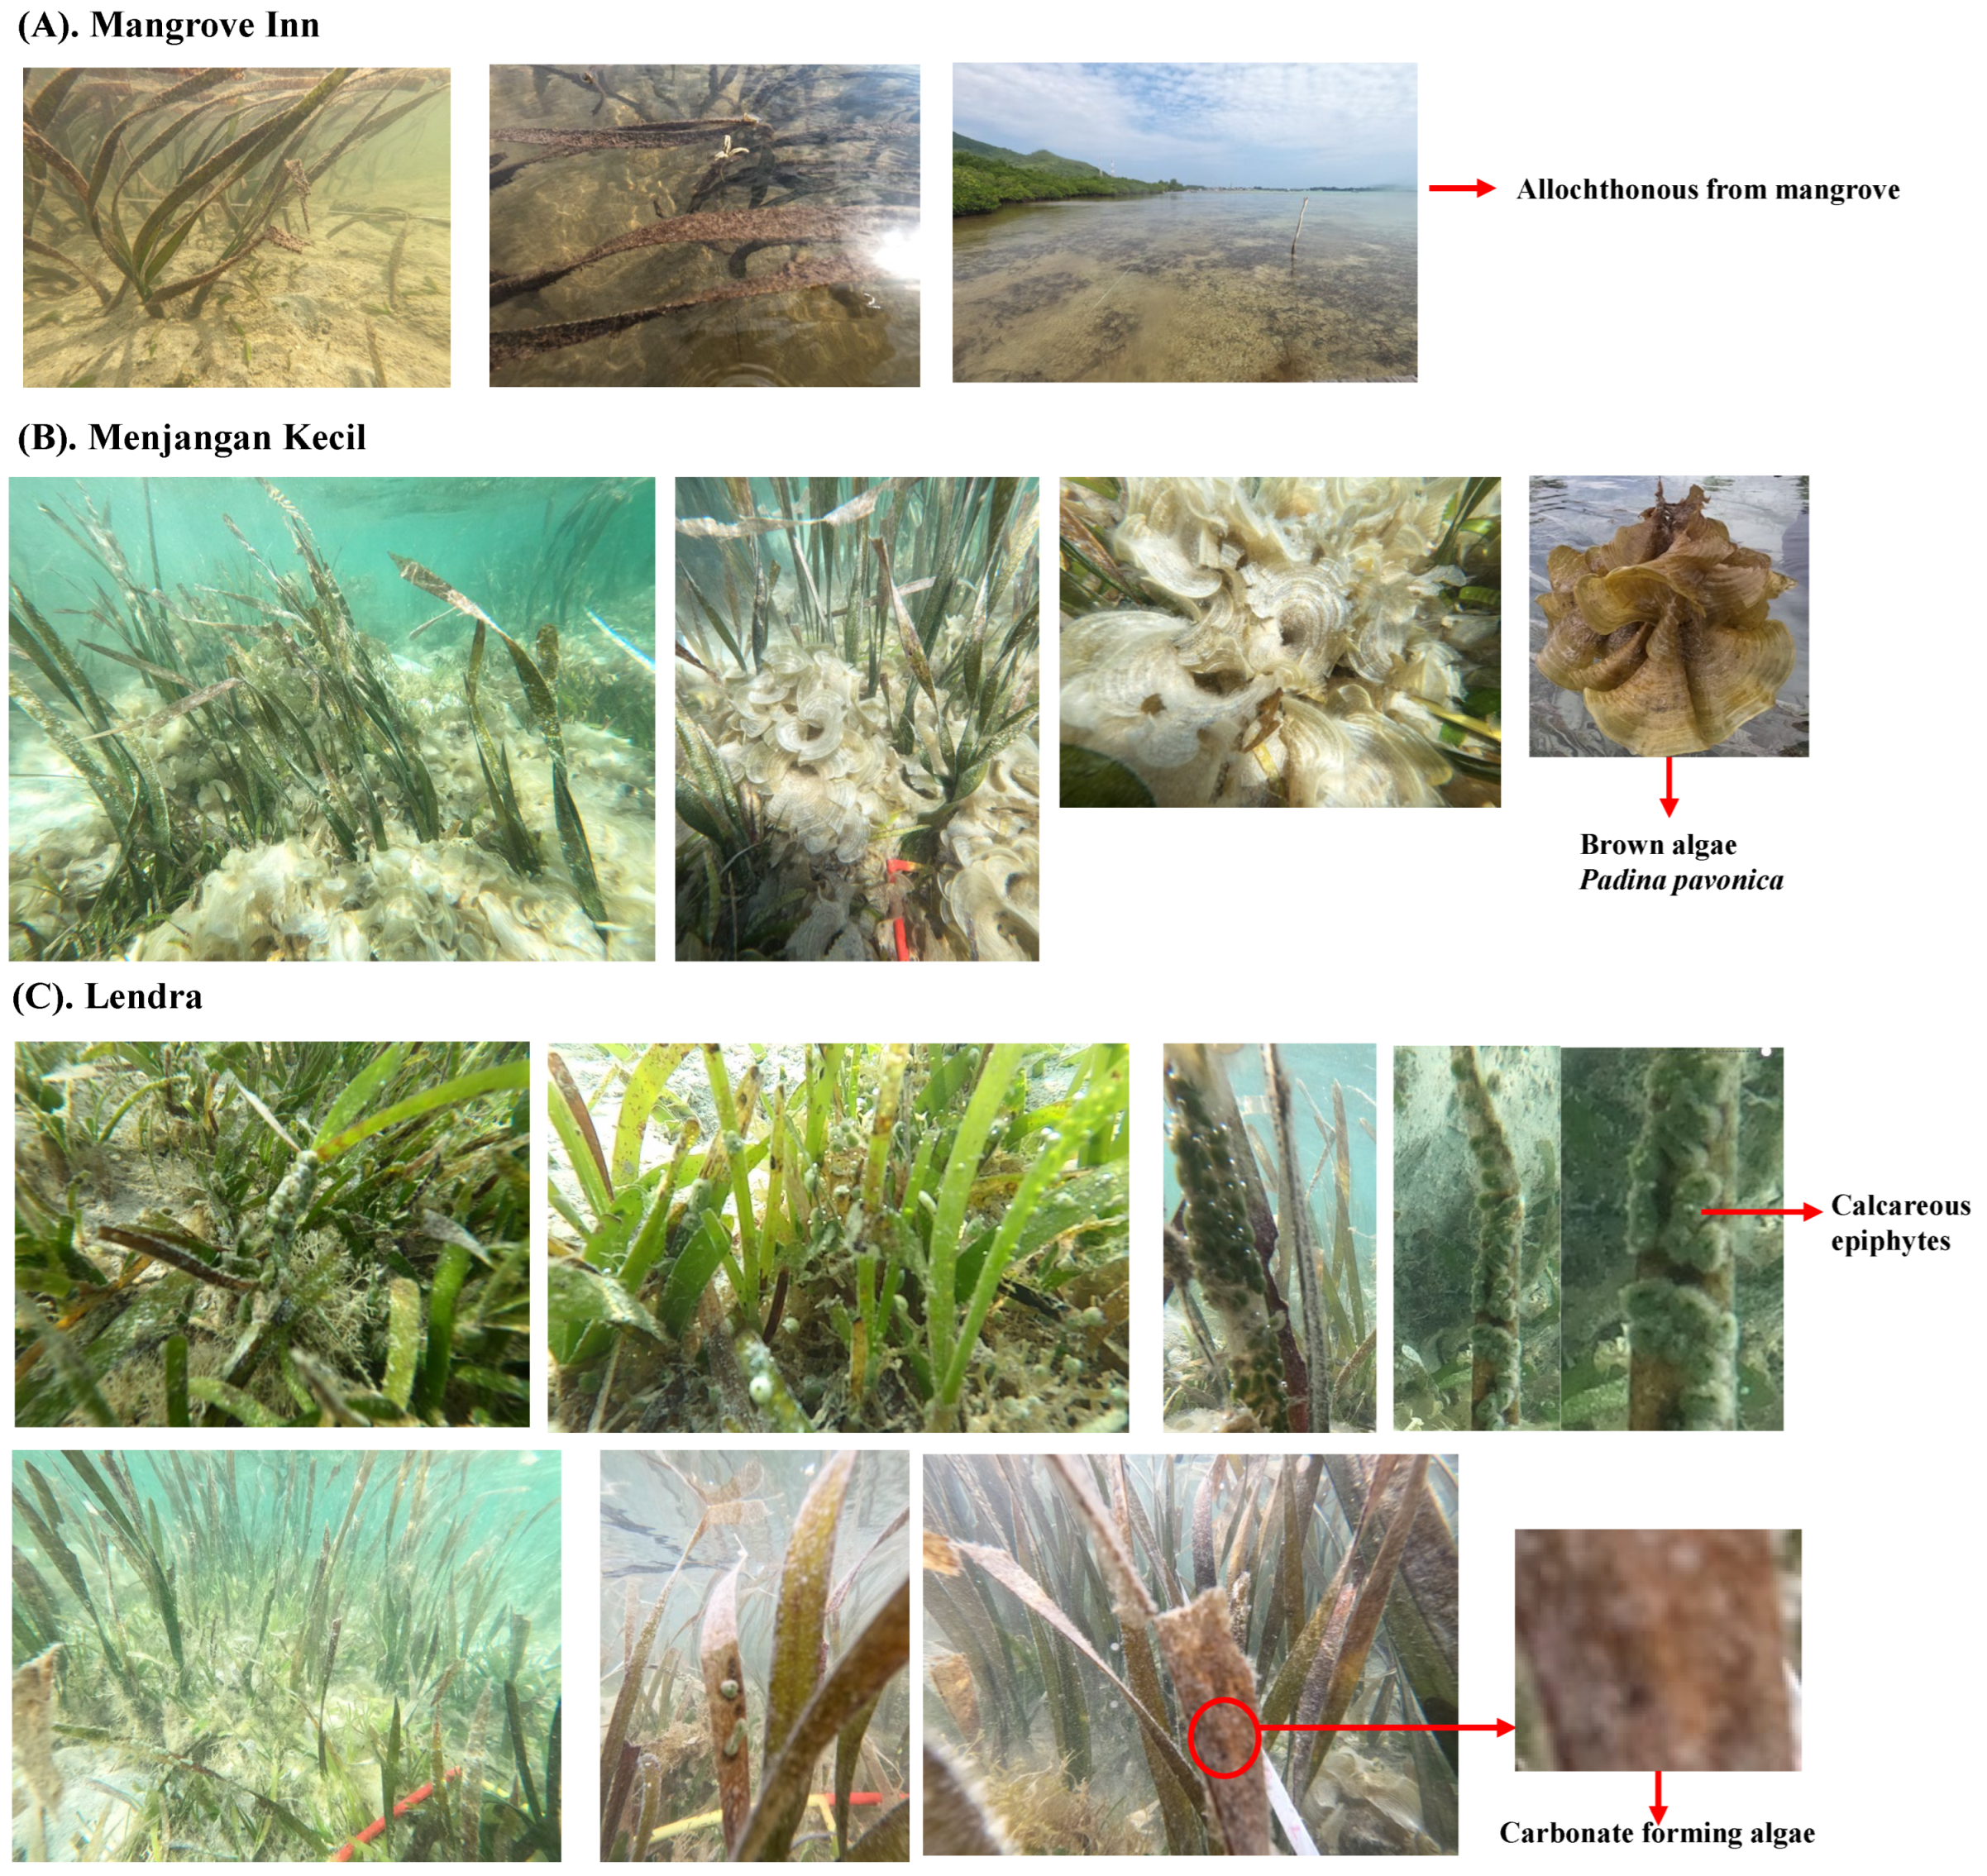
2.1. Study Sites

Karimunjawa, situated in the Java Sea about 83 km northwest of Jepara, Indonesia (Figure 1), is an archipelago composed of 27 islands. Within the Karimunjawa waters, the prevailing currents exhibit a range of velocities spanning from 0.015 to 0.05 m s−1, encompassing an average depth that varies from 0 to 54 m [33]. Enveloping a multitude of ecosystems, the Karimunjawa Islands showcase a diverse landscape that encompasses lowland rainforests, mangrove forests, coral reefs, algae, and seagrass meadows [34].

2.2. Data Collection

2.2.1. Primary Data

Over the course of three years, specifically during the southeast monsoon season of August in 2019, 2020, and 2022, we meticulously collected primary data encompassing CO2 fluxes and organic carbon (Corg) stocks within sediments and seagrass. To comprehensively investigate the seagrass ecosystem’s pivotal role in carbon storage and CO2 fluxes, we partitioned our sampling stations into two categories: vegetated and unvegetated. The former represents stations adorned with flourishing seagrass meadows, while the latter symbolizes stations lacking such meadows. In the initial phase, encompassing August 2019, our research included six vegetated stations alongside nine unvegetated stations (Figure 1). Progressing to August 2020, our focus shifted to ten vegetated stations and five unvegetated stations (Figure 1). By August 2022, our study featured seven vegetated stations and a corresponding seven unvegetated stations (Figure 1).
Vegetated (unvegetated) stations were located at depths of 0–1.3 m (2–10 m). Throughout the field survey, we diligently measured essential parameters such as sea surface temperature (SST), pH, dissolved oxygen (DO), and sea surface salinity (SSS). Additionally, our research involved the collection of a total of 94 water samples. These samples were divided into two categories: 100 mL for the meticulous analysis of nutrients (including nitrates, phosphates, and silicates) and 1500 mL for the thorough examination of chlorophyll-a levels (as outlined in Table 1).

2.2.2. Secondary Data

As for the secondary data, we employed sea level pressure and wind speed from the European Centre for Medium-Range Weather Forecasts (ECMWF) Reanalysis v5 (ERA5), characterized by a spatial resolution of 0.25° × 0.25°. Moreover, we utilized xCO2atm data sourced from the Atmospheric Infrared Sounder (AIRS)/Aqua, which features a spatial resolution of 2° × 2.5°, to enrich our current study.

2.3. Estimation of Carbon Stock and Storage

At each station depicted in Figure 1, we established 2–3 transect lines, and each of these lines is equipped with five quadrats. The study utilized quadrats measuring 50 × 50 cm (n = 136; depicted in Figure 2A) to facilitate the assessment of various parameters, including shoot density, organic matter (%), seagrass biomass (gDW shoot−1), organic carbon content (%), and organic carbon stock (gCorg m−2). The determination of shoot density involved a meticulous count of all shoots within each quadrat. Prior to measurement, samples were meticulously cleansed of epiphytes and sediments and subsequently categorized into aboveground (AG), encompassing leaves, and belowground (BG), encompassing rhizome and root.
For the analysis of seagrass samples (n = 332 samples), a drying process at 105–110 °C was executed until a constant weight was achieved. In the laboratory setting, approximately 1 g of the subsample was weighed and then subjected to an oven at 105–110 °C for 4–8 h, followed by cooling in a desiccator for 15 min. This process was repeated until a constant sample weight was obtained. The water content was then calculated based on these measurements. In order to determine the ash content, around 1 g of the subsample was weighed, then subjected to furnace drying at 400–600 °C for 4–6 h, and subsequently cooled in a desiccator for 15 min. This step yielded essential parameters, namely pre-combustion mass, post-combustion mass (also referred to as mass after furnace), and dry weight (g DW).
With these parameters in hand, computations were performed to derive organic matter (using Equation (1)), organic carbon content (using Equations (2) and (3)), aboveground biomass (AGB), belowground biomass (BGB), aboveground OCS (AG-OCS), belowground OCS (BG-OCS), and organic carbon stock within the seagrass (OCS-Sg). The average total organic carbon stocks in living seagrass biomass (Mg Corg ha−1) were calculated by using the average OCS-Sg (g Corg m−2), which were subsequently converted to a per-hectare basis.
The collected seagrass samples were divided into AG and BG portions before undergoing analysis through the Loss on Ignition (LOI) method:
% L O I = ( m a s s   b e f o r e   c o m b u s t i o n m a s s   a f t e r   c o m b u s t i o n ) m a s s   b e f o r e   c o m b u s t i o n × 100 ,
the following formula was used to calculate organic carbon content (OCC) [13]:
% C o r g = 0.4 × % L O I 0.21 ,
% C o r g = 0.43 × % L O I 0.33 .
OCS-Sg was calculated by multiplying the biomass of each seagrass species with the corresponding percentage of OCC [38]. Sediment sampling was carried out in 2019 and 2022 through the utilization of a sediment corer (Figure 2B). The sediment corer, comprising subsampling ports with a diameter of 5 cm, was covered during the collection of samples. Employing a manual hammer, the sediment corer was carefully driven into the sediment, aiming for a depth of 5–20 cm. Measurements of B (representing the length of the pipe outside the sediment) and C (indicating the length of the inside pipe) were executed to derive essential parameters. These measurements facilitated the computation of critical factors, including a compaction correction (CCF), a correction for core length (H’), and the acquisition of a volumetric sample. This volumetric sample was subsequently employed in the analysis of pivotal sediment characteristics. These characteristics encompass dry bulk density (calculated using Equation (4)), water content, organic matter (evaluated via Equation (1)), sediment organic carbon content (SOCC, determined using Equations (2) and (3)), and organic carbon stock within the sediment (OCS-S, derived from Equations (6) and (7)).
Analysis of organic matter in sediments (n = 150 samples) was carried out using the LOI method. Dry bulk density is calculated based on the following formula [38]:
D r y   b u l k   d e n s i t y D B D g   c m 3 = M a s s   o f   d r y   s e d i m e n t   ( g ) O r i g i n a l   v o l u m e   s a m p l e   ( c m 3 ) ,
O r i g i n a l   V o l u m e   s a m p l e   c m 3 = 3.14 × r 2 × l e n g t h   o f   c o r r e c t e d   s a m p l e ,
OCS-S is obtained by the multiplication of DBD with SOCC [38]:
OCS-S g C o r g c m 3 = D B D × S O C C ,
OCS-S g C o r g m 2 =   OCS-S g C o r g c m 3 × l e n g t h   o f   c o r r e c t e d   s a m p l e × 10 4 .

2.4. Estimation of Sea–Air CO2 Fluxes

The calculation of CO2 fluxes, representing the exchange of CO2 gas flow, is calculated using the following formula [31,32,39,40,41,42,43,44]:
C O 2 F l u x e s = k w a × K H × ( p C O 2 s e a p C O 2 a t m ) ,
where CO2 fluxes is designated to represent the net carbon dioxide flux (mmol m−2 d−1), k w a signifies the gas transfer velocity (m s-1), and K H stands for the solubility of CO2 in seawater (mol m−3 atm−1). When the CO2 flux exhibits a positive value, the water body functions as a CO2 source; conversely, a negative CO2 flux indicates the water body is acting as a CO2 sink.
The K H value is calculated through the interplay of temperature and salinity functions [32,45]:
ln   K H = 58.0931 + 90.5069 T 100 + 22.2940 × ln   T 100 + S S S × ( 0.02776 0.02588 × T 100 + 0.0050578 × T 100 2 )   ,
where T represents the SST (in K) and SSS denotes sea surface salinity (psu). The calculation of the k w a value follows the W92 formula [46], which has been applied in numerous studies; nevertheless, this formula is most suitable for offshore sites. Given the coastal context of this study, it is important to note that utilizing the W92 formula could potentially lead to an underestimation of the flux. Thus, to address this, RC01 [47] and B04 formulas [48] were implemented for estimating estuarine CO2 fluxes:
k w a = 0.31 × U 10 2 × ( 660 S c ) 0.5   W 92 ,
k w a = 1.91 × e ( 0.35 × U 10 ) × ( 660 S c ) 0.5   ( R C 01 ) ,
k w a = 5.141 × U 10 0.758 × ( 660 S c ) 0.5   ( B 04 ) ,
in these formulas, U10 corresponds to the wind speed at a height of 10 m (m s−1), while Sc represents the Schmidt number, and the coefficient 660 is applied to Sc for SSS (35 psu) and SST (2 °C). In this study, the k w a value employed in the calculation of CO2 fluxes, as indicated in Equation (8), represents the average of k w a values derived from Equations (10) through to (12).
Furthermore, the partial pressure of atmospheric CO2 can be calculated using the following formula [31,32,41,49]:
p C O 2 a t m = x C O 2 a t m × ( p b p H 2 O ) ,
where xCO2atm represents the molar fraction of carbon dioxide (ppm), p b is sea level pressure (Pa), and p H 2 O denotes the saturation vapor pressure of seawater in the atmosphere. Subsequently, the calculation of pCO2sea (partial pressure of oceanic carbon dioxide) was carried out utilizing both the SST (in °C) and chlorophyll-a (Chla) approaches [32,49]:
p C O 2 s e a = 6.31 × S S T 2 + 61.9 × C h l a 2 365.85   S S T 94.41   C h l a + 5715.94 ,
ln   p H 2 O = 24.4543 67.4509 × 100 T 4.8489 × ln   T 100 0.000544 × S S S .

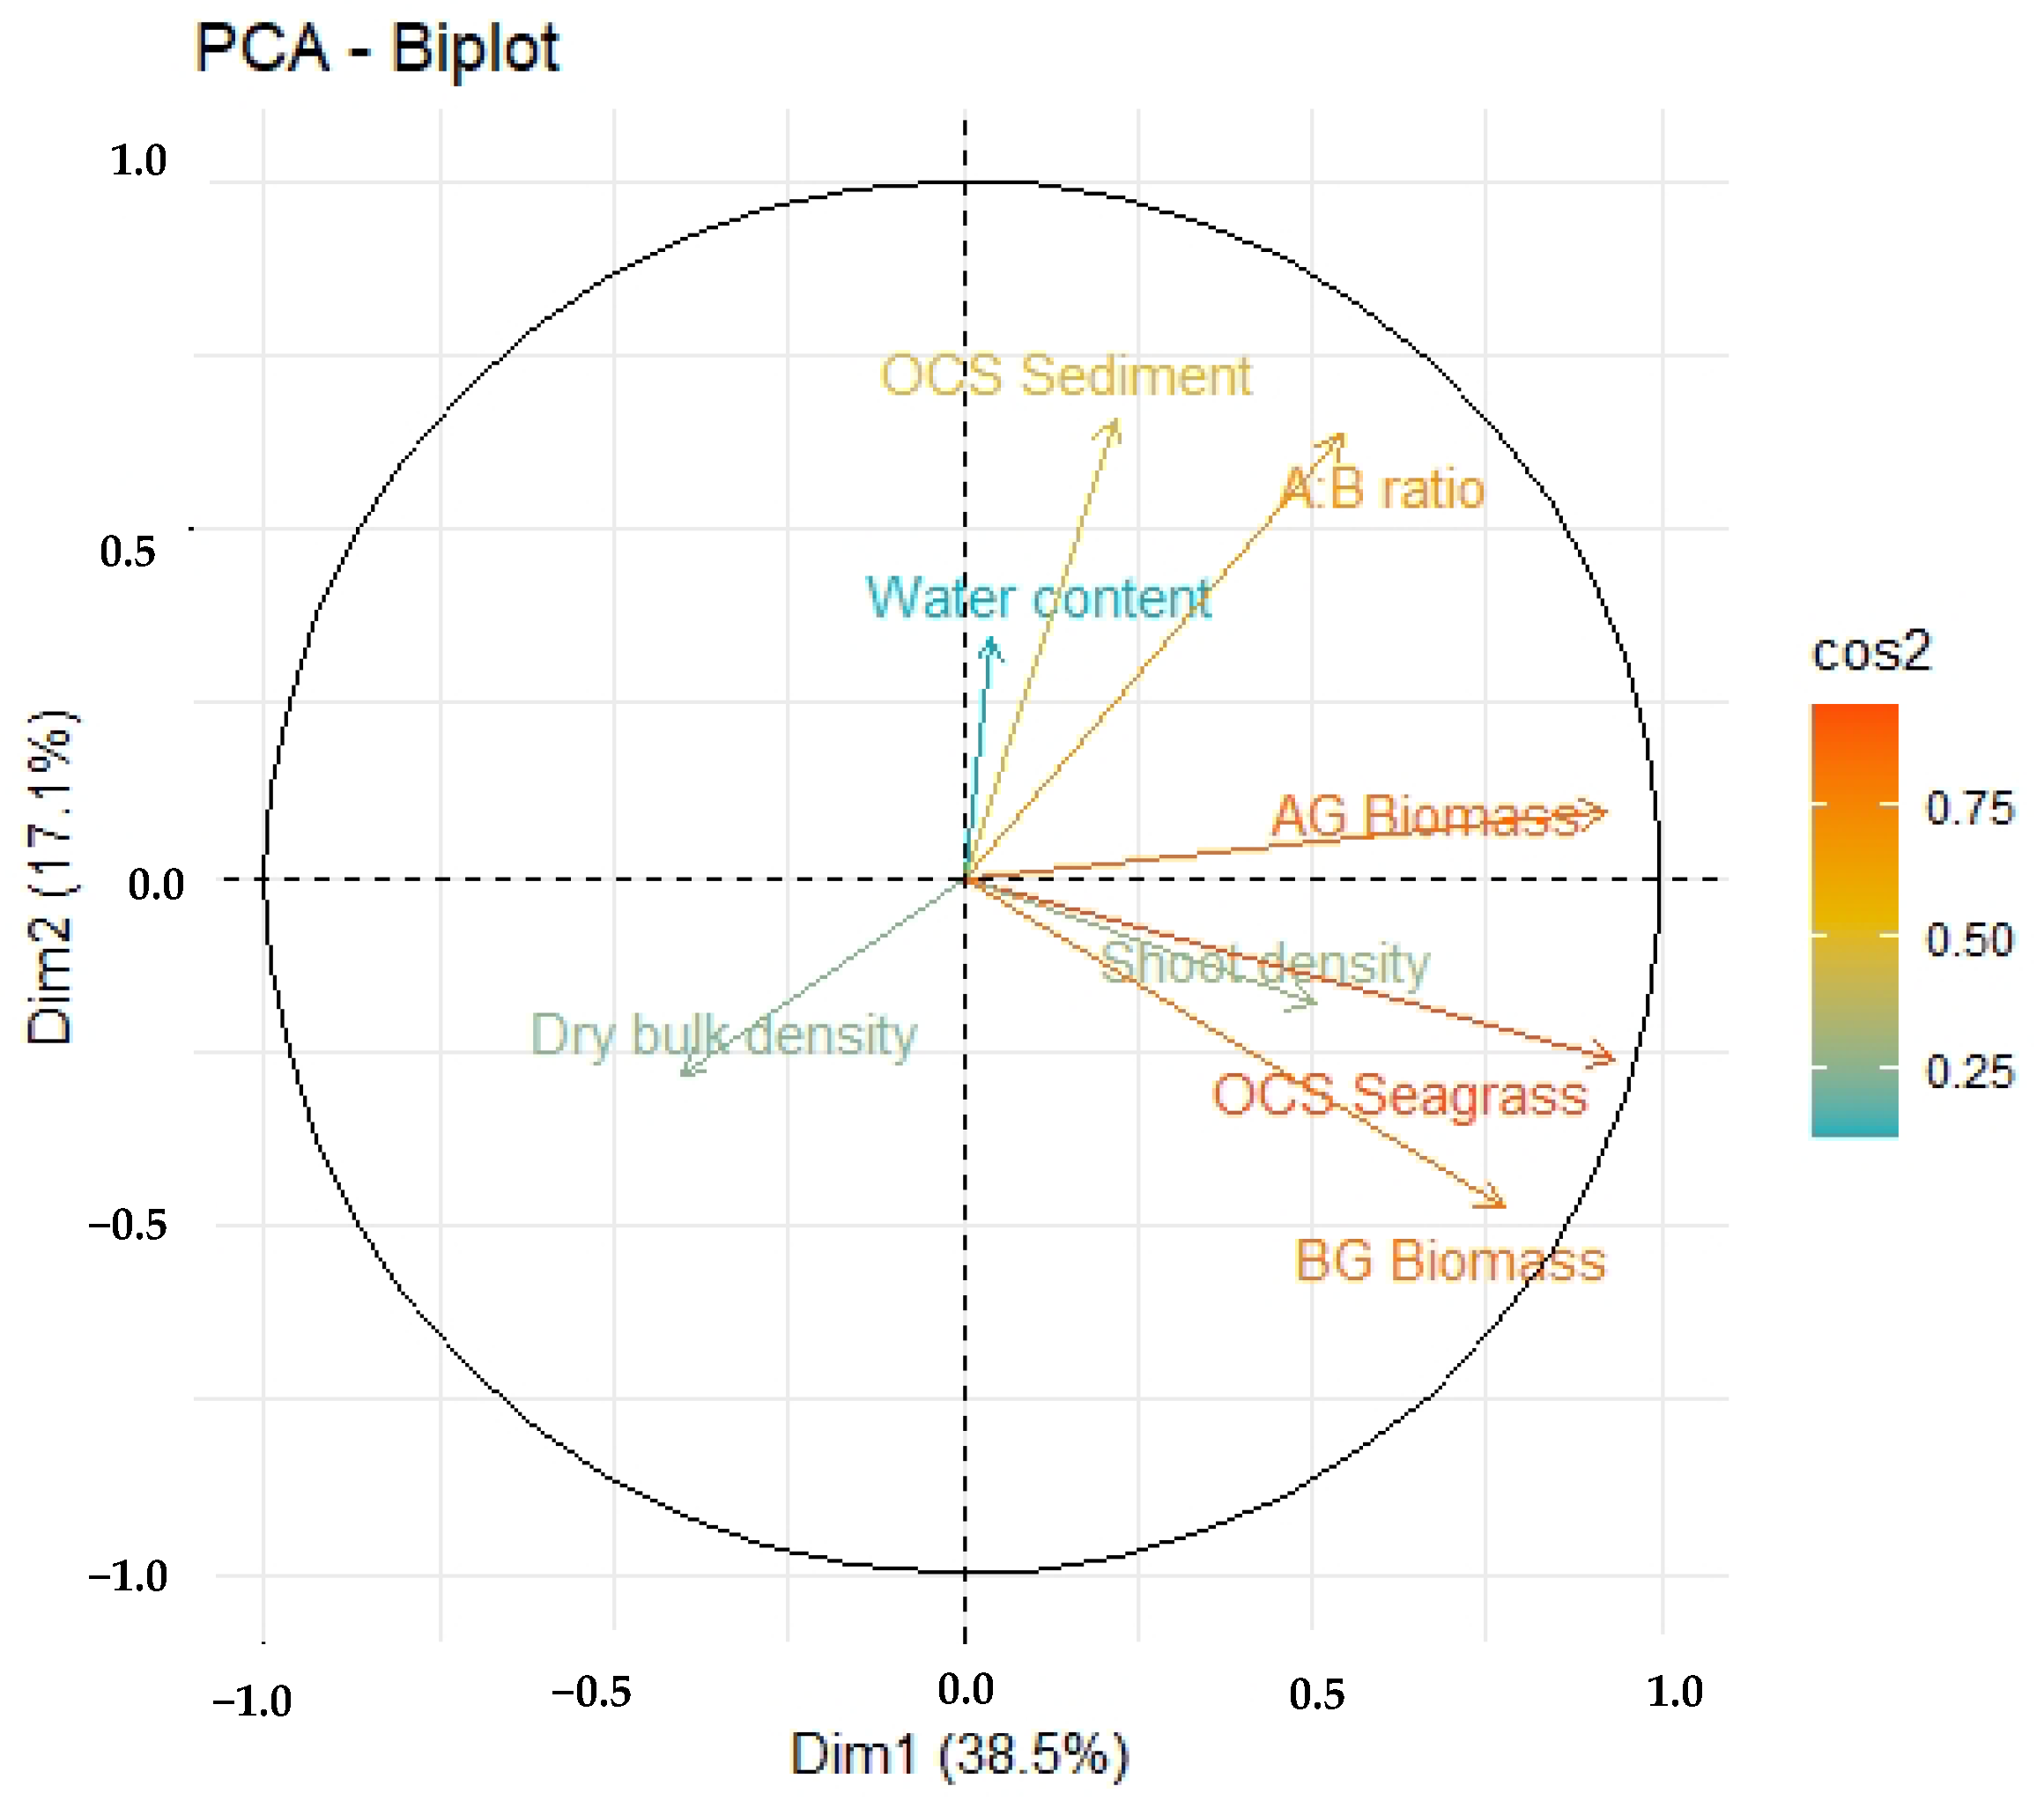
2.5. Statistical Analyses

The results are presented as the mean ± standard error (SE). In order to satisfy the assumptions of parametric methodologies, all collected data underwent assessments for both homogeneity and normality. One-way analysis of variance was used to evaluate disparities in seagrass carbon attributes (including AGB, BGB, above- to belowground (A:B) ratio, shoot density, AG-OCS, BG-OCS, and OCS-Sg), as well as sediment carbon parameters (comprising dry bulk density, water content, %LOI, and OCS-S). Whenever statistically significant variations (α = 0.05) were observed, subsequent pairwise comparisons of means were conducted through the Student–Newman–Keuls (SNK) test to pinpoint the specific sources of divergence [50,51,52]. The interplay between the dependent variable (Corg) and the biological as well as sediment characteristics (including shoot density, seagrass biomass, A:B ratio, dry bulk density, and water content) was scrutinized via Principal Component Analysis (PCA) within the Rstudio software framework.

3. Results

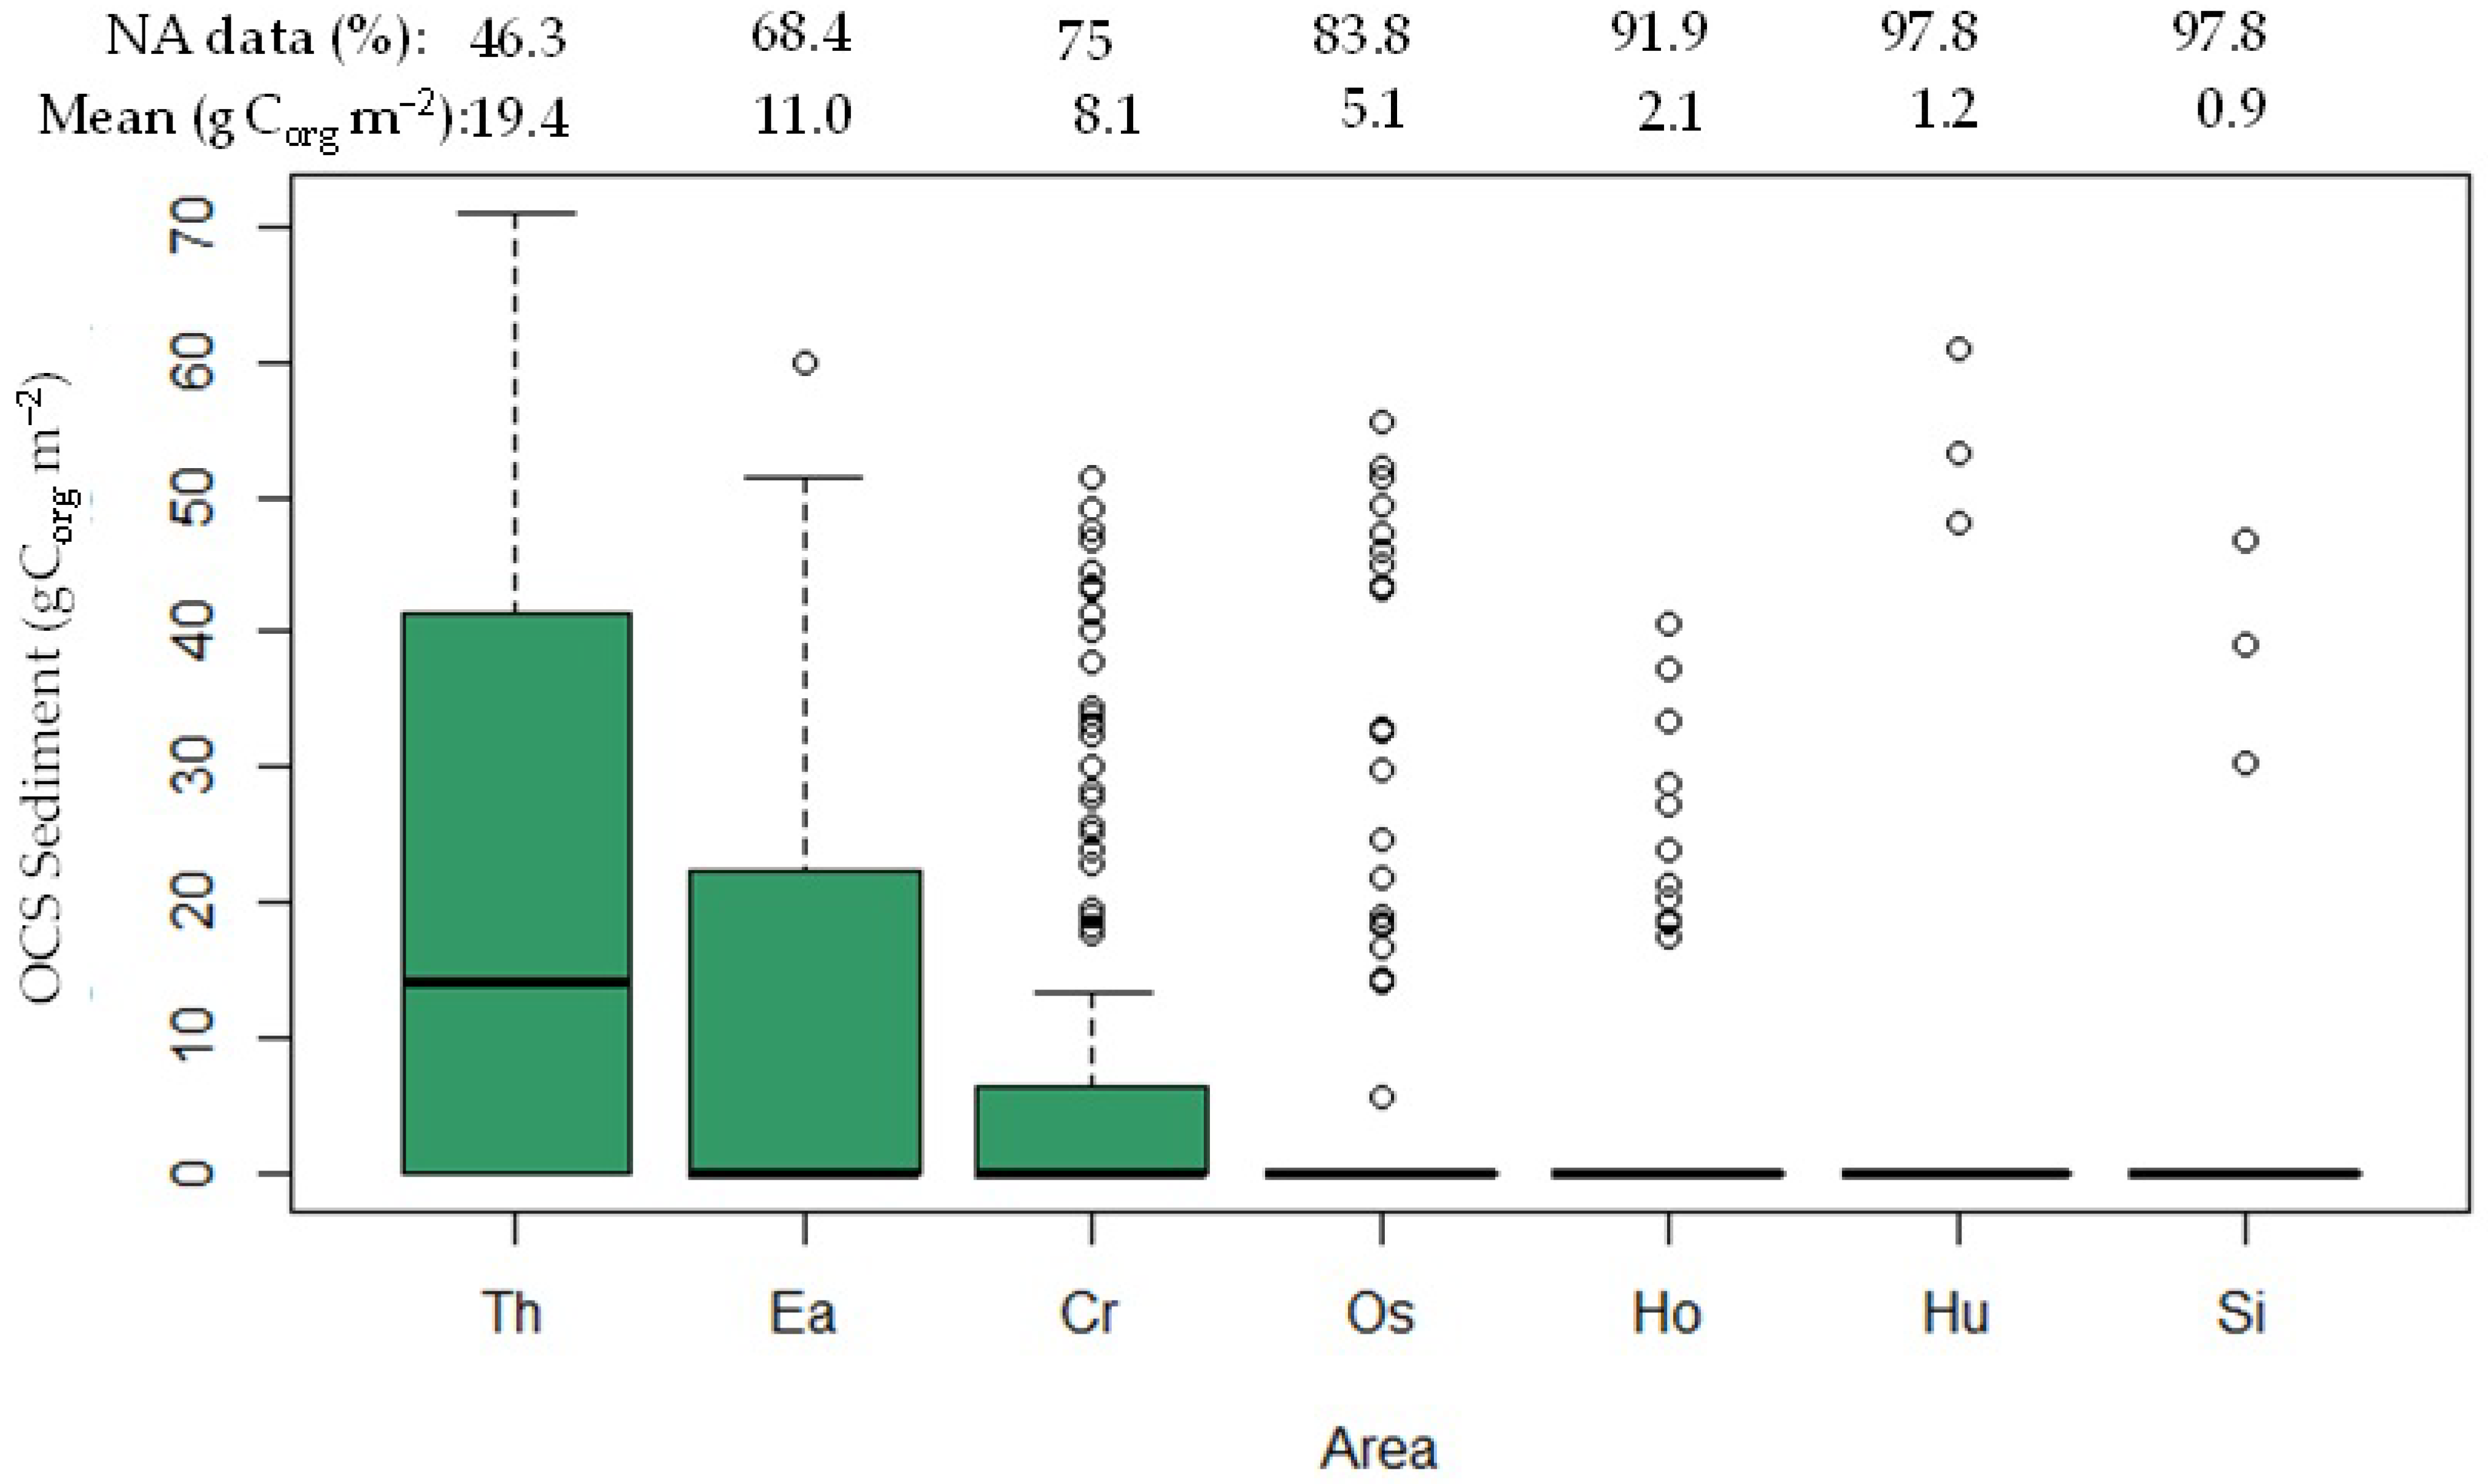
3.1. Organic Carbon Stock in the Seagrass Ecosystem

The present study reveals the presence of seven distinct seagrass species within the Karimunjawa waters. These species include Enhalus acoroides (Ea), Thalassia hemprichii (Th), Cymodocea rotundata (Cr), Oceana serrulata (Os), Halophila ovalis (Ho), Syringodium isoetifolium (Si), and Halodule uninervis (Hu). An analysis of OCS-Sg among these seagrass species demonstrated statistically significant differences (p < 0.001) at a 95% confidence level. The seagrass species were ordered based on their organic carbon stock content (gCorg m−2), with Th exhibiting the highest value (19.4 ± 1.8), followed by Ea (11.0 ± 1.5), Cr (8.1 ± 1.3), Os (5.1 ± 1.1), Ho (3.5 ± 1.0), Hu (3.0 ± 1.7), and Si (0.9 ± 0.5), as depicted in Figure 3. Th and Ea were observed across nearly all stations, while Cr, Os, Hu, and Si were found in less than 25% of the sampling locations. Interestingly, when these less frequently encountered species were present in the sample quadrat, their OCS values could range from 20 to 50 gCorg m−2. Consequently, the box plots shown in Figure 3 for Cr, Os, Ho, Hu, and Si display numerous data points extending beyond their upper extremes, owing to the inclusion of instances where species were absent throughout the study area. In order to achieve uniformity in the measurement of OCS for both above- and belowground components, we integrated zero counts for species that were not detected in particular sampling locations. This strategic approach plays a pivotal role in constructing a more precise depiction of the variations in OCS.
Our data underscores a consistent pattern, revealing that the majority of AG-OCS values were notably lower than the corresponding BG-OCS values. Specifically, the average measurements for AG-OCS and BG-OCS were 15.9 ± 0.9 gCorg m−2 and 17.4 ± 0.8 gCorg m−2, respectively. Importantly, this disparity was statistically significant (p = 0.02) at a 95% confidence level. These AG-OCS and BG-OCS values are susceptible to diminishment due to the ongoing annual reduction in the extent of seagrass meadows within Karimunjawa waters.
Over successive years, this area has experienced a concerning decrease. Specifically, in 2019, seagrass meadows spanned 907.3 ha, but by 2022, this area had contracted to 578.97 ha (Figure 1). This trend is particularly evident when translating OCS measurements into the context of the seagrass meadow area. This conversion demonstrates a clear reduction in the overall OCS-Sg within the Karimunjawa study area. Notably, this metric declined from 262.66 Mg Corg in 2019 to 214.59 Mg Corg in 2022.
A projection based on the hypothetical scenario of maintaining the 2022 seagrass area equivalent to that of 2019 yields significant insights. It suggests that the total OCS-Sg could have doubled by 2022. Tragically, the actual scenario reflects the loss of half of the seagrass meadow areas, although the cumulative OCS-Sg remains above the 200 Mg Corg threshold. These findings underscore the critical role played by seagrass meadows in preserving the cumulative OCS-Sg. The sustainability of these meadows emerges as a paramount concern in this context.
Among the three monitoring stations that gathered data in both 2019 and 2022 (Mangrove Inn, Alang–Alang, and Bobby, as shown in Figure 1), a noteworthy pattern emerged. Two of these stations exhibited an increasing trend in OCS-Sg levels. Specifically, at the Mangrove Inn and Alang–Alang sites, OCS-Sg experienced an increase from 34.5 to 43.3 gCorg m−2 and from 26.6 to 42.6 gCorg m−2, respectively (Table 2). However, a different trend was observed at the Bobby station, where OCS-Sg decreased from 40.17 gCorg m−2 in 2019 to 28.5 gCorg m−2 in 2022. The augmentation in shoot density played a pivotal role in driving the rise in OCS-Sg at these locations. Additionally, a notable surge in the number of seagrass species, more than doubling in count, contributed significantly to the observed OCS increase at the Mangrove Inn and Alang–Alang sites. Taken together, the data amassed from 2019 to 2022 showcases a distinct shift. This shift is statistically significant (p = 0.002) at a 95% confidence level, reflecting an average OCS-Sg increase from 28.9 ± 1.33 gCorg m−2 to 37.8 ± 2.29 gCorg m−2.
The expanse of seagrass meadow in the Karimunjawa waters has been progressively diminishing over the years. This decline can be attributed to the conversion of land formerly occupied by mangrove forests into shrimp ponds, a trend that continues to intensify annually. In 2015, the area dedicated to shrimp ponds spanned 21.93 ha, but by 2021, it had expanded significantly to 47.46 ha (Figure 4). The transition of shrimp pond operations from traditional to high-density, intensive methods has resulted in the discharge of untreated effluent directly into the ocean. This discharge poses a concerning threat to aquatic ecosystems, including seagrass beds, due to potential contamination.
Given that seagrass meadows constitute vital blue carbon habitats capable of mitigating atmospheric CO2 levels through absorption and storage within their biomass and sediments, it is imperative to prioritize their long-term viability. Sediment substrates housing vegetation (seagrass-vegetated sediments) exhibit a notably higher OCS (41.5 ± 2.01 gCorg m−2) compared to unvegetated substrates (unvegetated sediments) (32.4 ± 2.9 gCorg m−2), with a statistically significant difference (p = 0.018) at a 95% confidence level. Remarkably, the highest OCS-S is observed in vegetated stations, particularly at Mangrove Inn in the western sector (63.6 ± 10.4 gCorg m−2), Lendra in the northern sector (54.6 ± 2.9 gCorg m−2), and Bobby in the eastern sector (47.3 ± 1.7 gCorg m−2) (Table 3). This emphasizes the pivotal role of seagrass vegetation in bolstering carbon storage and underscores the importance of addressing its preservation.
The combined effect of various predictors accounted for 55.6% of the variability observed in OCS-S (Figure 5). The outcomes of the PCA analysis revealed that the A:B ratio and water content exerted a positive influence on the OCS-S, while dry bulk density had a negative impact (Figure 5). These findings align with prior research, as noted in [19,53]. In general, a higher shoot density and greater BGB correlate positively with higher OCS-S, owing to their capacity to capture particles and accumulate Corg in the sediment, a concept substantiated by [52]. The elevated OCS-S can be attributed to the intricate canopy structure’s elevated complexity, as discussed in [19,54].

3.2. Air–Sea CO2 Fluxes

During the southeast monsoon season in Karimunjawa’s waters, a noticeable disparity in CO2 flux values came to light between vegetated and unvegetated areas. Specifically, the vegetated regions exhibited a significantly higher average CO2 flux value of 24.4 ± 4.55 mmol CO2 m−2 d−1. In contrast, the unvegetated locations displayed a somewhat lower average CO2 flux value, approximately 20.0 ± 4.34 mmol CO2 m−2 d−1. This discrepancy amounted to a notable 4.4 mmol CO2 m−2 d−1 reduction in CO2 concentration when compared to the CO2 flux values observed in vegetated zones.
In 2022, there was a notable elevation in CO2 flux, particularly evident in the northern part of vegetated stations (Lendra: 156.96 mmol CO2 m−2 d−1) and the western region of the vegetated station (Mangrove Inn: 97.05 mmol CO2 m−2 d−1). This surge in CO2 flux can be attributed to elevated SST during the sampling period at Lendra Beach and Mangrove Inn. In these areas, the SST reached a relatively high 33.5 °C within the vegetated area and 32.1 °C within the unvegetated zone, in contrast to other stations where the average SST in Karimunjawa was about 29.93 °C. The heightened temperatures prompted a concurrent rise in pCO2sea values, with Lendra recording a pCO2sea value of 529.745 µatm, and Mangrove Inn showing pCO2sea values of 493.697 µatm in 2019 and 486.091 µatm in 2022. Additionally, stronger winds contributed to the CO2 flux. This trend is evident in Figure 6, which highlights a strong positive Pearson correlation between CO2 flux and several variables: pCO2sea (r = 0.975 with p < 0.001), SST (r = 0.790 with p < 0.001), and k w a (r = 0.580 with p < 0.001) (see Figure 6).

3.3. Organic Carbon Stock and Air–Sea CO2 Flux

In the context of investigating the interplay between seagrass and CO2 flux in Karimunjawa waters, a distinct separation was made between vegetated stations enriched with additional carbonate sources (vegetated + source carbonate in 2022) and other seagrass-covered stations (vegetated in 2022) (depicted in Figure 7A). Drawing insights from Figure 7A, it becomes evident that three stations—Lendra, Mangrove Inn, and Menjangan Kecil—stand out due to their notably elevated levels of OCS-S and CO2 flux.
Of these stations, those characterized by seagrass vegetation along with supplemental carbonate sources (represented in purple) exhibit the highest content of sediment organic carbon (53.2 ± 6.8 gCorg m−2). This reading surpasses the organic carbon content found in the vegetated stations of 2022 (blue, 45.2 ± 2.6 gCorg m−2), the vegetated stations of 2019 (pink, 35.9 ± 1.6 gCorg m−2), and even the least unvegetated zones of 2022 (green, 32.4 ± 2.9 gCorg m−2) (as shown in Figure 7B). This observation underscores the pivotal role that seagrass plays in facilitating the accumulation of organic carbon stock within the sediment layers.
In contrast, the highest recorded air–sea CO2 flux value was observed at the vegetated station featuring an additional carbonate source, registering a mean of 83.4 ± 18.3 mmolCO2 m−2 d−1 (depicted in Figure 7C). These stations with supplemental carbonate sources are derived from three distinct origins: (1) Mangrove Inn (fed by allochthonous inputs from mangrove, as shown in Figure 8A); (2) Menjangan Kecil (where Padina pavonica constitutes more than 50% of the seagrass meadow composition, as depicted in Figure 8B); and (3) Lendra (enriched with calcareous epiphytes, as seen in Figure 8C).
When comparing this value to vegetated waters devoid of additional carbonate sources, a noticeable disparity emerges with lower values of 18.1 ± 0.9 mmol CO2 m−2 d−1 (in 2019) and 12.8 ± 2.7 mmol CO2 m−2 d−1 (in 2022). This highlights how the presence of supplementary carbonate sources within vegetated waters enhances their inorganic carbon content, thereby elevating their pCO2sea levels and leading to an augmented release of CO2 into the atmosphere. Furthermore, when evaluating the sea–air CO2 flux values between vegetated and unvegetated waters, a notable difference is evident, with the CO2 flux of unvegetated waters surpassing that of vegetated waters by 28.5 ± 8.1 mmol CO2 m−2 d−1. This observation underscores the role of seagrass vegetation in reducing the quantity of inorganic carbon within the water, resulting in lower pCO2sea values and, consequently, a reduced flow of CO2 into the atmosphere.

4. Discussion

Building upon the findings from [55], it was determined that Th exhibited the highest Gross Primary Production (GPP) (9.95 ± 7.25 mmol O2 g DW−1 d−1) among a diverse range of 15 seagrass species, taking into consideration the seagrass biomass ratio within the seagrass meadow. Conversely, as elucidated by [56], smaller seagrass species such as Ho displayed elevated OCS-Sg due to their thriving presence within sediment environments. In contrast, smaller-sized seagrass varieties like Si might not support as substantial OCS-Sg as Ho. These earlier investigations align with our own finding that Th boasts the most significant standing OCS-Sg at 19.4 ± 1.8 gCorg m−2. Meanwhile, Si exhibited the smallest OCS-Sg, registering at 0.9 ± 0.5 gCorg m−2. Ho, surpassing Si, demonstrated an OCS-Sg of 3.5 ± 1.0 gCorg m−2.
In 2022, the total OCS within the study area registered a decrease, totaling 218.78 tC, in stark contrast to the reading of 452.39 tC recorded in 2019. This decline can be attributed to a substantial reduction of 328.33 ha in seagrass coverage. Notably, certain regions have undergone transformation, transitioning into shrimp ponds and fishing zones equipped with trawl nets. Such alterations in land use have direct repercussions on the viability of seagrass and lead to the contraction of the seagrass meadow. As cited in [57], global statistics indicate that a considerable 29% of the overall seagrass expanse has been lost, consequently compromising the carbon sink capacity of these ecosystems. The ongoing trend of land conversion to pond setups bears the potential for further shrinkage of seagrass areas. Consequently, this continuous decline in seagrass territory could subsequently result in an annual reduction in carbon uptake by these ecosystems. Given the imperatives of climate mitigation, prioritizing seagrass conservation and restoration within the waters of Karimunjawa becomes paramount. This is especially crucial in regions with limited species diversity and scant seagrass coverage.
The OCS-Sg in this study (ranging from 0.05 to 1.03 tC ha−1) falls within Indonesia’s range of 0.94–1.15 tC ha−1 [25]. Notably, a significant portion of organic carbon, about 58.10%, is stored in sediments, while the remaining portion is distributed between above- and belowground seagrass biomass, accounting for 41.90%. These findings align well with comparable studies indicating a prevalence of sediment Corg > seagrass Corg, both globally (87.63% > 12.37%) [13], in Indonesia (97.99% > 2.01%) [58], and on the Korean Peninsula (96–99% > 0.67–3.33%) [52].
The substantial proportion of seagrass Corg highlights the pivotal role of seagrass in carbon absorption, underscoring the high potential of Karimunjawa waters’ sediments to sequester even more carbon in the future. Additionally, this study reveals that the content of OCS in vegetated sediments (31.6 ± 3.15 gCorg m−2) surpasses that of unvegetated sediments (16.2 ± 3.44 gCorg m−2), an observation supported by previous findings [52,59]. Furthermore, it is worth noting that blue carbon ecosystems, as mentioned by [52,59], exhibit remarkably high sediment carbon accumulation rates (CARs), which are 30–50 times greater than those found in terrestrial forests.
The elevated OCS-S value observed in vegetated areas in comparison to unvegetated sites underscores the significant contribution of seagrass to both the deposition and long-term preservation of OCS-S. This phenomenon can be attributed to the synergy of factors, including the protracted decomposition of organic matter under anoxic sediment conditions, in conjunction with the abundant Corg content and elevated Carbon-Nitrogen-Phosphorus (CNP) ratios associated with seagrass habitats [52]. Remarkably, the heightened CARs observed in seagrass ecosystems are closely linked to the gradual degradation of organic materials within anoxic sediment environments, along with the substantial proportions of Corg and the elevated CNP ratios characteristic of seagrass habitats [52]. Furthermore, there is a well-documented prevalence of elevated Corg deposition rates within seagrass beds that are relatively sheltered, experience low hydrodynamic conditions, and receive moderate to low nutrient inputs [60].
Large seagrass species (such as Ea and Th) exhibit a heightened capacity to attenuate ocean currents through their dense canopies, thereby proving effective in facilitating sediment deposition [61]. Notably, sediment attributes, including water content, are acknowledged to exert a positive impact on OCS-S. Conversely, attributes like dry bulk density are recognized for their adverse influence on OCS-S. Similar conclusions have been drawn by other studies, affirming that diminished sediment density allows for mineral organic particles to outweigh it in composition [61], while concurrently displaying elevated water content [62] that contributes to heightened OCS-S. Based on the findings derived, it is deducible that the waters around Karimunjawa possess a substantial potential for harboring abundant OCS. This is attributed to the pronounced influence of robust seagrass biomass, a notable A:B ratio, diminished dry bulk density, and elevated water content.
The air–sea CO2 flux results observed in the Karimunjawa waters during the southeast monsoon (ranging from 2.99 to 156.96 mmol CO2 m−2 d−1) surpassed those of prior studies conducted by [32] in the Java Sea, which ranged from 0.1 to 20 mmol CO2 m−2 d−1. Notably, all monitoring stations in this study were identified as contributors to CO2 exchange with the atmosphere. Evidently, areas featuring seagrass meadows (vegetated zones) displayed a positive CO2 flux value, signifying a CO2 source. Amidst relatively uniform wind conditions across the study sites, these vegetated regions exhibited elevated CO2 flux, primarily due to ocean temperature effects.
The challenge of CO2 dissolution in warm tropical waters is underscored by elevated sea temperatures, as indicated by previous research [59,63,64]. Consequently, CO2 tends to be liberated back into the atmosphere, rendering tropical waters a predominant source of CO2 [29,31,32,65,66,67]. Conversely, in subtropical waters characterized by lower temperatures, the increased solubility of CO2 facilitates oceanic absorption (CO2 sink) [68,69,70,71,72]. This aligns with research focused on CO2 flux within the Northeast Atlantic Ocean during summer, where the presence of a high pCO2sea (426.77 ± 0.83 µatm) coincided with maximum temperatures (22.93 ± 0.05 °C) [72].
The air–sea CO2 flux within vegetated regions is also subject to the influence of inorganic carbon, which can elevate pCO2sea, thereby leading to heightened air–sea CO2 exchange. This phenomenon is vividly depicted in Figure 9A, wherein the presence of calcium carbonate reservoirs within seagrass vegetation yields a notable impact on bolstering the organic carbon stores in the aquatic environment. As a result, the air–sea CO2 flux reaches an elevated level of 83.4 ± 18.3 mmol CO2 m−2 d−1. This relationship is mirrored in the sediment domain as well, with organic carbon levels reaching 53.2 ± 6.8 gCorg m−2. Various studies have asserted that the supplementary inorganic carbon within seagrass beds is contributed by sources such as mangroves [23], macroalgae [73,74,75,76], and land-based pollutants, which can lead to the colonization of epiphytes (macrophytes) [77]. Notably, additional sources of carbonate (inorganic carbon) can be attributed to the presence of mangroves in the Mangrove Inn (depicted in Figure 8A). The introduction of allochthonous carbon from upstream sources stems from contributions originating from rivers and mangroves. As elucidated by the findings of [23], the allochthonous influx of mangroves, primarily in the form of groundwater input (measured at 18.1 ± 5.8 mmol CO2 m−2 d−1), emerges as a significant factor driving the escalation of pCO2sea. This underscores the pivotal role of water in acting as a substantial source of CO2 within mangrove ecosystems.
Ecosystems of seagrass, encompassing algae and epiphytes, exhibit an increase in their inorganic carbon content. This increase is notably attributed to the calcification process within the macroalgae Padina pavonica, belonging to the Phaeophyceae class, as observed in Menjangan Kecil (Figure 8B). Likewise, calcareous epiphytes contribute to this trend, notably in Lendra (Figure 8C). In seagrass meadows enriched with substantial nutrient concentrations, the presence of green and red algae predominates, whereas seagrass beds characterized by lower nutrient levels are predominantly populated by brown algae, such as Padina pavonica [78]. This investigation reveals that both Mangrove Inn and Lendra have elevated nutrient levels (measuring 0.78 and 0.85 mg L−1, respectively), where green calcareous epiphytes are prevalent. On the other hand, Menjangan Kecil displays lower nutrient levels (0.66 mg L−1) and hosts Padina pavonica (brown algae), constituting over 50% of the seagrass meadow composition. Notably, the calcification processes in both the macroalgae and the green calcareous epiphytes lead to the generation of calcium carbonate (CaCO3), thereby establishing the waters as a source of CO2, resulting in positive CO2 fluxes. These intricate interactions highlight the dynamic relationship between seagrass ecosystems, algae, and epiphytes, as well as their roles in influencing the inorganic carbon content and subsequent CO2 fluxes within the aquatic environment.
The process of photosynthesis engenders CO2 consumption, leading to a rise in water pH and consequent enhancement of carbonate saturation (CO32−), a phenomenon pivotal for supporting CaCO3 precipitation (as depicted in the equation in Figure 9A). The subsequent calcification of CaCO3 engenders an upsurge in carbonate (CO32−) within the water, contributing to an increase in pCO2sea and, subsequently, a significant return of CO2 to the atmosphere (as illustrated in Figure 9A).
In accordance with [74], calcium carbonate takes form in three crystalline structures: calcite, aragonite, and magnesium calcite. Among the Phaeophyceae class, only two genera, Padina spp. and Newhousia imbricata, are recognized for their calcification capabilities, precipitating aragonite, a compound with distinct solubility characteristics in seawater, further augmenting inorganic carbon [74]. Earlier research [14] posits that seagrass meadows within tropical regions serve as vital hubs for calcium carbonate production. The calcium carbonate content notably depends on seagrass species marked by larger sizes and prolonged leaf lifespans. These factors contribute to heightened calcareous epiphyte presence, facilitating an elevated accumulation of particulate inorganic carbon (PIC) and saturation state of CO32− [79,80]. Furthermore, they play a role in CO2 removal from water by actively participating in CaCO3 precipitation [75].
The occurrence of calcium carbonate precipitation brings about transformations in the inorganic carbon system, thereby amplifying pCO2sea, a process that prompts the liberation of dissolved CO2 from seawater into the atmosphere. This phenomenon has been substantiated by previous studies [14,74,81,82,83,84,85,86]. Collectively, these outcomes underscore that organic carbon stocks alone cannot be deemed the sole, determinant factor in delineating the status and role of seagrass-dominated waters [83,84,87]. The intricate interplay of various processes, including CO2 consumption, carbonate saturation, and CaCO3 precipitation, collectively contribute to the intricate balance of the inorganic carbon system within these ecosystems.
On the contrary, this study has revealed that aquatic environments with abundant vegetation have the capacity to effectively sequester a larger quantity of organic carbon within their sediments. For instance, in comparison to sediments devoid of vegetation, which contained approximately 1840 ± 666 gCorg m−2 of organic carbon, a previous investigation conducted in the Baltic Sea demonstrated that sediment enriched with Zostera marina vegetation harbored a substantial 7785 ± 679 gCorg m−2 of organic carbon [88]. Consequently, while vegetated regions might act as sources of CO2, they also contribute significantly to the mitigation of CO2 emissions into the atmosphere. In scenarios devoid of vegetation, CO2 emissions could escalate, potentially even reaching double the emissions observed in vegetated environments.
The findings of this study underscore the pivotal role of seagrass ecosystems in effectively sequestering organic carbon within both their biomass and sediment layers. Notably, the carbon content within organic sediments present in vegetated areas (seagrass sediments) surpasses that of their non-vegetated counterparts (non-seagrass sediments), as depicted in Figure 9B. This disparity in carbon storage indirectly influences the CO2 flux within the surrounding waters; the existence of seagrass vegetation correlates with a diminished CO2 flux, as contrasted with areas where seagrass is absent (unvegetated), as illustrated in Figure 9B.
Nonetheless, it is important to acknowledge that various factors can augment CO2 flux within seagrass ecosystems. Notably, the introduction of carbonate sources (inorganic carbon) from allochthonous mangroves, Padina pavonica, and calcareous epiphytes, as depicted in Figure 9A, can intensify CO2 flux. Regrettably, this study did not encompass measurements of inorganic carbon and calcium carbonate calcification. Consequently, safeguarding the health and carbon storage capacity of seagrass demands a proactive approach, which includes mitigating detrimental human activities like the direct disposal of pond waste into the waters and the use of trawl nets. Furthermore, the imperative for seagrass conservation and restoration within Karimunjawa waters becomes evident, particularly in areas with limited species diversity and sparse seagrass coverage.

5. Conclusions

This research stands as the inaugural account of blue carbon within the context of seagrass and sea–air CO2 flux in Karimunjawa waters. Our study illuminates the paramount significance of seagrass ecosystems in the Karimunjawa region, elucidating that vegetated areas (seagrass meadows) boast substantial sediment organic carbon stocks. Notably, these vegetated areas contribute to the reduction of CO2 release into the atmosphere, as evidenced by their lower air–sea CO2 flux values in comparison to unvegetated regions (non-seagrass meadows). These findings underscore the pivotal role of seagrass meadows in carbon sequestration and the storage of carbon within both seagrass biomass and sediment layers, potentially curtailing the release of CO2 into the atmosphere.
However, it is worth acknowledging that the presence of a calcium carbonate source in the form of inorganic carbon can amplify sediment organic carbon stocks and correspondingly escalate the release of CO2 into the atmosphere. The inclusion of inorganic carbon (calcium carbonate) originating from sources like allochthonous mangroves in Mangrove Inn, calcification processes in brown algae Padina pavonica at Menjangan Kecil, and calcareous epiphytes at Lendra was not encompassed within this study’s scope. Consequently, future research endeavors should delve into specific investigations to calculate the contribution of inorganic carbon (carbonate) alongside organic carbon, especially across different seasons (such as the northwest monsoon). Such studies would shed light on the intricate dynamics of water–air CO2 flux within seagrass meadows and the net carbon absorption potential of seagrass ecosystems.

Author Contributions

Conceptualization, N.L., A.R.K. and A.W.; methodology, N.L., A.R.K. and A.W.; software, N.L. and S.F.; formal analysis, N.L., A.R.K., A.W. and F.H.; investigation, N.L. and S.F.; resources, N.S.N., N.L. and N.S.A.; writing—original draft preparation, N.L.; writing—review and editing, N.S.N., A.R.K. and A.W.; visualization, N.L., S.F. and F.H.; supervision, N.S.N., A.R.K. and A.W.; project administration, N.S.N.; funding acquisition, N.S.N. All authors have read and agreed to the published version of the manuscript.

Funding

This research was generously funded through multiple sources. First and foremost, the Indonesian Ministry of Education, Culture, Research, and Technology (Kemendikbudristek) provided financial support under the research program known as Penelitian Disertasi Doktor (PDD) 2023, with the Research Grant Contract (RGC) Number: 110/E5/PG.02.00.PL/2023. Furthermore, additional support was received through partial funding from the Institute for Research and Community Services at Universitas Diponegoro, as evidenced by the RGC Numbers: 385-31/UN7.P4.3/PP/2019 and 385-31/UN7.6.1/PP/2020. Finally, we express our sincere appreciation for the invaluable support extended by Universitas Diponegoro, exemplified by Grant Number: 1276/UN7.P/HK/2021, which also granted a scholarship to facilitate the pursuit of this doctoral study program.

Institutional Review Board Statement

Not applicable.

Data Availability Statement

The sea level pressure data and wind speed were obtained from https://www.ecmwf.int/en/forecasts/datasets/browse-reanalysis-datasets (accessed on 30 September 2022). The molar fraction of carbon dioxide was available at https://disc.gsfc.nasa.gov/datasets/AIRX3C2M_V005/summary (accessed on 30 September 2022).

Acknowledgments

The authors are very thankful for the support of Kemendikbudristek, Institut Teknologi Bandung (ITB), Marine Technology Cooperation Research Center (MTCRC), Balai Taman Nasional (BTNKJ) Karimunjawa, Laboratorium Pengelolaan Sumberdaya Ikan dan Lingkungan Universitas Diponegoro, and Laboratorium Ilmu dan Nutrisi Pakan Universitas Diponegoro. We would also like to gratefully acknowledge data support from NASA and ECMWF.

Conflicts of Interest

The authors declare no conflict of interest.

References

  1. Takahashi, T.; Olafsson, J.; Goddard, J.G.; Chipman, D.W.; Sutherland, S.C. Seasonal Variation of CO2 and Nutrients in the High-Latitude Oceans: A Comparative Study. Glob. Biogeochem. Cycles 1993, 7, 843–878. [Google Scholar] [CrossRef]
  2. Hoegh-Guldberg, O.; Danie, J.; Michael, T.; Marco, B.; Sally, B.; Ines, C.; Arona, D.; Riyanti, D. Chapter 3: Impacts of 1.5 °C Global Warming on Natural and Human Systems. In Global Warming of 1.5 °C. An IPCC Special Report on the Impacts of Global Warming of 1.5 °C above Preindustrial Levels and Related Global Greenhouse Gas Emission Pathways; Cambridge University Press: Cambridge, UK; New York, NY, USA, 2018; pp. 175–312. [Google Scholar] [CrossRef]
  3. IPCC. Summary for Policymakers. In IPCC Special Report on the Ocean and Cryosphere in a Changing Climate. A Special Report of the Intergovernmental Panel on Climate Change; Pörtner, H.O., Roberts, D.C., Masson-Delmotte, V., Zhai, P., Tignor, M., Poloczanska, E., Mintenbeck, K., Nicolai, M., Okem, A., Petzold, J., et al., Eds.; Cambridge University Press: Cambridge, UK; New York, NY, USA, 2019. [Google Scholar]
  4. Friedlingstein, P.; O’Sullivan, M.; Jones, M.; Andrew, R.; Hauck, J.; Olsen, A.; Peters, G.; Peters, W.; Pongratz, J.; Sitch, S.; et al. Global Carbon Budget 2020. Earth Syst. Sci. Data Discuss. 2020, 12, 3269–3340. [Google Scholar] [CrossRef]
  5. Gulev, S.K.; Thorne, P.W.; Ahn, J.; Dentener, F.J.; Domingues, C.M.; Gerland, S.; Gong, D.; Kaufman, D.S.; Nnamchi, H.C.; Quaas, J.; et al. Changing State of the Climate System. In Climate Change 2021: The Physical Science Basis. Contribution of Working Group I to the Sixth Assessment Report of the Intergovernmental Panel on Climate Change; Masson-Delmotte, V., Zhai, P., Pirani, A., Connors, S.L., Péan, C., Berger, S., Caud, N., Chen, Y., Goldfarb, L., Gomis, M.I., et al., Eds.; Cambridge University Press: Cambridge, UK; New York, NY, USA, 2021; pp. 287–422. [Google Scholar] [CrossRef]
  6. Borges, A.V.; Morana, C.; Bouillon, S.; Servais, P.; Descy, J.P.; Darchambeau, F. Carbon Cycling of Lake Kivu (East Africa): Net Autotrophy in the Epilimnion and Emission of CO2 to the Atmosphere Sustained by Geogenic Inputs. PLoS ONE 2014, 9, e109500. [Google Scholar] [CrossRef]
  7. Tye, A.M.; Williamson, J.L.; Jarvie, H.P.; Dise, N.B.; Lapworth, D.J.; Monteith, D.; Sanders, R.; Mayor, D.J.; Bowes, M.J.; Bowes, M.; et al. Dissolved Inorganic Carbon Export from Rivers of Great Britain: Spatial Distribution and Potential Catchment-Scale Controls. J. Hydrol. 2022, 615, 128677. [Google Scholar] [CrossRef]
  8. Arora, V.K.; Jones, C.D.; Williams, R.; Katavouta, A.; Friedlingstein, P.; Brovkin, V.; Cadule, P.; Hajima, T.; Seferian, R.; Joetzjer, E.; et al. Carbon-Concentration and Carbon-Climate Feedbacks in CMIP6 Models. J. Clim. 2019. preprint. [Google Scholar]
  9. Christianson, A.B.; Cabré, A.; Bernal, B.; Baez, S.K.; Leung, S.; Pérez-Porro, A.; Poloczanska, E. The Promise of Blue Carbon Climate Solutions: Where the Science Supports Ocean-Climate Policy. Front. Mar. Sci. 2022, 9, 1–16. [Google Scholar] [CrossRef]
  10. Otero, P.; Padin, X.A.; Ruiz-Villarreal, M.; García-García, L.M.; Ríos, A.F.; Pérez, F.F. Net Sea-Air CO2 Flux Uncertainties in the Bay of Biscay Based on the Choice of Wind Speed Products and Gas Transfer Parameterizations. Biogeosciences 2013, 10, 2993–3005. [Google Scholar] [CrossRef]
  11. Zhang, M.; Cheng, Y.; Bao, Y.; Zhao, C.; Wang, G.; Zhang, Y.; Song, Z.; Wu, Z.; Qiao, F. Seasonal to Decadal Spatiotemporal Variations of the Global Ocean Carbon Sink. Glob. Chang. Biol. 2022, 28, 1786–1797. [Google Scholar] [CrossRef]
  12. Le Quéré, C.; Andres, R.J.; Boden, T.; Conway, T.; Houghton, R.A.; House, J.I.; Marland, G.; Peters, G.P.; Van Der Werf, G.R.; Ahlström, A.; et al. The Global Carbon Budget 1959–2011. Earth Syst. Sci. Data 2013, 5, 165–185. [Google Scholar] [CrossRef]
  13. Fourqurean, J.W.; Duarte, C.M.; Kennedy, H.; Marbà, N.; Holmer, M.; Mateo, M.A.; Apostolaki, E.T.; Kendrick, G.A.; Krause-Jensen, D.; McGlathery, K.J.; et al. Seagrass Ecosystems as a Globally Significant Carbon Stock. Nat. Geosci. 2012, 5, 505–509. [Google Scholar] [CrossRef]
  14. Mazarrasa, I.; Marbà, N.; Lovelock, C.E.; Serrano, O.; Lavery, P.S.; Fourqurean, J.W.; Kennedy, H.; Mateo, M.A.; Krause-Jensen, D.; Steven, A.D.L.; et al. Seagrass Meadows as a Globally Significant Carbonate Reservoir. Biogeosciences 2015, 12, 4993–5003. [Google Scholar] [CrossRef]
  15. Bayley, D.; Marengo, I.; Pelembe, T. Giant Kelp ‘Blue Carbon ’ Storage and Sequestration Value in the Falkland Islands; Joint Nature Conservation Committee: Peterborough, UK, 2017; p. 31. [Google Scholar] [CrossRef]
  16. Egea, L.G.; Jiménez-Ramos, R.; Hernández, I.; Bouma, T.J.; Brun, F.G. Effects of Ocean Acidification and Hydrodynamic Conditions on Carbon Metabolism and Dissolved Organic Carbon (DOC) Fluxes in Seagrass Populations. PLoS ONE 2018, 13, e0192402. [Google Scholar] [CrossRef]
  17. Watanabe, K.; Kuwae, T. How Organic Carbon Derived from Multiple Sources Contributes to Carbon Sequestration Processes in a Shallow Coastal System? Glob. Chang. Biol. 2015, 21, 2612–2623. [Google Scholar] [CrossRef] [PubMed]
  18. Otero, M.M.; Walton, M. Manual for the Creation of Blue Carbon Projects in Europe and the Mediterranean; IUCN, International Union for Conservation of Nature Center for Mediterranean Cooperation: Malaga, Spain, 2021. [Google Scholar]
  19. Samper-Villarreal, J.; Lovelock, C.E.; Saunders, M.I.; Roelfsema, C.; Mumby, P.J. Organic Carbon in Seagrass Sediments Is Influenced by Seagrass Canopy Complexity, Turbidity, Wave Height, and Water Depth. Limnol. Oceanogr. 2016, 61, 938–952. [Google Scholar] [CrossRef]
  20. Salinas, C.; Duarte, C.M.; Lavery, P.S.; Masque, P.; Arias-Ortiz, A.; Leon, J.X.; Callaghan, D.; Kendrick, G.A.; Serrano, O. Seagrass Losses since Mid-20th Century Fuelled CO2 Emissions from Soil Carbon Stocks. Glob. Chang. Biol. 2020, 26, 4772–4784. [Google Scholar] [CrossRef] [PubMed]
  21. Lovelock, C.E.; Fourqurean, J.W.; Morris, J.T. Modeled CO2 Emissions from Coastal Wetland Transitions to Other Land Uses: Tidal Marshes, Mangrove Forests, and Seagrass Beds. Front. Mar. Sci. 2017, 4, 1–11. [Google Scholar] [CrossRef]
  22. Akhand, A.; Watanabe, K.; Chanda, A.; Tokoro, T.; Chakraborty, K.; Moki, H.; Tanaya, T.; Ghosh, J.; Kuwae, T. Lateral Carbon Fluxes and CO2 Evasion from a Subtropical Mangrove-Seagrass-Coral Continuum. Sci. Total Environ. 2021, 752, 142190. [Google Scholar] [CrossRef]
  23. Macklin, P.A.; Suryaputra, I.G.N.A.; Maher, D.T.; Murdiyarso, D.; Santos, I.R. Drivers of CO2 along a Mangrove-Seagrass Transect in a Tropical Bay: Delayed Groundwater Seepage and Seagrass Uptake. Cont. Shelf Res. 2019, 172, 57–67. [Google Scholar] [CrossRef]
  24. Thorhaug, A.; Gallagher, J.B.; Kiswara, W.; Prathep, A.; Huang, X.; Yap, T.K.; Dorward, S.; Berlyn, G. Coastal and Estuarine Blue Carbon Stocks in the Greater Southeast Asia Region: Seagrasses and Mangroves per Nation and Sum of Total. Mar. Pollut. Bull. 2020, 160, 111168. [Google Scholar] [CrossRef]
  25. Wahyudi, A.J.; Rahmawati, S.; Irawan, A.; Hadiyanto, H.; Prayudha, B.; Hafizt, M.; Afdal, A.; Adi, N.S.; Rustam, A.; Hernawan, U.E.; et al. Assessing Carbon Stock and Sequestration of the Tropical Seagrass Meadows in Indonesia. Ocean Sci. J. 2020, 55, 85–97. [Google Scholar] [CrossRef]
  26. Wahyudi, A.J.; Febriani, F. Country-Specific Emission Factor for Developing a Tier 3 System of Indonesia’s Seagrass Carbon Inventory. IOP Conf. Ser. Earth Environ. Sci. 2021, 944, 012058. [Google Scholar] [CrossRef]
  27. Ganefiani, A.; Suryanti, S.; Latifah, N. Potensi Padang Lamun sebagai Penyerap Karbon di Perairan Pulau Karimunjawa, Taman Nasional Karimunjawa. SAINTEK Perikan. Indones. J. Fish. Sci. Technol. 2019, 14, 115. [Google Scholar] [CrossRef]
  28. Ramadona, D.N.; Ain, C.; Febrianto, S.; Suryanti, S.; Latifah, N. Carbon Storage Potential of Seagrass Meadows in Pokemon Beach, Karimunjawa. J. Ilmu Teknologi. Kelautan Tropis. 2021, 13, 319–332. [Google Scholar] [CrossRef]
  29. Latifah, N.; Febrianto, S.; Wirasatriya, A.; Endrawati, H.; Zainuri, M.; Suryanti, S.; Hidayat, A.N. Air-Sea Flux of CO2 in the Waters of Karimunjawa Island, Indonesia. Saintek Perikan. Indones. J. Fish. Sci. Technol. 2020, 16, 171–178. [Google Scholar] [CrossRef]
  30. Latifah, N.; Endrawati, H.; Febrianto, S. Distribusi Spasial Fluks Karbon Dioksida Di Perairan Karimunjawa, Indonesia. J. Ilmu Teknol. Kelaut. Trop. 2019, 11, 357–368. [Google Scholar] [CrossRef]
  31. Kartadikaria, A.R.; Watanabe, A.; Nadaoka, K.; Adi, N.S.; Prayitno, H.B.; Soemorumekso, S.; Muchtar, M.; Triyulianti, I.; Setiawan, A.; Suratno, S.; et al. CO2 Sink/Source Characteristics in the Tropical Indonesian Seas. J. Geophys. Res. Ocean. 2015, 120, 7842–7856. [Google Scholar] [CrossRef]
  32. Wirasatriya, A.; Sugianto, D.N.; Maslukah, L.; Ahkam, M.F.; Wulandari, S.Y.; Helmi, M. Carbon Dioxide Flux in the Java Sea Estimated from Satellite Measurements. Remote Sens. Appl. Soc. Environ. 2020, 20, 100376. [Google Scholar] [CrossRef]
  33. Aryetti, F.; Pratomo, D.G.; Pribadi, C.B. Utilization of Bathymetry and Sea Surface Current Data for Coral Reef Habitats in The Karimunjawa Islands. IOP Conf. Ser. Earth Environ. Sci. 2023, 1127, 012041. [Google Scholar] [CrossRef]
  34. Wungo, G.L.; Mussadun, M.; Ma’rif, S. Edukasi Penerapan Konsep Ecotourism Di Kepulauan Karimunjawa. J. Pasopati 2020, 2, 142–149. [Google Scholar]
  35. Hach Company. Scope and Application: For Water, Wastewater and Seawater. Nitrate; Hach Company: Loveland, CO, USA, 2014; Volume 584. [Google Scholar]
  36. Hach Company. DR/2010 Spectrophotometer Procedures Manual; Hach Company: Loveland, CO, USA, 2010. [Google Scholar]
  37. Hach Company. Scope and Application: For Water, Wastewater and Seawater. Phosporus, Reactive (Orthophospahate); Hach Company: Loveland, CO, USA, 2014; Volume 584. [Google Scholar]
  38. Rahmawati, S.; Hernawan, U.E.; Rustam, A. The Seagrass Carbon Content of 0.336 of Dry Weight Can Be Applied in Indonesian Seagrasses. AIP Conf. Proc. 2019, 2120, 030012. [Google Scholar] [CrossRef]
  39. Wanninkhof, R.; McGill, W. A Cubic Relationship between Air-Sea CO2 Exchage and Wind Speed. Geophys. Res. Lett. 1999, 26, 1889–1892. [Google Scholar] [CrossRef]
  40. Takahashi, T.; Sutherland, S.C.; Sweeney, C.; Poisson, A.; Metzl, N.; Tilbrook, B.; Bates, N.; Wanninkhof, R.; Feely, R.A.; Sabine, C.; et al. Global Sea-Air CO2 Flux Based on Climatological Surface Ocean PCO2, and Seasonal Biological and Temperature Effects. Deep. Res. Part II Top. Stud. Oceanogr. 2002, 49, 1601–1622. [Google Scholar] [CrossRef]
  41. Zhu, Y.; Shang, S.; Zhai, W.; Dai, M. Satellite-Derived Surface Water PCO2 and Air-Sea CO2 Fluxes in the Northern South China Sea in Summer. Prog. Nat. Sci. 2009, 19, 775–779. [Google Scholar] [CrossRef]
  42. Du, Y.; Zhang, Y.; Feng, M.; Wang, T.; Zhang, N.; Wijffels, S. Decadal Trends of the Upper Ocean Salinity in the Tropical Indo-Pacific since Mid-1990s. Sci. Rep. 2015, 5, 16050. [Google Scholar] [CrossRef] [PubMed]
  43. Sisma-Ventura, G.; Bialik, O.M.; Yam, R.; Herut, B.; Silverman, J. PCO2 Variability in the Surface Waters of the Ultra-Oligotrophic Levantine Sea: Exploring the Air–Sea CO2 Fluxes in a Fast Warming Region. Mar. Chem. 2017, 196, 13–23. [Google Scholar] [CrossRef]
  44. Yan, H.; Yu, K.; Shi, Q.; Lin, Z.; Zhao, M.; Tao, S.; Liu, G.; Zhang, H. Air-Sea CO2 Fluxes and Spatial Distribution of Seawater PCO2 in Yongle Atoll, Northern-Central South China Sea. Cont. Shelf Res. 2018, 165, 71–77. [Google Scholar] [CrossRef]
  45. Weiss, R.F. Carbon Dioxide in Water and Seawater: The Solubility of a Non-Ideal Gas. Mar. Chem. 1974, 2, 203–215. [Google Scholar] [CrossRef]
  46. Wanninkhof, R. Relationship between Wind Speed and Gas Exchange over the Ocean. J. Geophys. Res. 1992, 97, 7373–7382. [Google Scholar] [CrossRef]
  47. Raymond, P.A.; Cole, J.J. Technical Notes and Comments: Gas Exchange in Rivers and Estuaries: Choosing a Gas Transfer Velocity. Estuaries 2001, 24, 312–317. [Google Scholar] [CrossRef]
  48. Borges, A.V.; Vanderborght, J.P.; Schiettecatte, L.S.; Gazeau, F.; Ferrón-Smith, S.; Delille, B.; Frankignoulle, M. Variability of the Gas Transfer Velocity of CO2 in a Macrotidal Estuary (the Scheldt). Estuaries 2004, 27, 593–603. [Google Scholar] [CrossRef]
  49. Dickson, A.G.; Sabine, C.L.; Christian, J.R. Guide to Best Practices for Ocean CO2 Measurements; North Pacific Marine Science Organization: Sidney, Australia, 2007; Volume 3, ISBN 1-897176-07-4. [Google Scholar]
  50. Williams, L.J. Newman-Keuls Test and Tukey Test 1 Pairwise Comparisons. Encylopedia Res. Des. 2010, 1, 897–902. [Google Scholar]
  51. Park, S.R.; Moon, K.; Kim, S.H.; Lee, K.S. Growth and Photoacclimation Strategies of Three Zostera Species Along a Vertical Gradient: Implications for Seagrass Zonation Patterns. Front. Mar. Sci. 2021, 8, 594779. [Google Scholar] [CrossRef]
  52. Kim, S.H.; Suonan, Z.; Qin, L.Z.; Kim, H.; Park, J.I.; Kim, Y.K.; Lee, S.; Kim, S.G.; Kang, C.K.; Lee, K.S. Variability in Blue Carbon Storage Related to Biogeochemical Factors in Seagrass Meadows off the Coast of the Korean Peninsula. Sci. Total Environ. 2022, 813, 152680. [Google Scholar] [CrossRef] [PubMed]
  53. Gullstrom, M.; Lyimo, L.D.; Dahl, M.; Eggertsen, M.; Anderberg, E.; Rasmusson, L.M.; Mtwana, L.; Linderholm, H.W.; Knudby, A.; Bjo, M. Blue Carbon Storage in Tropical Seagrass Meadows Relates to Carbonate Stock Dynamics, Plant—Sediment Processes, and Landscape Context: Insights from the Western Indian Ocean. Ecosystems 2018, 21, 551–566. [Google Scholar] [CrossRef]
  54. Ricart, A.M.; Pérez, M.; Romero, J. Landscape Configuration Modulates Carbon Storage in Seagrass Sediments. Estuar. Coast. Shelf Sci. 2017, 185, 69–76. [Google Scholar] [CrossRef]
  55. Duarte, C.M.; Marbà, N.; Gacia, E.; Fourqurean, J.W.; Beggins, J.; Barrón, C.; Apostolaki, E.T. Seagrass Community Metabolism: Assessing the Carbon Sink Capacity of Seagrass Meadows. Glob. Biogeochem. Cycles 2010, 24, 1–8. [Google Scholar] [CrossRef]
  56. Lavery, P.S.; Mateo, M.Á.; Serrano, O.; Rozaimi, M. Variability in the Carbon Storage of Seagrass Habitats and Its Implications for Global Estimates of Blue Carbon Ecosystem Service. PLoS ONE 2013, 8, e73748. [Google Scholar] [CrossRef]
  57. Waycott, M.; Duarte, C.M.; Carruthers, T.J.B.; Orth, R.J.; Dennison, W.C.; Olyarnik, S.; Calladine, A.; Fourqurean, J.W.; Heck, K.L.; Hughes, A.R.; et al. Accelerating Loss of Seagrasses across the Globe Threatens Coastal Ecosystems. Proc. Natl. Acad. Sci. USA 2009, 106, 12377–12381. [Google Scholar] [CrossRef]
  58. Alongi, D.M.; Murdiyarso, D.; Fourqurean, J.W.; Kauffman, J.B.; Hutahaean, A.; Crooks, S.; Lovelock, C.E.; Howard, J.; Herr, D.; Fortes, M.; et al. Indonesia’s Blue Carbon: A Globally Significant and Vulnerable Sink for Seagrass and Mangrove Carbon. Wetl. Ecol. Manag. 2015, 23, 3–13. [Google Scholar] [CrossRef]
  59. McLeod, E.; Chmura, G.L.; Bouillon, S.; Salm, R.; Björk, M.; Duarte, C.M.; Lovelock, C.E.; Schlesinger, W.H.; Silliman, B.R. A Blueprint for Blue Carbon: Toward an Improved Understanding of the Role of Vegetated Coastal Habitats in Sequestering CO2. Front. Ecol. Environ. 2011, 9, 552–560. [Google Scholar] [CrossRef]
  60. Jiang, Z.; Liu, S.; Zhang, J. Eutrophication Indirectly Reduced Carbon Sequestration in a Tropical Seagrass Bed Eutrophication Indirectly Reduced Carbon Sequestration in a Tropical Seagrass Bed. Plant Soil 2018, 426, 135–152. [Google Scholar] [CrossRef]
  61. Asplund, M.E.; Dahl, M.; Ismail, R.O.; Arias-Ortiz, A.; Deyanova, D.; Franco, J.N.; Hammar, L.; Hoamby, A.I.; Linderholm, H.W.; Lyimo, L.D.; et al. Dynamics and Fate of Blue Carbon in a Mangrove–Seagrass Seascape: Influence of Landscape Configuration and Land-Use Change. Landsc. Ecol. 2021, 36, 1489–1509. [Google Scholar] [CrossRef]
  62. Avnimelech, Y.; Ritvo, G.; Meijer, L.E. Water Content, Organic Carbon and Dry Bulk Density in Flooded Sediments Water Content, Organic Carbon and Dry Bulk Density in Flooded Sediments. Aquac. Eng. 2001, 25, 25–33. [Google Scholar] [CrossRef]
  63. Susana, T. Karbon Dioksida. Oseana 1988, XIII, 1–11. [Google Scholar]
  64. Curbelo-Hernández, D.; Santana-Casiano, J.M.; González, A.G.; González-Dávila, M. Air-Sea CO2 Exchange in the Strait of Gibraltar. Front. Mar. Sci. 2021, 8, 745304. [Google Scholar] [CrossRef]
  65. Fitranti, B.A.; Juliandri, D.; Herunadi, B. Potensi Pelepasan dan Penyerap CO2 Kaitannya Dengan Suhu Dan Salinitas Di Perairan Teluk Banten. J. Akuatika 2013, 2, 174–182. [Google Scholar]
  66. Basah, P.B.; Bontang, K.; Timur, K. Distribusi Karbon Anorganik Dan Fluks CO2. Lingkungan Tropis 2016, 6, 149–158. [Google Scholar]
  67. Afdal. Fluks CO2 Di Perairan Pesisir Pulau Lombok, Nusa Tenggara Barat CO2 Flux in the Coastal Waters of Lombok, West Nusa Tenggara. Oseanologi Limnol. 2016, 1, 91–103. [Google Scholar]
  68. Cai, W.J.; Dai, M.; Wang, Y. Air-Sea Exchange of Carbon Dioxide in Ocean Margins: A Province-Based Synthesis. Geophys. Res. Lett. 2006, 33, 2–5. [Google Scholar] [CrossRef]
  69. Ito, R.G.; Tavano, V.M.; Mendes, C.R.B.; Garcia, C.A.E. Sea-Air CO2 Fluxes and PCO2 Variability in the Northern Antarctic Peninsula during Three Summer Periods (2008–2010). Deep. Res. Part II Top. Stud. Oceanogr. 2018, 149, 84–98. [Google Scholar] [CrossRef]
  70. Tian, H.; Xu, R.; Canadell, J.G.; Thompson, R.L.; Winiwarter, W.; Suntharalingam, P.; Davidson, E.A.; Ciais, P.; Jackson, R.B.; Janssens-Maenhout, G.; et al. A Comprehensive Quantification of Global Nitrous Oxide Sources and Sinks. Nature 2020, 586, 248–256. [Google Scholar] [CrossRef]
  71. Zheng, Z.; Luo, X.; Wei, H.; Zhao, W.; Qi, D. Analysis of the Seasonal and Interannual Variations of Air-Sea CO2 Flux in the Chukchi Sea Using A Coupled Ocean-Sea Ice-Biogeochemical Model. J. Geophys. Res. Ocean. 2021, 126, e2021JC017550. [Google Scholar] [CrossRef]
  72. Curbelo-Hernández, D.; González-Dávila, M.; González, A.G.; González-Santana, D.; Santana-Casiano, J.M. CO2 Fluxes in the Northeast Atlantic Ocean Based on Measurements from a Surface Ocean Observation Platform. Sci. Total Environ. 2021, 775, 145804. [Google Scholar] [CrossRef]
  73. Semesi, I.S.; Beer, S.; Björk, M. Seagrass Photosynthesis Controls Rates of Calcification and Photosynthesis of Calcareous Macroalgae in a Tropical Seagrass Meadow. Mar. Ecol. Prog. Ser. 2009, 382, 41–47. [Google Scholar] [CrossRef]
  74. Hofmann, L.C.; Bischof, K. Ocean Acidification Effects on Calcifying Macroalgae. Aquat. Biol. 2014, 22, 261–279. [Google Scholar] [CrossRef]
  75. Kalokora, O.J.; Buriyo, A.S.; Asplund, M.E.; Gullström, M.; Mtolera, M.S.P.; Björk, M. An Experimental Assessment of Algal Calcification as a Potential Source of Atmospheric CO2. PLoS ONE 2020, 15, e0231971. [Google Scholar] [CrossRef] [PubMed]
  76. Ismail, R.O.; Asplund, M.E.; Gullström, M.; George, R.; Dahl, M.; Buriyo, A.S.; Mtolera, M.S.P.; Björk, M. Effects of Calcification on Air-Water CO2 Fluxes in Tropical Seagrass Meadows: A Mesocosm Experiment. J. Exp. Mar. Biol. Ecol. 2023, 561, 151864. [Google Scholar] [CrossRef]
  77. Banerjee, K.; Paneerselvam, A.; Ramachandran, P.; Ganguly, D.; Singh, G.; Ramesh, R. Seagrass and Macrophyte Mediated CO2 and CH4 Dynamics in Shallow Coastal Waters. PLoS ONE 2018, 13, e0249253. [Google Scholar] [CrossRef]
  78. Cui, L.; Jiang, Z.; Huang, X.; Chen, Q.; Wu, Y.; Liu, S.; Li, J.; Macreadie, P.I. Eutrophication Reduces Seagrass Contribution to Coastal Food Webs. Ecosphere 2021, 12, e03626. [Google Scholar] [CrossRef]
  79. Duarte, C.M. Allometric Scaling of Seagrass Form and Productivity. Mar. Ecol. Prog. Ser. 1991, 77, 289–300. [Google Scholar] [CrossRef]
  80. Cebrián, J.; Duarte, C.M.; Marbà, N.; Enríquez, S. Magnitude and Fate of the Production of Four Co-Occurring Western Mediterranean Seagrass Species. Mar. Ecol. Prog. Ser. 1997, 155, 29–44. [Google Scholar] [CrossRef]
  81. Ware, J.R.; Smith, S.V.; Reaka-Kudla, M.L. Coral Reefs: Sources or Sinks of Atmospheric CO2? Coral Reefs 1991, 11, 127–130. [Google Scholar] [CrossRef]
  82. Frankignoulle, M.; Canon, C.; Gattuso, J.-P. Marine Calcification as a Source of Carbon Dioxide: Positive Feedback of Increasing Atmospheric CO2. Limnol. Oceanogr. 1994, 39, 458–462. [Google Scholar] [CrossRef]
  83. Macreadie, P.I.; Serrano, O.; Maher, D.T.; Duarte, C.M.; Beardall, J. Addressing Calcium Carbonate Cycling in Blue Carbon Accounting. Limnol. Oceanogr. Lett. 2017, 2, 195–201. [Google Scholar] [CrossRef]
  84. Chou, W.-C.; Fan, L.-F.; Hung, C.-C.; Shih, Y.-Y.; Huang, W.-J.; Lui, H.-K.; Chen, T.-Y. Dynamics of O2 and PCO2 in a Southeast Asia Seagrass Meadow: Metabolic Rates and Carbon Sink Capacity. Front. Mar. Sci. 2023, 10, 1076991. [Google Scholar] [CrossRef]
  85. Chou, W.C.; Fan, L.F.; Yang, C.C.; Chen, Y.H.; Hung, C.C.; Huang, W.J.; Shih, Y.Y.; Soong, K.; Tseng, H.C.; Gong, G.C.; et al. A Unique Diel Pattern in Carbonate Chemistry in the Seagrass Meadows of Dongsha Island: The Enhancement of Metabolic Carbonate Dissolution in a Semienclosed Lagoon. Front. Mar. Sci. 2021, 8, 717685. [Google Scholar] [CrossRef]
  86. Van Dam, B.R.; Lopes, C.C.; Polsenaere, P.; Price, R.M.; Rutgersson, A.; Fourqurean, J.W. Water Temperature Control on CO2 Flux and Evaporation over a Subtropical Seagrass Meadow Revealed by Atmospheric Eddy Covariance. Limnol. Oceanogr. 2021, 66, 510–527. [Google Scholar] [CrossRef]
  87. Saderne, V.; Geraldi, N.R.; Macreadie, P.I.; Maher, D.T.; Middelburg, J.J.; Serrano, O.; Almahasheer, H.; Arias-Ortiz, A.; Cusack, M.; Eyre, B.D.; et al. Role of Carbonate Burial in Blue Carbon Budgets. Nat. Commun. 2019, 10, 1106. [Google Scholar] [CrossRef] [PubMed]
  88. Stevenson, A.; Ó Corcora, T.C.; Hukriede, W.; Schubert, P.R.; Reusch, T.B.H. Substantial Seagrass Blue Carbon Pools in the Southwestern Baltic Sea Include Relics of Terrestrial Peatlands. Front. Mar. Sci. 2022, 9, 1–17. [Google Scholar] [CrossRef]
Figure 1. The research stations in Karimunjawa waters. The 2019 stations are indicated by stars (6 stations: vegetated and 9 stations: unvegetated). The 2020 stations are indicated by triangles (10 stations: vegetated and 5 stations: unvegetated). Meanwhile, the 2022 stations are indicated by circles (7 stations: vegetated and 7 stations: unvegetated). Seagrass and sediment carbon measurements were carried out in both 2019 and 2022, while measurements of air–sea CO2 flux were taken across the years 2019, 2020, and 2022.
Diversity 15 00978 g001
Figure 2. (A) Quadrat and (B) Sediment corer. Description: A = the length of pipe; B = the length of pipe outside the sediment; C = the length of inside pipe; D = length of sediment sample; E = depth of core (Source: [38]).
Diversity 15 00978 g002
Figure 3. OCS-Sg in Karimunjawa waters. The notation NA (%) signifies data unavailability due to the absence of certain seagrass species within the quadrat.
Diversity 15 00978 g003
Figure 4. The shrimp pond areas within the Karimunjawa waters for the years 2015 and 2021.
Diversity 15 00978 g004
Figure 5. The results of the PCA analysis conducted on carbon stock and storage in seagrass and sediments.
Diversity 15 00978 g005
Figure 6. The correlations among various variables, including CO2 fluxes, pCO2sea, SST, pCO2atm, k w a , k H , pH, and chlorophyll-a. The graphs visually represent the linear relationships between these variables along the x and y axes. Statistical significance is denoted by asterisks (*), with *, and *** indicating p-values of <0.05, and <0.001, respectively. The data points are represented as dots, which serve to display the spread of the data. A more tightly clustered distribution of data around a sloping straight line indicates a stronger correlation, whereas a broader dispersion suggests a weaker one. The correlation coefficient (Corr) and the orientation of the straight line together convey the strength and direction of the relationship between the variables. A positive Corr value, as well as a straight line that slopes upwards to the right and another that slopes downwards to the left, all indicate a positive relationship. Conversely, a negative Corr value, in conjunction with a straight line sloping downwards to the right and another sloping upwards to the left, signifies a negative relationship.
Diversity 15 00978 g006
Figure 7. (A) The correlation between OCS-S and air–sea CO2 fluxes; (B) the distribution of OCS-S per unit area; and (C) the distribution of CO2 fluxes per unit area at the study site located along the coast of Karimunjawa. The stations are labeled as follows: 22_V_K + source carbonate (depicted in purple) represents vegetated stations with additional source carbonate in 2022; 22_V_K (in blue) signifies vegetated stations in 2022; 22_UV_K (in green) represents unvegetated stations in 2022; and 19_V_K (in pink) represents vegetated stations from 2019.
Diversity 15 00978 g007
Figure 8. The state of seagrass within the Karimunjawa study area in 2022: (A) Supplementary allochthonous carbon input originating from mangroves; (B) the presence of calcifying brown algae, Padina pavonica; and (C) the existence of calcareous epiphytes and algae contributing to carbonate formation.
Diversity 15 00978 g008
Figure 9. A schematic diagram illustrating the following: (A) The presence of vegetated seagrass and alongside source carbonates (Padina pavonica, calcareous epiphytes, and allochthonous mangrove), leading to an augmentation of OCS as well as an elevated release of CO2 into the atmosphere; (B) a comparison between vegetated and unvegetated seagrass scenarios, highlighting that vegetated seagrass not only exhibits a higher capacity for storing OCS but also contributes to a comparatively lower release of CO2 into the atmosphere.
Diversity 15 00978 g009aDiversity 15 00978 g009b
Table 1. Parameters (water quality), measuring instruments, and analysis methods.
ParametersUnitProcedureTools/Methods
Temperature°CIn situ measurementThermometer and logger
pH-In situ measurementpH meter
DOmg L−1In situ measurementDO meters
CO2atmppmIn situ measurementCO2 meters
SalinityIn situ measurementRefractometer
NitrateppmLaboratory measurements (100 mL sample)Spectrophotometer/Spectrophotometry with a wavelength of 500 nm, nitraver 5 nitrate reagent powder pillow [35]
SilicateppmLaboratory measurements (100 mL sample)Spectrophotometer/Spectrophotometry with a wavelength of 452 nm, molybdate reagent powder pillows [36]
Total phosphateppmLaboratory measurements (100 mL sample)Spectrophotometer/Spectrophotometry with a wavelength of 890 nm, phosver 3 phospate reagent powder pillow [37]
Chlorophyll-amg m−3Laboratory measurements (1500 mL sample)Spectrophotometer/Spectrophotometry with a wavelength of 630, 647, 664, and 750 nm [36]
Table 2. Seagrass species, shoot density, tissue carbon content, biomass, A:B ratio, and OCS at the study sites along the coast of Karimunjawa (mean ± SE).
Study SitesSeagrass SpeciesShoot Density (Shoots m−2)Tissue Carbon Content/OCC (%)Biomass (gDW m−2)A:B RatioOCS (gCorg m−2)OCS-Sg (gCorg m−2)
AGBGAGBG AGBG
East
 Bobby
   2019 (n = 22)Ea, Th, Cr, Ho, Hu446.5 ± 172.76.5 ± 0.87.6 ± 1.02.8 ± 0.34.5 ± 0.70.7 ± 0.015.6 ± 1.424.6 ± 3.940.17 ± 4.8
   2022 (n = 32)Ea, Th, Cr, Os, Ho212.7 ± 40.24.9 ± 1.28.3 ± 1.43.6 ± 0.52.2 ± 0.51.9 ± 0.316.0 ± 2.915.2 ± 3.328.5 ± 6.2
 Pokemon
   2019 (n = 18)Ea, Th, Cr, Ho278.2 ± 85.34.9 ± 0.05.6 ± 0.01.3 ± 0.22.1 ± 0.40.5 ± 0.19.3 ± 0.514.8 ± 0.818.7 ± 3.6
  Barakuda
    2019 (n = 18)Ea, Th, Cr, Hu158.2 ± 51.25.0 ± 0.05.6 ± 0.01.4 ± 0.02.6 ± 0.20.6 ± 0.07.8 ± 0.314.4 ± 1.322.2 ± 1.4
West
  Mangrove Inn
    2019 (n = 18)Ea, Th39.6 ± 4.54.9 ± 0.05.6 ± 0.02.3 ± 0.23.8 ± 0.30.6 ± 0.113.2 ± 0.921.3 ± 1.834.5 ± 2.1
    2022 (n = 34)Ea, Th, Cr, Os, Ho74.8 ± 16.57.9 ± 1.59.7 ± 1.84.4 ± 0.43.5 ± 1.12.1 ± 0.521.1 ± 2.421.5 ± 6.643.3 ± 8.1
  Alang–Alang
    2019 (n = 22)Ea, Th, Cr, Os156.4 ± 40.15.4 ± 1.06.2 ± 1.12.1 ± 0.22.6 ± 0.20.8 ± 0.112.0 ± 1.114.6 ± 1.226.6 ± 1.8
    2022 (n = 40)Ea, Th, Cr, Os, Ho188.8 ± 33.47.8 ± 1.111.5 ± 1.84.7 ± 0.83.5 ± 0.51.3 ± 0.122.3 ± 4.820.3 ± 3.342.6 ± 6.6
  Mrican
    2019 (n = 20)Ea, Th, Cr, Os107.6 ± 12.75.4 ± 0.56.1 ± 0.61.8 ± 0.23.0 ± 0.40.6 ± 0.110.1 ± 1.116.1 ± 2.126.1 ± 2.7
  Cemara Kecil
    2022 (n = 18)Th205.2 ± 29.04.5 ± 0.55.3 ± 0.61.6 ± 0.31.7 ± 0.20.9 ± 0.210.2 ± 1.410.8 ± 0.518.9 ± 2.4
North
  Lendra
    2022 (n = 36)Ea, Th, Cr, Os, Ho250 ± 35.09.2 ± 1.010.4 ± 1.23.1 ± 0.53.3 ± 0.40.9 ± 0.118.4 ± 3.519.3 ± 2.337.7 ± 5.2
South
  Pelabuhan
    2022 (n = 46)Ea, Th, Cr, Ho, Si339.7 ± 37.98.2 ± 0.99.2 ± 1.04.3 ± 0.62.7 ± 0.31.7 ± 0.226.7 ± 3.416.0 ± 1.842.7 ± 4.8
  Menjangan kecil
    2022 (n = 63)Ea, Th, Cr, Os, Ho273.6 ± 28.99.2 ± 1.311.0 ± 1.53.9 ± 0.64.1 ± 0.50.9 ± 0.118.8 ± 3.522.0 ± 3.041.0 ± 6.1
Table 3. OCS-S at the study sites along the coast of Karimunjawa (mean ± SE).
Study SitesWater Content (%)Dry Bulk Density
(g cm−3)
%LOISOCC (%)OCS-S (gCorg m−2)
East
  Bobby
   2019 (vegetated; n = 9)18.7 ± 0.80.0051 ± 0.000523.0 ± 0.79.5 ± 0.339.9 ± 0.9
   2022 (vegetated; n = 12)22.7 ± 1.70.0048 ± 0.000428.7 ± 1.712.0 ± 0.747.3 ± 1.7
   2022 (unvegetated; n = 2)41.7 ± 8.40.0047 ± 0.000634.7 ± 1.914.6 ± 0.837.8 ± 3.6
  Pokemon
   2019 (vegetated; n = 9)15.8 ± 0.60.0053 ± 0.000520.0 ± 0.78.3 ± 0.335.3 ± 1.0
  Barakuda
   2019 (vegetated; n = 9)15.0 ± 0.70.0049 ± 0.000219.5 ± 0.78.0 ± 0.334.8 ± 1.0
West
  Mangrove Inn
   2019 (vegetated; n = 9)21.1 ± 0.80.0035 ± 0.000225.3 ± 0.810.6 ± 0.442.3 ± 1.0
   2022 (vegetated; n = 10)19.0 ± 1.40.0036 ± 0.000236.0 ± 5.215.2 ± 2.263.6 ± 10.4
   2022 (unvegetated; n = 2)16.3 ± 2.20.0070 ± 0.000227.4 ± 0.111.4 ± 0.048.8 ± 1.1
  Alang–Alang
   2019 (vegetated; n = 9)17.8 ± 1.10.0043 ± 0.000422.0 ± 1.19.1 ± 0.538.1 ± 0.3
   2022 (vegetated; n = 10)18.6 ± 1.20.0041 ± 0.000427.0 ± 1.611.3 ± 0.747.1 ± 3.3
   2022 (unvegetated; n = 2)14.1 ± 0.40.0072 ± 0.000022.6 ± 0.39.4 ± 0.141.2 ± 0.3
  Mrican
   2019 (vegetated; n = 9)11.1 ± 1.70.0046 ± 0.000413.7 ± 1.85.6 ± 0.824.7 ± 2.9
  Cemara Kecil
   2022 (vegetated; n = 10)31.9 ± 3.50.0033 ± 0.000433.2 ± 3.313.9 ± 1.448.2 ± 4.8
   2022 (unvegetated; n = 2)21.6 ± 0.60.0059 ± 0.000617.9 ± 2.27.4 ± 0.929.5 ± 3.9
North
  Lendra
   2022 (vegetated; n = 10)19.6 ± 1.30.0046 ± 0.000231.7 ± 1.413.3 ± 0.654.6 ± 3.0
   2022 (unvegetated; n = 2)21.1 ± 1.90.0048 ± 0.00009.7 ± 3.43.8 ± 1.515.7 ± 6.3
South
  Pelabuhan
   2022 (vegetated; n = 15)16.5 ± 1.00.0045 ± 0.000322.1 ± 1.09.2 ± 0.438.9 ± 1.8
   2022 (unvegetated; n = 2)25.0 ± 2.70.0063 ± 0.000320.2 ± 2.28.3 ± 0.931.8 ± 2.5
  Menjangan kecil
   2022 (vegetated; n = 15)27.3 ± 2.60.0039 ± 0.000426.7 ± 1.211.1 ± 0.541.1 ± 2.4
   2022 (unvegetated; n = 2)27.0 ± 0.70.0061 ± 0.000027.4 ± 0.26.9 ± 0.125.6 ± 0.0
Disclaimer/Publisher’s Note: The statements, opinions and data contained in all publications are solely those of the individual author(s) and contributor(s) and not of MDPI and/or the editor(s). MDPI and/or the editor(s) disclaim responsibility for any injury to people or property resulting from any ideas, methods, instructions or products referred to in the content.

